Abstract
Smart building applications require robust security measures to ensure system functionality, privacy, and security. To this end, this paper proposes a Federated Learning Intrusion Detection System (FL-IDS) composed of two convolutional neural network (CNN) models to detect network and IoT device attacks simultaneously. Collaborative training across multiple cooperative smart buildings enables model development without direct data sharing, ensuring privacy by design. Furthermore, the design of the proposed method considers three key principles: sustainability, adaptability, and trustworthiness. The proposed data pre-processing and engineering system significantly reduces the amount of data to be processed by the CNN, helping to limit the processing load and associated energy consumption towards more sustainable Artificial Intelligence (AI) techniques. Furthermore, the data engineering process, which includes sampling, feature extraction, and transformation of data into images, is designed considering its adaptability to integrate new sensor data and to fit seamlessly into a zero-touch system, following the principles of Machine Learning Operations (MLOps). The designed CNNs allow for the investigation of AI reasoning, implementing eXplainable AI (XAI) techniques such as the correlation map analyzed in this paper. Using the ToN-IoT dataset, the results show that the proposed FL-IDS achieves performance comparable to that of its centralized counterpart. To address the specific vulnerabilities of FL, a secure and robust aggregation method is introduced, making the system resistant to poisoning attacks from up to of the participating clients.
1. Introduction
Smart buildings are a significant step toward creating more efficient, sustainable, and user-friendly living and working environments. The term “smart building” is distinct from “automated building” due to its emphasis on the “intelligence quotient” [1]. A reference model for analyzing these systems is presented in [2], depicting a building equipped with sensors, actuators, smart devices, control entities, and user interfaces. The smart building ecosystem integrates IoT devices, local or cloud-based control systems, and user interfaces for manual control and status monitoring. These advanced ecosystems interconnect every device, from lighting to Heating, Ventilation, and Air Conditioning (HVAC) systems, creating a seamless and intuitive experience for users. This integration provides high levels of comfort and energy efficiency, indicating a future where buildings adapt to our needs and anticipate them. The integration of diverse technologies originally designed for specialized environments—such as industrial control and medical applications—into a consumer landscape introduces new risks and vulnerabilities. Attack vectors emerge from communication media, control software, and supply chains. Communication protocols like Wi-Fi, ZigBee, Z-Wave, and legacy systems such as BACnet and Modbus are vulnerable to attacks, including Man in The Middle (MITM), replay, and SYN flooding, due to weak encryption and authentication [3,4]. Control software, reliant on third-party apps, as well as operating systems, firmware, and automation tools, faces threats like privilege escalation, Remote Code Execution (RCE), and firmware tampering [4]. Device-dependent vulnerabilities, such as sensory channel manipulation and supply chain risks, further exacerbate security challenges [3]. Attacks can have both cyber impact (e.g., breaches of confidentiality, integrity, and availability) and physical impact (e.g., unauthorized actuation, denial of service, and privacy violations), highlighting the need for robust, tailored security measures [3].
To address these challenges, we introduced a preliminary analysis of a centralized multi-layer Intrusion Detection System (IDS) for smart buildings in [5]. Building on this work, this paper proposes a novel approach by designing and developing a distributed, privacy-preserving artificial intelligence (AI) system for intrusion detection. The solution is driven by Federated Learning (FL), a state-of-the-art approach for training accurate ML models using data from different sources without sharing them. This allows for the preservation of the confidentiality of user information, which is extremely critical in smart building scenarios where personal and sensitive data are involved. Unlike traditional AI models that rely on centralized data processing, FL decentralizes the learning process, allowing data to remain on local systems. This feature not only significantly mitigates the risks associated with data transmission and storage but also ensures privacy by design. This approach meets the growing demand for privacy-aware technologies by providing a way to bridge the benefits of smart buildings with the need to protect personal privacy. This paper also looks ahead to the upcoming evolution of network technologies—in particular, the transition to 6th Generation (6G) networks. With the advent of 6G, AI solutions will be increasingly deployed at the edge of networks, further decentralizing data processing and decision making. This shift brings new requirements for AI systems, including minimal overhead, sustainability, and the implementation of zero-touch operations for Machine Learning Operations (MLOps).
Paper Contribution
This paper proposes an IDS for providing security and privacy in smart buildings that simultaneously considers both network and sensor data. By incorporating FL-driven, anomaly-based techniques, the proposed method is future-proof and aligned with emerging 6G requirements. In particular, the main contributions of this paper can be summarized as follows.
- Development of a lightweight FL solution that minimizes computational and energy overhead, supporting the sustainability goals of 6G networks;
- Integration of zero-touch automation compatibility, enabling seamless incorporation into MLOps processes for continuous learning and adaptation without manual intervention;
- Establishment of a trusted AI framework, securing the AI solution against current and future cybersecurity threats, thereby safeguarding system integrity;
- Emphasis on developing eXplainable AI (XAI) models that provide clear, human-understandable explanations for AI decisions, thereby improving user confidence in the AI system, which is crucial for human-centered applications like smart buildings.
This paper is organized as follows. The background on FL is presented in Section 2, while Section 3 summarizes the related work. Section 4 introduces the proposed architecture, while Section 5 provides a comprehensive review of the dataset used in the simulation analysis. Section 6 and Section 7 present the design and development of the FL-enabled IDS for smart buildings, respectively, starting from the data pre-processing and engineering system. Section 8 presents the performance evaluation of FL-enabled IDS using benchmarks initially established in a centralized context, while Section 9 discusses the results obtained for mitigating poisoning attacks against the presented system. Section 10 presents the conclusions of the paper.
2. Background on Federated Learning
FL is an ML setting where multiple entities (clients) collaborate to solve a problem under the coordination of a central server or service provider. Each client’s raw data are stored locally and not exchanged or transferred. Focused updates intended for immediate aggregation are used to achieve the learning objective. These updates are narrowly scoped to contain the minimum information necessary for the specific learning task. Aggregation is performed as early as possible at the centralized point; this is the main difference between FL and fully decentralized peer-to-peer (P2P) learning methods, where aggregation is not performed at all [6]. Two main variants of FL exist: cross-device and cross-silo FL. The first variant is distinguished by a considerable number of clients, reaching up to . At any given moment, only a subset of the clients is accessible, and direct indexing of the clients is not feasible. Cross-silo FL is constituted by a limited number of disparate organizations (up to ). All clients are consistently accessible, and each is identified by a unique name that enables direct system access. In both settings, data are generated locally and remain decentralized: a central Orchestration Service/Server (OSS) organizes the training but never sees the raw data produced by the clients.
There exist two main variants of data distribution across the clients: horizontal and vertical distributions. In the case of horizontal FL, also called homogeneous FL, user training data share the same feature space but have a different sample space (e.g., captures of CCTV across different buildings). In the vertical FL variant, known as heterogeneous FL, user training data share the same sample space but have a diverse feature space (e.g., personal data of customers shared by different companies, each having a subset of features).
One of the most prominent domains where FL has been adopted is healthcare, largely due to its intrinsic capacity to safeguard privacy. For instance, FL setting have been considered for COVID-19 detections [7] and cancer diagnoses [8].
2.1. Federated Training Process
The federated training (FT) process is performed by the OSS, which orchestrates the entire training by repeating the following steps until it is considered successful:
- Client selection: The OSS samples from a set of clients meeting eligibility criteria. In cross-device settings, the criteria are about connectivity (e.g., a device participates only if it is under Wi-Fi connectivity) and power (e.g., a device participates only if it is connected to a power supply). In the cross-silo setting, usually, all the clients participate in the training process.
- Broadcasting: The clients that will participate in the training process download the current model weights and the training program from the OSS.
- Client computation: Each client locally trains the model on its data and computes the new weights for the model.
- Aggregation: The OSS collects the produced models and aggregates them. This stage is crucial for security and performance improvement.
- Model update: The OSS locally updates the shared model based on the aggregated update computed in the previous step.
After the model update, each client is ready to retrieve an updated version of the model from the OSS. This training process is formalized by the FedAvg algorithm [9], whose pseudocodes of the procedure of FT in the OSS and the client update are shown in Algorithms 1 and 2, respectively. In these algorithms, K is the total number of clients, B is the size of mini-batches, T is the total number of communication rounds, E is the local training epochs, and is the learning rate.
| Algorithm 1 Procedure of OSS Federated Training |
Initialize global model for do Select clients, where for all in parallel do Download to Client k Client k performs update and returns end for Update global model: end for |
| Algorithm 2 Procedure of Client Update |
Input: Global model at time t () Output: Updated model of client k () Replace local model: for local epoch to E do for batch to B do end for end for Return |
2.2. Handling Non-IID Data
In FL, the training data of each client are highly dependent on the usage patterns of specific local devices, leading to potentially significant differences in data distribution across connected clients. This phenomenon, known as “Non-independent and identically distributed data” (non-IID), can result in severe model divergence [10,11]. For each data sample, x indicates the input attribute or features, and is the local distribution of x for client k. We can formally define non-IID as the variation of across all the clients. There are different categories of non-IID data (see [10,11]).
Among these categories, the label distribution skew may cause severe learning divergence for parametric models such as Deep Neural Networks (DNNs), mainly in a horizontal FL setting [11]. The label distribution skew can be attributed to the sharing of a conditional feature distribution, represented by the function expressed as , among the clients. This phenomenon is typically attributable to discrepancies in the geographical locations of clients that store analogous types of local training data.
The FedAvg algorithm cannot deal with model divergence problems caused by non-IID data, especially when complex models such as neural networks are used. Current approaches to counter the impact of non-IID data can be classified into data-based, algorithm-based, and system-based approaches [10].
3. Related Work
The growing prevalence of IoT devices in smart buildings underscores the need for robust security measures, driving research into effective IDS, including their evolution from centralized architectures to FL approaches and beyond.
3.1. IDSs for Smart Buildings
In the context of smart buildings, the deployment of Machine Learning-based Intrusion Detection Systems (ML-IDSs) is particularly advantageous due to the complex and dynamic environment inherent to these ecosystems. Traditional signature-based IDSs and rule-based approaches, while effective in certain scenarios, are often insufficient for the high volume of interactions and evolving threats characteristic of smart buildings. ML-IDSs, on the other hand, are capable of adapting to and learning from the system’s behavior, providing a more robust solution that can detect novel and sophisticated threats without requiring constant updates [12].
The implementation of ML-IDSs in smart buildings typically follows a centralized framework, which involves four key stages: data collection, pre-processing, learning, and interpretation [13]. Data are gathered from various sources, cleaned, and pre-processed to enhance their suitability for ML model training. The centralized approach allows for tailored pre-processing, which optimizes the learning process by ensuring that the model is attuned to the specific characteristics of the dataset. However, the model development and pre-processing tasks are often outsourced rather than conducted on-site within the smart buildings. This practice necessitates secure data transmission to external entities to prevent interception and tampering during transit.
While this centralized approach facilitates effective ML model training, it introduces challenges related to data privacy, latency in model updates, and potential transmission bottlenecks. Consequently, it is essential to implement robust data management and security protocols to safeguard the integrity and confidentiality of data when deploying ML-based IDSs in smart buildings. These measures are critical to addressing the vulnerabilities that arise from the off-site development of ML models and ensuring the reliable operation of IDSs in these highly interconnected environments.
By integrating the Intelligence of Everything (IoE) paradigm, the advent of 6G technology will significantly enhance the capabilities of ML-IDSs in smart buildings. This paradigm shift envisions the deployment of AI models at the edge of the network, improving efficiency, reducing latency, and improving data confidentiality [14]. To fully realize these benefits, it is crucial to automate data pre-processing and decentralize the learning process.
In this context, FL emerges as a key enabler that allows ML models to be trained on data distributed across multiple devices and buildings while preserving data privacy [6,15]. This decentralized approach marks a transition towards more secure and resilient ML-IDSs, addressing the challenges of data privacy and security arising in centralized models. Furthermore, the adoption of machine learning operations (MLOps) with a zero-touch architecture further automates the management of ML models, facilitating their seamless integration and continuous evolution within smart building security systems [16].
3.2. Threats, Attacks, and Countermeasures in FL
FL integrates distributed machine learning with privacy but introduces increased risks due to client diversity, complexity, and lack of mutual trust. Compared to centralized ML, FL’s attack surface is significantly larger if not properly implemented. To address these risks, a threat analysis framework for FL, divided into three phases—data and behavior auditing, training, and prediction—is employed. Each phase presents distinct security challenges, requiring targeted measures to ensure a trusted FL environment [17].
3.2.1. Data and Behavior Auditing Phase
FL performance relies on the quality of local data and the benign behavior of both workers and the central server. Poor data quality or malicious data poisoning activity can undermine the algorithm’s efficiency. However, since each worker fully owns and controls their data, auditing for data quality and historical behavior is challenging. This allows malicious nodes to potentially alter or forge training data, compromising the model. FL is also vulnerable to various attacks, including social engineering, backdoor attacks, and Advanced Persistent Threats (APTs), particularly in cross-device scenarios where vulnerabilities can be exploited to poison data and the global model. Environmental factors during data collection and transmission may also impact data integrity. Traditional defenses like data quality audits are difficult to implement in FL due to data privacy rules. Instead, maintaining a historical behavior list of nodes and removing corrupted ones from training, alongside dynamically evaluation of model quality, can help mitigate these risks [18].
3.2.2. Training and Prediction Phase
The FL training phase is vulnerable to two main types of attacks: poisoning attacks, which aim to disrupt the model’s availability, and privacy inference attacks, which seek to extract sensitive information about the dataset and compromise the confidentiality of the FL system.
Poisoning attacks can target both the model and the data. Model poisoning typically degrades model performance, while data poisoning might be mitigated by the learning algorithm, such as through gradient shaping techniques [19]). The threat model involves adversaries manipulating local workers to alter model updates, with the extent of manipulation affecting the attack’s success. Attacks can be either targeted, such as backdoor attacks, or non-targeted, like Byzantine attacks, including variants like the free-riding attack, where workers contribute minimally or provide irrelevant updates [20]. Defenses include robust aggregation, where the central server verifies the global model’s performance to detect potential poisoning and compares updates across workers to identify anomalies [21].
Privacy inference attacks exploit the FL framework in which gradients and parameters are exchanged between local workers and the central server, allowing for white-box attacks. The threat model considers vulnerabilities at both the worker and server levels, as well as in communication channels. Key attack types include membership inference, aiming to determine whether specific data were used in training [22]; class representative inference, which seeks to obtain prototypical samples of a target label [23]; property inference, targeting meta-characteristics of training data [24]; and data reconstruction, aiming to accurately reconstruct training samples and labels [25]. Defenses focus on processing shared gradient information, such as compressing gradients to reduce exposure [26], using homomorphic encryption to protect data during computation [27], and applying differential privacy by adding controlled noise to gradients [28].
In the model prediction phase, the global model is accessible to both local workers and the central server, creating potential vulnerabilities. Malicious actors, whether a local worker or the server, can attempt to extract sensitive information from the global model, leading to two primary types of attacks: evasion attacks and privacy inference attacks. The threat model, attack strategies, and defense mechanisms in this phase are consistent with those of centralized ML, as the post-training environment mirrors this setting [29].
3.3. FL-IDS
Several studies have explored the application of FL for intrusion detection. For instance, Sater and al. proposed a federated deep learning model based on a recurrent neural network architecture for anomaly detection in smart buildings, demonstrating faster training convergence compared to centralized counterparts [30]. Similarly, other research efforts have focused on developing FL-based intrusion detection systems for various IoT environments [31,32,33]. These FL-IDSs allow individual devices (e.g., Unmanned Aerial Vehicles (UAVs) in a flying ad hoc network) to train a global intrusion detection model collaboratively without sharing raw, sensitive data [34]. This approach not only addresses privacy concerns inherent in centralized methods but also decreases communication costs, which is crucial in networks with frequent link breakages. Mazid et al. [35] proposed a proactive intrusion recognition method called FL-IDPP (Federated Learning Intrusion Detection with Privacy Preservation), which ensures privacy preservation for IoT networks. FL-IDPP employs bidirectional recurrent neural network (RNN) models to detect anomalies and identify potential intrusions. Data privacy and network efficiency are maintained by storing data locally on IoT devices and only sharing the learned model weights with the central server for FL. The method achieves high accuracy for the global ML model by incorporating a voting ensemble process to combine updates from multiple sources.
In critical infrastructure, FL-IDSs often address specific data distribution scenarios, such as vertically partitioned data, where clients share different attributes about the same samples. Frameworks like FATE have been utilized to implement FL algorithms for intrusion detection in such scenarios [36].
Research has also focused on enhancing the security and robustness of FL-IDSs. Defenses against poisoning attacks, which aim to compromise the global model by injecting malicious updates, are crucial for ensuring the trustworthiness of FL-IDS. Secure aggregation techniques can provide strong privacy guarantees but may introduce additional computational overhead and complexity. The integration of XAI techniques into FL-IDS designs allows for the investigation of AI reasoning, providing insights into the decision-making process of the models. Indeed, XAI enhances transparency for ML-based IDSs, especially when dealing with black-box IDS models [37].
One approach combines FL with mimic learning to better preserve the privacy of end users, achieving performance to close to that of centralized deep learning while significantly improving privacy preservation [38]. Another enhancement involves a federated blending model (F-BIDS, Federated-Blending based Intrusion Detection System) to reduce reverse engineering attacks on the FL training process [39]. In F-BIDS, base classifiers are trained locally, and a meta-classifier is incorporated into the FL framework to further enhance data privacy.
Moreover, lightweight FL solutions that minimize computational and energy overhead have become increasingly important, especially with the sustainability goals of 6G networks. The integration of zero-touch automation compatibility and the establishment of trusted AI frameworks are critical for securing AI solutions against current and future cybersecurity threats.
While existing works have made significant contributions to the field, this paper builds upon existing research by proposing an FL-IDS to provide security and privacy in smart buildings that simultaneously considers both network data and sensor data. The proposed method incorporates FL-driven anomaly-based techniques, integrating zero-touch automation and establishing a trusted AI framework with XAI to enhance user confidence and ensure system integrity.
4. The Proposed FL-IDS Architecture
The overall system architecture, as shown in Figure 1, comprises several smart buildings cooperating in a federated learning scenario. A server denoted as FL-Server coordinates the FL training of multiple clients, validates the derived global models using a validation dataset, and applies countermeasures to deal with malicious clients. The client, FL-Client, participates in FL training to build a global machine learning model without directly sharing its data, which are produced and processed locally.
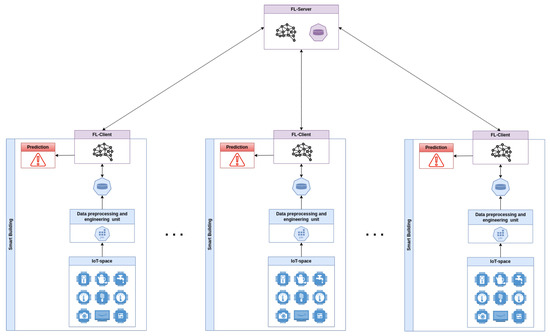
Figure 1.
Overall system architecture.
Considering a single smart building element of the architecture shown in Figure 1, the FL-Client is part of a system composed of four disjoint modules. The IoT space represents the cyber space of the smart building. It comprises all the IoT devices and the network modules needed to enable the smart building’s capabilities. In particular, this component collects the raw data. The data pre-processing and engineering unit is tasked with the responsibility of converting raw data into a format that is suitable for machine learning. The objective is to clean and compress a substantial quantity of data without the need for human intervention. The zero-touch principle is employed to facilitate seamless integration into MLOps systems. The data storage unit stores both the converted data, which are ready for inference, and the labeled data generated by the inference. The labeled data are stored to enable the smart building to contribute to future federated training. The FL-Client represents the AI component of the system. The FL-Client is responsible for storing the model that is utilized for prediction, which is distributed by the FL-Server. This component makes predictions over the smart building data, generates alerts, and stores the labeled data. Additionally, the model’s predictions can be analyzed alongside information generated by the data pre-processing and engineering unit to enable human verification of the AI’s inference results.
5. Network and IoT Datasets for Smart Buildings
The dataset analysis for evaluation of the performance of the proposed method focuses on its ability to accurately represent features relevant to the smart building context. This includes the integration of various IoT devices and network traffic patterns that closely mimic real-world smart building environments. The considered datasets are CIC-IoT [40], Aposemat IoT [41], and ToN-IoT [42]. All datasets contain a significant amount of both malicious and non-malicious traffic and provide full data capture in raw pcap format.
Among these, the ToN-IoT dataset was selected for several reasons. The ToN-IoT dataset is the only one that provides sensor data. This feature is important in the considered system, developed for jointly considering both network and sensor data. This approach adds a new layer of detection to the smart building cyber space and could be exploited to detect attacks that are not only network-based, such as the jamming of a sensor. It should be noted that the ToN-IoT dataset may include less realistic IoT devices, given that they are simulated. However, while the CIC-IoT and Aposemat datasets offer a more comprehensive list of IoT devices, they lack sensor data from these devices.
ToN-IoT
The ToN-IoT dataset provides data from three heterogeneous domains: telemetry, Operating System (OS), and network domains. IoT sensors are responsible for gathering and transmitting telemetry data. The other kinds of data are obtained from OS logs and by measuring network traffic.
The primary innovation of this dataset is its integration of three distinct data sources to comprehensively document the intricate progression of cyber attacks, from their initial stages to their ultimate consequences. The testbed includes a full architecture consisting of cloud services, a fog layer, and an edge layer where simulated IoT devices are located. The report shows that attacks are carried out using complete systems (Kali machines), and for each type of attack, the used tool is reported [42]. The available attacks and their implementations are described in the following.
- Backdoor: Utilizing Metasploit with the persistence option enabled, a backdoor is established within the target system, allowing unauthorized access to persist, even after the system reboots [43].
- DoS (Denial of Service): Scapy is employed to craft Python scripts designed to launch DoS attacks against vulnerable devices, rendering them inaccessible to legitimate users [44].
- DDoS (Distributed Denial of Service): Automation is achieved using Ufonet to develop bash scripts capable of orchestrating large-scale DDoS attacks, overwhelming target networks or servers with malicious traffic [45].
- Injection: Various injection techniques, including SQL injection and exploitation of broken authentication mechanisms, are executed against Web applications, aiming to compromise their integrity or gain unauthorized access.
- MITM: Through the use of Ettercap, ARP spoofing, ICMP redirection, port stealing, and DHCP spoofing are carried out, enabling interception and manipulation of communication between targeted devices [46].
- Scanning: Employing Nessus and Nmap, extensive scanning is conducted across a range of addresses, identifying potential vulnerabilities within systems or networks for exploitation [47,48].
- Ransomware: Leveraging Metasploit, malicious payloads are executed on Windows systems to deploy ransomware, encrypting critical files and demanding ransom for decryption keys [43].
- Password Attacks: Hydra and Cewl are configured to simultaneously launch password attacks, brute-forcing login credentials or generating custom word lists based on Web content to enhance the effectiveness of the attack [49,50].
- XSS (Cross-Site Scripting): XSSer is utilized to inject malicious Bash code into vulnerable Web applications, exploiting client-side vulnerabilities to execute unauthorized commands or steal sensitive information [51].
The testbed integrates edge, fog, and cloud layers. Edge computing handles IoT device management, using NSX-VMware for virtual machine (VM) management. Fog computing uses the same technology to provide computing and analytics close to data sources, extending Software-Defined Networking (SDN), Network Function Virtualization (NVF), and Service Orchestration (SO) capabilities. The cloud layer extends services for data analytics and Internet of Things (IoT) and Industrial IoT (IIoT) service interaction, facilitated by public platforms such as HIVE MQTT. Core technologies include SDN for dynamic network configuration, NVF for hardware virtualization, and SO for operational efficiency. The elements of each layer are listed as follows:
- Edge Layer:
- –
- vSphere System
- –
- NSX VMware Server
- –
- Router
- –
- IoT/IIoT sensors
- –
- Smart devices (two iPhones, smart TV)
- Virtualization of Fog Layer:
- –
- Windows VMs
- –
- Orchestrated Server—Ubuntu
- –
- Metasploitable3 VM
- –
- DVWA Service
- –
- OWASP Shepherd VM
- –
- Middleware Server—Ubuntu
- –
- Offensive Systems—KALI
- –
- Security Onion VM
- –
- Virtual Switch
- Cloud Layer:
- –
- Hive-MQTT broker
- –
- Vulnerable PHP website
- –
- Cloud centers (DHCP services)
An important aspect to highlight is the simulation of IoT sensors at the edge, where scripts are used to emulate sensor behavior. As a result, the telemetry collected from the edge is representative of the simulated sensor data. While this approach increases the flexibility of the system and facilitates the ability to readily integrate additional telemetry data in the future, it inevitably deviates from real-world data accuracy.
For feature extraction, tools like Netsniff-ng [52] are used to monitor network traffic on the security VM. Telemetry data are collected on the same machine and converted directly to csv format. OS data are collected as logs from all VMs in the fog layer. No additional pre-processing is necessary for telemetry and OS data. Conversely, it is essential to extract network flow features from the raw pcap capture. To this end, the Zeek tool [53] is used. It is important to note that all data have two distinct labels: a binary label indicating whether the system is under attack or not and a categorical label indicating the type of attack (or “normal” in the case of non-malicious traffic). Labels are assigned based on the source IP address and timestamp to determine the execution of the attack. The OS feature descriptions are not included, as they are standard entries in an OS log file and are not unique like the other features in this dataset.
Table 1 presents the network features with brief descriptions, while Table 2 describes the sensor features. For simplicity, this table excludes common features such as date, time, and label.

Table 1.
Description of ToN-IoT network features.
Table 2.
IoT Sensor features and descriptions.
As previously stated, the features are emulated through scripting, and all sensor values, along with the corresponding date and time, are transmitted over a dedicated MQTT topic for that particular sensor.
6. Data Pre-Processing and Engineering Module
The design of this module is based on three diverse principles: adaptability, MLOps with zero-touch, and sustainability. Concerning the adaptability principle, the selection and design of tools and frameworks were determined with the objective of developing a comprehensive data engineering chain capable of transforming raw network and sensor data. This implies that the module can theoretically convert all pcap and sensor data into a format compatible with machine learning.
Furthermore, the module was carefully designed and developed to fit seamlessly into an MLOps pipeline. The entire data engineering process operates autonomously, requiring no human intervention or customization to generate and deliver data. This key attribute is essential for integration into zero-touch systems, aligning perfectly with the principles of MLOps.
In line with the goals of 6G systems, the data engineering process is intentionally designed to address AI sustainability challenges. The compression of input data permits the storage and elaboration of a reduced amount of data, with a concomitant reduction in energy consumption and support for resource-constrained devices.
The network and sensor data are processed using the same pipeline, which consists of encoding, sampling, and image conversion. However, the sensor data are in csv format and ready to be processed, while the network data require an extra step: extracting network features from the raw pcap format. The Zeek tool is employed for the extraction of the features delineated in Table 1 for this objective. This approach was compared with the strategy used in the CIC-IoT dataset, which is based on DPKT. The DPKT strategy necessitates human involvement for the customization of extracted features, whereas the aforementioned approach, based on the Zeek tool, does not require such intervention.
6.1. Network Feature Extraction
The Zeek tool is integrated into the system using the docker files available on the Zeek Community website [54]. The tool requires the configuration of the input and output directories. The input directory contains the raw pcap data, which are converted into nine .log files stored in the output directory. Each .log file contains particular traffic flow information. The set of available information and relative descriptions are presented as follows.
- conn.log: Information about each network connection observed by Zeek, including source and destination IP addresses, ports, timestamps, and the connection state;
- dns.log: DNS activity observed by Zeek, including DNS queries and responses, along with relevant metadata such as the query type, response code, and DNS transaction IDs;
- files.log: Information about files transferred over the network, including file metadata such as file hashes, file sizes, MIME types, and file paths;
- http.log: HTTP activity, including HTTP requests and responses, along with details such as user agents, referrers, HTTP methods, status codes, and URIs;
- ntp.log: Information related to Network Time Protocol (NTP) activity, including NTP requests and responses, along with timestamps and NTP modes;
- packet_filter.log: Logs packet filtering activity, providing details about packets that have been filtered based on defined packet filter rules;
- ssl.log: Secure Sockets Layer (SSL) and Transport Layer Security (TLS) activity observed by Zeek, including SSL handshakes, certificates, cipher suites, and SSL/TLS versions;
- weird.log: Contains logs of unusual or unexpected network activity that may indicate potential security issues or anomalies detected by Zeek;
- X509.log: Logs details about X.509 certificates observed in SSL/TLS handshakes, including certificate subject and issuer information, validity periods, and certificate extensions.
To extract the information reported in Table 1 from these nine .log files and unify it into a single csv file, a Python script is used. The script accesses the log files, extracts the relevant information for each packet based on the ID, renames it according to Table 1, and saves it in a single csv file. For each packet, all the information from the relevant protocols is reported, if available.
6.2. Data Pre-Processing
The data pre-processing phase is minimal and primarily focused on data formatting. Unlike traditional data pre-processing phases, this approach follows the principles of adaptability and zero-touch automation. This ensures that the pre-processing stage remains flexible enough to accommodate diverse datasets without requiring human intervention. Pre-processing was implemented as a Python script that takes as input the csv files of the six sensors (GPS, fridge, weather, thermostat, garage door, and motion light) and the csv file of the network features extracted by Zeek. As illustrated in Figure 2, the pre-processing operation is composed of steps, the specific nature of which is contingent upon whether the data originate from a sensor or the network.
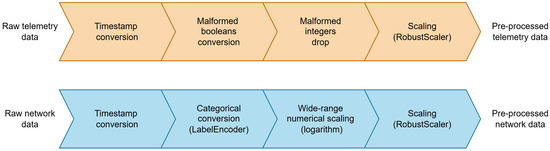
Figure 2.
Data pre-processing steps.
The sensor data are numerical (e.g., temperature of the fridge) or boolean (e.g., phone signal of the garage door). The only data pre-processing step involves the spotting and formatting of malformed data as follows.
- For boolean features, malformed values, such as “False”, “false”, “f”, “True”, “true”, and “t”, are converted into a common binary representation (0,1).
- For numerical features, malformed values such as strings are dropped.
Network data are both categorical (e.g., HTTP methods) and numerical (e.g., connection duration). The related operations are described as follows.
- Categorical features are converted into integer features using a custom label encoder [55], which iterates and collects all the possible values for a particular feature to create a string:int mapping, which is used for conversion. The different mappings are kept in a file (mapping.txt) that can be accessed to load the label encoders and use them in the future to convert other data while keeping the mapping.
- For numerical features, malformed values such as strings are dropped, and wide-range values (e.g., duration, bytes, pkts) are converted to logarithm scale to be efficiently represented in a narrower range of values.
A common pre-processing phase is the conversion of the date:time pair in the sensor data and the timestamp (UNIX) of the network data into a common timestamp “YYYY/MM/DD hh:mm:ss” format.
After these steps, all the data are scaled with a robust scaler [56], which scales the data by removing the median and scaling according to the quantile range, preserving outliers.
The IDS is designed with the strategic decision to adopt a binary labeling approach for the sensors. This approach enables the IDS to function effectively as an anomaly detection system, focusing on the identification of deviations from normal behavior within the sensor data streams. In contrast, the network-based component of the IDS has a broader scope, encompassing six of the eight types of attacks present in the ToN-IoT dataset. This decision was based on an automated examination of the dataset, which revealed significant differences in the number of packets across the various attack categories and excluded the unbalanced attack instances. As can be observed in Table 3, the instances of MITM and ransomware are significantly lower than those of other attacks. While the decision to exclude unbalanced instances diminishes the overall robustness and applicability of the developed IDS, this approach was adopted to concentrate the experimental efforts on the development of a general data engineering unit that is not specifically tailored to the ToN-IoT dataset. It is important to note that several state-of-the-art techniques, such as the Synthetic Minority Over-sampling Technique (SMOTE) [57] and generative models like Generative Adversarial Networks (GANs) [58], could have been employed to address this issue. This will be the focus of future work aimed at enhancing the capabilities of the data engineering unit.
Table 3.
Network attack distribution.
In summary, Figure 2 shows the network feature extraction process delineated in Section 6.1 and the data pre-processing process described in Section 6.2. The figure shows a timed job that executes feature extraction using Zeek and aggregation and pre-processing using a Python script. The job generates both sensor and network data in csv format at regular intervals, as specified by the <OFFSET> parameter.
6.3. Data Sampling
To achieve the sustainability goal of the developed scheme, a strategy for sampling the network and the sensor data output by the pre-processing scheme was defined. The goal of the sampling procedure is to reduce the amount of data that each client needs to store in a decentralized environment. This reduction in storage requirements is in line with the sustainability goal. Furthermore, sampling reduces the amount of data that the algorithm needs to infer, resulting in lower overhead for prediction. This approach differs from the conventional methodology employed in evaluations conducted on the ToN-IoT dataset, wherein each packet is treated as a discrete instance for training or prediction purposes. The considered sampling strategy is based on a rolling 10-s window with a 5-s offset. These two values were selected to align with the data extraction and pre-processing offset. This characteristic permits direct sampling of the pre-converted data. The final stage of the proposed methodology considers the extraction of novel data and metrics for each feature within a specified temporal window, relative to the selected time frame. This last stage is denoted as “aggregation”. Sampling and aggregation are implemented using the resample and aggregate Pandas tools [59,60]. The method of aggregation depends on the characteristics of the feature under consideration. In the case of numeric features, three new metrics are extracted from the feature values within the specified time window: minimum, maximum, and mean. In the case of (ex) categorical, three new metrics are extracted from the feature values within the specified time window: the most frequent, second most frequent, and least frequent values. Binary labels are aggregated using the “any” logic. Consequently, if a single instance of a capture is identified as malicious, the entire dataset is subsequently labeled as malicious. In the case of multi-class labels, aggregation is performed using the “most frequent” logic. Consequently, the window label is assigned as the most frequent value. If the most frequent value is identified as “normal”, yet at least one instance of an attack is present, the second most frequent value is then assigned.
Upon completion of the aggregation procedure, each feature is represented by three distinct features, thereby reducing the data in the time dimension while simultaneously expanding them in feature space. Table 4 shows the reduction in the number of instances generated by the sampling procedure, while Table 5 illustrates the increase in the number of features resulting from the aggregation procedure.
Table 4.
Reduction in sampling instances.
Table 5.
Expansion of sampling features.
Figure 3 shows the sampling and aggregation process, referred to simply as “sampling” in the remainder of this paper. The figure illustrates a timed job that runs the sampling process using a Python script. The job produces both sensor- and network-sampled data over a window of size <WINDOW-SIZE> in csv format every <OFFSET>.
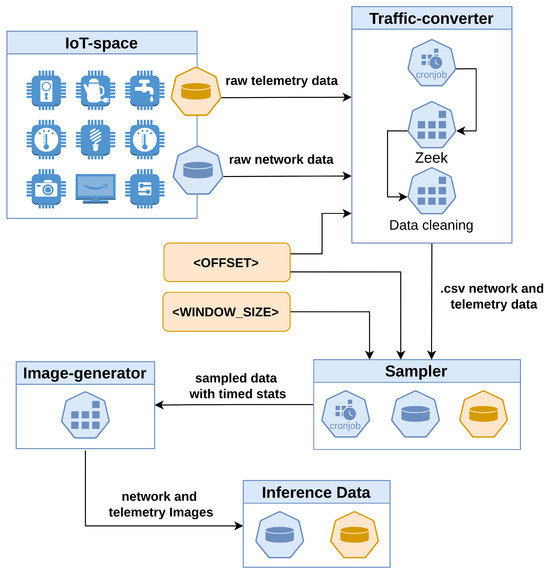
Figure 3.
Data pre-processing and engineering system architecture.
Concerning the data sensors, the aforementioned procedure is applied to the data stream generated by each sensor. A subsequent step is required to consolidate the data streams produced by the array of sensors into a single csv file. In this manner, each instance of the file represents the overall state of the IoT sensor system at a given time. In some cases, a sensor may not be present in the overall state, which is indicated by all the values of that sensor being NaN. Aggregation of the sensors is conducted after sampling, as this methodology streamlines the data aggregation process by associating the data with five-second intervals.
It is important to outline that the choice of a 10-s window and 5-s offset was made to observe broader effects of network attacks on the overall system behavior and to limit the impact of transient anomalies. However, as the window and offset sizes are tunable parameters of the data engineering unit, it will be possible in future work to conduct further experiments and adapt their values to the sampling time of the underlying IoT infrastructure.
6.4. Image Conversion
Following the data sampling process, each feature within the time window is characterized by three metrics: the minimum, maximum, and mean values for numerical features and the most frequent, second most frequent, and least frequent values for categorical features. This representation offers a comprehensive summary of the value distribution within the time window and is adaptable to new network and sensor data. To reduce data dimensionality, a 3:1 representation ratio is employed, where each feature value is mapped to a specific pixel intensity, as represented by an RGB (Red–Green–Blue) pixel in an image. This approach is motivated by two key factors:
- Representing each of the three features as an RGB pixel reduces the amount of data by one-third, which is crucial for achieving the sustainability goal of the data engineering system.
- Representing data as images enables the use of consolidated DNN technologies such as convolutional neural networks. By converting data into image format, we can harness the power of CNNs, which have been widely adopted and proven successful in various image-related tasks, such as object detection, image classification, and segmentation [61].
Furthermore, this approach is supported by the increasingly adopted techniques of Gramian Angular Fields (GAF) [62] and Markov Transition Fields (MTF) [63], which have been successfully used to convert time series into image representations while preserving temporal relationships. The developed custom image conversion technique follows the same principles as these approaches; however, we acknowledge that the level of abstraction introduced could be validated in future experiments using statistical analysis of features (e.g., Pearson coefficient) between the original and converted data.
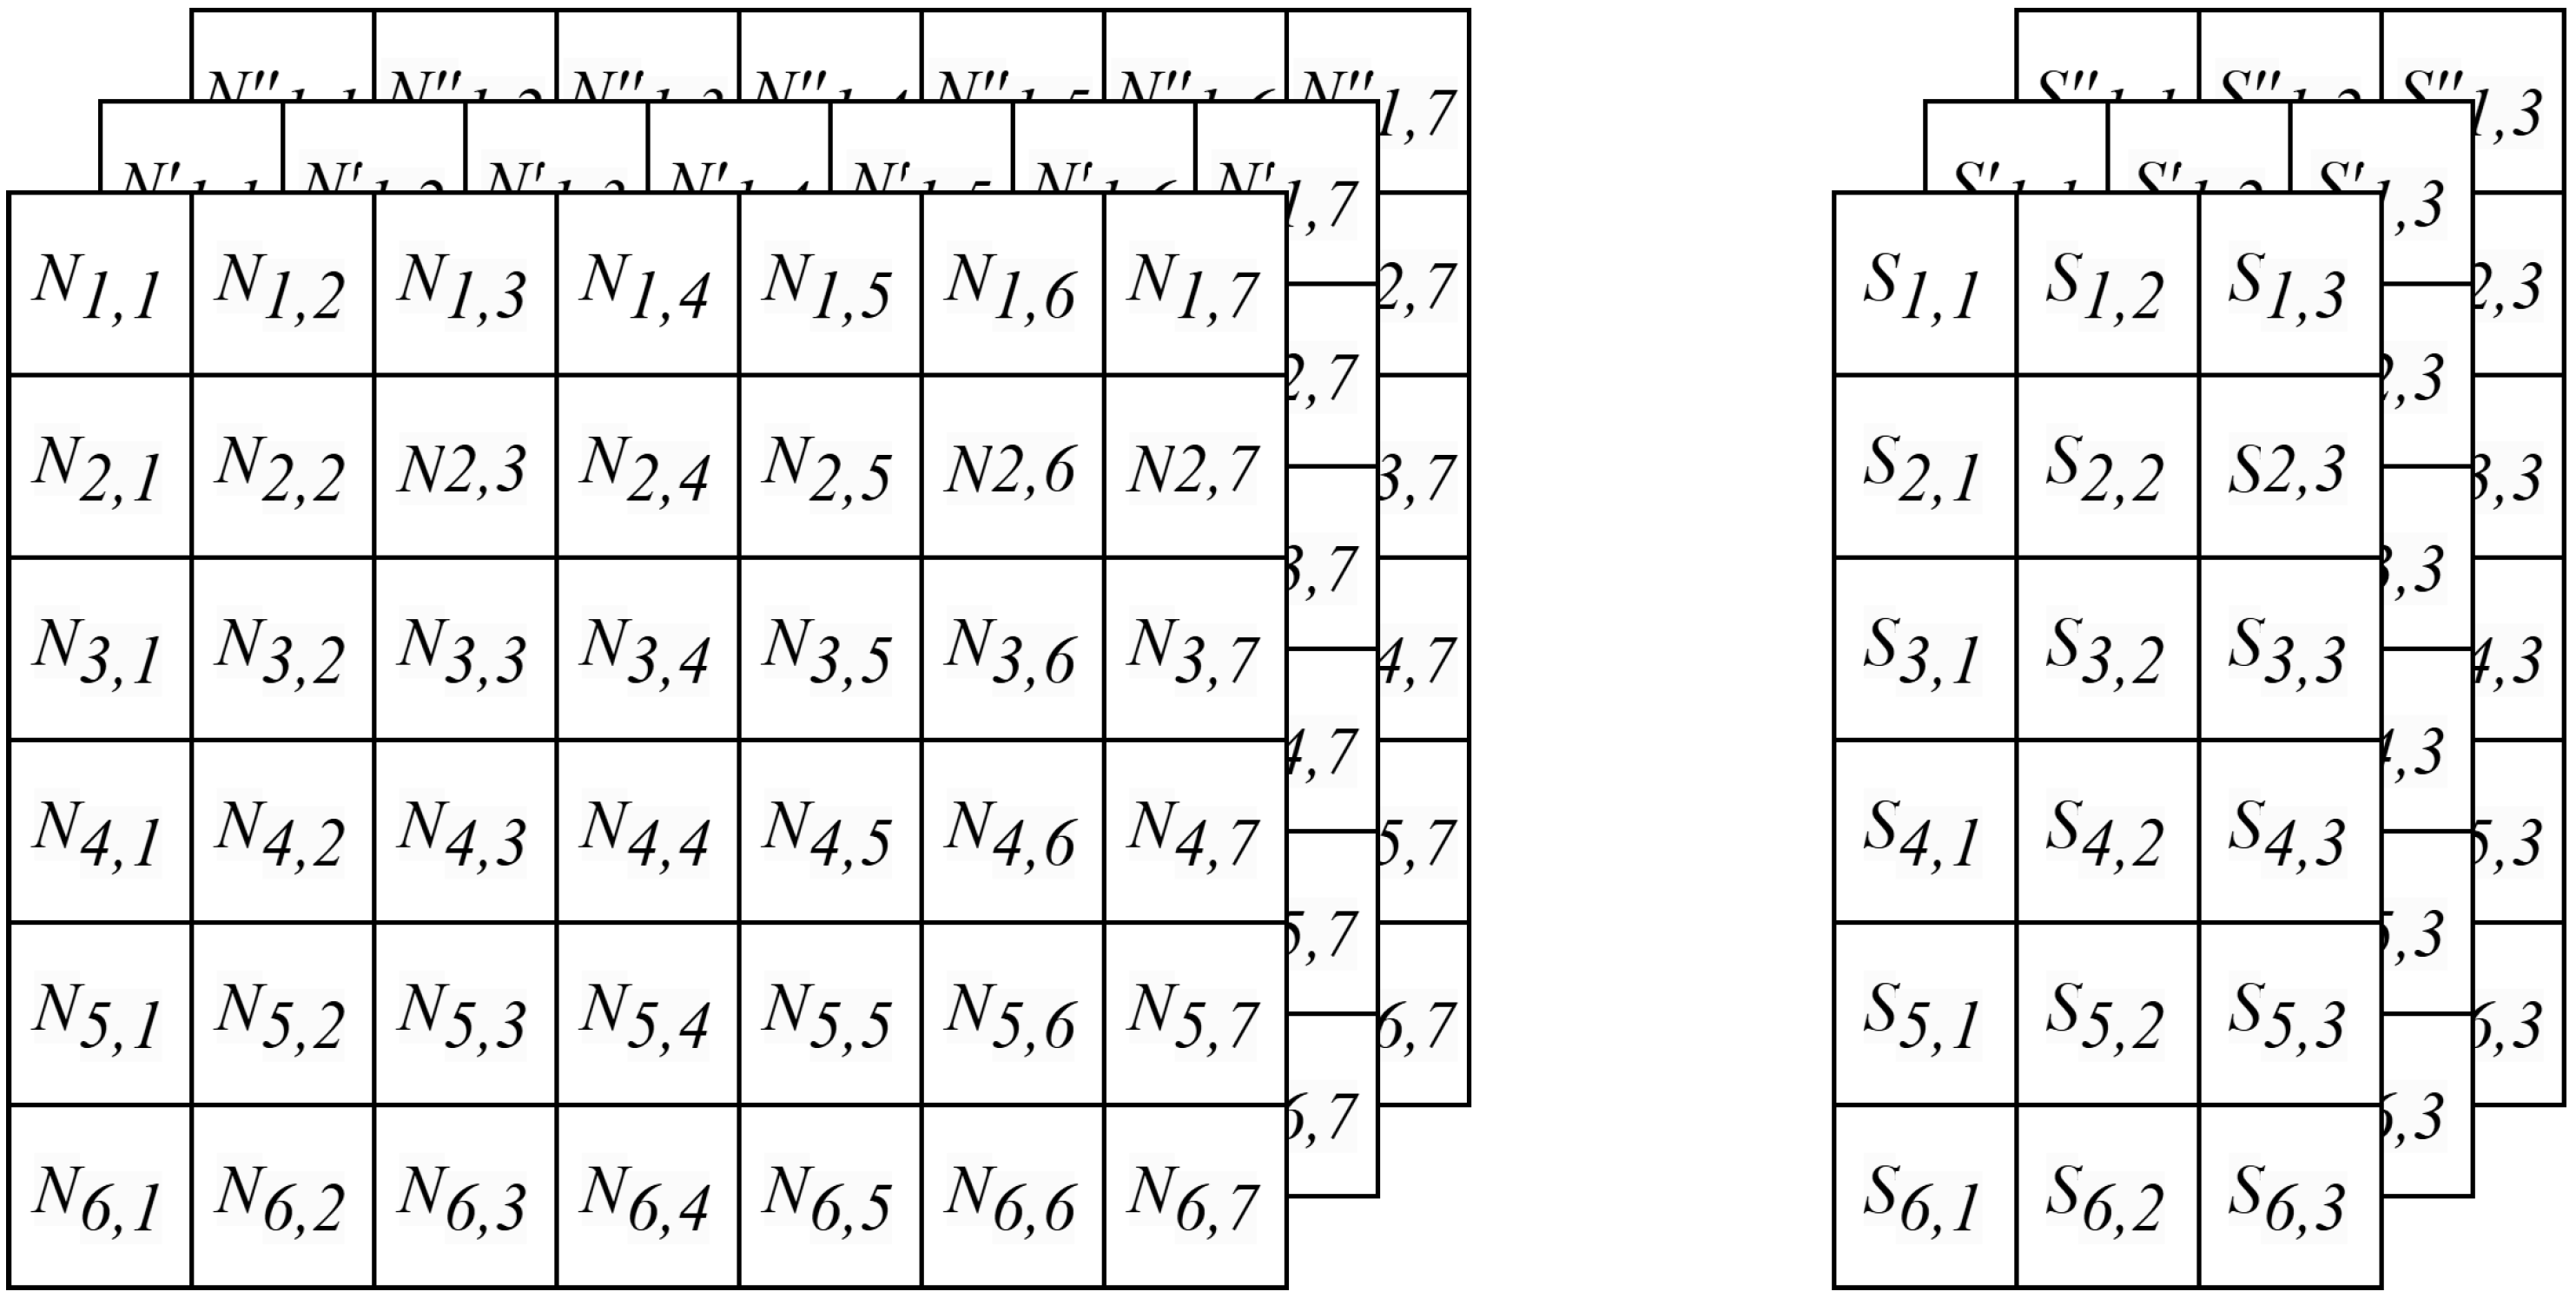
To perform this task, data are re-shaped into three-dimensional matrices, as shown in Figure 4, to be later converted to images:
- The sensor data are transformed into a 6 × 3 × 3 matrix. Each row of the matrix represents a sensor, and each cell contains three timed metrics for a feature. If a sensor only has two measures, NaN values are used to fill the last cell of the row.
- The network data are transformed into a 6 × 7 × 3 matrix, with each cell containing three timed metrics for a specific feature. NaN values are used to fill the remaining positions in the matrix.
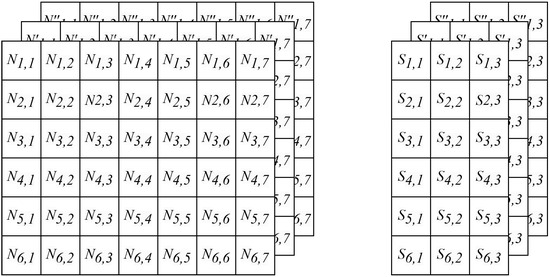
Figure 4.
Network and sensor feature matrices.
Figure 4.
Network and sensor feature matrices.
In both matrices, values are normalized to the range of [0:255] to represent pixel color intensities, with NaN values converted to zeros (black pixels). The matrices are then transformed into images using the Python Imaging Library (PIL) [64], where each matrix sub-value is mapped to the intensity of the red, green, or blue channel of a pixel. Figure 5 shows the network matrix transformed into a 2D matrix with separated and unified color channels, while Figure 6 depicts the corresponding transformation for the sensor data.

Figure 5.
Network images with separated (top) and unified (bottom) channels.
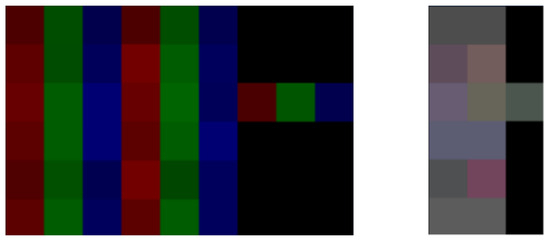
Figure 6.
Telemetry images with separated (left) and unified (right) channels.
6.5. Remarks
The developed system, shown in Figure 3, efficiently transforms raw data into an ML-friendly format while adhering to the principles of adaptability, MLOps with zero-touch, and sustainability. The methodology for sampling and extracting relevant metrics—such as the maximum, minimum, mean, and most frequent values—is designed for flexibility, making it suitable not only for the current dataset but also for integrating additional sensors and network features. This design ensures adaptability to diverse data sources, positioning the system as a general-purpose solution for IoT and network data engineering challenges.
The system operates autonomously via scheduled jobs requiring minimal configuration, such as sampling offset and window size. It automates every step, from data capture to ML-compatible format conversion, embodying a self-sufficient design capable of adapting to dynamic data streams without human intervention. The zero-touch paradigm facilitates seamless integration into MLOps pipelines, ensuring continuous data flow and processing.
The system achieves exceptional efficiency in data reduction, compressing 60 GB of raw traffic data into 2 MB of images. The sampling process and subsequent compression into the RGB color space significantly enhance sustainability, with each resulting image being approximately 100 bytes in size. This capability minimizes storage and processing requirements, aligning with the sustainability objectives of modern data architectures.
7. Trustworthy AI Solution for Intrusion Detection in Smart Buildings
The key goals considered during the design of the proposed decentralized ML-IDS are data privacy, AI trustworthiness, and security. Smart building data, such as network and sensor data, are sensitive and can reveal complex patterns [65]. FL is adopted to preserve data privacy by design, enabling collaborative ML development without data sharing. Additionally, as smart buildings are critical, human-centered applications, AI solutions must be trustworthy, functioning as intended and delivering interpretable results.
7.1. ML Models
The development of an FL setting begins with the selection of a suitable ML algorithm. In the context of analyzing sensor and network state images, CNNs were identified as an effective choice due to their ability to capture spatial hierarchies and extract complex patterns within image data. This led to the creation of two distinct CNN architectures, both adhering to the standard CNN framework comprising input, Conv2D, MaxPooling2D, flatten, dense, dropout, and output layers [66].
The CNN architectures for the network and sensors were developed using Keras, following the standard CNN structure. However, there are notable differences between the two networks:
- Input Layers: The input shapes vary, with network images sized at 6 × 7 pixels and sensor images at 6 × 3 pixels, both in RGB format.
- Output Layers: The sensor architecture’s output layer has dimensions of 6 × 3, predicting one of three states (normal traffic, attack, or sensor unavailability) for each of the six sensors. The network architecture’s output layer has dimensionsof 1 × 8, predicting across eight distinct classes. Additionally, the sensor architecture incorporates a reshape layer to transform the input from a 1 × 18 matrix to a 6 × 3 matrix, facilitating individual predictions for each sensor.
7.2. XAI—Gradient Correlation Maps
The use of CNNs facilitates the investigation of AI reasoning. To clarify the reasoning behind these models, explainable AI (XAI) techniques are implemented using TensorFlow’s GradientTape utility [67]. This tool computes the gradient of the loss with respect to each pixel of the input image. The obtained gradients determine how changes in pixel values affect the prediction for a specific target class. A correlation map is constructed by integrating the input image with its respective gradient. This process combines the cumulative impact of each pixel across all channels, thereby creating a correlation map that serves as a quantified visual guide to each pixel’s contribution to the predicted result. The employed methodology is an adaptation of the Gradient-weighted Class Activation Mapping (Grad-CAM) approach, as described in [68]. While more advanced XAI techniques, such as SHapley Additive exPlanations (SHAP) [69] or Local Interpretable Model-agnostic Explanations (LIME) [70], could have been used to provide deeper insights into the model’s decision-making process, the choice to use the Grad-CAM approach is based on the intention to take an initial step towards demonstrating the potential of integrating XAI in the ML-IDS setting. More advanced XAI techniques, along with more complex models and inherently explainable models, will be explored in future works.
Figure 7 shows the correlation map generated by the model when analyzing the network input image reported in Figure 8. The map visualizes the regions of the input image that the model focuses on to make its decision for a specific class. The scale on the right indicates the strength of the correlation, with higher values representing stronger correlations. The overlay on the original image highlights the areas most influential for the model’s prediction. It is important to note that the values on the scale are normalized and do not reflect the actual numerical correlation values reported in Table 6.
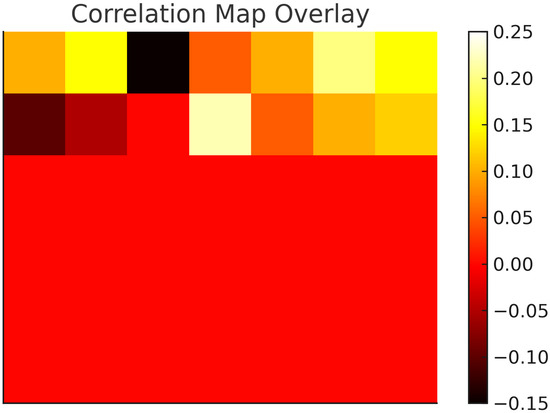
Figure 7.
Correlation map: NW example.
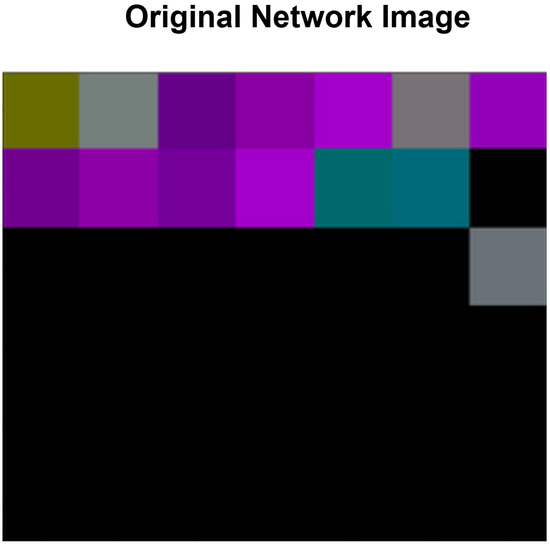
Figure 8.
Sample input NW image.
Table 6.
XAI: feature correlation example—network.
Utilizing the correlation map and the mapping of each feature with its position in the matrix, the five most significant features for that prediction can be extracted. The significance of each feature is determined by its correlation score, which quantifies the extent to which the feature influenced the outcome for a specific class. Table 6 presents the metrics extracted from the correlation map in Figure 7. In this example, the predicted class is scanning. Using the derived table, the matrix construction mapping, and the LabelEncoder mappings, further analysis can be conducted to identify the actual values of the metrics that influenced this decision. This approach provides insights into the AI’s decision-making process and can be leveraged to refine the algorithm, particularly in cases of false positives and false negatives.
A similar approach may be applied to IoT data due to the adoption of the same sampling and image transformation system. Figure 9 shows the correlation map generated by the model when analyzing Figure 10, which only includes data from the motion light and thermostat sensors. Table 7 presents the metrics extracted from the correlation map shown in Figure 9. The predicted classes are attacks on both sensors. As in the network data case, further analysis can be conducted using the matrix construction and the LabelEncoder mappingsto discover the actual values of the metrics that influenced this decision.
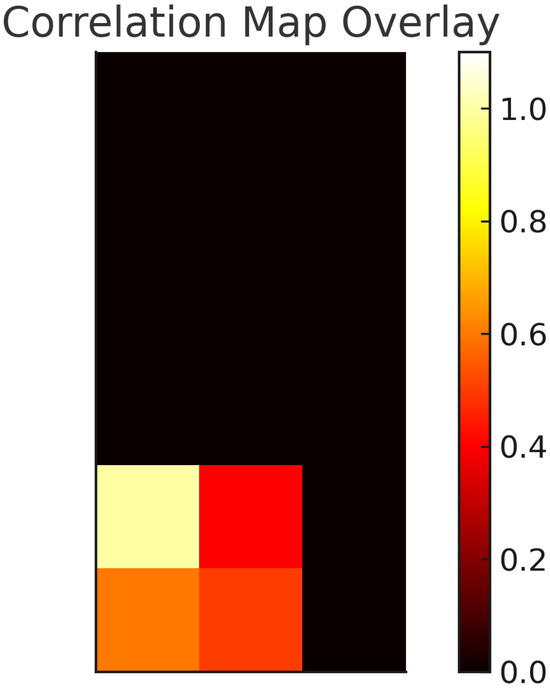
Figure 9.
Correlation map: IoT example.

Figure 10.
Sample input IoT image.
Table 7.
XAI: feature correlation example—IoT.
7.3. Centralized ML Benchmarks
Before implementing the FL setting, the data cleaning and pre-processing system, along with the CNNs, was tested in a centralized environment to establish a performance benchmark. This benchmark was used to evaluate the impact of decentralization on performance and results. The sensor and network data were partitioned into training, test, and validation sets using a 70–20–10 stratified split, ensuring the distribution of labels was preserved across the splits. After training the network and sensor CNNs for 300 and 200 epochs, respectively, until the validation loss began to increase, confusion matrices were computed using the validation set. The following explains the key elements of the confusion matrices:
- True Positives (TP): Correctly identified positive instances;
- True Negatives (TN): Correctly identified negative instances;
- False Positives (FP): Negative instances incorrectly identified as positive;
- False Negatives (FN): Positive instances incorrectly identified as negative.
Using these matrix elements, the following metrics were computed:
- Accuracy: The proportion of the total number of correct predictions that were correct, calculated as follows:
- Precision (Positive Predictive Value): The proportion of positive cases that were correctly identified, calculated as follows:
- Recall (Sensitivity): The proportion of correctly identified actually positive cases, calculated as follows:
- F1 Score: The harmonic mean of precision and recall, calculated as follows:
- FPR (False-Positive Rate): The proportion of actual negative cases incorrectly identified as positive, calculated as follows:
- FNR (False-Negative Rate): The proportion of actual positive cases incorrectly identified as negative, calculated as follows:
To calculate these metrics for the multi-class classification problem, which has eight classes for network data and three classes for sensor data, the matrix values are considered as follows:
- The network confusion matrix considers a value of 5 to be indicative of a negative outcome, representing the “normal” class. Conversely, all other classes, which represent attacks, are regarded as positive.
- The confusion matrix employed by the sensor exclusively considers class “1” as positive and class “0” as negative samples, given that the class “2”, which represents a sensor that is off, was removed.
The network confusion matrix is represented in Figure 11, while the sensor confusion matrices are represented in Figure 12. The metrics extracted from the matrices are reported in Table 8. The CNN network’s performance metrics demonstrate excellent results across all evaluation criteria, with an accuracy of . This suggests that the model is capable of making accurate predictions in the majority of cases. Moreover, the precision of and the recall of demonstrate the high capacity of the model in correctly identifying positive cases while minimizing false positives and negatives. The network demonstrates robust capability in distinguishing between positive and negative cases, with a false-positive rate of and a low false-negative rate of . However, the performance of the sensor CNN exhibits considerable variability. Some sensors, such as GPS, motion light, and garage door sensors, achieve perfect scores across all metrics, while others, like refrigerator and weather sensors, exhibit high false-positive rates, despite having perfect recall. The thermostat sensor is the only one that does not yield satisfactory results in terms of recall, with a false-positive rate of .
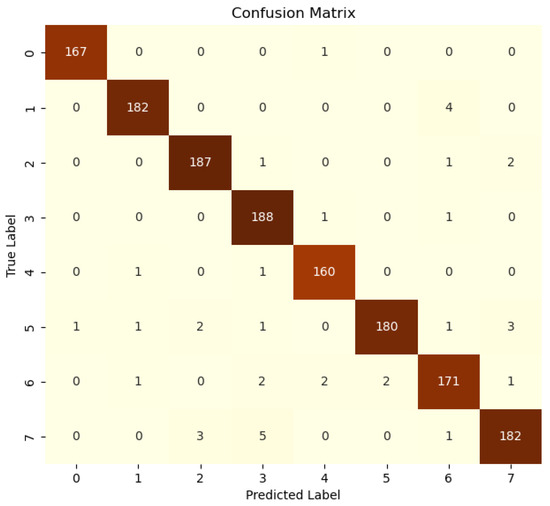
Figure 11.
Centralized ML: network confusion matrix.

Figure 12.
Centralized ML: sensor confusion matrices.
Table 8.
CNN performance metrics (%).
8. Performance Evaluation of the Proposed FL-IDS
The simulation scenario used toi evaluate the proposed FL-IDS’s performance is composed of five smart buildings collaborating to develop a multi-layer ML-IDS. The system is composed of five clients, which are coordinated by an OSS. This component can initiate the FT process, which is designed to enhance the overall model quality. Additionally, the OSS retains a limited set of validation data, which is employed to assess the efficacy of the FT. Moreover, the OSS maintains a record of the current state of the global models.
Each client is linked exclusively to the OSS and possesses its own data pre-processing and engineering system, operating within its designated cyber space. The client utilizes the central model provided by the OSS to perform inference on their proprietary data. It stores the inferred data to be later used in FT and participates in the FT.
The considered scenario can be classified as a “cross-silo” and “horizontal” federated setting. In this setting, clients are distinct organizations that share a common feature space by leveraging a unified data pre-processing and engineering system, yet possess disparate data samples. Figure 13 provides an overview of the scenario under consideration.
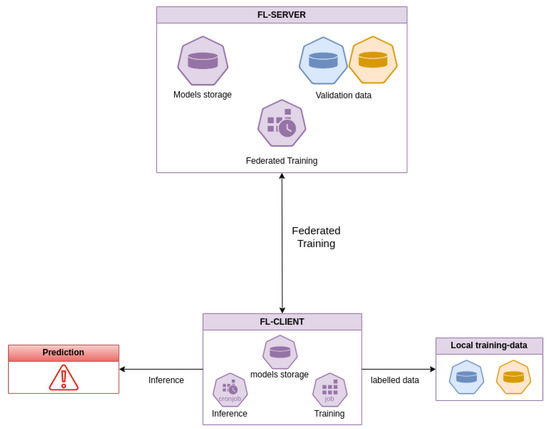
Figure 13.
Overview of the simulation scenario.
8.1. Federated Learning Frameworks
To develop the federated learning solution, two frameworks were considered: Flower [71] and TensorFlow Federated (TFF) [72]. While Flower is a viable option for testing and developing FL solutions, TFF provides a more comprehensive representation of the FL setting. This is due to its extensive features and capabilities, which make it a more suitable choice for complex FL scenarios. Furthermore, TFF provides ready-to-use, secure aggregators, which are indispensable for the implementation of robust solutions and the enhancement of the security and reliability of federated learning systems.
TFF is distinguished by its approach to training monitoring, which is exclusively allowed on the server side. This setup mirrors a more stringent yet realistic scenario for FL, where client-side data privacy is paramount.
TFF provides a simple method for integrating differential privacy, ensuring that individual data points remain confidential during the training process. Additionally, the framework supports secure aggregators in various formats, which can be easily incorporated into the FT process. These secure aggregators play a crucial role in maintaining the privacy and security of the data by aggregating updates from multiple clients without exposing individual data points.
Given these features, the experiments were conducted using TFF. The reported metrics were extracted from the server, ensuring a rigorous and realistic evaluation of the FL process. In fact, following the FT, the server performs a centralized validation step over its validation data.
8.2. Data Distribution Experiments
To evaluate the efficacy of the FL approach relative to a centralized approach, three preliminary experiments were conducted with varying data distributions (IID and non-IID). Each experiment was conducted over a wide range of rounds, and the resulting model was subsequently evaluated on the server side. The following experimental settings were implemented:
- Experiment 1: data were distributed following an IID. The data were split into five samples with stratification—one sample for each client.
- Experiment 2: Data were distributed following a non-IID, with an increasing number of clients participating in the FT only with non-malicious samples.
- Experiment 3: data were distributed following a non-IID, with each client storing a particular type of attack.
The purpose of these experiments was to evaluate the effect of data distribution on performance and the number of rounds required to converge. Experiment 1 reported numeric results, serving as the baseline experiment to assess the impact of decentralization. Experiments 2 and 3 only presented final results due to the large amount of collected data. However, the full data can be found at [73].
8.3. Experiment 1
The data were stratified and divided equally among five clients and the server. This ensured that each client had the same number of data samples and the same label distribution; the setting is represented in Figure 14. This experiment serves as a baseline to determine the number of rounds required to converge to the centralized ML results due to the “ideal” data distribution. The best results were obtained with 2200 rounds for the network CNN and 800 round for the sensor CNN; the performance results are summarized in Table 9.
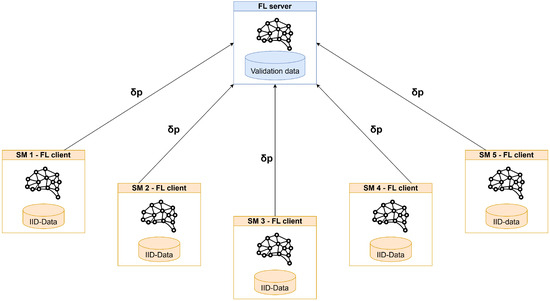
Figure 14.
Experiment 1 settings.
Table 9.
Experiment 1 performance results (%).
Upon comparing the results in Table 9 with those in Table 8 under centralized settings, the following differences can be observed:
- Network: The overall results improved. The FPR decreased from 4.76% to 3.24%, while the FNR slightly increased from 0.16% to 0.47%.
- GPS: The overall results of this sensor dropped due to the FNR, which increased from 0% to 2%.
- Garage Door and Motion Light: These sensors achieved the same results as in the centralized learning scenario, with perfect scores.
- Fridge and Weather: In the centralized scenario, these sensors exhibited high false-positive rates (FPRs), which, in a decentralized, setting increased. For the fridge, the FPR changed from 22.22% to 28.79%, while for the weather sensor, it increased from 50% to 63.16%.
- Thermostat: In the centralized setting, this sensor was the only one to exhibit a low recall behavior, causing false negatives. In the decentralized scenario, the FNR increased from 16.82% to 27.74%. The data pre-processing and engineering system and the data distribution in the original dataset are probably not optimal for this particular sensor, causing poor performance.
In summary, the transition to a decentralized learning scenario improved the performance of the network CNN significantly by reducing the false-positive rate (FPR). This indicates increased accuracy in detecting malicious activity and suggests the mitigation of the overfitting issues present in the centralized scenario. The sensors’ performance remained consistent with the centralized approach. The Motion light and garage door sensors maintained perfect scores, while the the GPS sensor experienced a slight performance decline and the thermostat sensor continued to exhibit challenges. This highlights the effectiveness of FL in maintaining or improving detection capabilities without compromising the system’s overall reliability.
8.4. Experiment 2
This experiment was composed of four different scenarios, with an increasing number of clients (1, 2, 3, and 4) participating in the FT with no attack samples in their datasets. The scenarios are shown in Figure 15. This experiment was needed to assess the performance of the FL-IDS in a likely scenario in which some participants have no attack data.
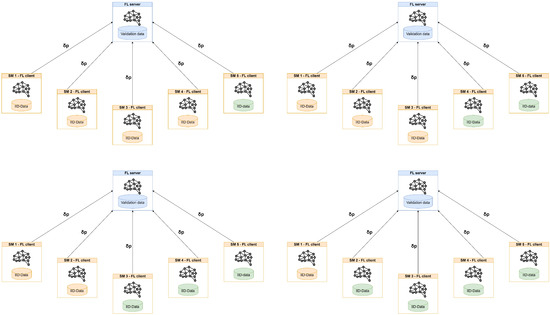
Figure 15.
Experiment 2 settings.
In this experiment, the same results as in Experiment 1 were obtained with non-relevant variation (±0.5%) after 2500 and 1200 rounds for the network and sensor data, respectively. With these rounded values, the impact of having 1, 2, 3, or 4 clients participating without attack data remained consistent.
8.5. Experiment 3
This experiment evaluated the scenario in which each client possesses a non-overlapping and disjoint set of attacks, assessing FL-IDS performance when participants are targeted by distinct attack types. The scenario is shown in Figure 16.

Figure 16.
Experiment 3 settings.
The obtained results are comparable to those of Experiment 1, with negligible differences (±0.5%) achieved after 2200 and 1000 rounds for network and sensor data, respectively.
8.6. Impact of Data Distribution
The impact of data distribution on the number of rounds needed to converge to centralized setting values is evident from the results reported in Table 10. These preliminary experiments were conducted to evaluate the algorithm’s robustness in the presence of non-IID data, which is likely to occur in real-world scenarios. The varying number of rounds required to converge is not a problem due to the iterative nature of FT. By setting a threshold for the metrics, it is possible to iterate the FT until the desired performance level is achieved.
Table 10.
Experimental results.
8.7. Remarks
The performance analysis carried out using the ToN-IoT dataset provides the following results.
- Decentralization impact: The presented simulation analysis reveals that the decentralization introduced by FL does not significantly affect the performance of centralized intrusion detection systems. FL is an effective method for preserving client data privacy by design while facilitating the collaborative development of a common ML model.
- Client data distribution: The distribution of client data influences the number of rounds required for the model to converge, but it does not negatively impact the effectiveness of the overall model. This underscores FL’s ability to accommodate diverse data environments while achieving robust detection capabilities.In summary, FL seems to be a feasible and efficient approach for developing IDSs in the smart building sector. It achieves the double goals of protecting customer privacy and ensuring collaborative model development without compromising detection capabilities.
9. Threat Analysis
A comprehensive threat analysis is essential in addressing the distinctive security concerns associated with the federated smart building scenario. As illustrated in Figure 17, three discrete threats were identified: client-side, MiTM, and server-side threats. In particular, a client with malicious intent can corrupt its data to negatively impact the overall performance of the global model. This corruption can take many forms, ranging from injecting noise to flipping labels, and can have various effects. A targeted poisoning attack can be viewed as a backdoor attack, where the goal is to alter the prediction of the global model for a specific type of data or sample. The mitigation of this threat is achieved using secure aggregation methods. In the case of the MIMT threat, a malicious actor positioned between the server and a client can intercept and alter client/server weight updates, compromising the model’s performance. Secure connection protocols such as SSL and IPsec must be established between the server and clients to ensure confidentiality, integrity, and non-repudiation. The first two properties prevent sniffing and tampering, while the third helps the server avoid a situation where a client poisons their data and falsely claims that the weights were modified in transit. Server-side threats originate from a server with malicious intent that could potentially obtain information about the client’s training data by analyzing the provided weights. The most commonly used countermeasures against these threats are Homomorphic Encryption (HE) and Differential Privacy (DP) [28,74]. Homomorphic encryption allows the server to perform aggregation without decrypting data, while differential privacy involves each client injecting some noise over their weights. However, homomorphic encryption cannot be used with secure aggregation methods such as clipping and zeroing, while differential privacy can noticeably affect the overall model performance.
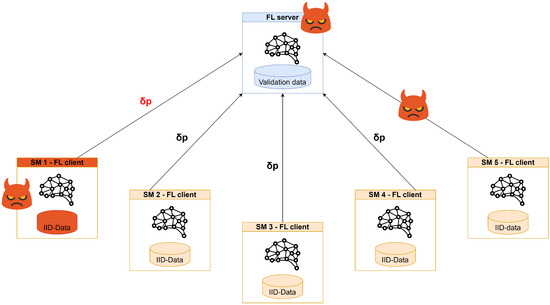
Figure 17.
FL threats.
In the considered FL scenario, the server is a trusted entity that coordinates distributed learning across multiple smart buildings. For this reason, we specifically target poisoning attacks and employ defenses tailored to detect and mitigate this type of threat, while attacks involving information leakage are not considered central to the analysis. However, techniques such as DP and HE could be used to strengthen privacy protection when confidentiality becomes an issue in future works, where the strong assumption of a trusted aggregator will be relaxed.
9.1. Secure Aggregation
The common aggregation function used for FT is FedAvg, as described in Algorithm 1. For the sake of clarity, we summarize its operation here. Each client trains the global model () in round t using its data, producing a local update of the weights (). The updates are aggregated with a standard weighted mean:
where K is the number of clients, is the number of data samples on client k, n is the total number of samples across all clients, and is the learning rate. It can be easily noted how there is no active control over the client updates (). Thus, a malicious client can poison its data and produce poisoned updates that will deviate and spoil the global model (). The selected TFF tool provides different methods that can be used to both spot and reduce the effects of poisoning [75]. The secure aggregator implementation provided by TFF leverages the following two mathematical functions.
- Zeroing: The updates that exceed a zeroing threshold (Z) are filtered out. Z can be fixed or computed at runtime using the i-th percentile of all the clients’ updates.
- Clipping: The updates are normalized in such a way that their norm never exceeds the clipping threshold (C). C can be fixed or computed at runtime using the i-th percentile of all the clients’ updates.
The main difference between these two functions is that zeroing is designed to identify and eliminate malicious updates, whereas clipping is intended to mitigate the impact of such updates. In this context, zeroing can be a valuable tool for detecting poisoning and conducting further analysis on malicious clients. Conversely, clipping can be an effective approach for retaining the beneficial elements of malicious updates while avoiding the complete discarding of update information. The combination of clipping and zeroing is an effective method for identifying malicious updates while retaining the beneficial information contained within them. The logic is to clip all the updates and discard the clipped updates that exceed the threshold (Z). TFF employs an adaptive quantile estimation process for both zeroing and clipping, thereby enabling the dynamic adjustment of thresholds for the handling of outliers [76]. The zeroing operation, by default, sets Z to the 98th percentile, while the clipping mechanism sets C to the 80th percentile. The C setting ensures that model updates with disproportionately large values are scaled down to a more manageable level, preventing them from dominating the aggregated update and skewing the learning process.
9.2. Results Related to Poisoning Attacks
The simulations for verifying the performance and the robustness introduced by the secure aggregator consider three different configurations: zeroing, clipping, and clipping followed by zeroing. Two distinct experiments were conducted, each involving a single or two clients engaged in a poisoning attack through label flipping. Figure 18 shows the results obtained for the network CNN in the case of one poisoned client, while Figure 19 refers to the case of two poisoned clients. The full results are available in [73]. The primary outcomes derived from the analysis of these figures can be summarized as follows.
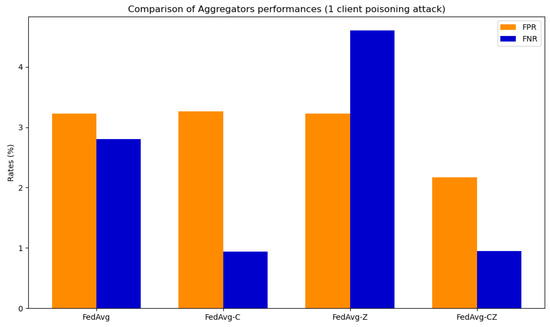
Figure 18.
Aggregator results for the network CNN with one poisoning client.
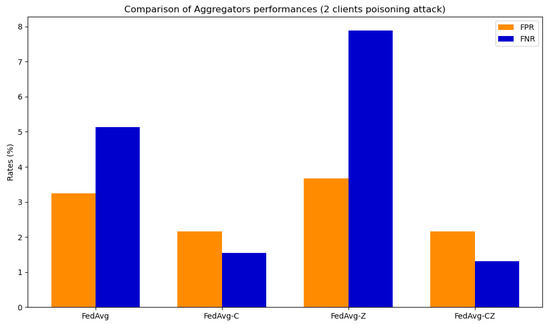
Figure 19.
Aggregator results for the network CNN with two poisoning clients.
The best results in terms of FPR and FNR with both one and two poisoned clients are achieved by a combination of clipping and zeroing. This approach reduces the percentage of FP caused by poisoning by with both one and two poisoned clients. Moreover, the findings indicate a reduction in the proportion of FN resulting from poisoning, amounting to in the case of a single poisoned client and in instances involving two poisoned clients. The results of clipping followed by zeroing are similar to results obtained with only clipping; the real difference is that by using zeroing, the server can detect which clients tried to poison the model.
In summary, although FL inherently preserves data privacy by design, it is necessary to take additional measures to fully secure the FL environment. Establishing secure connections between clients and the server is essential to safeguard against potential confidentiality and integrity threats. Furthermore, employing secure aggregator methods such as zeroing and clipping enhances the system’s resilience against data poisoning attacks, ensuring the integrity of the collaborative learning process.
10. Conclusions
This paper presents the development of a distributed AI solution that leverages FL techniques, focuses on sustainability, and implements zero-touch management while also providing a “trusted AI” framework. The performance evaluation of the presented method points out the following key insights.
Concerning “data pre-processing and engineering”, the presented scheme requires minimal setup and significantly reduces the need for human intervention by autonomously cleaning and transforming data. In addition to the improved workflow, this approach also meets the sustainability goals of the project by efficiently reducing the volume of data. Techniques such as time sampling and image conversion across three color channels are used for enhanced data compression. This process is designed to be general-purpose and has been effectively applied to both network and sensor data. Its versatility suggests potential applicability to other types of data in future projects, emphasizing its general utility.
Concerning AI trustworthiness, the presented architecture ensures secure client–server connections for FL to safeguard data integrity and confidentiality. It also employs secure aggregation methods to counteract potentially malicious client disruptions. Additionally, it uses XAI techniques such as Grad-CAM to provide users with insight into the AI’s decision-making process, enhancing their trust in the solution.
The performance analysis of the presented FL-IDS shows remarkable results, achieving high precision and recall rates while minimizing false-positive rates (FPRs; ∼3%) and false-negative rates (FNRs; ∼0.5%) on network data. While there are discrepancies in sensor performance, with some achieving perfect results and others exhibiting high FPRs, the overall effectiveness is noteworthy. The framework’s versatility is highlighted by the uniform processing of network and sensor data, which significantly reduces data volume while supporting a wide variety of data. However, the implemented XAI techniques can be used in the future to analyze the causes of high FPRs for some sensors.
The presented research demonstrates the viability of a sustainable, automated intrusion detection systems for smart buildings based on FL. The proposed solution achieves this by innovating in data pre-processing and upholding a trusted AI framework.
While this work provides several innovative aspects for the use of sustainable and trustworthy AI in the smart building scenario, it also leaves open avenues for future work. One of the most critical aspects pertains to the use of the ToN-IoT dataset. This dataset is an invaluable resource in providing both network and telemetry data in the context of intrusion detection in smart buildings; however, the dataset is simulated, and there is no clear correlation between the impact of attacks on network and telemetry data. Future research directions are outlined as follows. There is a need to apply the same methodology in a real-world scenario to further test the solution and provide insights into the resource consumption of devices and the real-world detection capabilities of FL-IDSs. Furthermore, the collection of a real-world dataset with correlated network and IoT data will make a unified classification strategy a viable option, as opposed to the binary classification on IoT data and multiclass classification on network data proposed in this work. Other analyses to be carried out in future research include but are not limited to the exploration of different sampling window sizes, data balancing techniques, XAI techniques, and DNN architectures.
Author Contributions
Conceptualization, R.G.G., P.G.G., G.L. and M.R.; investigation, M.R. and P.G.G.; resources, G.L.; writing—original draft preparation, R.G.G. and M.R.; writing—review and editing, R.G.G. and M.R.; supervision, R.G.G., P.G.G. and G.L.; funding acquisition, R.G.G. and G.L. All authors have read and agreed to the published version of the manuscript.
Funding
This work was funded by the European Commission through Horizon Europe JU SNS project ROBUST-6G (Grant Agreement no. 101139068) and supported by TUBITAK through the 1515 Program under Project 5169902. Furthermore, this work was partially supported by the Italian Ministry of University and Research (MUR) witin the framework of the FoReLab project (Departments of Excellence).
Data Availability Statement
Data are contained within the article.
Conflicts of Interest
Authors Pietro Giuseppe Giardina, Giada Landi, and Marco Ruta are employed by the Nextworks company. The remaining authors declare that the research was conducted in the absence of any commercial or financial relationships that could be construed as a potential conflict of interest.
References
- Batov, E.I. The Distinctive Features of “Smart” Buildings. Procedia Eng. 2015, 111, 103–107. [Google Scholar] [CrossRef]
- Meyer, D.; Haase, J.; Eckert, M.; Klauer, B. A threat-model for building and home automation. In Proceedings of the 2016 IEEE 14th International Conference on Industrial Informatics (INDIN), Poitiers, France, 19–21 July 2016; pp. 860–866. [Google Scholar] [CrossRef]
- Heartfield, R.; Loukas, G.; Budimir, S.; Bezemskij, A.; Fontaine, J.R.; Filippoupolitis, A.; Roesch, E. A taxonomy of cyber-physical threats and impact in the smart home. Comput. Secur. 2018, 78, 398–428. [Google Scholar] [CrossRef]
- Li, G.; Ren, L.; Fu, Y.; Yang, Z.; Adetola, V.; Wen, J.; Zhu, Q.; Wu, T.; Candan, K.; O’Neill, Z. A critical review of cyber-physical security for building automation systems. Annu. Rev. Control. 2023, 55, 237–254. [Google Scholar] [CrossRef]
- Ruta, M.; Giardina, P.; Landi, G.; Garroppo, R.G. A Generalized Multi-Layer IDS for Smart Buildings. In Proceedings of the IEEE International Workshop on Computer Aided Modeling and Design of Communication Links and Networks (CAMAD), Athens, Greece, 21–23 October 2024; pp. 339–344. [Google Scholar] [CrossRef]
- Kairouz, P.; McMahan, H.B.; Avent, B.; Bellet, A.; Bennis, M.; Bhagoji, A.N.; Bonawitz, K.; Charles, Z.; Cormode, G.; Cummings, R.; et al. Advances and Open Problems in Federated Learning. arXiv 2021. [Google Scholar] [CrossRef]
- Bharati, S.; Mondal, M.R.H. 12 Applications and challenges of AI-driven IoHT for combating pandemics: A review. In Computational Intelligence for Managing Pandemics; De Gruyter Brill: Berlin, Germany, 2021. [Google Scholar] [CrossRef]
- Bharati, S.; Podder, P. 1 Performance of CNN for predicting cancerous lung nodules using LightGBM. In Artificial Intelligence for Data-Driven Medical Diagnosis; De Gruyter Brill: Berlin, Germany, 2021. [Google Scholar] [CrossRef]
- Sun, T.; Li, D.; Wang, B. Decentralized Federated Averaging. IEEE Trans. Pattern Anal. Mach. Intell. 2023, 45, 4289–4301. [Google Scholar] [CrossRef]
- Zhu, H.; Xu, J.; Liu, S.; Jin, Y. Federated Learning on Non-IID Data: A Survey. arXiv 2021. [Google Scholar] [CrossRef]
- Lu, Z.; Pan, H.; Dai, Y.; Si, X.; Zhang, Y. Federated Learning With Non-IID Data: A Survey. IEEE Internet Things J. 2024, 11, 19188–19209. [Google Scholar] [CrossRef]
- Al-amri, R.; Murugesan, R.K.; Man, M.; Abdulateef, A.F.; Al-Sharafi, M.A.; Alkahtani, A.A. A Review of Machine Learning and Deep Learning Techniques for Anomaly Detection in IoT Data. Appl. Sci. 2021, 11, 5320. [Google Scholar] [CrossRef]
- Djenouri, D.; Laidi, R.; Djenouri, Y.; Balasingham, I. Machine Learning for Smart Building Applications. ACM Comput. Surv. (CSUR) 2019, 52, 1–36. [Google Scholar] [CrossRef]
- Huawei Technologies Co., Ltd. 6G: The Next Frontier: Unfolding the Mystery of 6G. White Paper. Available online: https://www.huawei.com/en/huaweitech/future-technologies/6g-white-paper (accessed on 15 April 2025).
- Alazab, A.; Khraisat, A.; Singh, S.; Jan, T. Enhancing Privacy-Preserving Intrusion Detection through Federated Learning. Electronics 2023, 12, 3382. [Google Scholar] [CrossRef]
- Kreuzberger, D.; Kühl, N.; Hirschl, S. Machine Learning Operations (MLOps): Overview, Definition, and Architecture. IEEE Access 2023, 11, 31866–31879. [Google Scholar] [CrossRef]
- Liu, P.; Xu, X.; Wang, W. Threats, Attacks and Defenses to Federated Learning: Issues, Taxonomy and Perspectives. Cybersecurity 2022, 5, 4. [Google Scholar] [CrossRef]
- Akujuobi, U.; Yufei, H.; Zhang, Q.; Zhang, X. Collaborative Graph Walk for Semi-Supervised Multi-label Node Classification. In Proceedings of the 2019 IEEE International Conference on Data Mining (ICDM), Beijing, China, 8–11 November 2019; pp. 1–10. [Google Scholar] [CrossRef]
- Hong, S.; Chandrasekaran, V.; Kaya, Y.; Dumitraş, T.; Papernot, N. On the Effectiveness of Mitigating Data Poisoning Attacks with Gradient Shaping. arXiv 2020. [Google Scholar] [CrossRef]
- Wang, J.; Chang, X.; Rodrìguez, R.J.; Wang, Y. Assessing Anonymous and Selfish Free-rider Attacks in Federated Learning. In Proceedings of the 2022 IEEE Symposium on Computers and Communications (ISCC), Rhodes, Greece, 30 June–3 July 2022; pp. 1–6. [Google Scholar] [CrossRef]
- Bhagoji, A.N.; Chakraborty, S.; Mittal, P.; Calo, S. Analyzing Federated Learning through an Adversarial Lens. arXiv 2019. [Google Scholar] [CrossRef]
- Shokri, R.; Stronati, M.; Song, C.; Shmatikov, V. Membership Inference Attacks Against Machine Learning Models. In Proceedings of the 2017 IEEE Symposium on Security and Privacy (SP), San Jose, CA, USA, 22–26 May 2017; pp. 3–18. [Google Scholar] [CrossRef]
- Hitaj, B.; Ateniese, G.; Perez-Cruz, F. Deep Models Under the GAN: Information Leakage from Collaborative Deep Learning. In Proceedings of the 2017 ACM SIGSAC Conference on Computer and Communications Security, New York, NY, USA, 30 October–3 November 2017; CCS ’17. pp. 603–618. [Google Scholar] [CrossRef]
- Melis, L.; Song, C.; De Cristofaro, E.; Shmatikov, V. Exploiting Unintended Feature Leakage in Collaborative Learning. In Proceedings of the 2019 IEEE Symposium on Security and Privacy (SP), San Francisco, CA, USA, 19–23 May 2019; pp. 691–706. [Google Scholar] [CrossRef]
- Zhu, L.; Han, S. Deep Leakage from Gradients. In Federated Learning: Privacy and Incentive; Springer International Publishing: Cham, Switzerland, 2020; pp. 17–31. [Google Scholar] [CrossRef]
- Abrahamyan, L.; Chen, Y.; Bekoulis, G.; Deligiannis, N. Learned Gradient Compression for Distributed Deep Learning. arXiv 2021. [Google Scholar] [CrossRef]
- Wu, C.; Wu, F.; Lyu, L.; Qi, T.; Huang, Y.; Xie, X. A federated graph neural network framework for privacy-preserving personalization. Nat. Commun. 2022, 13, 3091. [Google Scholar] [CrossRef]
- Ji, Z.; Lipton, Z.C.; Elkan, C. Differential Privacy and Machine Learning: A Survey and Review. arXiv 2014. [Google Scholar] [CrossRef]
- He, K.; Kim, D.D.; Asghar, M.R. Adversarial Machine Learning for Network Intrusion Detection Systems: A Comprehensive Survey. IEEE Commun. Surv. Tutor. 2023, 25, 538–566. [Google Scholar] [CrossRef]
- Sater, R.A.; Hamza, A.B. A Federated Learning Approach to Anomaly Detection in Smart Buildings. ACM Trans. Internet Things 2021, 2, 28. [Google Scholar] [CrossRef]
- Man, D.; Zeng, F.; Yang, W.; Yu, M.; Lv, J.; Wang, Y.; Jiang, Q. Intelligent Intrusion Detection Based on Federated Learning for Edge-Assisted Internet of Things. Sec. Commun. Netw. 2021, 2021. [Google Scholar] [CrossRef]
- Mahadik, S.S.; Pawar, P.M.; Muthalagu, R. Edge-Federated Learning-Based Intelligent Intrusion Detection System for Heterogeneous Internet of Things. IEEE Access 2024, 12, 81736–81757. [Google Scholar] [CrossRef]
- Bhavsar, M.H.; Bekele, Y.B.; Roy, K.; Kelly, J.C.; Limbrick, D. FL-IDS: Federated Learning-Based Intrusion Detection System Using Edge Devices for Transportation IoT. IEEE Access 2024, 12, 52215–52226. [Google Scholar] [CrossRef]
- Ceviz, O.; Sadioglu, P.; Sen, S.; Vassilakis, V.G. A Novel Federated Learning-Based IDS for Enhancing UAVs Privacy and Security. arXiv 2024. [Google Scholar] [CrossRef]
- Mazid, A.; Kirmani, S.; Manaullah; Yadav, M. FL-IDPP: A Federated Learning Based Intrusion Detection Approach With Privacy Preservation. Trans. Emerg. Telecommun. Technol. 2024, 36, e70039. [Google Scholar] [CrossRef]
- Novikova, E.; Doynikova, E.; Golubev, S. Federated Learning for Intrusion Detection in the Critical Infrastructures: Vertically Partitioned Data Use Case. Algorithms 2022, 15, 104. [Google Scholar] [CrossRef]
- Moustafa, N.; Koroniotis, N.; Keshk, M.; Zomaya, A.Y.; Tari, Z. Explainable Intrusion Detection for Cyber Defences in the Internet of Things: Opportunities and Solutions. IEEE Commun. Surv. Tutor. 2023, 25, 1775–1807. [Google Scholar] [CrossRef]
- Al-Marri, N.A.A.A.; Ciftler, B.S.; Abdallah, M.M. Federated mimic learning for privacy preserving intrusion detection. In Proceedings of the 2020 IEEE international black sea conference on communications and networking (BlackSeaCom), Odessa, Ukraine, 26–29 May 2020; pp. 1–6. [Google Scholar] [CrossRef]
- Aouedi, O.; Piamrat, K. F-BIDS: Federated-Blending based Intrusion Detection System. Pervasive Mob. Comput. 2023, 89, 101750. [Google Scholar] [CrossRef]
- Neto, E.C.P.; Dadkhah, S.; Ferreira, R.; Zohourian, A.; Lu, R.; Ghorbani, A.A. CICIoT2023: A Real-Time Dataset and Benchmark for Large-Scale Attacks in IoT Environment. Sensors 2023, 23, 5941. [Google Scholar] [CrossRef]
- Garcia, S.; Parmisano, A.; Erquiaga, M.J. IoT-23: A Labeled Dataset with Malicious and Benign IoT network traffic. 2020. Available online: https://data.niaid.nih.gov/resources?id=zenodo_4743745 (accessed on 15 April 2025). [CrossRef]
- Moustafa, N. A new distributed architecture for evaluating AI-based security systems at the edge: Network TON-IoT datasets. Sustain. Cities Soc. 2021, 72, 102994. [Google Scholar] [CrossRef]
- Rapid7. Metasploit. Open-Source Penetration Testing Framework. Available online: https://www.metasploit.com/ (accessed on 15 April 2025).
- Philippe Biondi and Contributors. Scapy. Available online: https://scapy.net/ (accessed on 15 April 2025).
- epsylon. UFONet: Tool for Launching DDoS Attacks via Botnets. Available online: https://github.com/epsylon/ufonet (accessed on 15 April 2025).
- Ettercap Project. Ettercap: Comprehensive Suite for Man-in-the-Middle Attacks. Available online: https://www.ettercap-project.org/ (accessed on 15 April 2025).
- Tenable, Inc. Nessus Vulnerability Scanner. Commercial Vulnerability Assessment Tool. Available online: https://www.tenable.com/products/nessus (accessed on 15 April 2025).
- Nmap Project. Nmap. Network Exploration and Security Auditing Tool. Available online: https://nmap.org/ (accessed on 15 April 2025).
- van Hauser/THC. Hydra. Fast and Flexible Password Cracking Tool. Available online: https://github.com/vanhauser-thc/thc-hydra (accessed on 15 April 2025).
- Robin Wood. CeWL—Custom Word List Generator. Website Crawler for Generating Custom Wordlists. Available online: https://github.com/digininja/CeWL (accessed on 15 April 2025).
- epsylon. XSSer. Automated Framework to Detect and Exploit XSS Vulnerabilities. Available online: https://github.com/epsylon/xsser (accessed on 15 April 2025).
- Klauser, T.; Borkmann, D. Netsniff-ng: The Packet Sniffing Beast. Available online: https://manpages.ubuntu.com/manpages/focal/man8/netsniff-ng.8.html (accessed on 15 April 2025).
- Zeek Project. Zeek (formerly Bro). Network Security Monitoring Tool. Available online: https://zeek.org/ (accessed on 15 April 2025).
- Zeek Community. Zeek Docker. Zeek’s Official Docker Container Repository. Available online: https://github.com/zeek/zeek-docker (accessed on 15 April 2025).
- Scikit-Learn Contributors. LabelEncoder Documentation. Official Documentation for LabelEncoder in Scikit-Learn. Available online: https://scikit-learn.org/stable/modules/generated/sklearn.preprocessing.LabelEncoder.html (accessed on 15 April 2025).
- Scikit-Learn Contributors. RobustScaler Documentation in Scikit-Learn. 2022. Available online: https://scikit-learn.org/stable/modules/generated/sklearn.preprocessing.RobustScaler.html (accessed on 15 April 2025).
- Chawla, N.V.; Bowyer, K.W.; Hall, L.O.; Kegelmeyer, W.P. SMOTE: Synthetic Minority Over-sampling Technique. J. Artif. Intell. Res. 2002, 16, 321–357. [Google Scholar] [CrossRef]
- Biswas, A.; Nasim, M.A.A.; Imran, A.; Sejuty, A.T.; Fairooz, F.; Puppala, S.; Talukder, S. Generative Adversarial Networks for Data Augmentation. arXiv 2023. [Google Scholar] [CrossRef]
- The Pandas Development Team. pandas.resample Documentation. Available online: https://pandas.pydata.org/pandas-docs/stable/reference/api/pandas.DataFrame.resample.html (accessed on 15 April 2025).
- The Pandas Development Team. Official Pandas Aggregation Documentation. Available online: https://pandas.pydata.org/pandas-docs/stable/reference/api/pandas.DataFrame.agg.html (accessed on 15 April 2025).
- Zhao, X.; Wang, L.; Zhang, Y.; Han, X.; Deveci, M.; Parmar, M. A review of convolutional neural networks in computer vision. Artif. Intell. Rev. 2024, 57, 99. [Google Scholar] [CrossRef]
- Terzi, D. Gramian Angular Field Transformation-Based Intrusion Detection. Comput. Sci. 2022, 23. [Google Scholar] [CrossRef]
- Zhang, R.; Zheng, F.; Min, W. Sequential Behavioral Data Processing Using Deep Learning and the Markov Transition Field in Online Fraud Detection. arXiv 2018. [Google Scholar] [CrossRef]
- Python Software Foundation. PIL (Python Imaging Library). Available online: https://python-pillow.org/ (accessed on 15 April 2025).
- Leesakul, N.; Morisset, C. Position Paper: The role of law in achieving privacy and security measures in smart buildings from the GDPR context. In Proceedings of the 2023 IEEE European Symposium on Security and Privacy Workshops (EuroS&PW), Delft, The Netherlands, 3–7 July 2023; pp. 619–626. [Google Scholar] [CrossRef]
- Shanmugamani, R. Deep Learning for Computer Vision; Comprehensive Guide to Deep Learning for Computer Vision Applications; Packt Publishing: Birmingham, UK, 2018. [Google Scholar]
- Abadi, M.; Agarwal, A.; Barham, P.; Brevdo, E.; Chen, Z.; Citro, C.; Corrado, G.S.; Davis, A.; Dean, J.; Devin, M.; et al. TensorFlow: Large-Scale Machine Learning on Heterogeneous Distributed Systems. arXiv 2016, arXiv:1603.04467. [Google Scholar]
- Selvaraju, R.R.; Cogswell, M.; Das, A.; Vedantam, R.; Parikh, D.; Batra, D. Grad-CAM: Visual Explanations from Deep Networks via Gradient-Based Localization. In Proceedings of the IEEE International Conference on Computer Vision (ICCV), Venice, Italy, 22–29 October 2017; pp. 618–626. [Google Scholar]
- Lundberg, S.M.; Lee, S.I. A Unified Approach to Interpreting Model Predictions. In Proceedings of the Advances in Neural Information Processing Systems; Curran Associates, Inc.: Red Hook, NY, USA, 2017; Volume 30. [Google Scholar]
- Ribeiro, M.T.; Singh, S.; Guestrin, C. “Why Should I Trust You?" Explaining the Predictions of Any Classifier. In Proceedings of the 22nd ACM SIGKDD International Conference on Knowledge Discovery and Data Mining, San Francisco, CA, USA, 13–17 August 2016; pp. 1135–1144. [Google Scholar]
- Beutel, A.; Topal, T.; Mathuria, A.; Lane, N.D. Flower: A Friendly Federated Learning Framework. arXiv 2020, arXiv:2007.14390. [Google Scholar]
- McMahan, H.B.; Moore, T.; Ramage, D.; Hampson, S.; Agüera y Arcas, B. TensorFlow Federated: Machine Learning on Decentralized Data. arXiv 2020, arXiv:2003.10535. [Google Scholar]
- Ruta, M. Experiment Results—DropBox. Available online: https://www.dropbox.com/scl/fo/ry61fbuua4lwjgpz3gmvj/h?rlkey=f4wiqfzb1ikv2z4095o2gctwn&dl=0 (accessed on 15 April 2025).
- Ogburn, M.; Turner, C.; Dahal, P. Homomorphic Encryption. Procedia Comput. Sci. 2013, 20, 502–509. [Google Scholar] [CrossRef]
- TensorFlow Federated: Secure Aggregator. Available online: https://www.tensorflow.org/federated/api_docs/python/tff/learning/secure_aggregator (accessed on 15 April 2025).
- TensorFlow Federated - API Documentation for PrivateQuantileEstimationProcess. Available online: https://www.tensorflow.org/federated/api_docs/python/tff/aggregators/PrivateQuantileEstimationProcess (accessed on 15 April 2025).
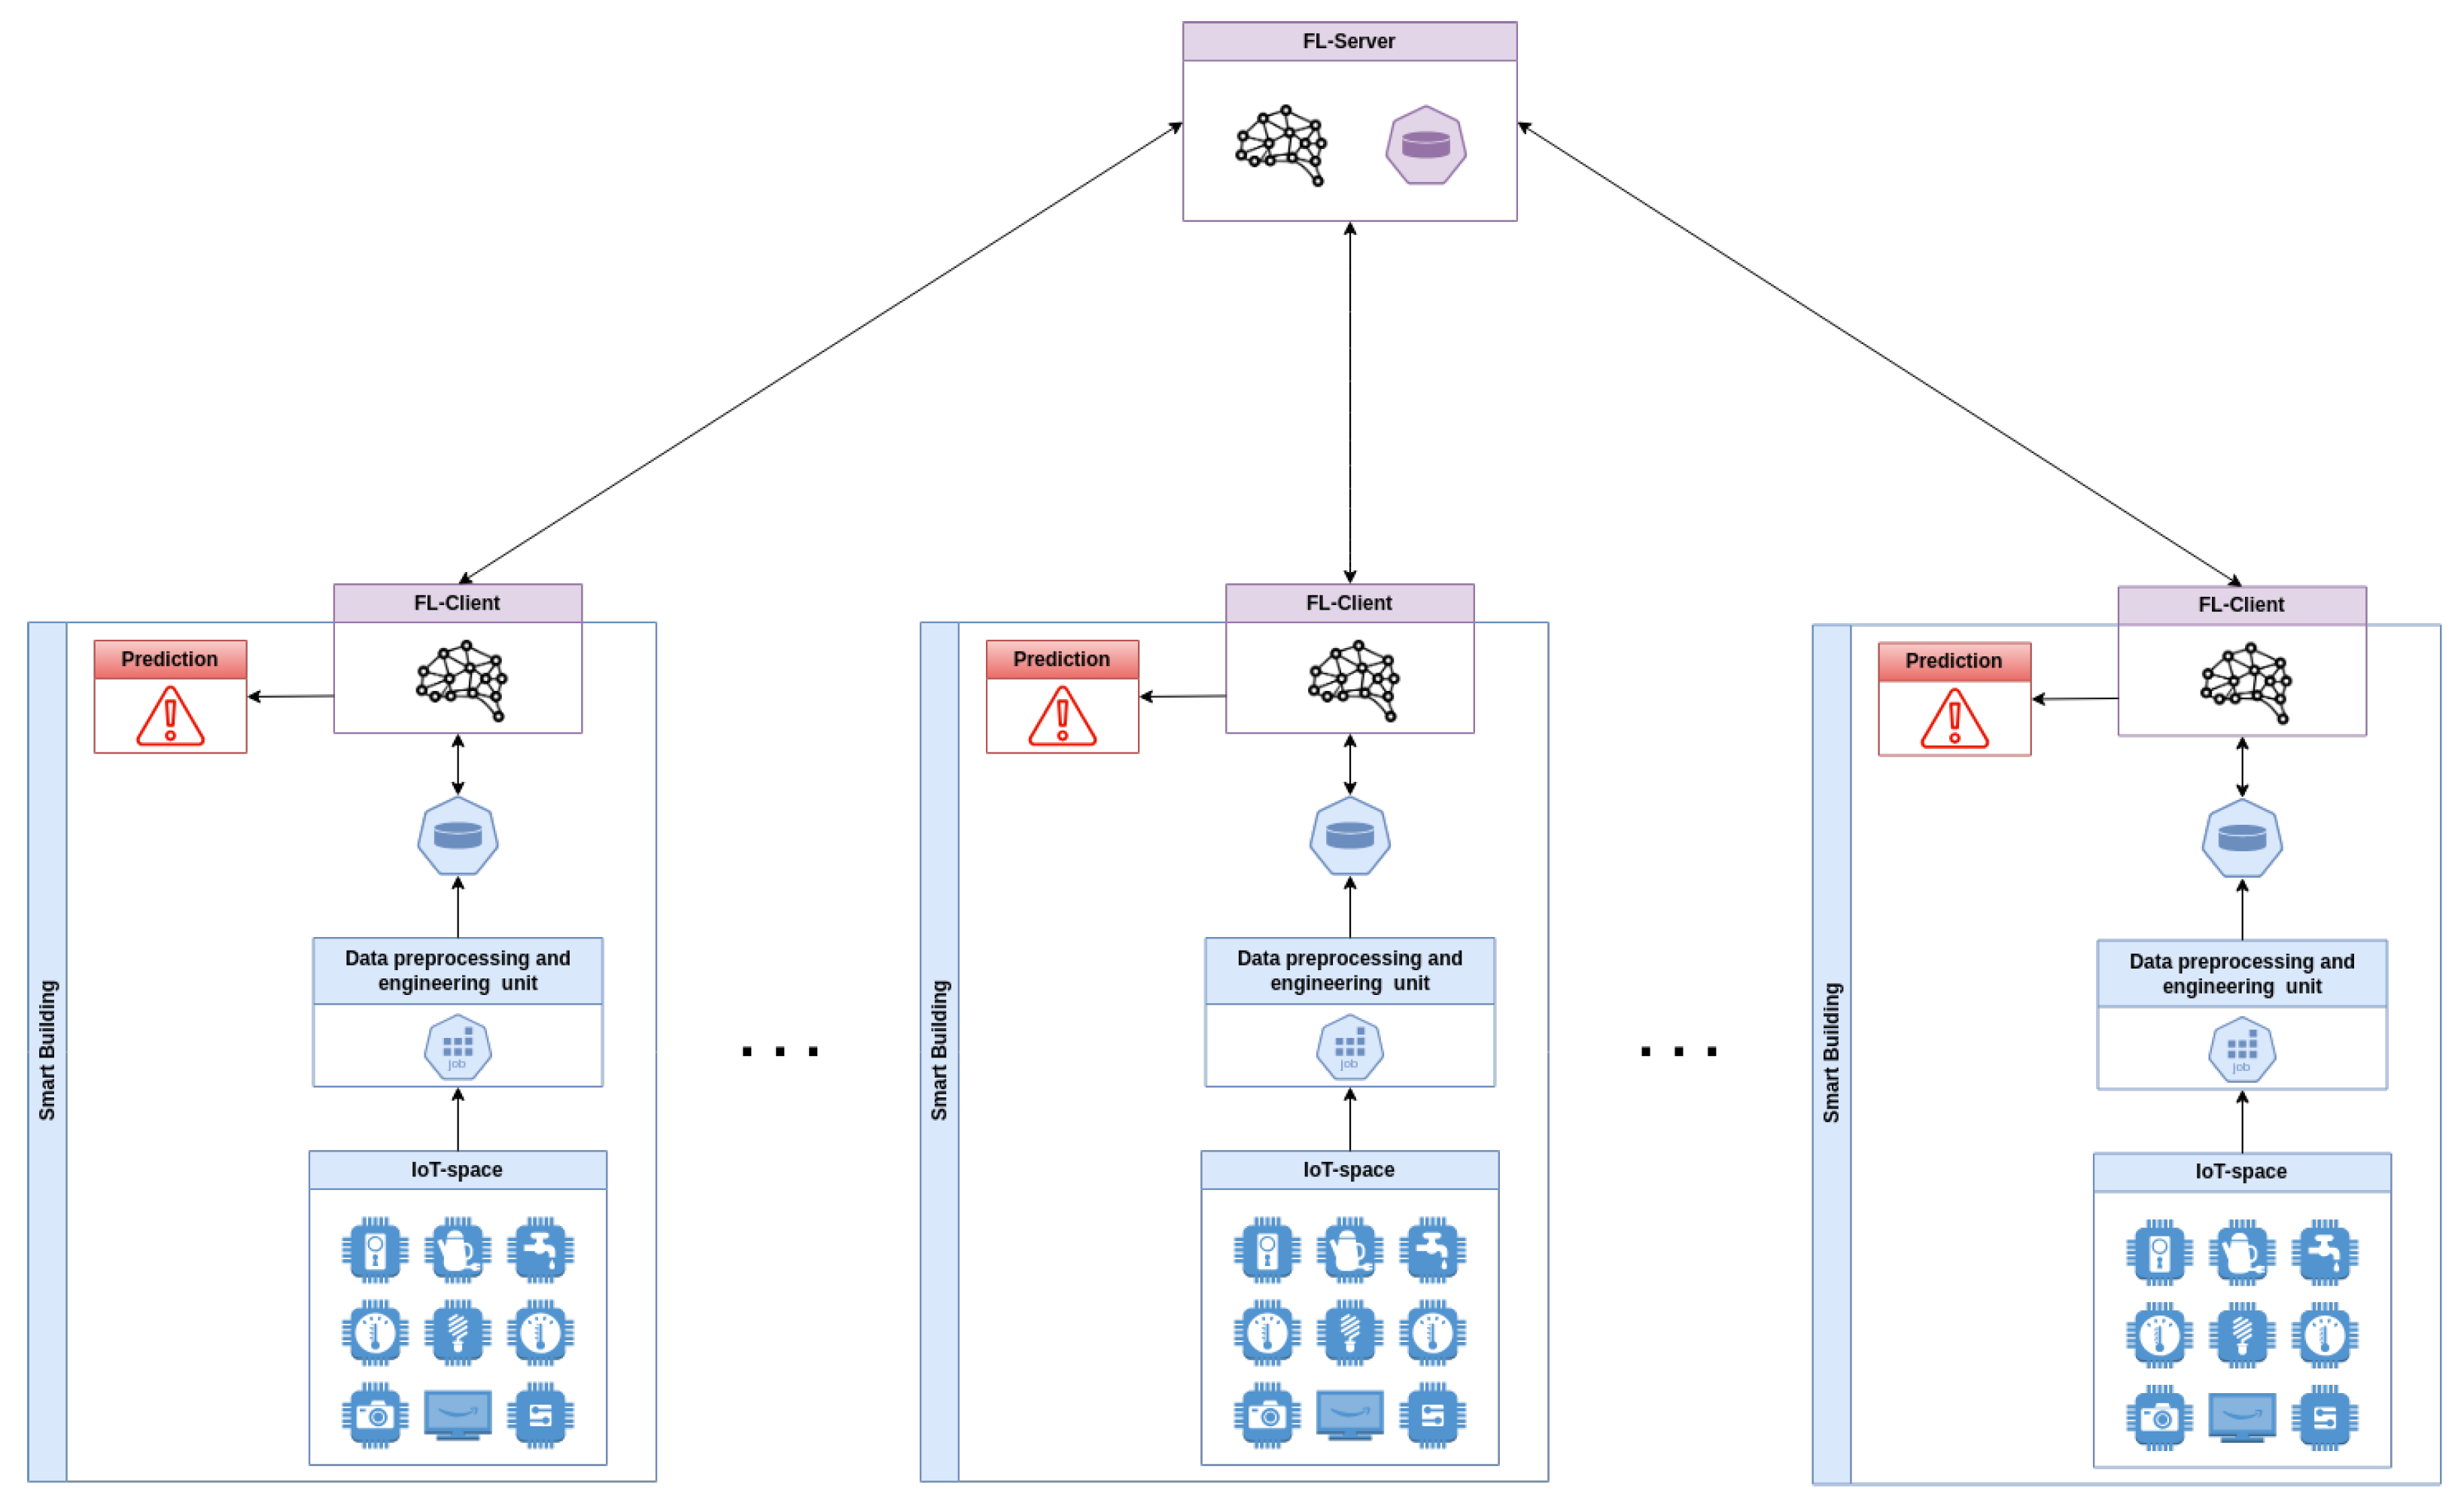
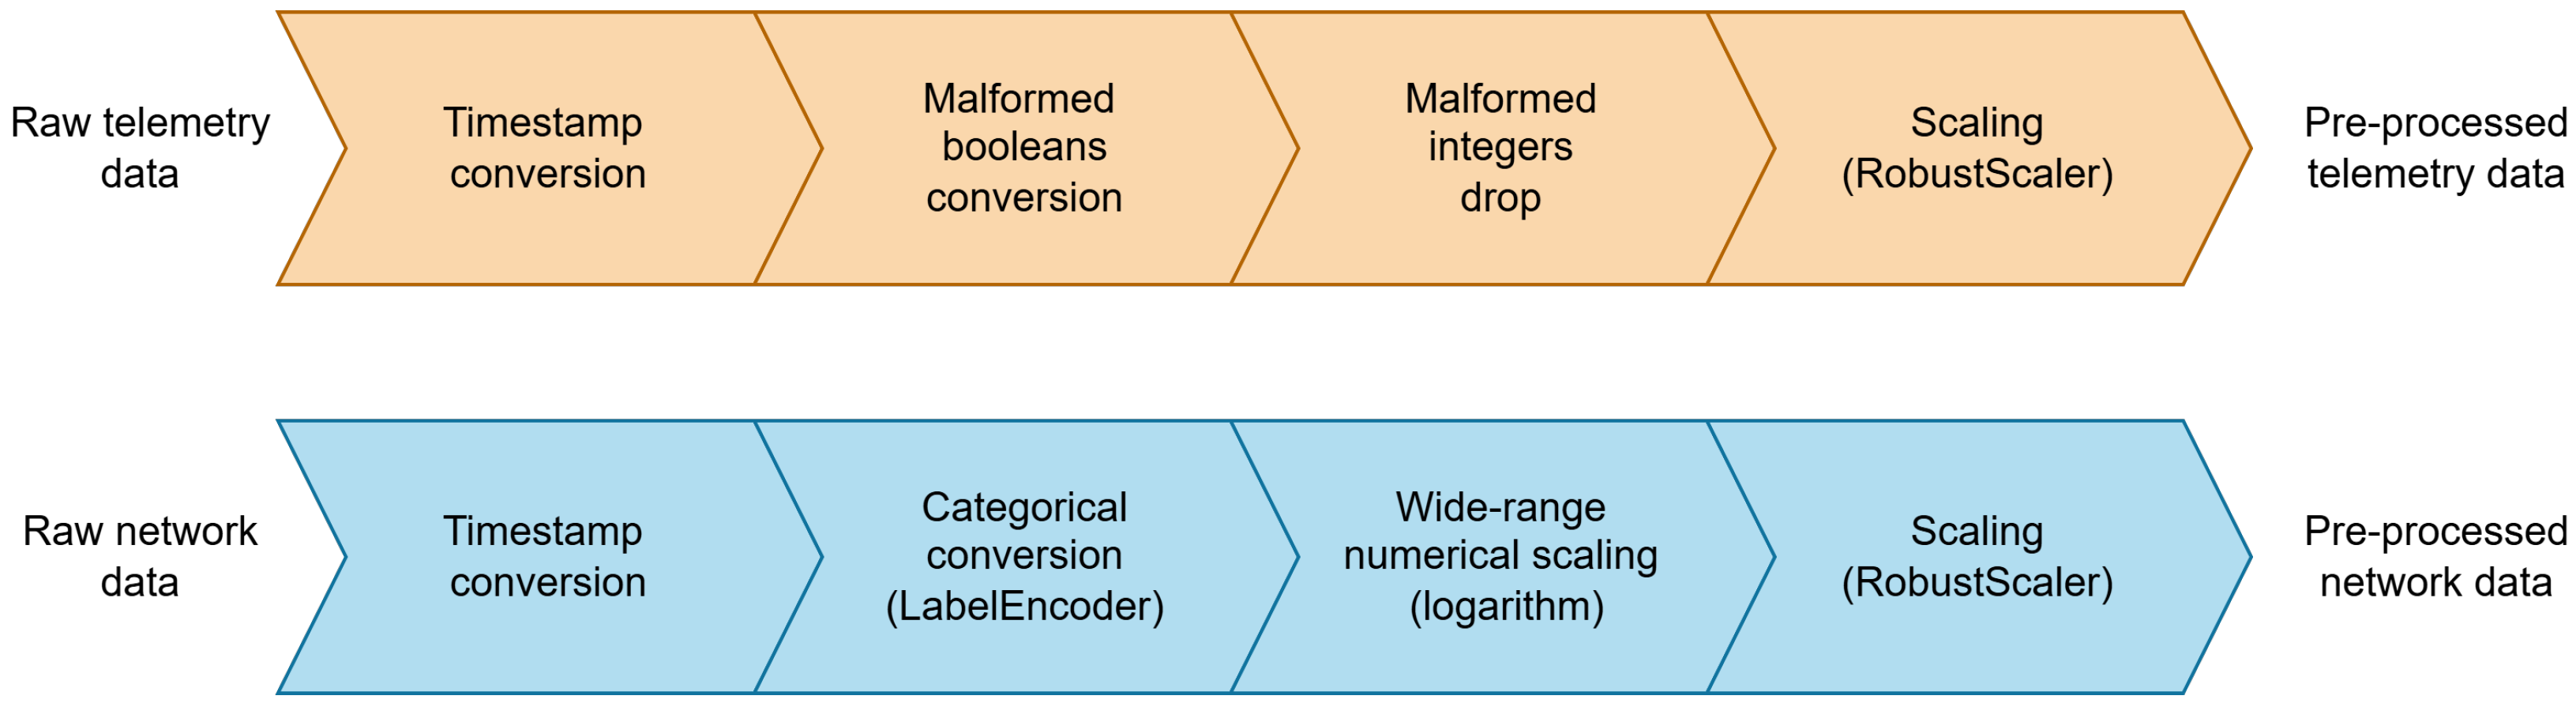

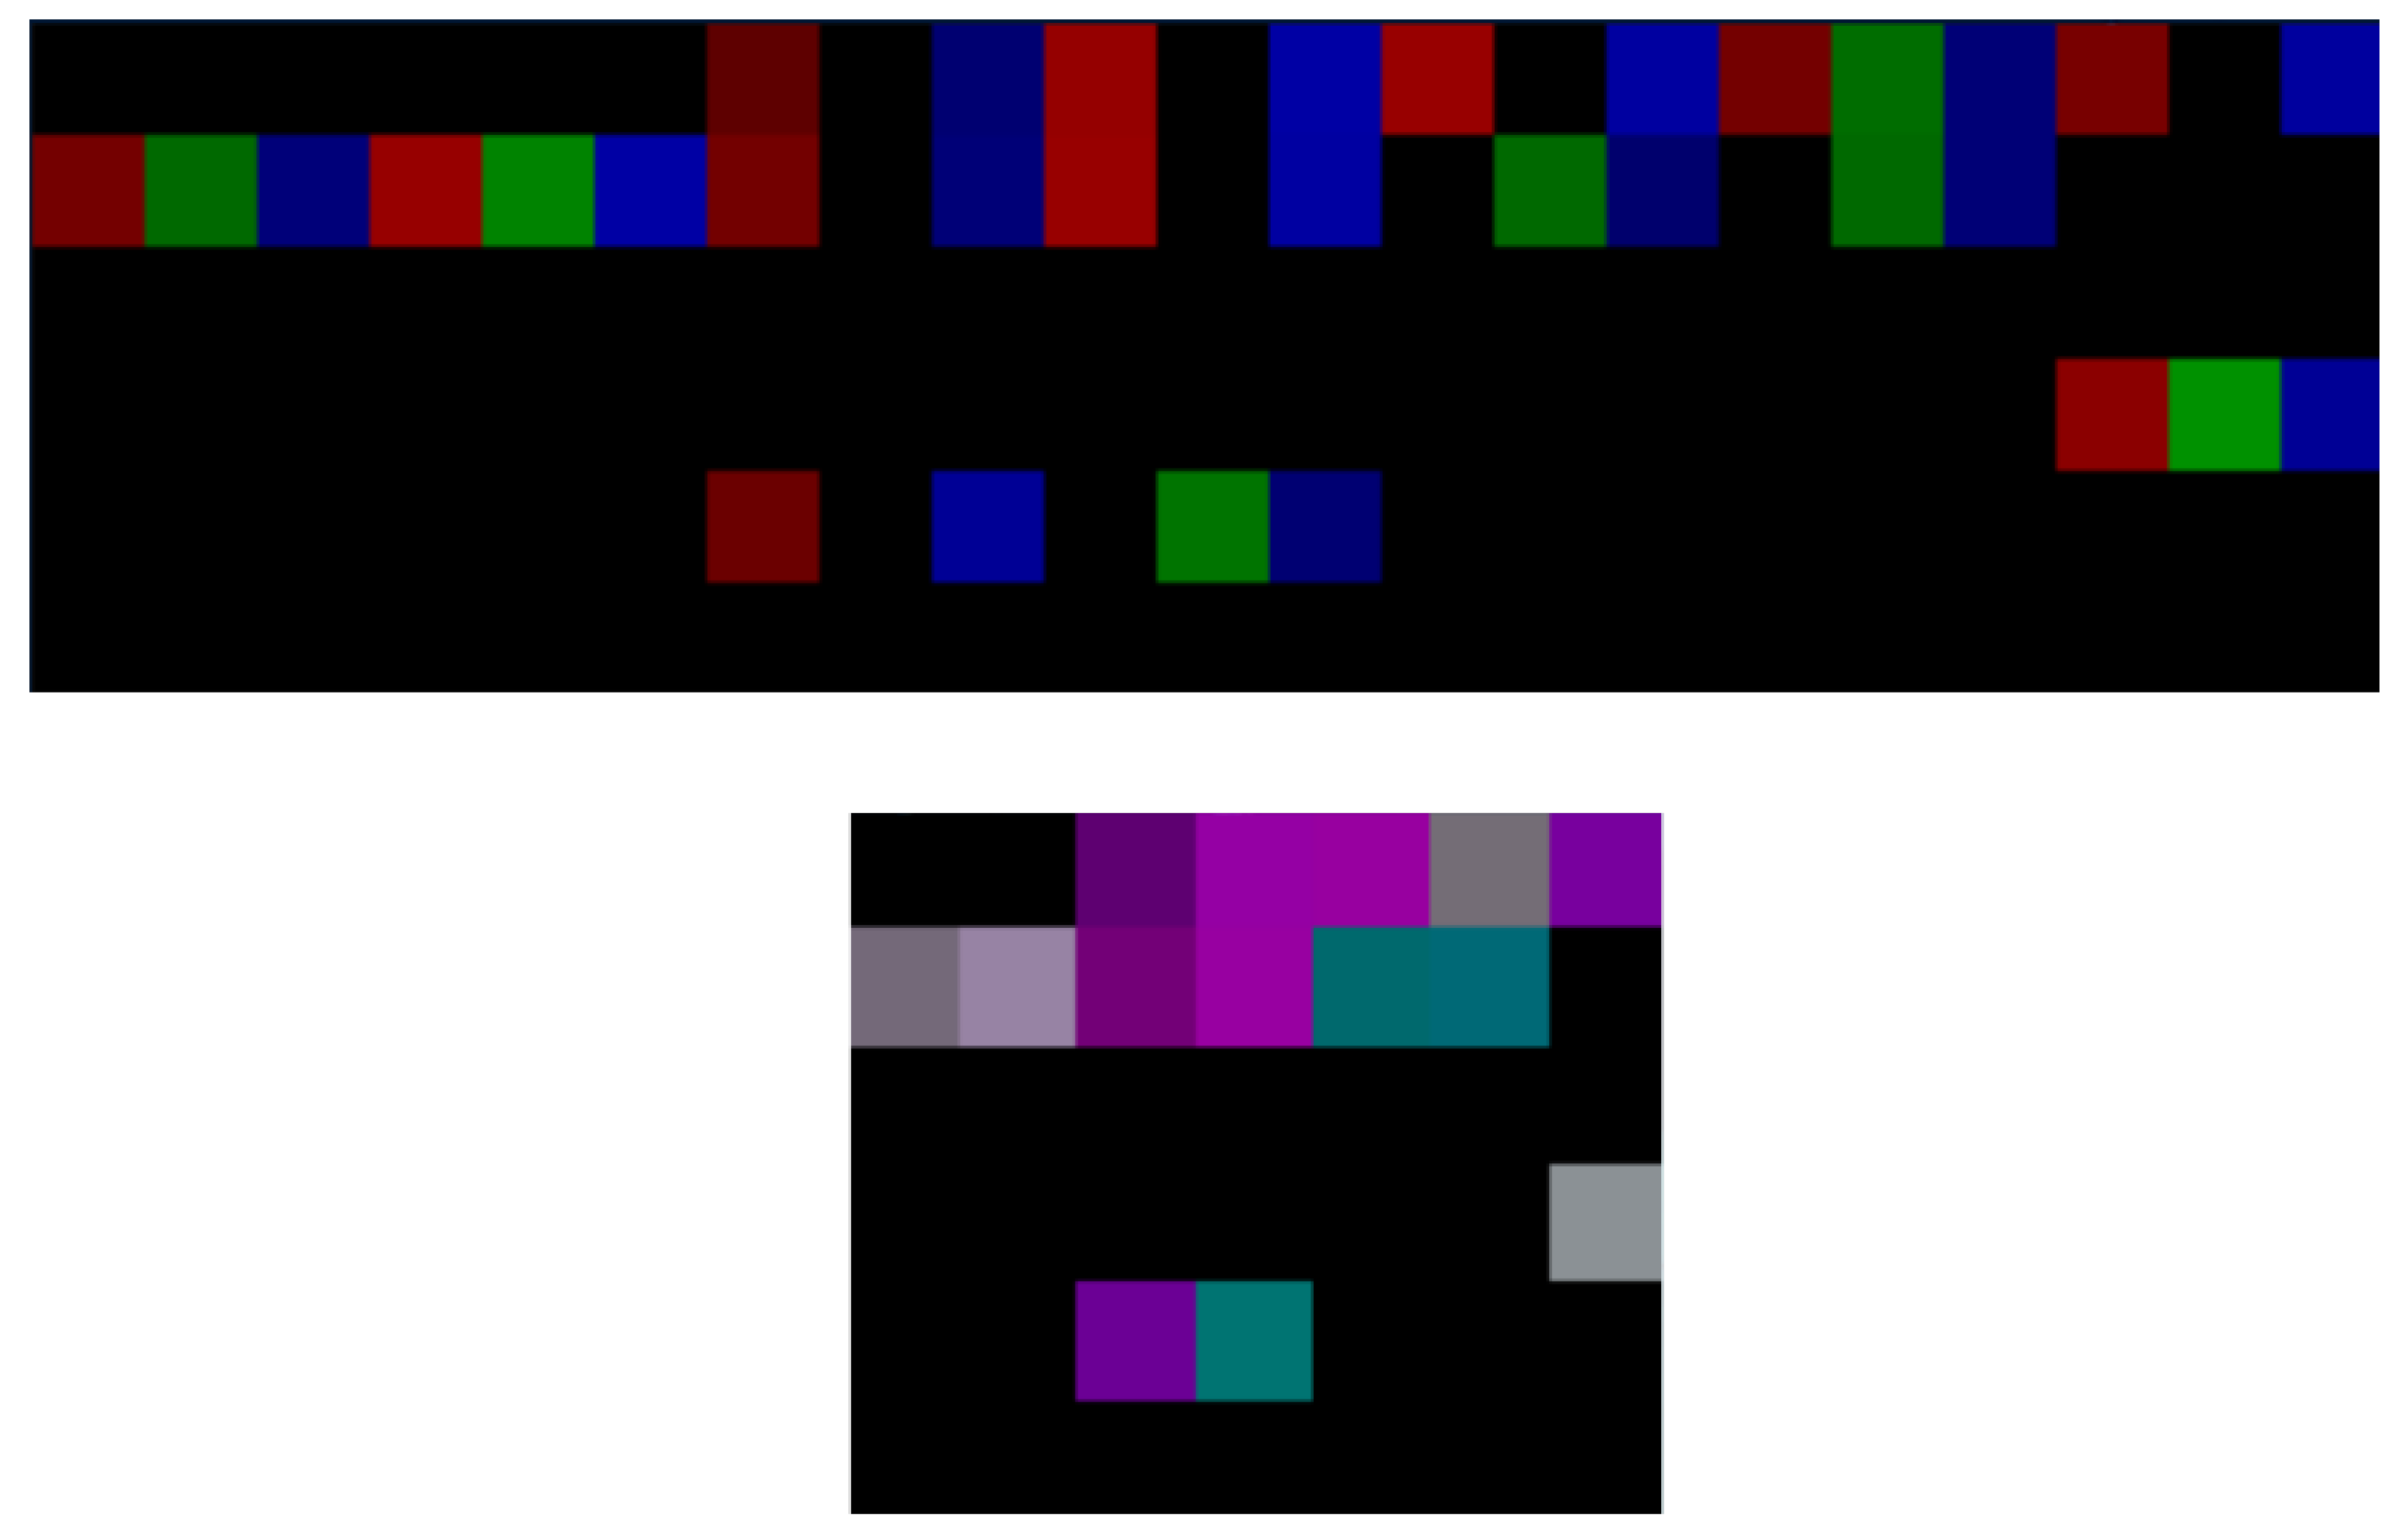
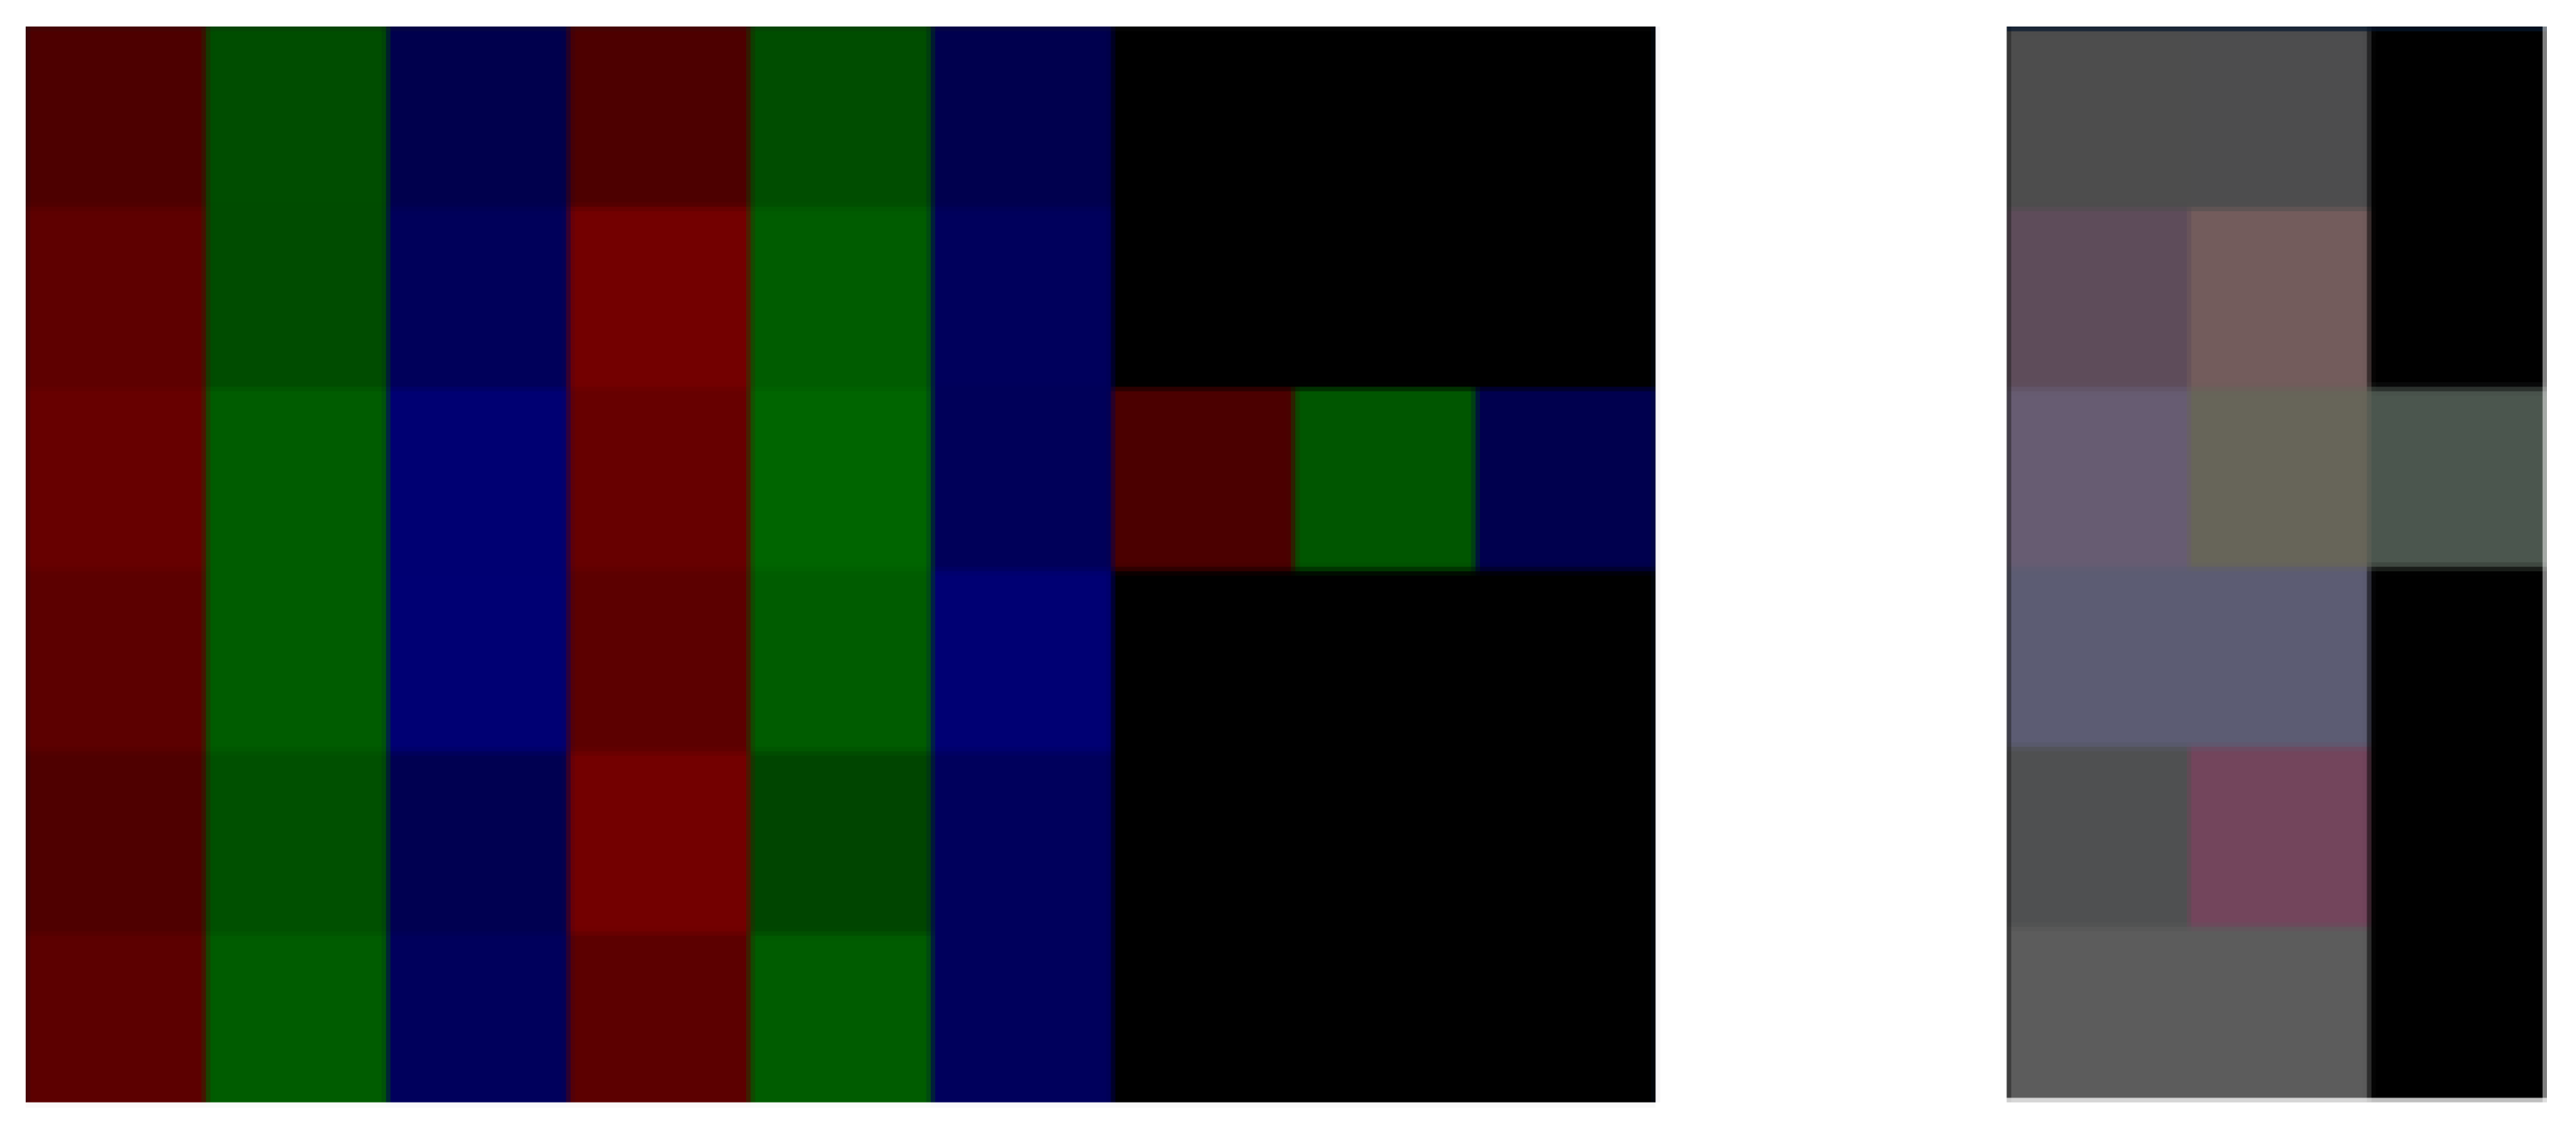


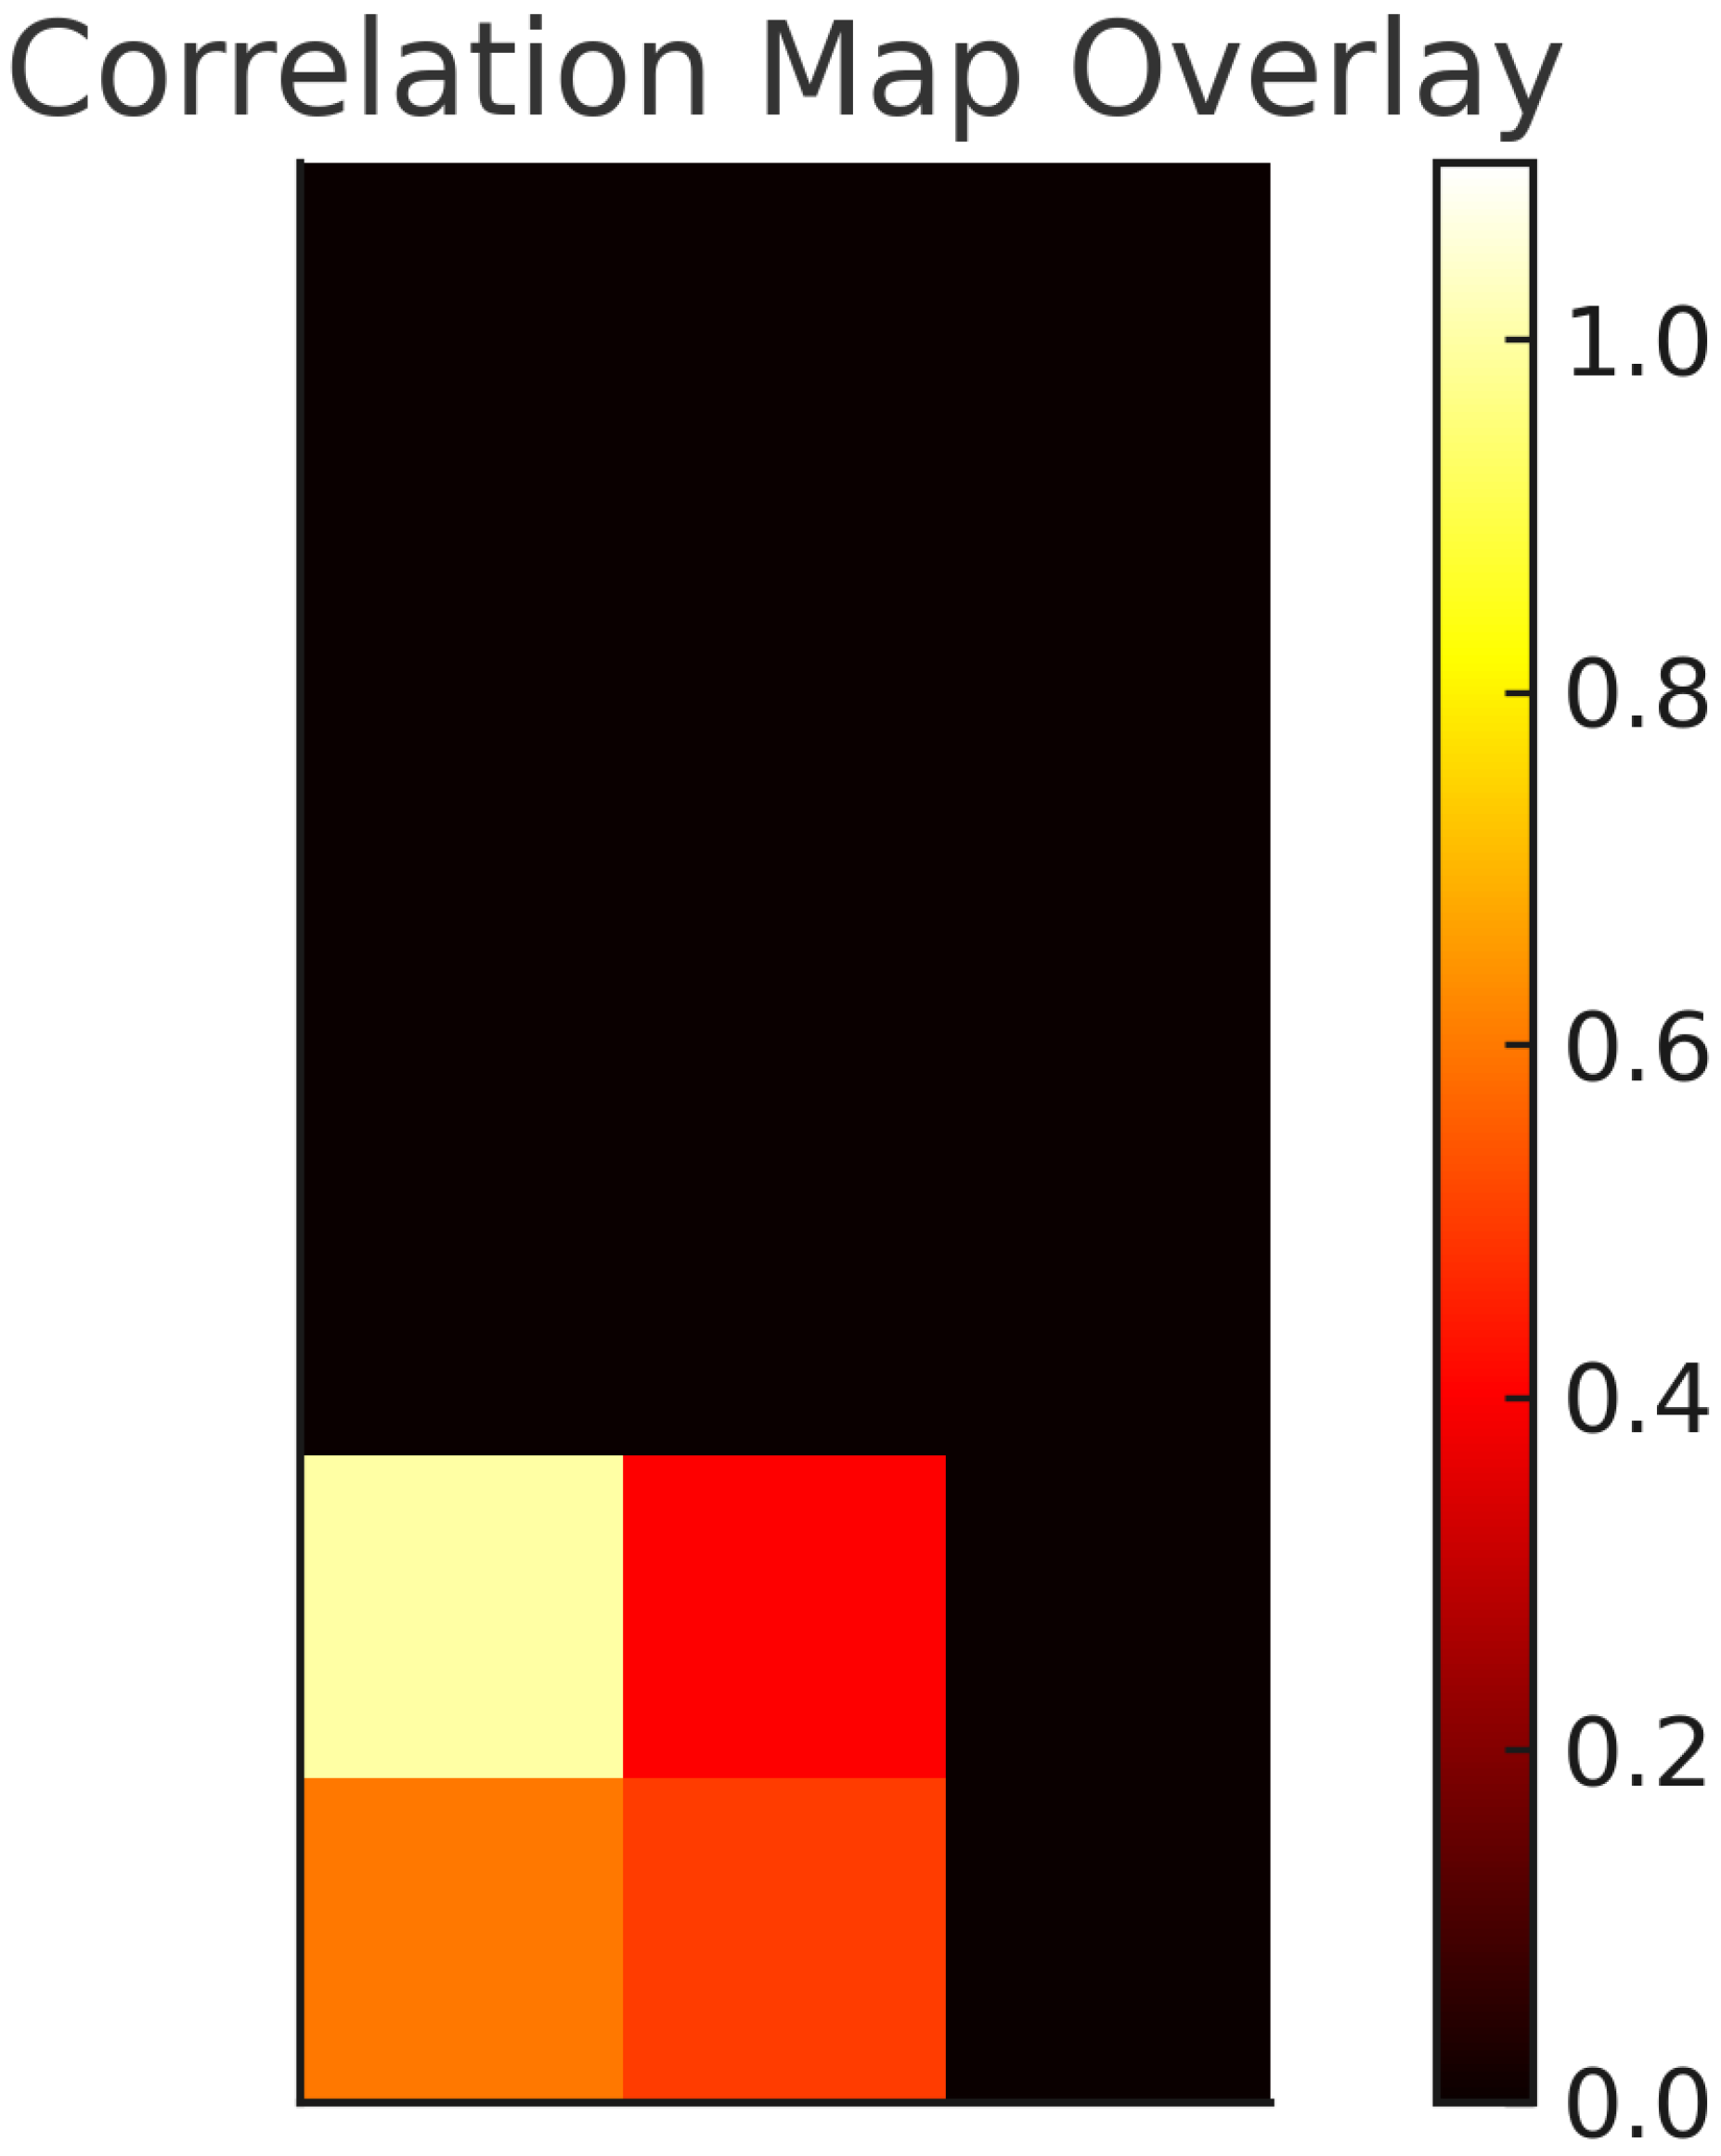


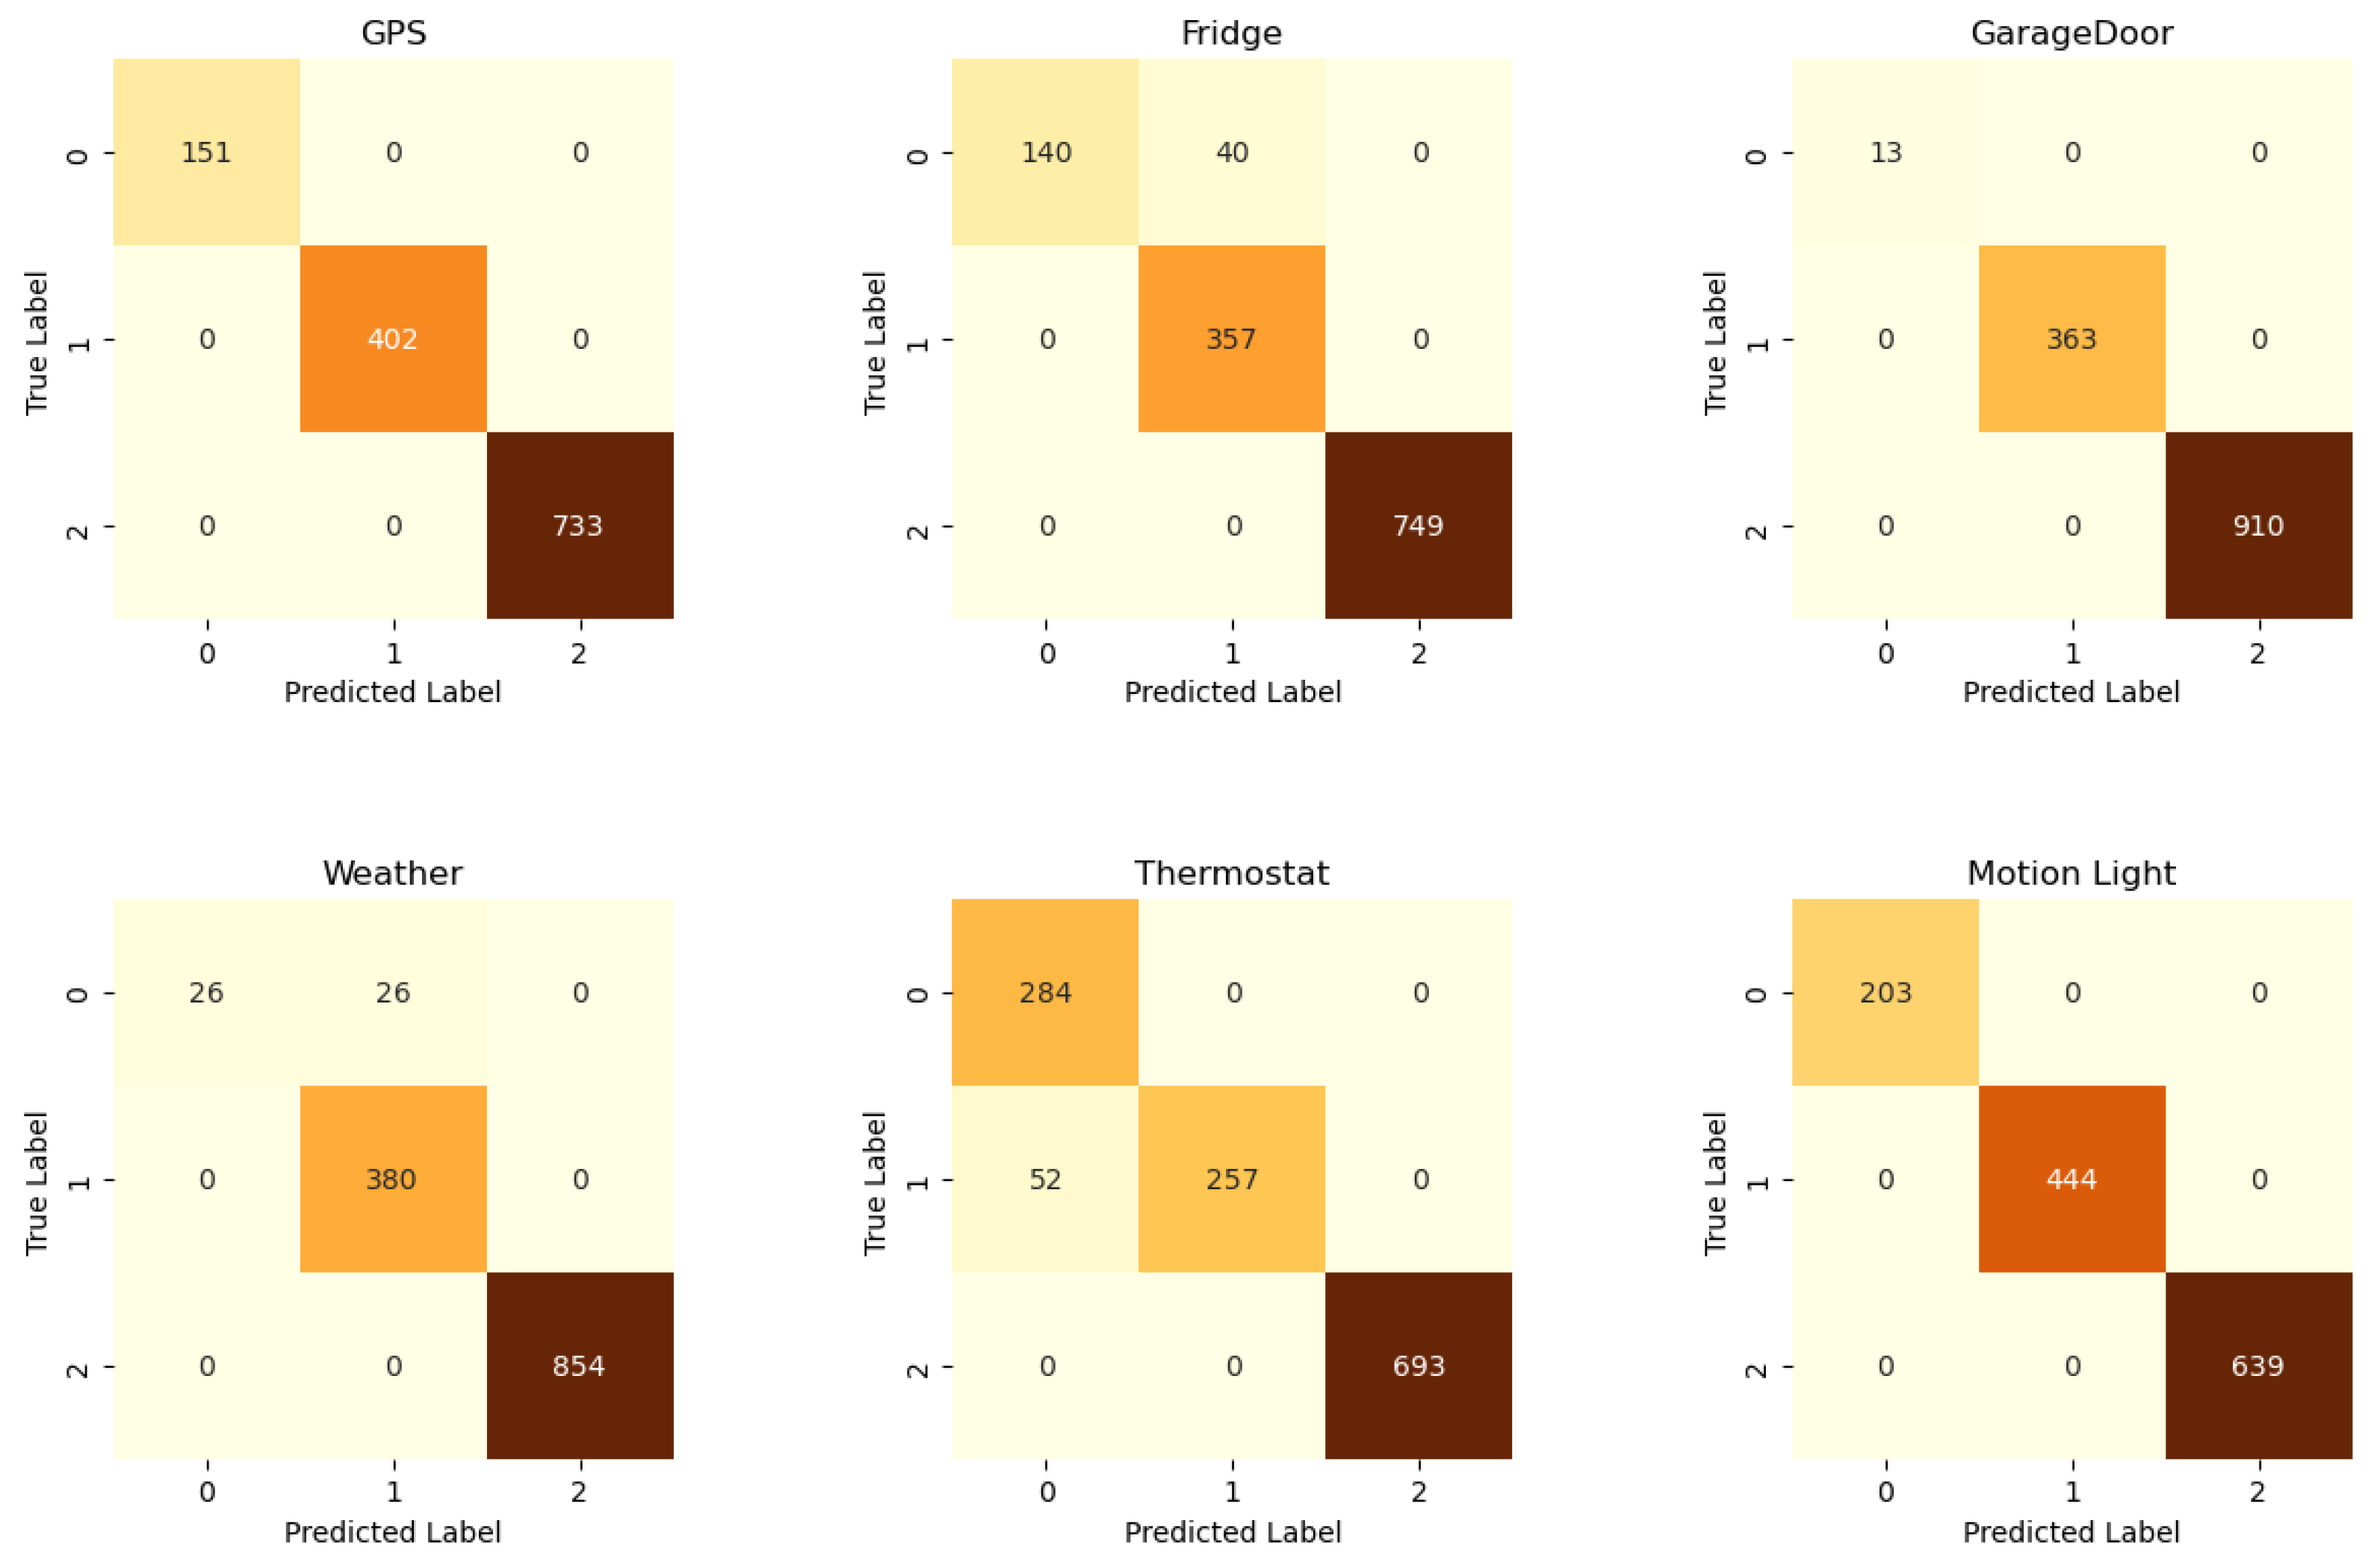
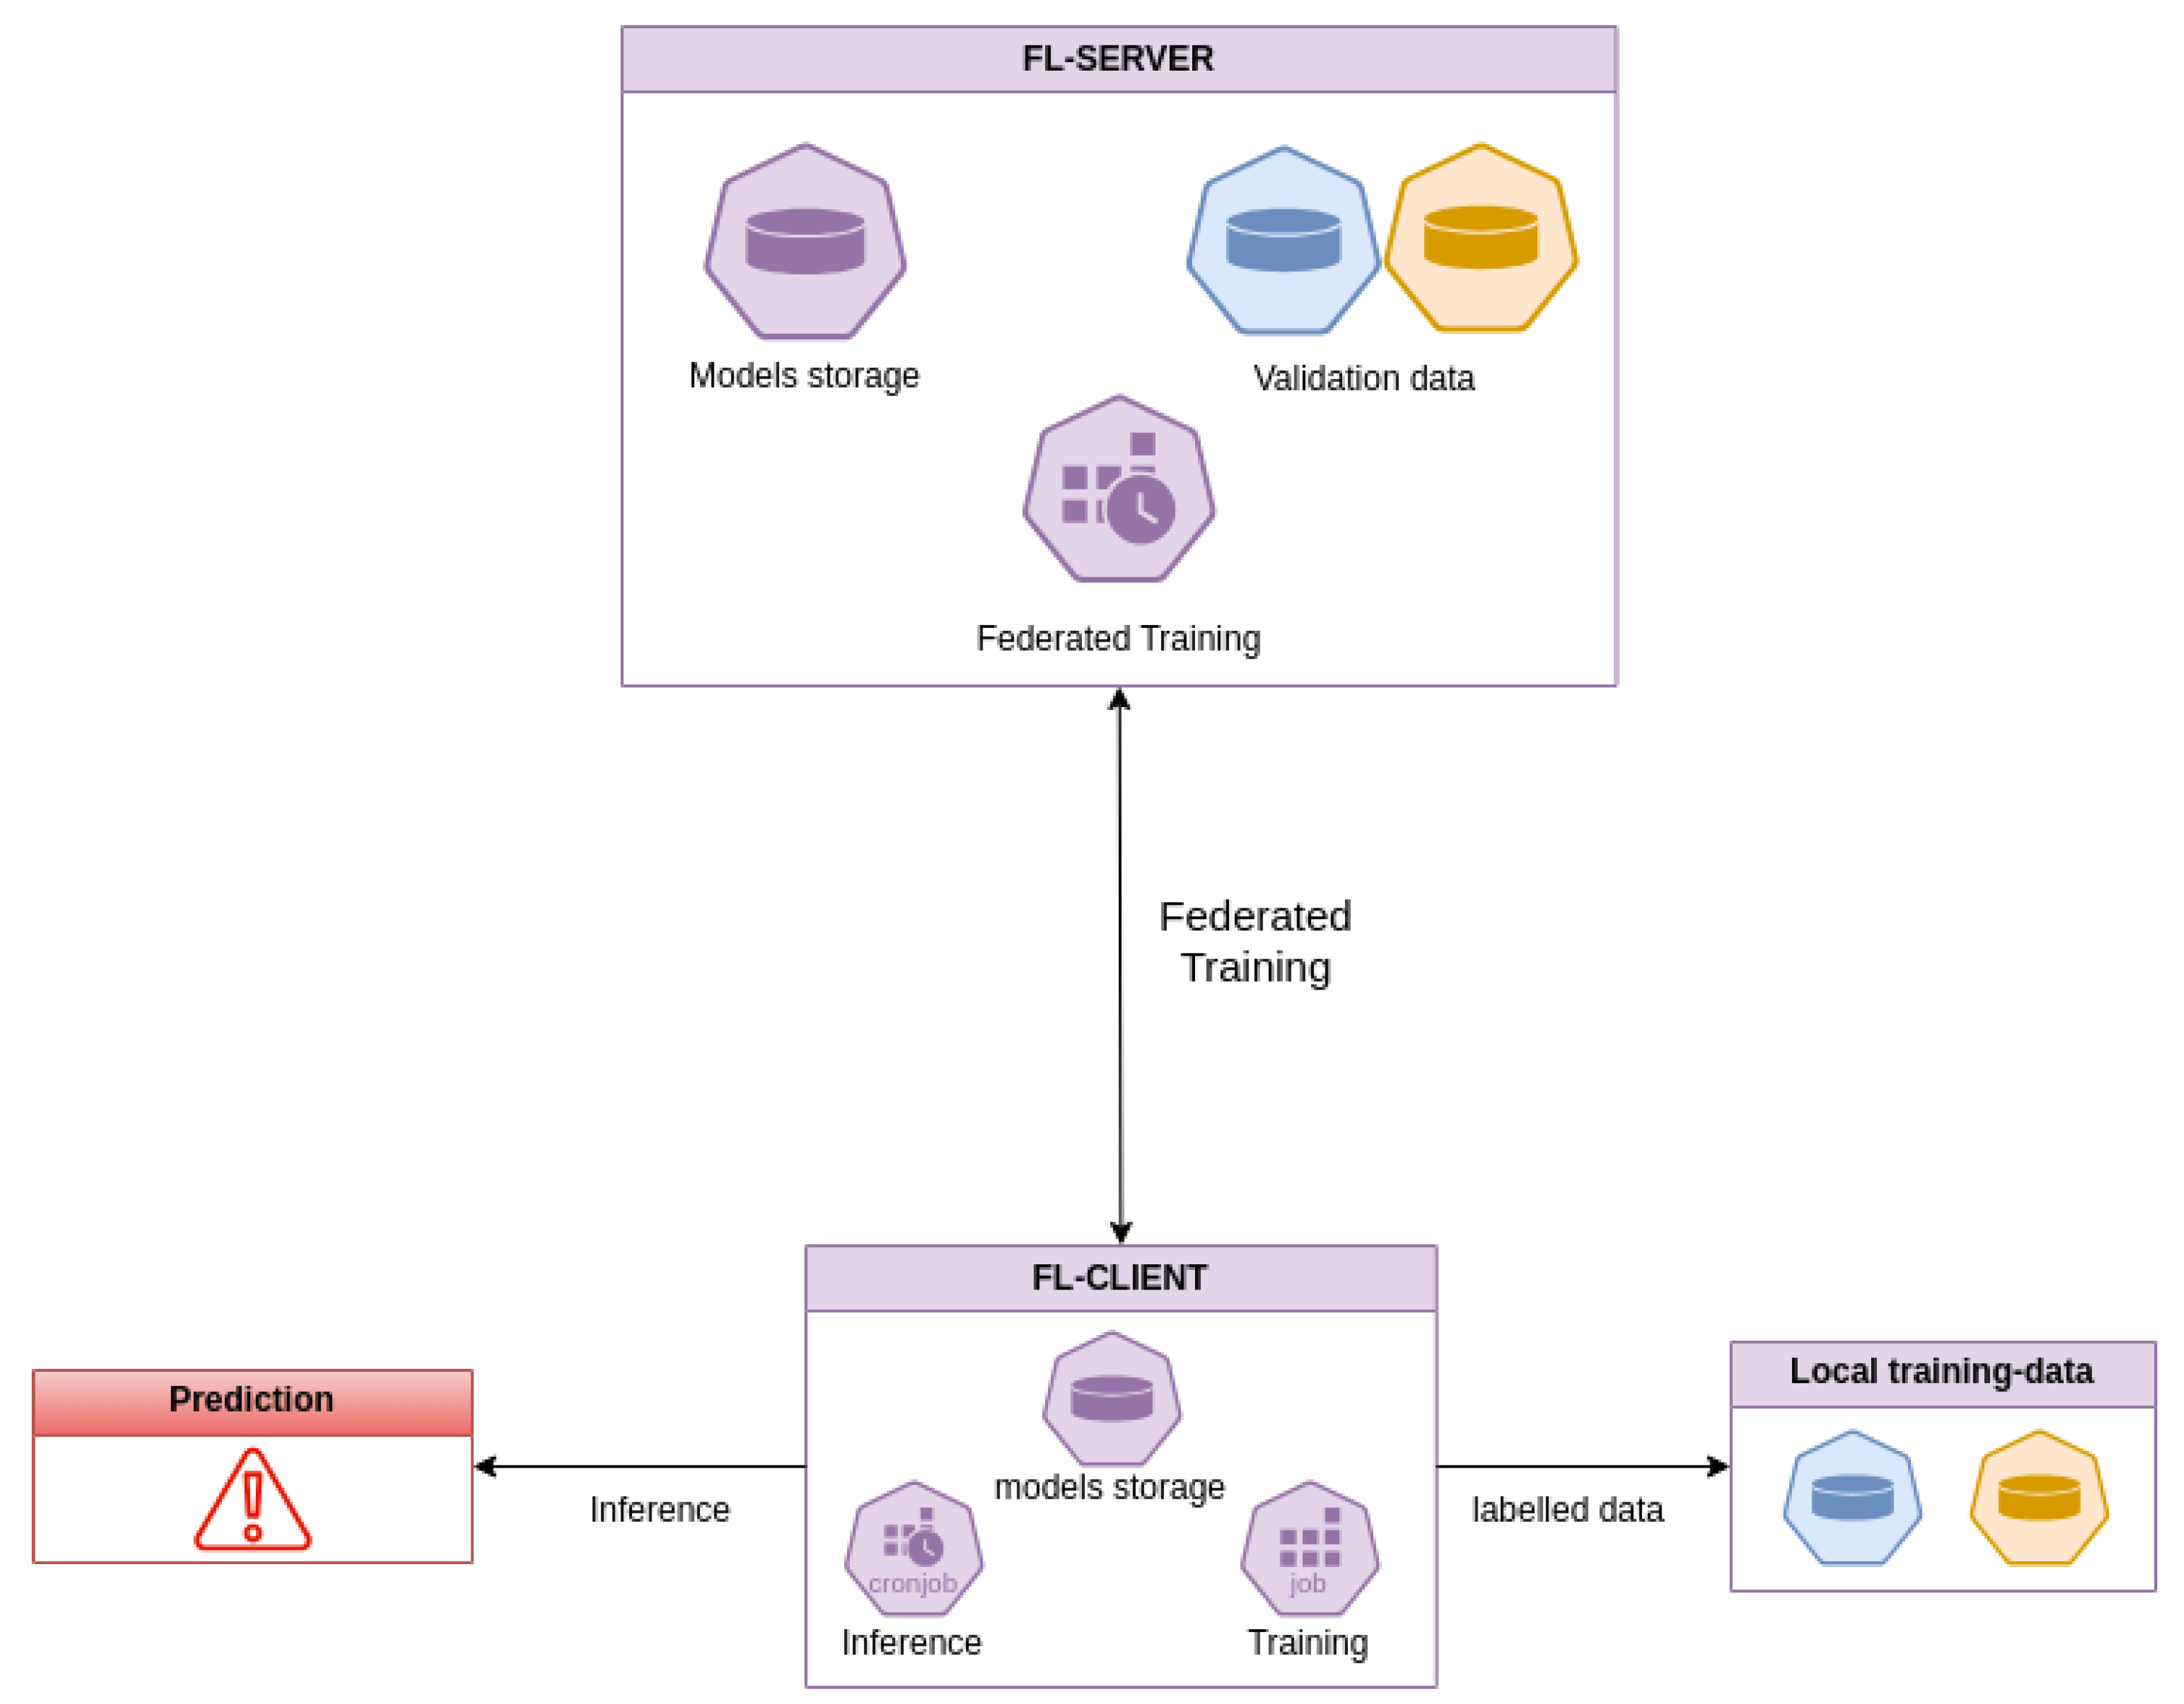
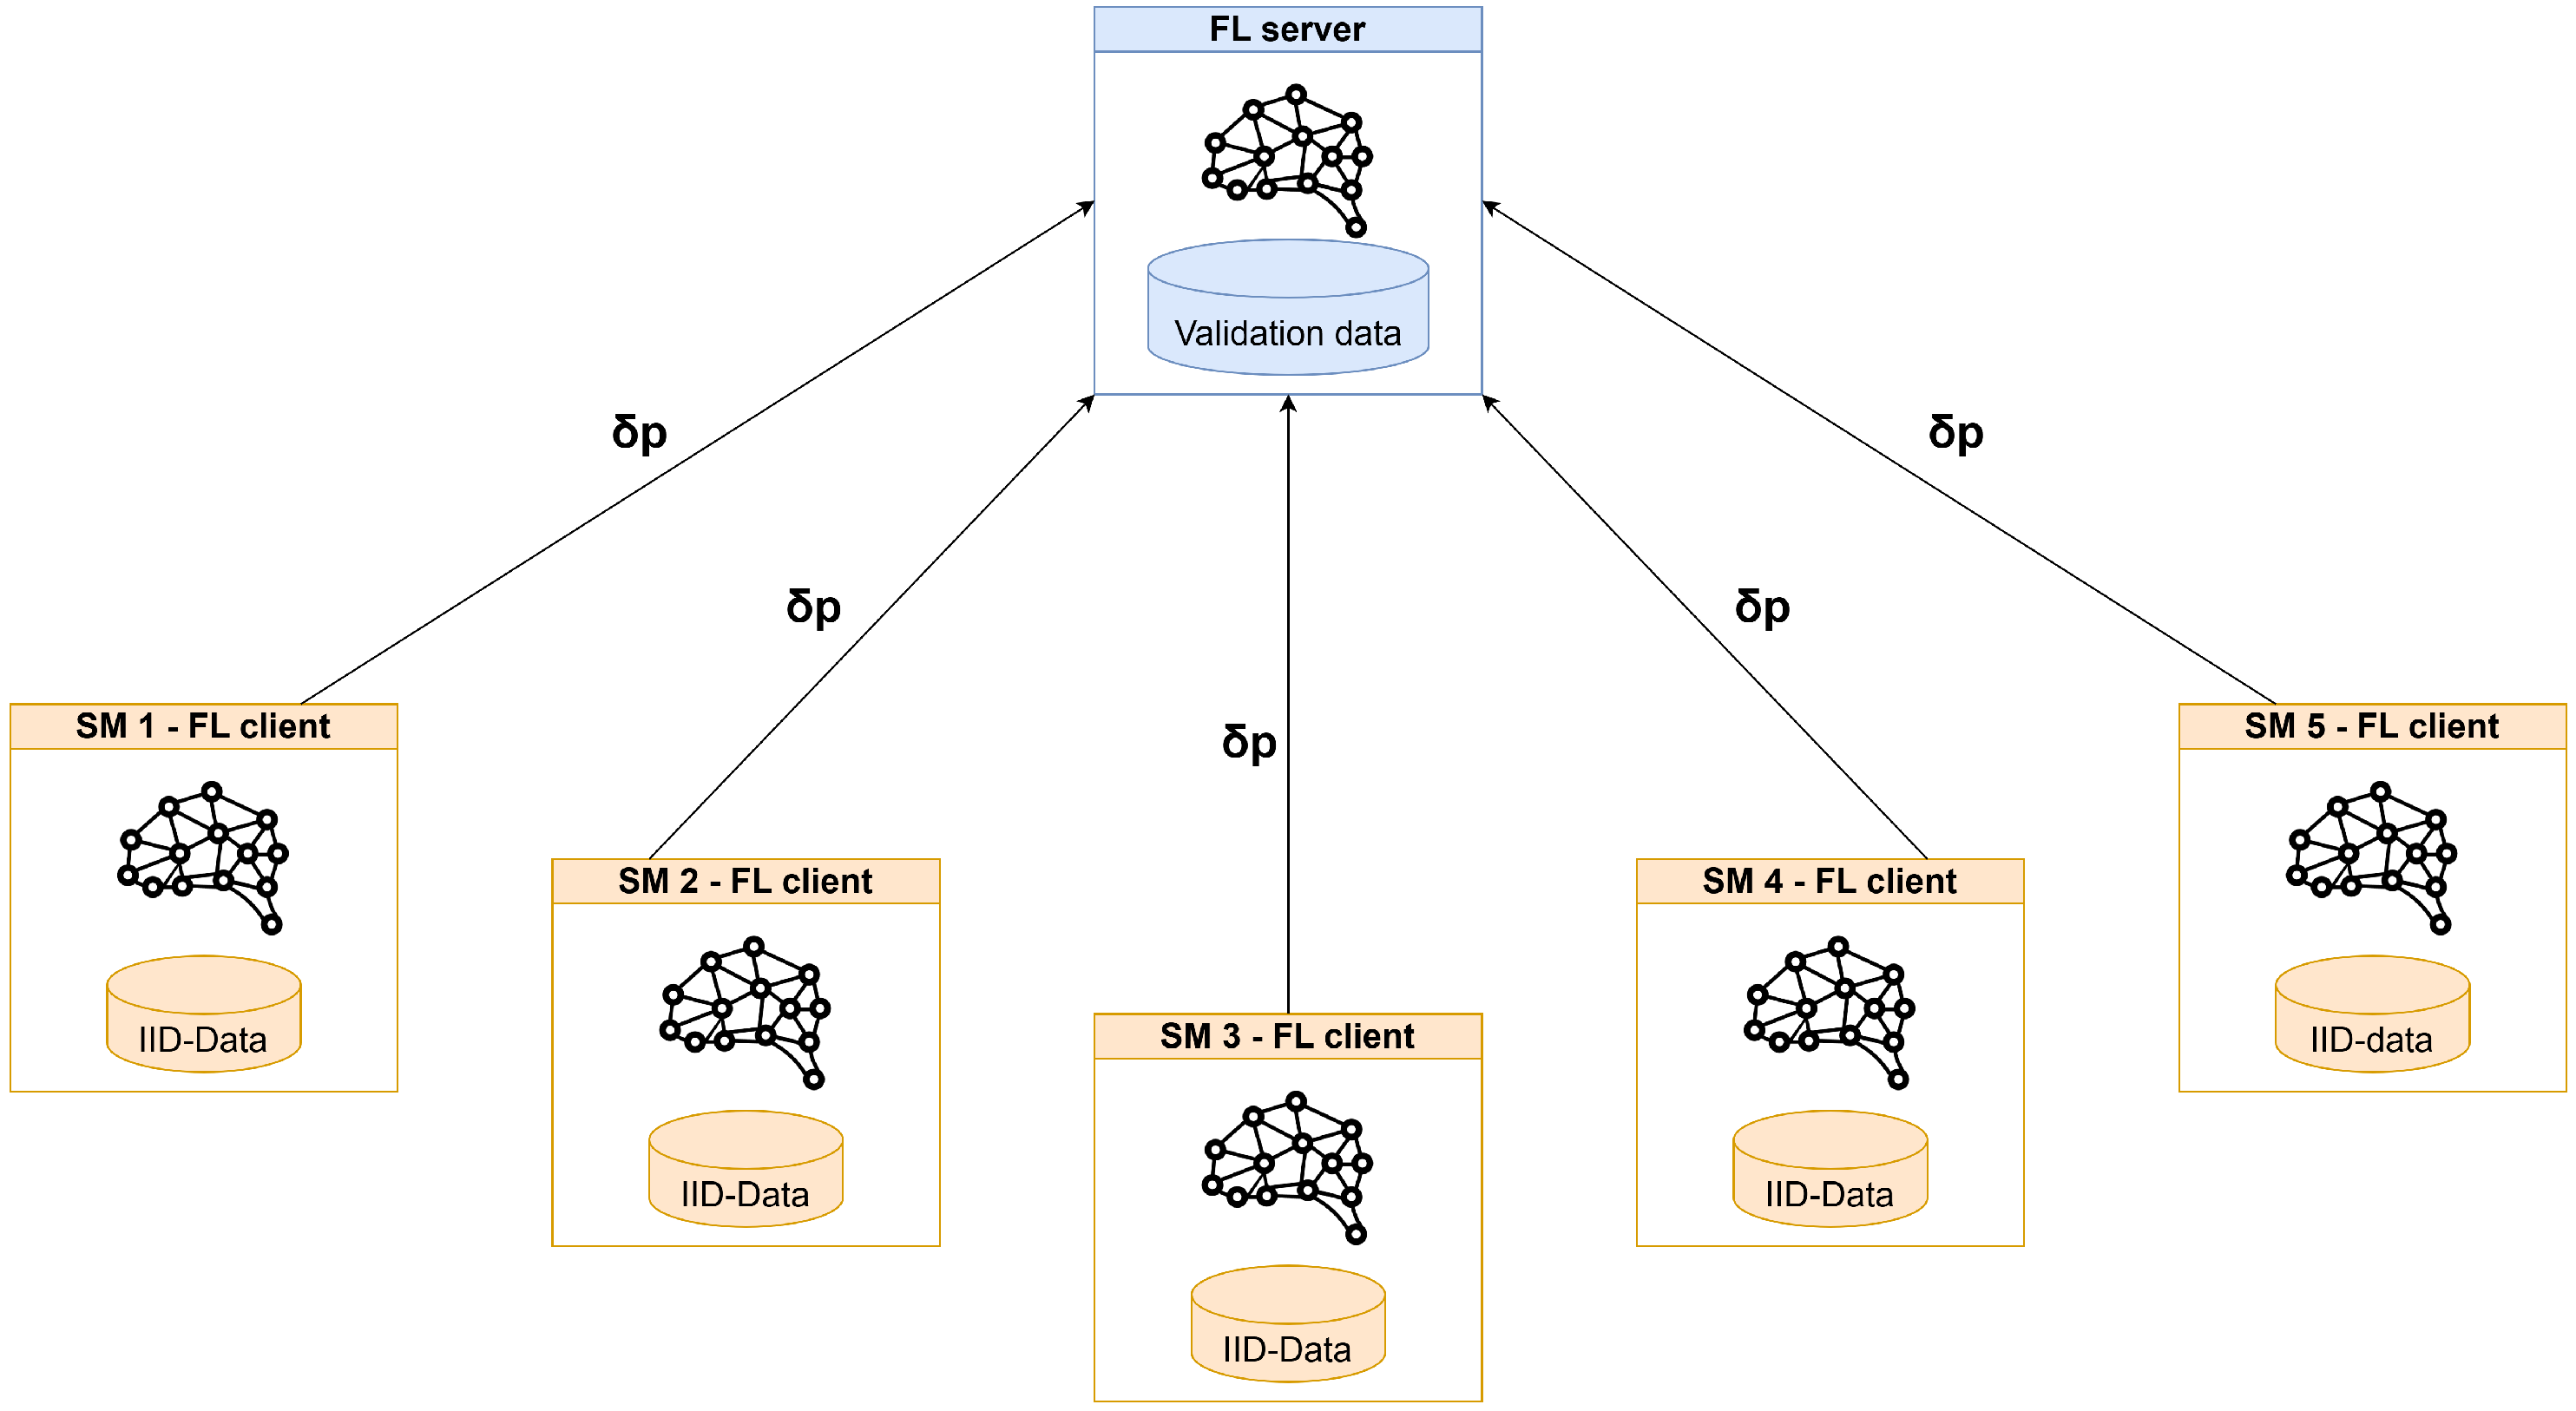
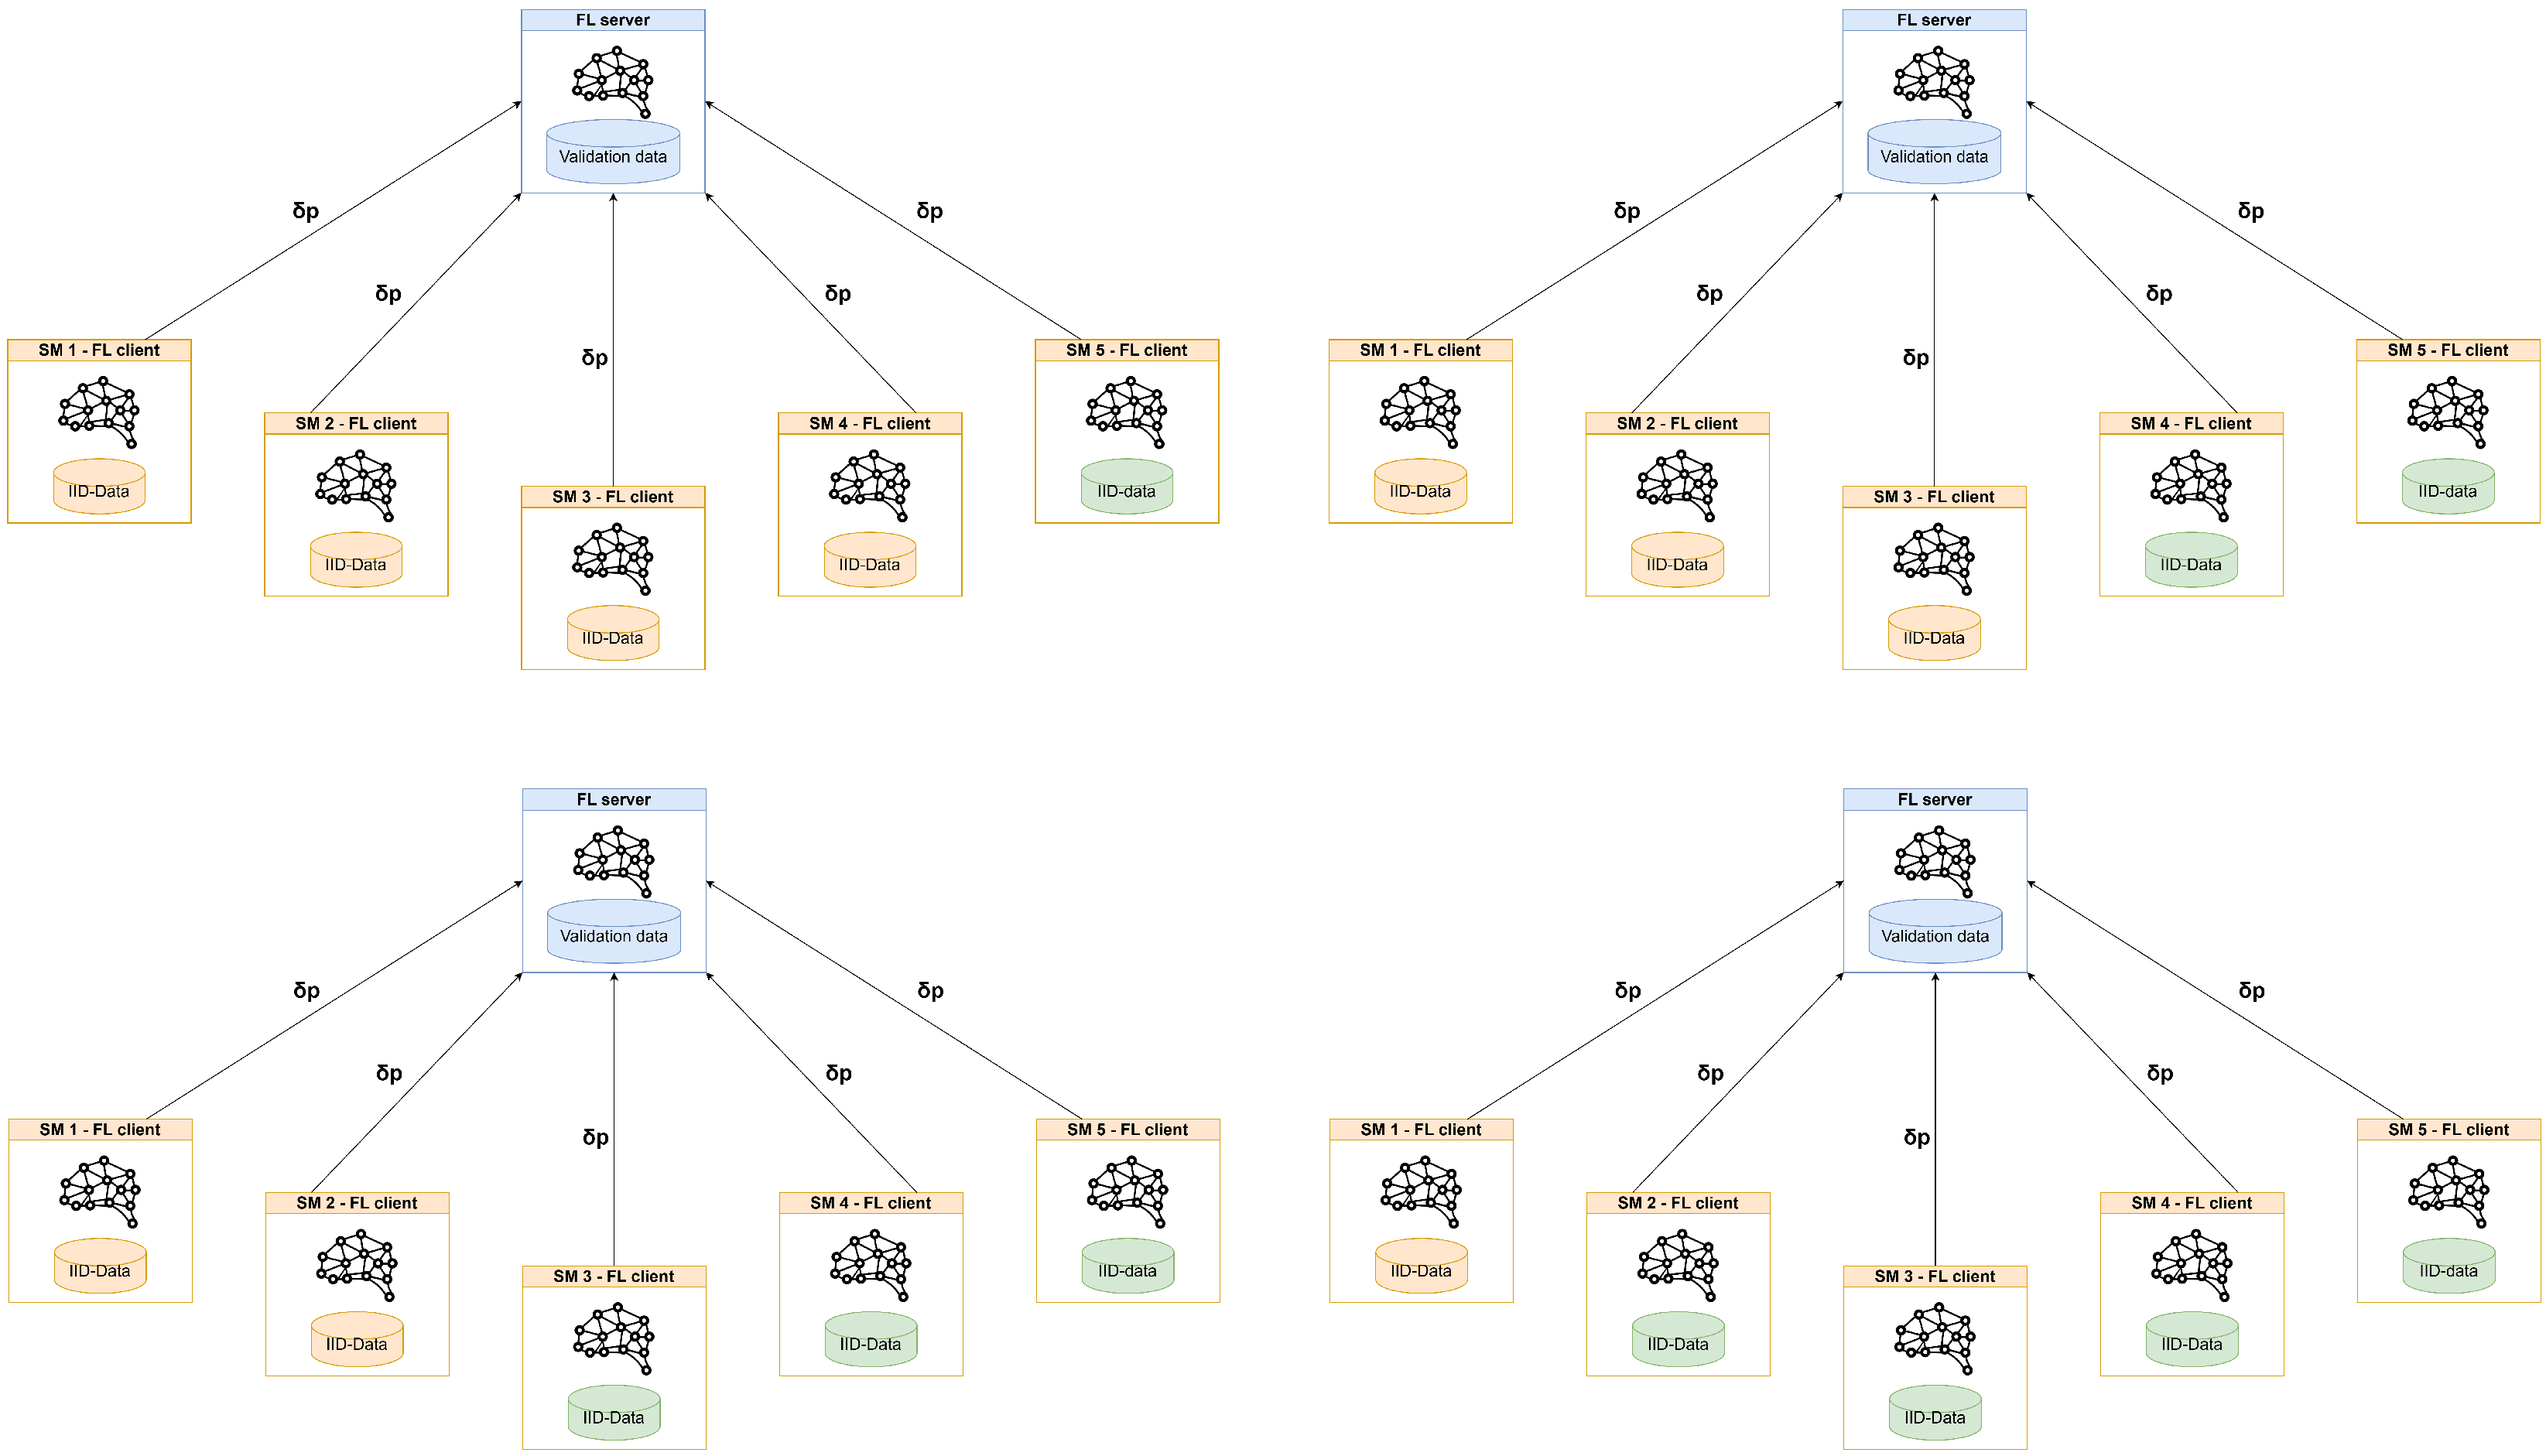
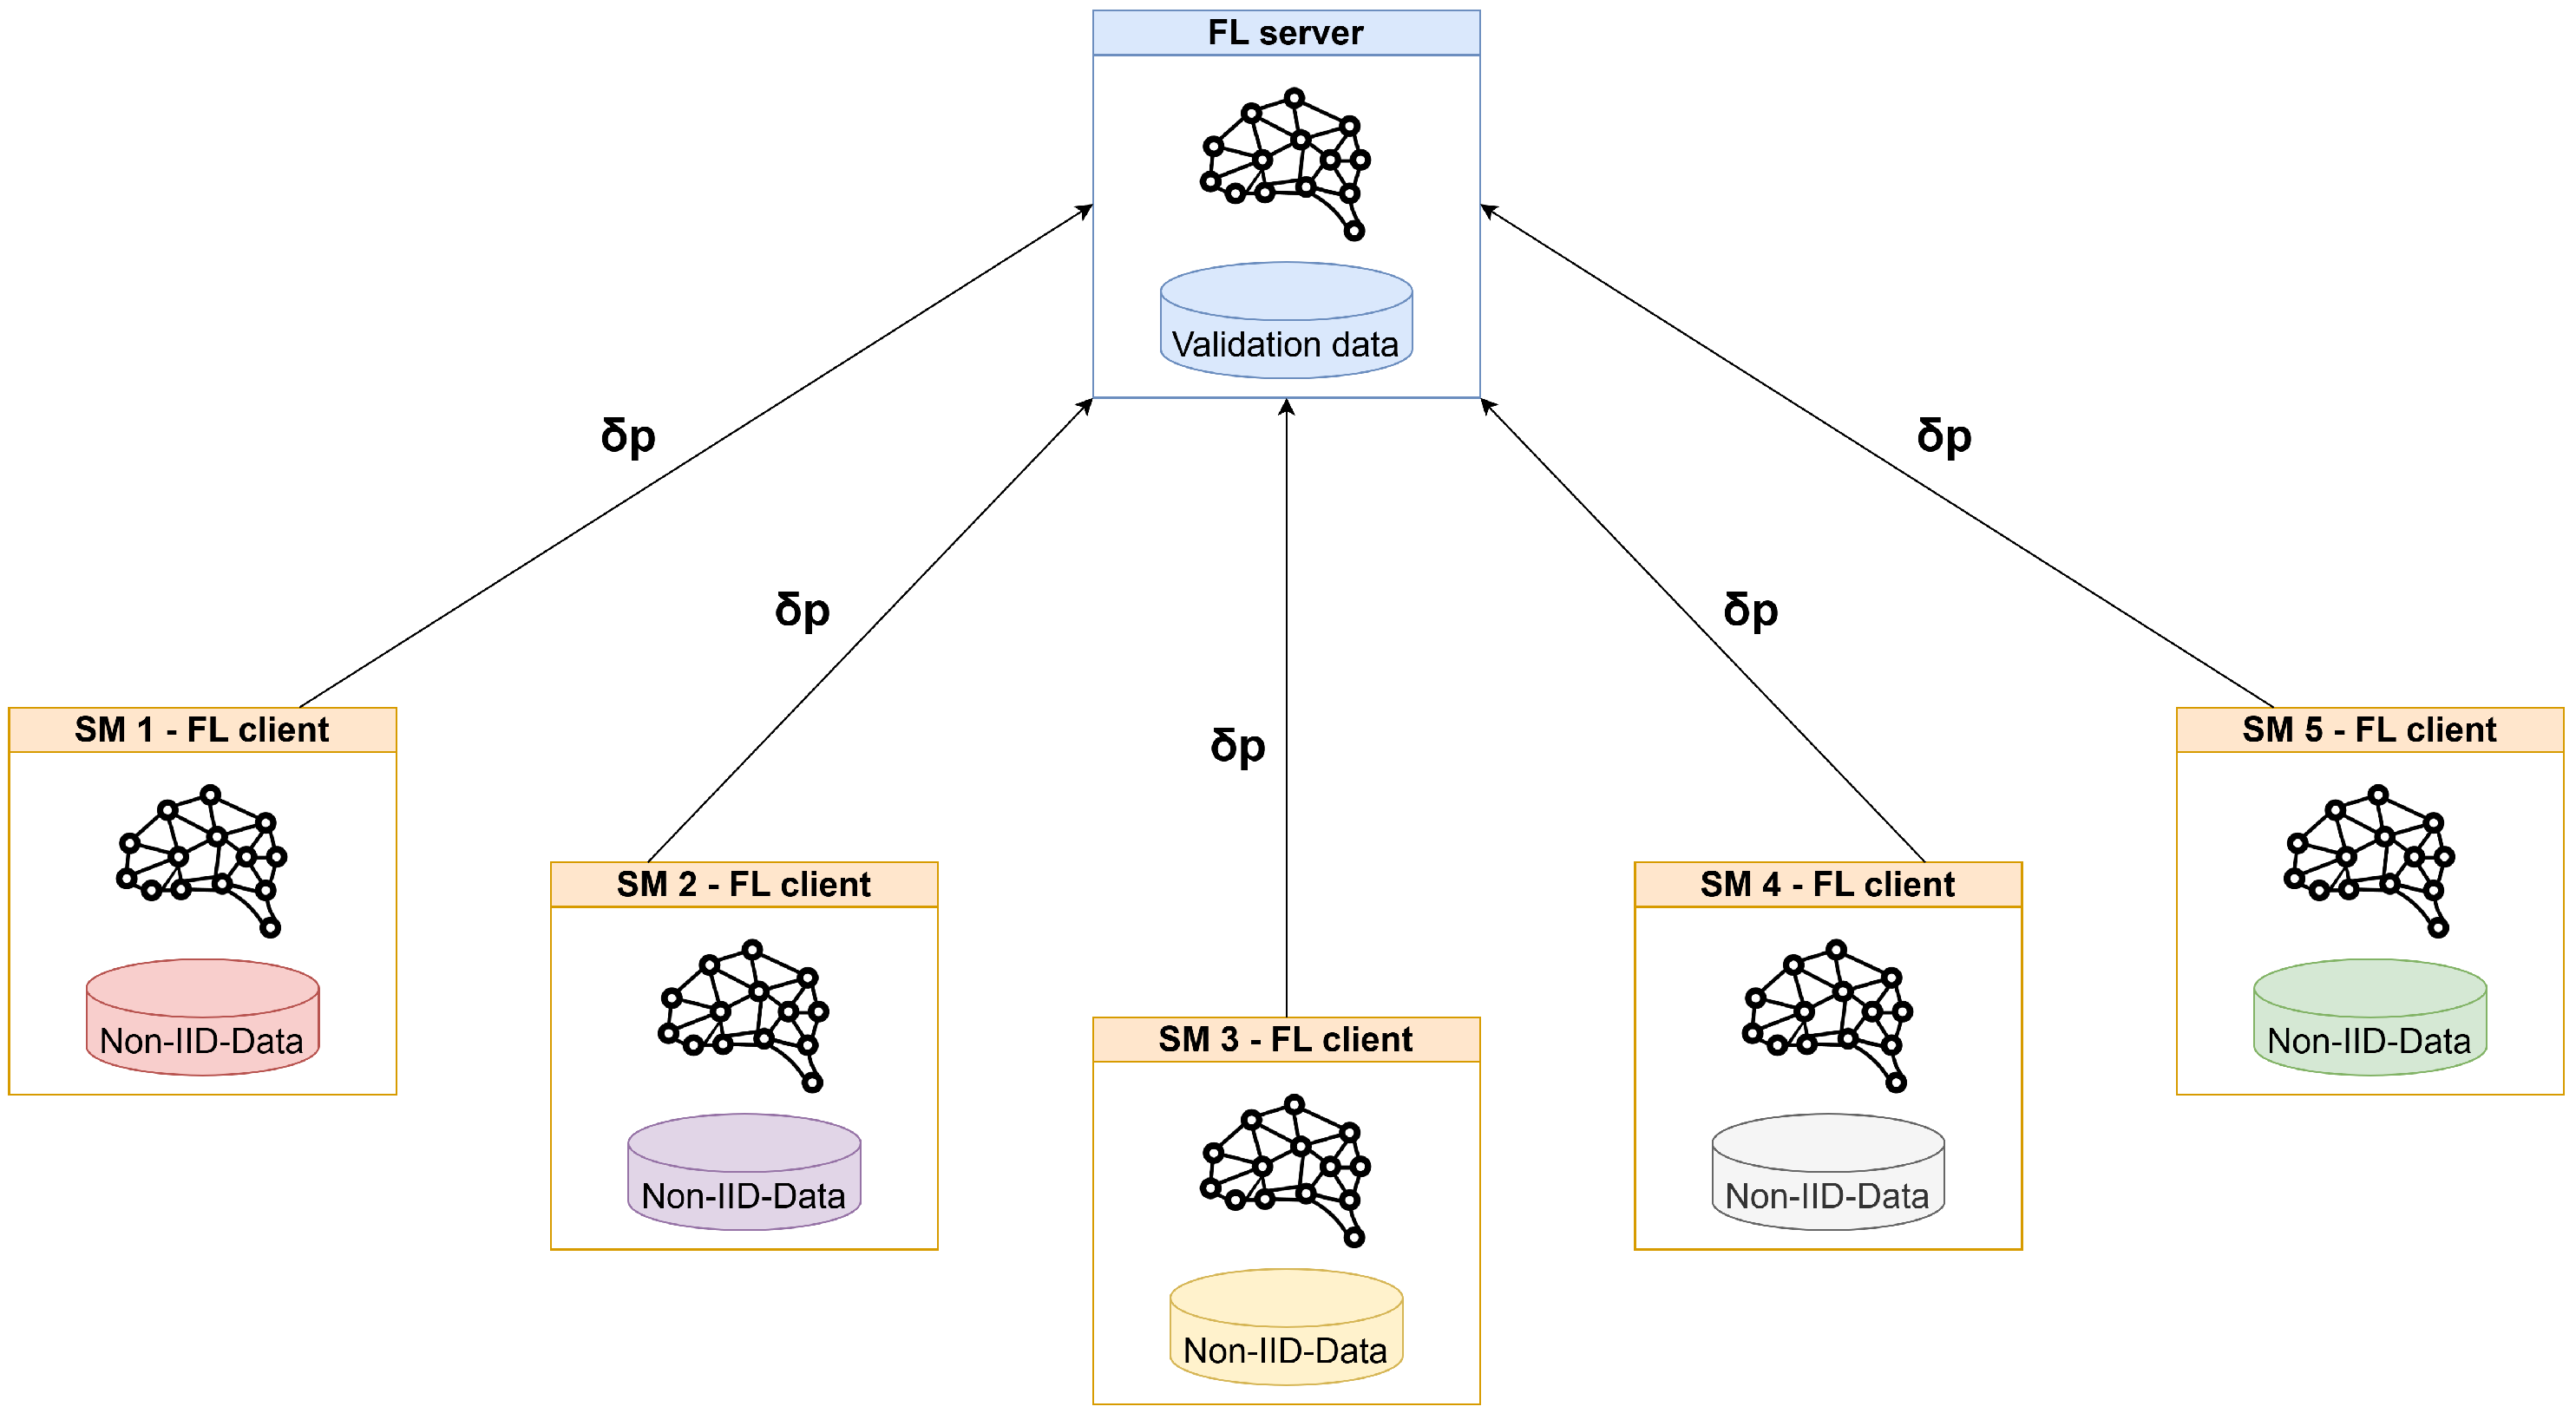


Disclaimer/Publisher’s Note: The statements, opinions and data contained in all publications are solely those of the individual author(s) and contributor(s) and not of MDPI and/or the editor(s). MDPI and/or the editor(s) disclaim responsibility for any injury to people or property resulting from any ideas, methods, instructions or products referred to in the content. |
© 2025 by the authors. Licensee MDPI, Basel, Switzerland. This article is an open access article distributed under the terms and conditions of the Creative Commons Attribution (CC BY) license (https://creativecommons.org/licenses/by/4.0/).