
Ocean Acidification-Mediated Food Chain Transfer of Polonium between Primary Producers and Consumers

 , , , ,
Abstract
:1. Introduction
2. Material and Methods
2.1. Sampling and Monoculture
2.2. Carbonate Chemistry
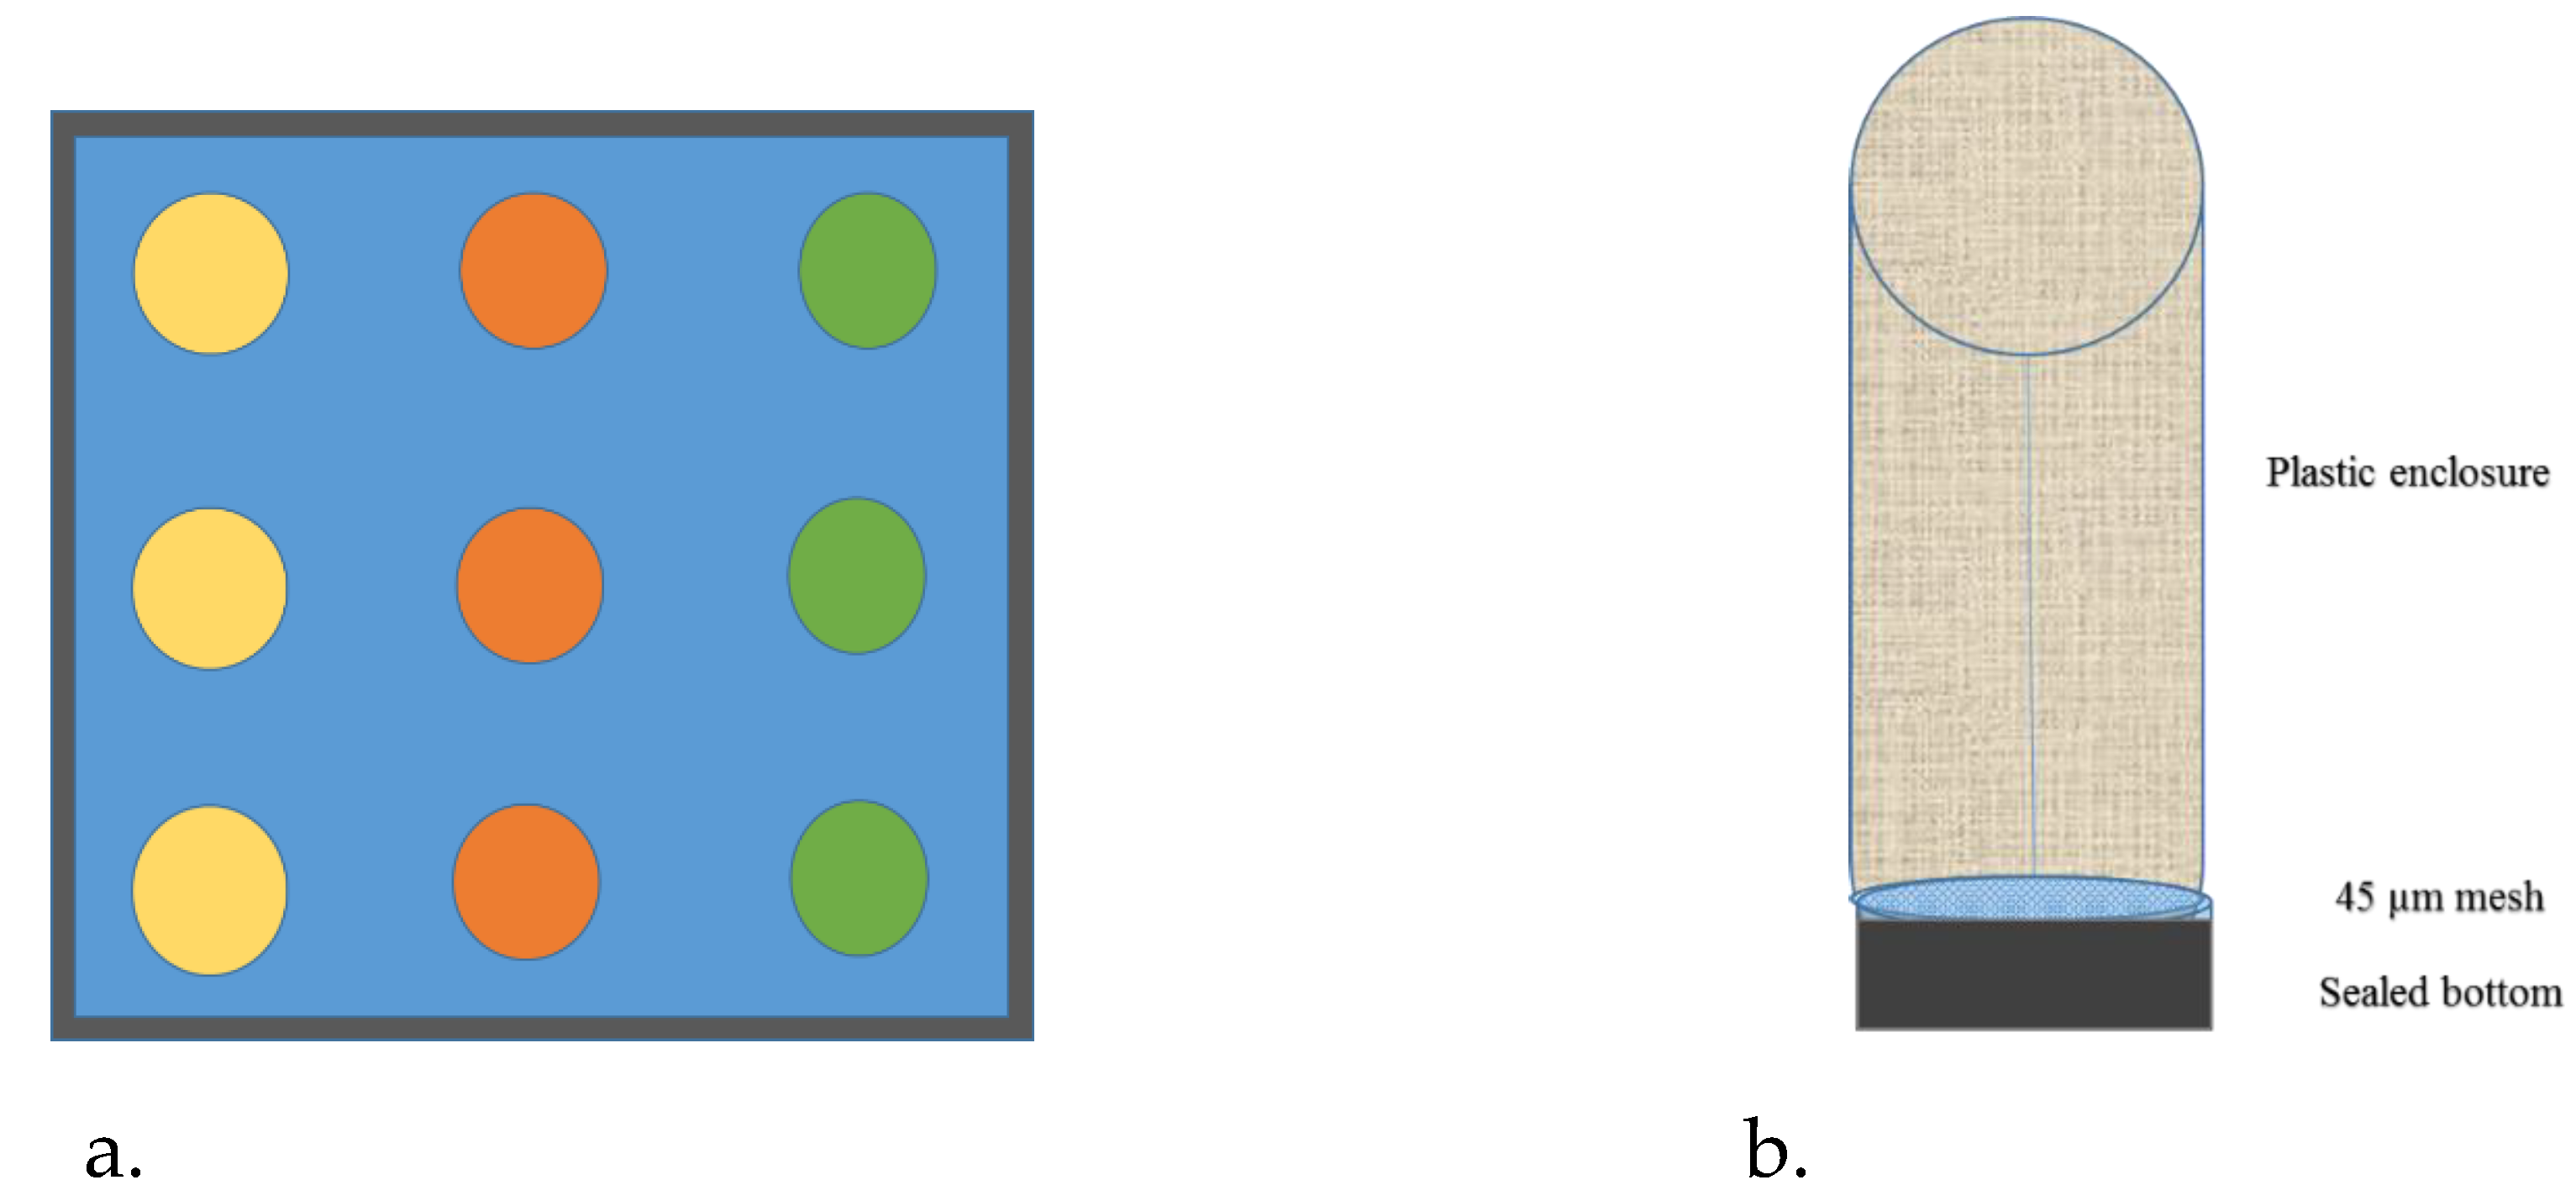
2.3. Experimental Exposure
3. Results
3.1. Carbonate Chemistry
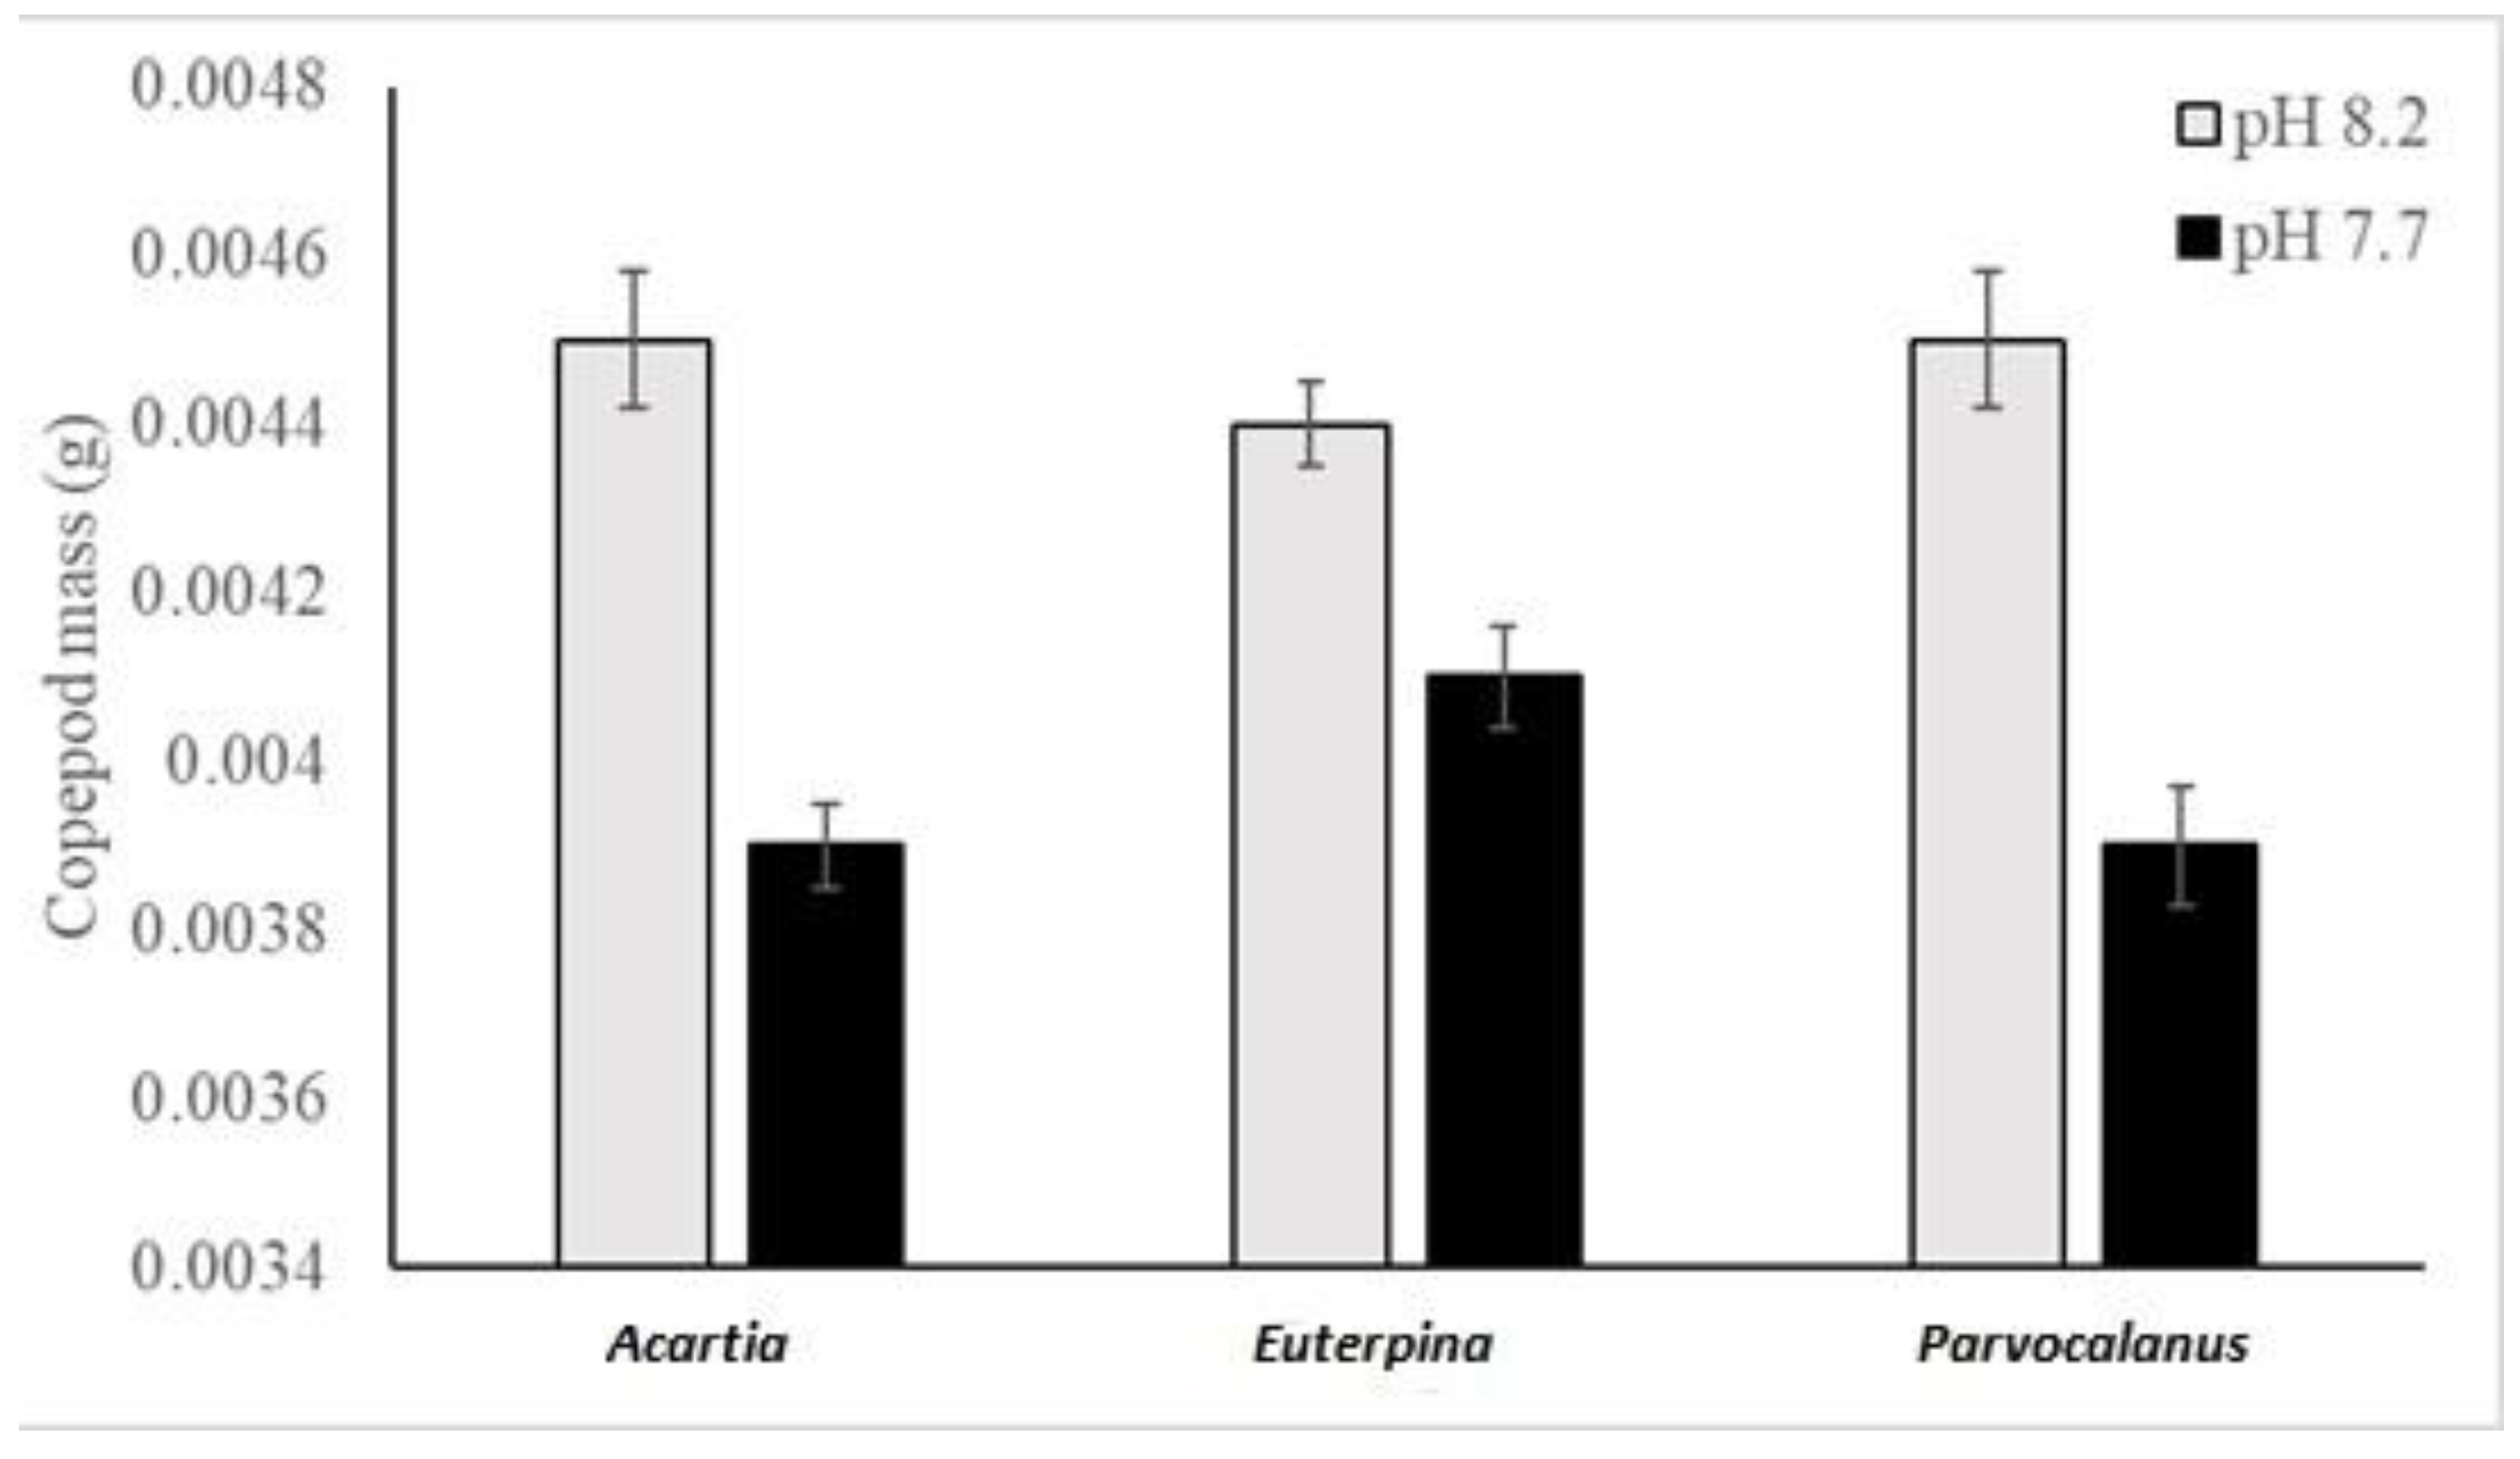
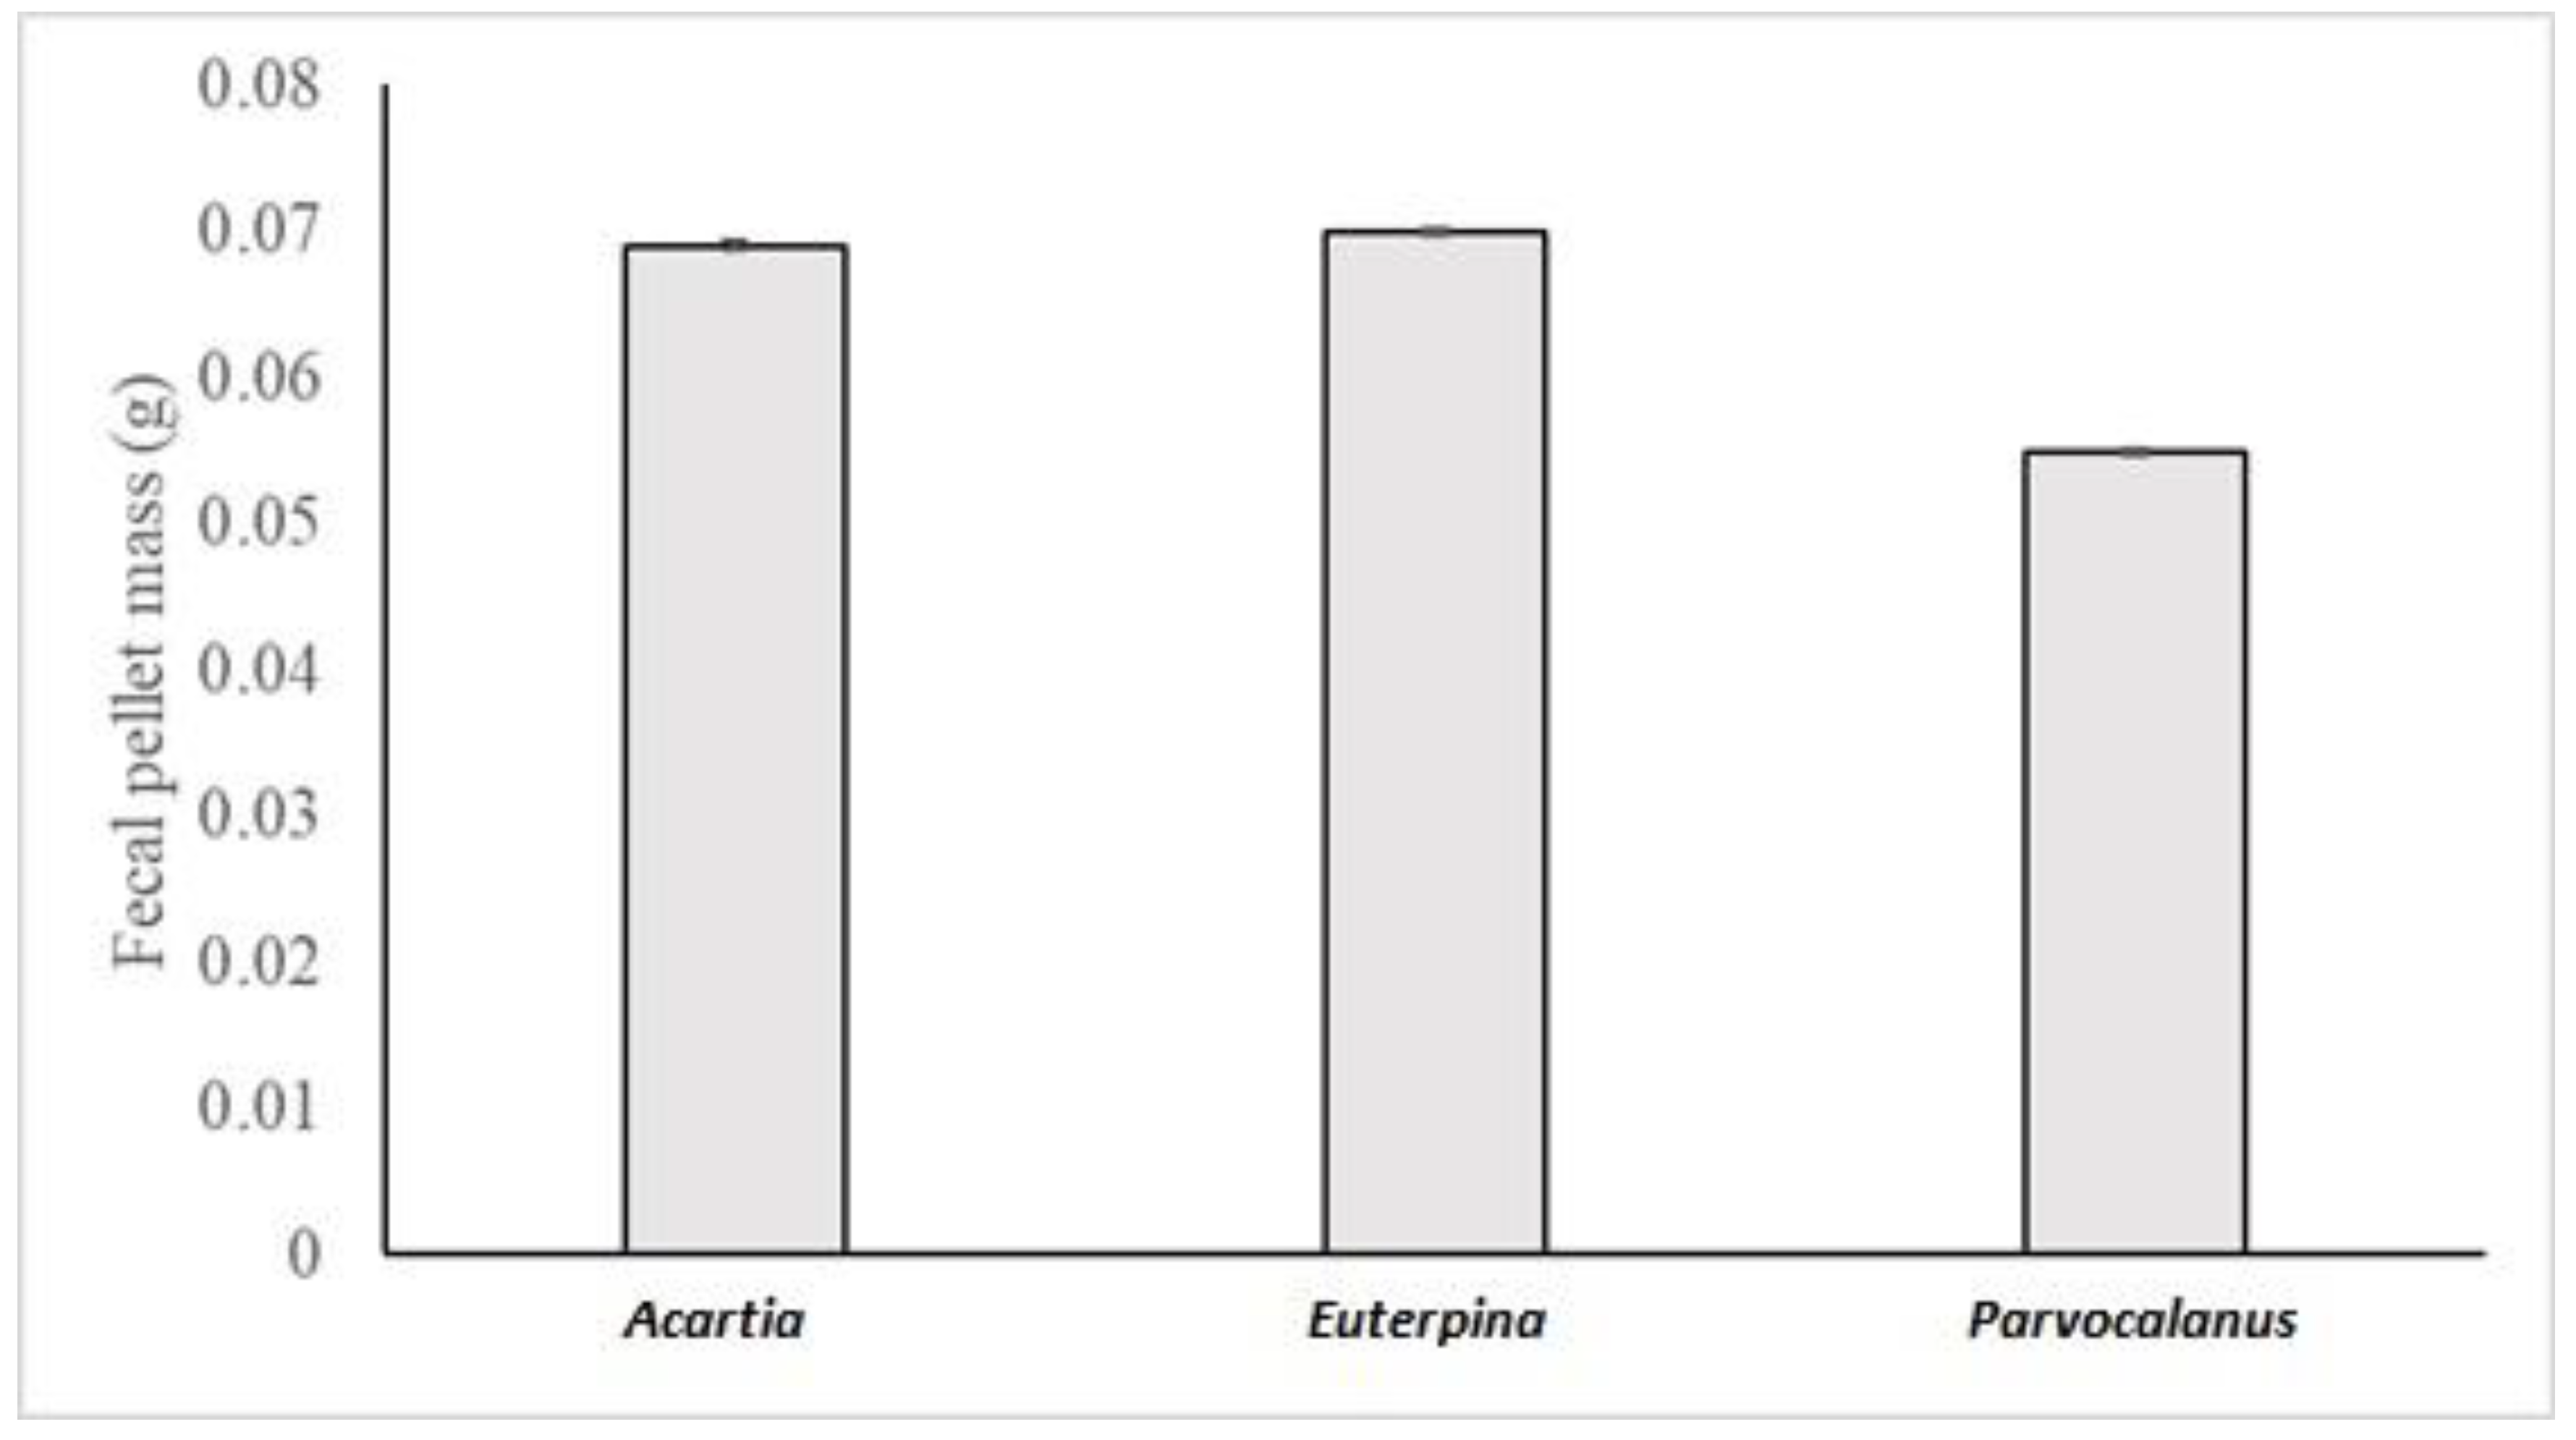
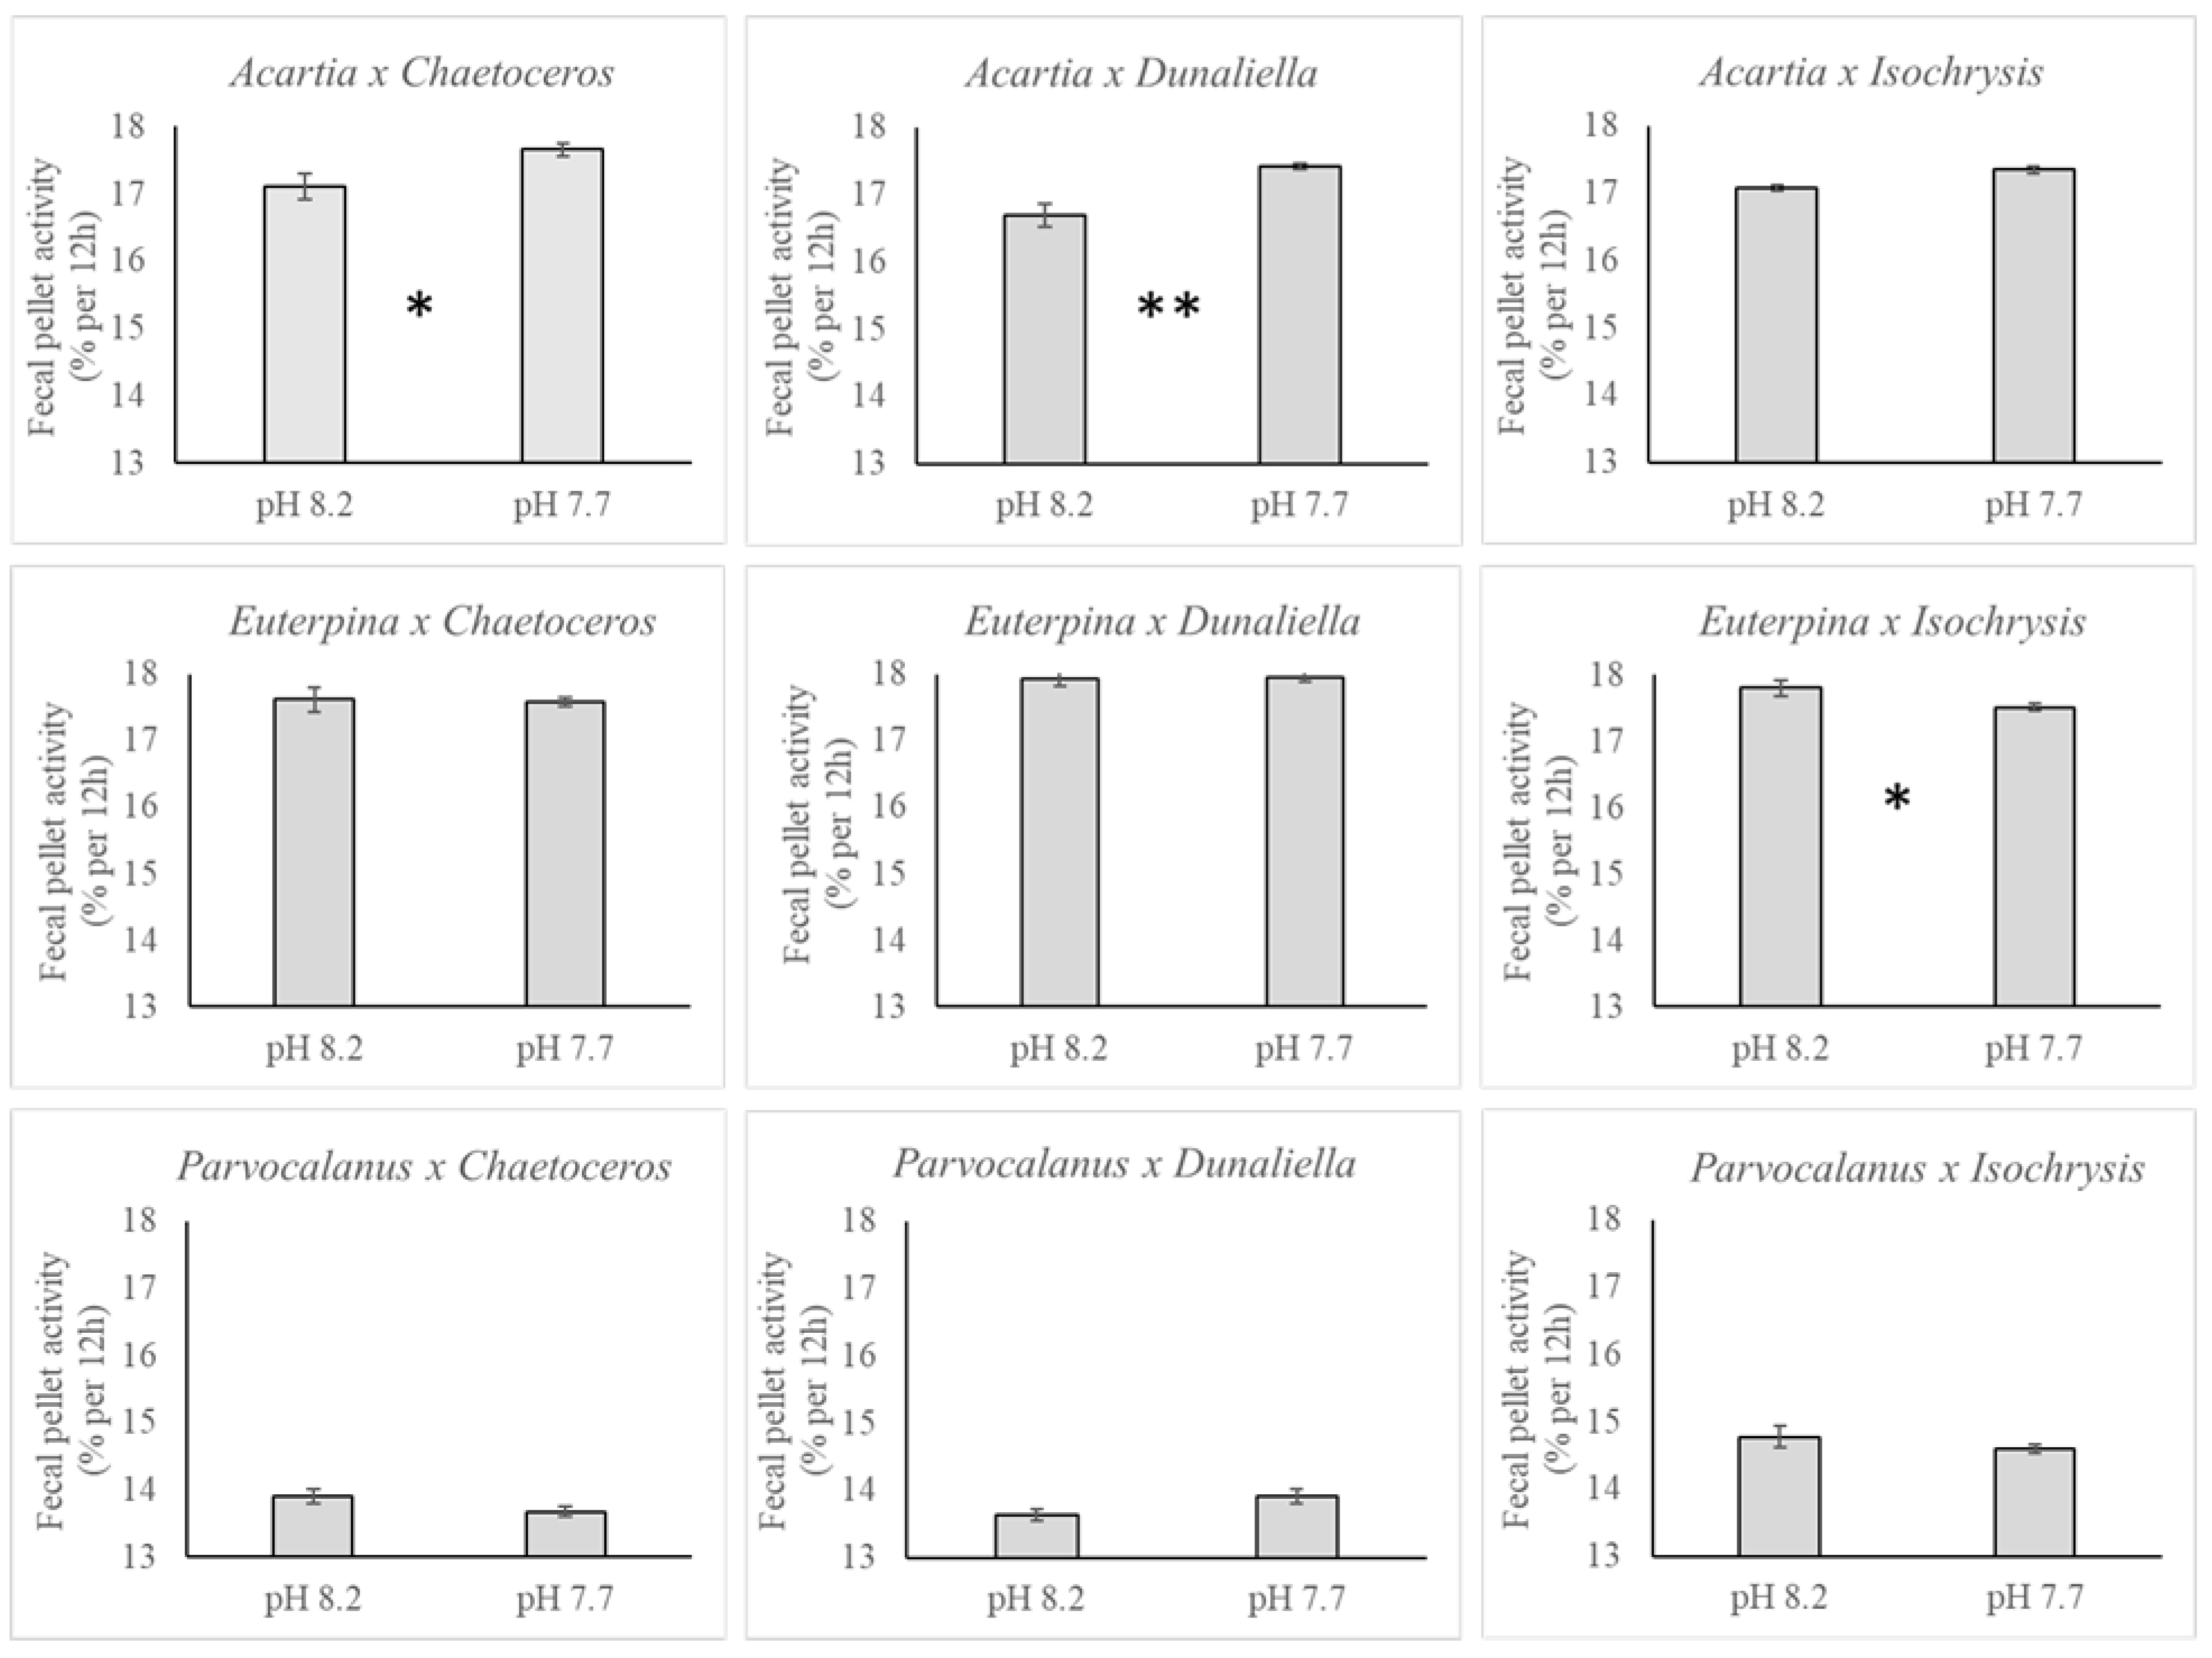
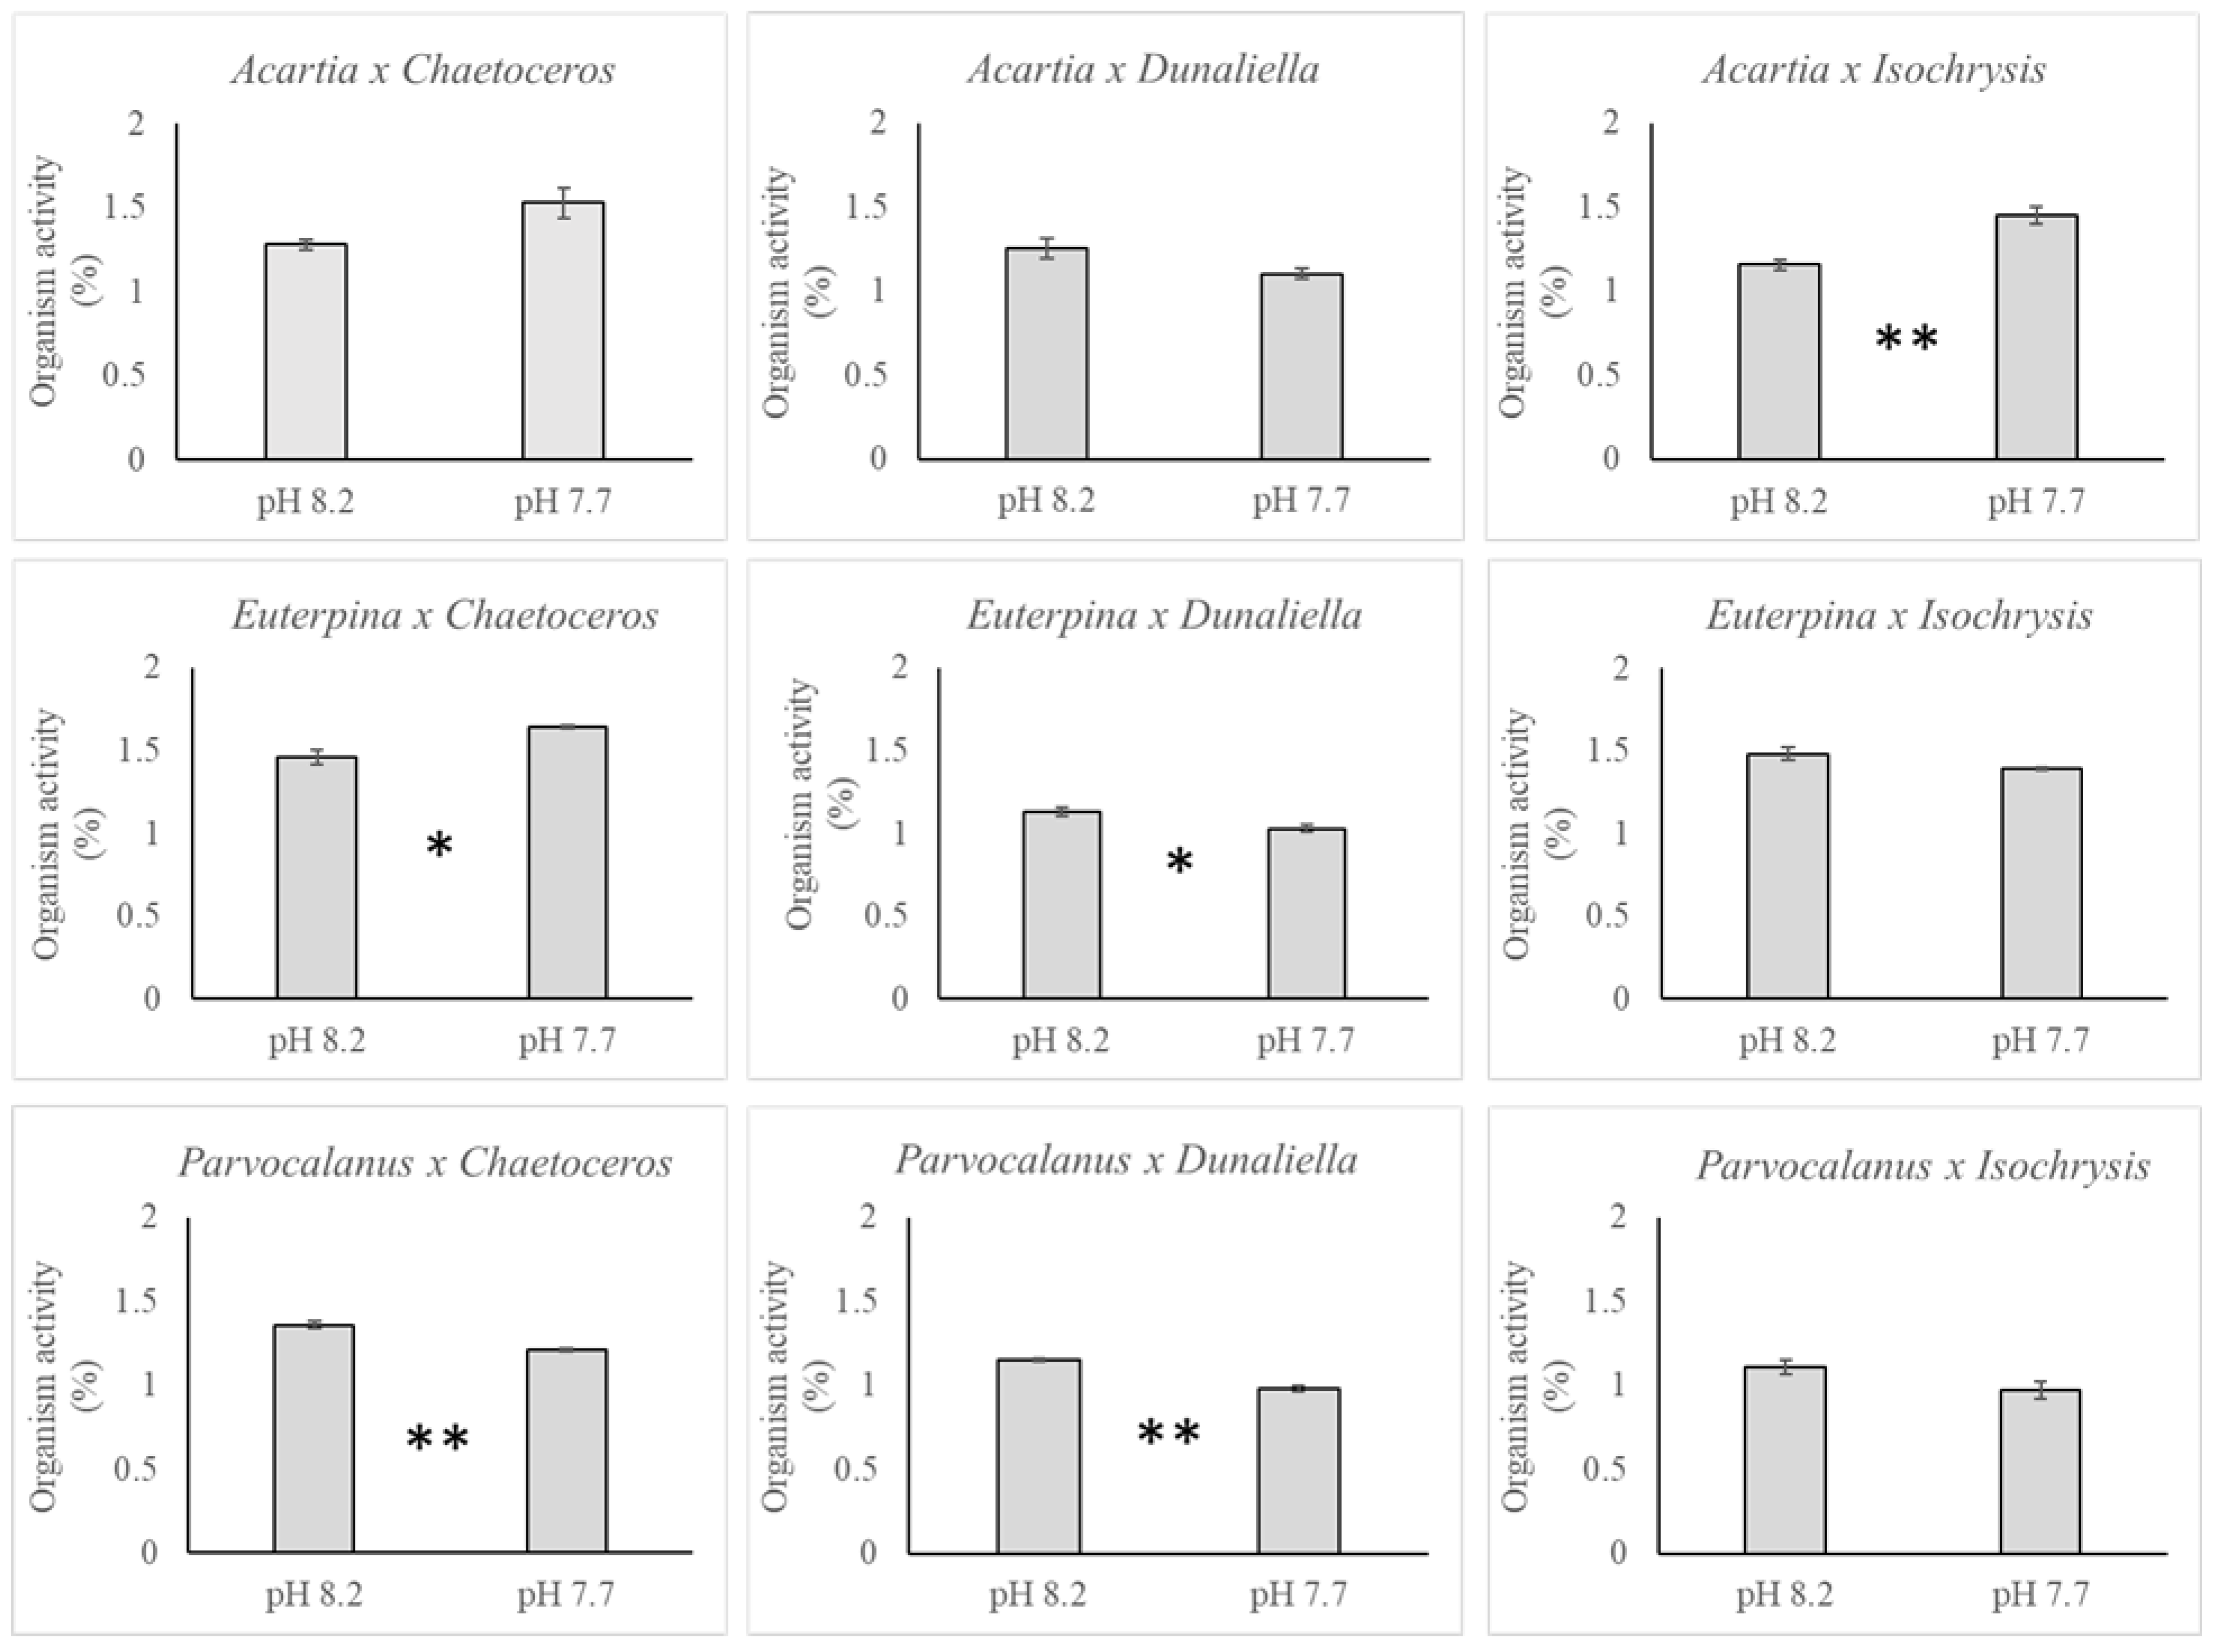
3.2. Copepods
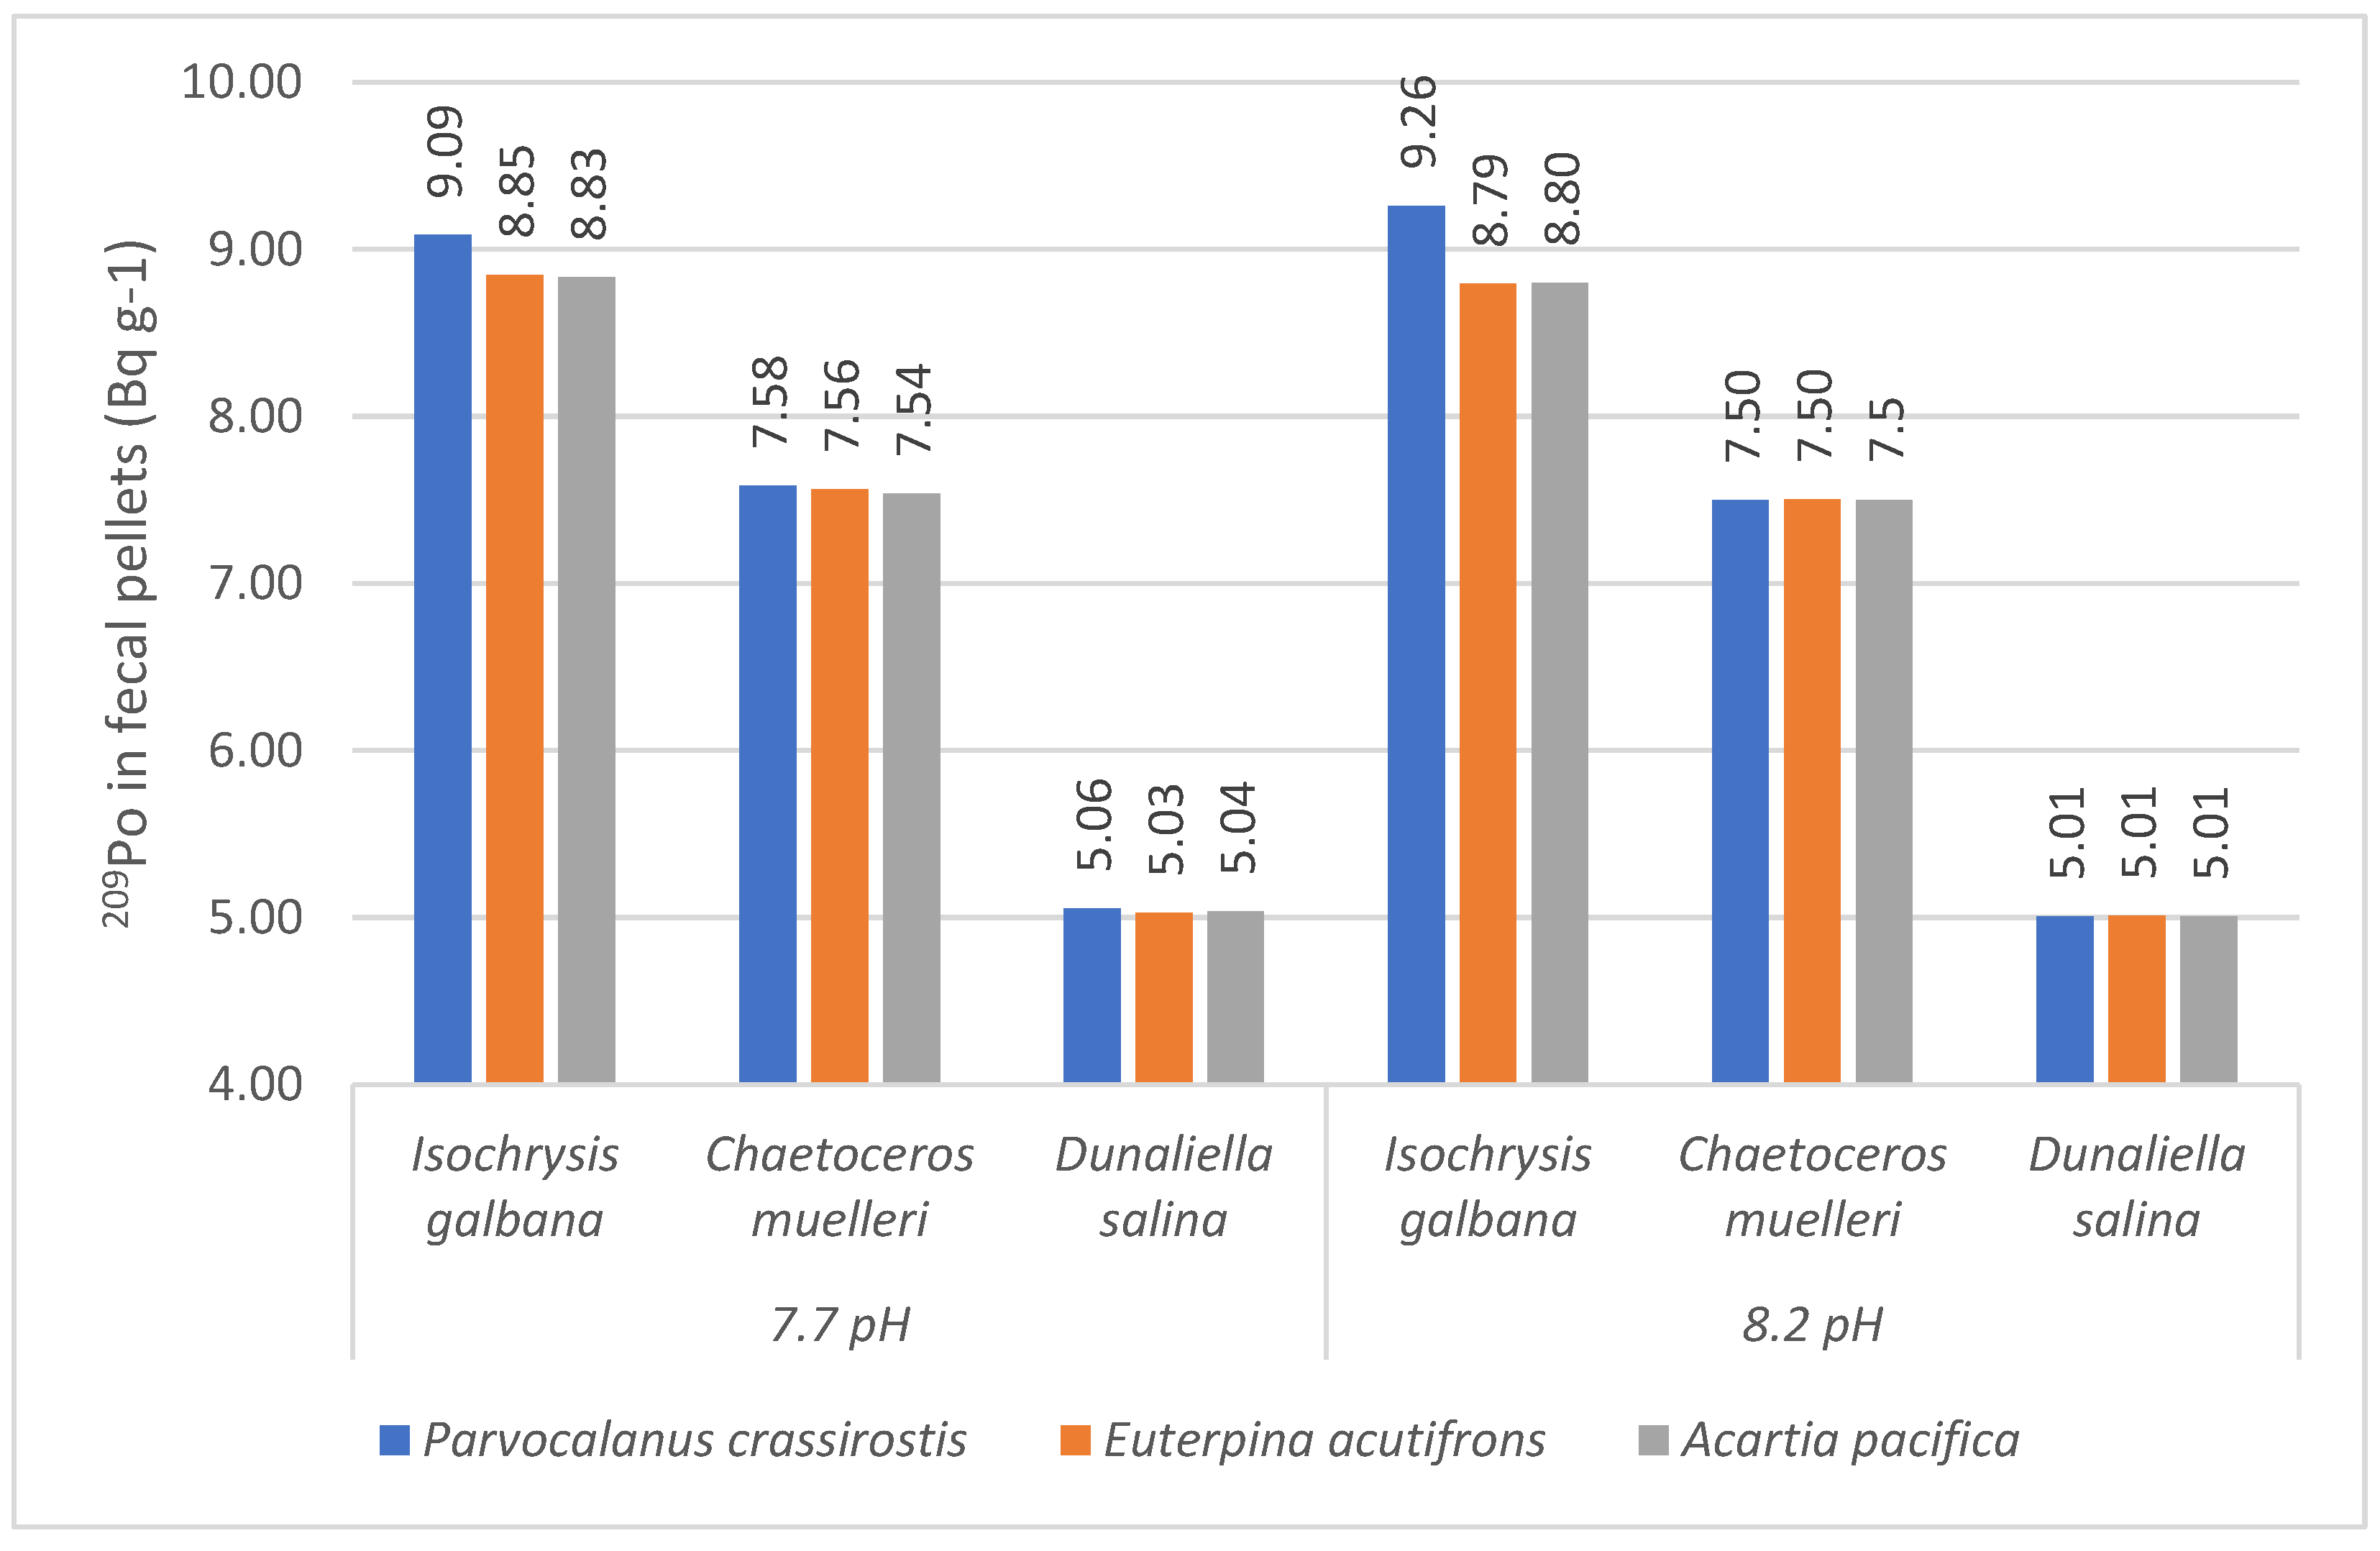
3.3. Polonium
4. Discussion
5. Conclusions
Author Contributions
Funding
Institutional Review Board Statement
Informed Consent Statement
Data Availability Statement
Conflicts of Interest
References
- Xu, Y.; Shi, D.; Aristilde, L.; Morel, F.M.M. The effect of pH on the uptake of zinc and cadmium in marine phytoplankton: Possible role of weak complexes. Limnol. Oceanogr. 2012, 57, 293–304. [Google Scholar] [CrossRef]
- Kim, J.M.; Baars, O.; Morel, F.M.M. The effect of acidification on the bioavailability and electrochemical lability of zinc in seawater. Philos. Trans. A Math Phys. Eng. Sci. 2016, 374, 20150296. [Google Scholar] [CrossRef] [Green Version]
- Endo, H.; Yoshimura, T.; Kataoka, T.; Suzuki, K. Effects of CO2 and iron availability on phytoplankton and eubacterial community compositions in the northwest subarctic Pacific. J. Exp. Mar. Biol. Ecol. 2013, 439, 160–175. [Google Scholar] [CrossRef] [Green Version]
- Uddin, S.; Bebhehani, M.; Al-Musallam, L.; Kumar, V.; Sajid, S. Po uptake in microalgae at different seawater pH: An experimental study simulating ocean acidification. Mar. Pollut. Bull. 2020, 151, 110844. [Google Scholar] [CrossRef] [PubMed]
- Annabi-Trabelsi, N.; Guermazi, W.; Karam, Q.; Ali, M.; Uddin, S.; Leignel, V.; Ayadi, H. Concentrations of trace metals in phytoplankton and zooplankton in the Gulf of Gabès, Tunisia. Mar. Pollut. Bull. 2021, 168, 112392. [Google Scholar] [CrossRef] [PubMed]
- Jin, P.; Zhang, J.; Wan, J.; Overmans, S.; Gao, G.; Ye, M.; Dai, X.; Zhao, J.; Xiao, M.; Xia, J. The Combined Effects of Ocean Acidification and Heavy Metals on Marine Organisms: A Meta-Analysis. Front. Mar. Sci. 2021, 8. [Google Scholar] [CrossRef]
- Gattuso, J.-P.; Hansson, L. Ocean acidification: Background and history. In Ocean Acidification; Gattuso, J.-P., Hansson, L., Eds.; Oxford University Press: Oxford, UK, 2011; pp. 1–20. [Google Scholar]
- Orr, J.C.; Fabry, V.J.; Aumont, O.; Bopp, L.; Doney, S.C.; Feely, R.A.; Gnanadesikan, A.; Gruber, N.; Ishida, A.; Joos, F.; et al. Anthropogenic ocean acidification over the twenty-first century and its impact on calcifying organisms. Nature 2005, 437, 681–686. [Google Scholar] [CrossRef] [Green Version]
- Ishimatsu, A.; Hayashi, M.; Kikkawa, T. Fishes in high-CO2, acidified oceans. Mar. Ecol. Prog. Ser. 2008, 373, 295–302. [Google Scholar] [CrossRef] [Green Version]
- Lannig, G.; Eilers, S.; Pörtner, H.-O.; Sokolova, I.; Bock, C. Impact of ocean acidification on energy metabolism of oyster, Crassostrea gigas - changes in metabolic pathways and thermal response. Mar. Drugs 2010, 8, 2318–2339. [Google Scholar] [CrossRef] [Green Version]
- Doney, S.C.; Busch, D.S.; Cooley, S.R.; Kroeker, K.J. The Impacts of Ocean Acidification on Marine Ecosystems and Reliant Human Communities. Annu. Rev. Environ. Resour. 2020, 45, 83–112. [Google Scholar] [CrossRef]
- Kang, E.J.; Kim, K.Y. Effects of future climate conditions on photosynthesis and biochemical component of Ulva pertusa (Chlorophyta). ALGAE 2016, 31, 49–59. [Google Scholar] [CrossRef]
- Kim, H.; Spivack, A.J.; Menden-Deuer, S. pH alters the swimming behaviors of the raphidophyte Heterosigma akashiwo: Implications for bloom formation in an acidified ocean. Harmful Algae 2013, 26, 1–11. [Google Scholar] [CrossRef]
- Kim, J.-M.; Lee, K.; Shin, K.; Kang, J.-H.; Lee, H.-W.; Kim, M.; Jang, P.-G.; Jang, M.-C. The effect of seawater CO2 concentration on growth of a natural phytoplankton assemblage in a controlled mesocosm experiment. Limnol. Oceanogr. 2006, 51, 1629–1636. [Google Scholar] [CrossRef] [Green Version]
- Elkadiri, R.; Manche, C.; Sultan, M.; Al-Dousari, A.; Uddin, S.; Chouinard, K.; Abotalib, A.Z. Development of a Coupled Spatiotemporal Algal Bloom Model for Coastal Areas: A Remote Sensing and Data Mining-Based Approach. IEEE J. Sel. Top. Appl. Earth Obs. Remote Sens. 2016, 9, 5159–5171. [Google Scholar] [CrossRef]
- Habibi, N.; Uddin, S.; Bottein, M.-Y.; Faizuddin, M. Ciguatera in the Indian Ocean with Special Insights on the Arabian Sea and Adjacent Gulf and Seas: A Review. Toxins 2021, 13, 525. [Google Scholar] [CrossRef]
- Manuel, J.; Vigneshwasran, C.; Annadurai, S.; G, P.; Velmurugan, S. Algal biosorption of heavy metals. In Environmental Sustainability using Green Technologies; CRC Publisher: Boca Raton, FL, USA, 2016. [Google Scholar]
- Millero, F.; Woosley, R.; DiTrolio, B.; Waters, J. Effect of ocean acidification on the speciation of metals in seawater. Oceanography 2009, 22, 72–85. [Google Scholar] [CrossRef]
- Schiewer, S.; Wong, M. Ionic strength effects in biosorption of metals by marine algae. Chemosphere 2000, 41, 271–282. [Google Scholar] [CrossRef]
- Kadiene, E.U.; Ouddane, B.; Hwang, J.-S.; Souissi, S. Bioaccumulation of metals in calanoid copepods by oral intake. Sci. Rep. 2019, 9, 1–9. [Google Scholar] [CrossRef] [PubMed] [Green Version]
- Fisher, N.S.; Burns, K.A.; Cherry, R.D.; Heyraud, M. Accumulation and cellular distribution of 241Am, 210Po and 210Pb in two marine algae. Mar. Ecol. Prog. Ser. 1983, 11, 233–237. [Google Scholar] [CrossRef]
- Moller, L.; Torndal, U.B.; Eriksson, L.C.; Gustafsson, J.A. The air pollutant 2-nitrofluorene as initiator and promoter in a liver model for chemical carcinogenesis. Carcinogenesis 1989, 10, 435–440. [Google Scholar] [CrossRef]
- Uddin, S.; Aba, A.; Bebhehani, M. Baseline concentration of 210Po and 210Pb in Sargassum from the northern Gulf. Mar. Pollut. Bull. 2015, 90, 330–333. [Google Scholar] [CrossRef] [PubMed]
- Uddin, S.; Behbehani, M.; Al-Ghadban, A.; Sajid, S.; Kumar, V.V.; Al-Musallam, L.; Al-Zekri, W.; Ali, M.; Al-Julathi, S.; Al-Murad, M.; et al. 210Po concentration in selected diatoms and dinoflagellates in the northern Arabian Gulf. Mar. Pollut. Bull. 2018, 129, 343–346. [Google Scholar] [CrossRef] [PubMed]
- Uddin, S.; Bebhehani, M.; Sajid, S.; Karam, Q. Concentration of 210Po and 210Pb in macroalgae from the northern Gulf. Mar. Pollut. Bull. 2019, 145, 474–479. [Google Scholar] [CrossRef] [PubMed]
- Ivanina, A.V.; Hawkins, C.; Beniash, E.; Sokolova, I.M. Effects of environmental hypercapnia and metal (Cd and Cu) exposure on acid-base and metal homeostasis of marine bivalves. Comp. Biochem. Physiol. Part C Toxicol. Pharmacol. 2015, 174–175, 1–12. [Google Scholar] [CrossRef] [PubMed] [Green Version]
- Ivanina, A.V.; Hawkins, C.; Sokolova, I.M. Interactive effects of copper exposure and environmental hypercapnia on immune functions of marine bivalves Crassostrea virginica and Mercenaria mercenaria. Fish Shellfish Immunol. 2016, 49, 54–65. [Google Scholar] [CrossRef] [Green Version]
- Kroeker, K.J.; Kordas, R.L.; Crim, R.; Hendriks, I.E.; Ramajo, L.; Singh, G.S.; Duarte, C.M.; Gattuso, J. Impacts of ocean acidification on marine organisms: Quantifying sensitivities and interaction with warming. Glob. Chang. Biol. 2013, 19, 1884–1896. [Google Scholar] [CrossRef] [Green Version]
- Uddin, S.; Gevao, B.; Al-Ghadban, A.N.; Nithyanandan, M.; Al-Shamroukh, D. Acidification in Arabian Gulf – Insights from pH and temperature measurements. J. Environ. Monit. 2012, 14, 1479–1482. [Google Scholar] [CrossRef]
- Uddin, S.; Fowler, S.; Behbehani, M.; Metian, M. 210Po bioaccumulation and trophic transfer in marine food chains in the northern Arabian Gulf. J. Environ. Radioact. 2017, 174, 23–29. [Google Scholar] [CrossRef]
- Uddin, S.; Behbehani, M.; Al-Ghadban, A.; Sajid, S.; Al-Zekri, W.; Ali, M.; Al-Jutaili, S.; Al-Musallam, L.; Vinod, V.; Al-Murad, M.; et al. 210Po concentration in selected calanoid copepods in the northern Arabian Gulf. Mar. Pollut. Bull. 2018, 133, 861–864. [Google Scholar] [CrossRef]
- Ohman, M.D.; Hirche, H.-J. Density-dependent mortality in an oceanic copepod population. Nature 2001, 412, 638–641. [Google Scholar] [CrossRef]
- Watanabe, Y.; Yamaguchi, A.; Ishida, H.; Harimoto, T.; Suzuki, S.; Sekido, Y.; Ikeda, T.; Shirayama, Y.; Mac Takahashi, M.; Ohsumi, T.; et al. Lethality of increasing CO2 levels on deep-sea copepods in the western North Pacific. J. Oceanogr. 2006, 62, 185–196. [Google Scholar] [CrossRef]
- Vehmaa, A.; Hogfors, H.; Gorokhova, E.; Brutemark, A.; Holmborn, T.; Engström-Öst, J. Projected marine climate change: Effects on copepod oxidative status and reproduction. Ecol. Evol. 2013, 3, 4548–4557. [Google Scholar] [CrossRef] [Green Version]
- Hildebrandt, N.; Niehoff, B.; Sartoris, F.-J. Long-term effects of elevated CO2 and temperature on the Arctic calanoid copepods Calanus glacialis and C. hyperboreus. Mar. Pollut. Bull. 2014, 80, 59–70. [Google Scholar] [CrossRef] [PubMed]
- Zhang, D.; Li, S.; Wang, G.; Guo, D. Impacts of CO2-driven seawater acidification on survival, egg production rate and hatching success of four marine copepods. Acta Oceanol. Sin. 2011, 30, 86–94. [Google Scholar] [CrossRef]
- Behbehani, M.; Uddin, S.; Dupont, S.; Sajid, S.; Al-Musalam, L.; Al-Ghadban, A. Response of Corals Acropora pharaonis and Porites lutea to Changes in pH and Temperature in the Gulf. Sustainability 2019, 11, 3156. [Google Scholar] [CrossRef] [Green Version]
- Al-Musallam, L.; Uddin, S.; Al-Dakkor, S.; Kumar, V. Effect of ocean acidification and ocean warming on the growth and survival of Penaeus semisulcatus Post-Larvae. J. Earth Environ. Sci. 2019, 3. [Google Scholar] [CrossRef]
- Cherry, R.D.; Shannon, L.V. The alpha radioactivity of marine organisms. At. Energy Rev. 1974, 12, 3–45. [Google Scholar]
- Germain, P.; Leclerc, G.; Simon, S. Transfer of polonium-210 into Mytilus edulis (L.) and Fucus vesiculosus (L.) from the baie de Seine (Channel coast of France). Sci. Total Environ. 1995, 164, 109–123. [Google Scholar] [CrossRef]
- Kim, G.; Hong, Y.-L.; Jang, J.; Lee, I.; Hwang, D.-W.; Yang, H.-S. Evidence for anthrpogenic 210Po in the urban atmosphere of Seoul, Korea. Environ. Sci. Technol. 2005, 39, 1519–1522. [Google Scholar] [CrossRef]
- McDonald, P.; Baxter, M.; Scott, E. Technological enhancement of natural radionuclides in the marine environment. J. Environ. Radioact. 1996, 32, 67–90. [Google Scholar] [CrossRef]
- McDonald, P.; Fowler, S.; Heyraud, M.; Baxter, M. Polonium-210 in mussels and its implications for environmental alpha-autoradiography. J. Environ. Radioact. 1986, 3, 293–303. [Google Scholar] [CrossRef]
- Othman, I.; Al-Masri, M. Impact of phosphate industry on the environment: A case study. Appl. Radiat. Isot. 2007, 65, 131–141. [Google Scholar] [CrossRef] [PubMed]
- Carvalho, F.P. Polonium (210Po) and lead (210Pb) in marine organisms and their transfer in marine food chains. J. Environ. Radioact. 2010, 102, 462–472. [Google Scholar] [CrossRef]
- Carvalho, F.P. 210Po in marine organisms: A wide range of natural radiation dose domains. Radiat. Prot. Dosim. 1988, 24, 113–117. [Google Scholar] [CrossRef]
- Cherry, R.; Fowler, S.; Beasley, T.; Heyraud, M. Polonium-210: Its vertical oceanic transport by zooplankton metabolic activity. Mar. Chem. 1975, 3, 105–110. [Google Scholar] [CrossRef]
- Cherry, R.D.; Heyraud, M. Evidence of High Natural Radiation Doses in Certain Mid-Water Oceanic Organisms. Science 1982, 218, 54–56. [Google Scholar] [CrossRef] [PubMed]
- Cherry, R.D.; Heyraud, M. Polonium-210 in Selected Categories of Marine Organisms: Interpretation of the Data on the Basis of an Unstructured Marine Food Web Model; Elsevier Applied Science Ltd.: London, UK, 1988; pp. 362–372. [Google Scholar]
- Cherry, R.D.; Heyraud, M. Polonium-210 and lead-210 in marine organisms: Allometric relationships and their significance. In Radionuclides in the Study of Marine Processes; Kershaw, P.J., Woodhead, D.S., Eds.; Elsevier Applied Science Ltd.: London, UK, 1991; pp. 309–318. [Google Scholar]
- Cherry, R.D.; Heyraud, M. Polonium-210 content of marine shrimp: Variation with biological and environmental factors. Mar. Biol. 1981, 65, 165–175. [Google Scholar] [CrossRef]
- Cherry, R.; Heyraud, M.; Rindfuss, R. Polonium-210 in teleost fish and in marine mammals: Interfamily differences and a possible association between polonium-210 and red muscle content. J. Environ. Radioact. 1994, 24, 273–291. [Google Scholar] [CrossRef]
- Fowler, S.W. 210Po in the marine environment with emphasis on its behaviour within the biosphere. J. Environ. Radioact. 2010, 102, 448–461. [Google Scholar] [CrossRef]
- Lorda, J.F.; Fowler, S.W.; Miquel, J.-C.; Baena, A.R.Y.; Jeffree, R.A. 210Po/210Pb dynamics in relation to zooplankton biomass and trophic conditions during an annual cycle in northwestern Mediterranean coastal waters. J. Environ. Radioact. 2013, 115, 43–52. [Google Scholar] [CrossRef]
- Stewart, G.; Fowler, S.; Teyssié, J.; Cotret, O.; Cochran, J.; Fisher, N. Contrasting transfer of polonium-210 and lead-210 across three trophic levels in marine plankton. Mar. Ecol. Prog. Ser. 2005, 290, 27–33. [Google Scholar] [CrossRef]
- Uddin, S.; Al Ghadban, A.; Behbahani, M. Baseline concentrations of strontium and 90Sr in seawater from the northern Gulf. Mar. Pollut. Bull. 2013, 75, 301–304. [Google Scholar] [CrossRef] [PubMed]
- Uddin, S.; Al-Ghadban, A.; Behbehani, M.; Aba, A.; Al Mutairi, A.; Karam, Q. Baseline concentration of 210Po in Kuwait’s commercial fish species. Mar. Pollut. Bull. 2012, 64, 2599–2602. [Google Scholar] [CrossRef] [PubMed]
- Uddin, S.; Bebhehani, M. Bioaccumulation of 210Po in common gastropod and bivalve species from the northern Gulf. Ecotoxicol. Environ. Saf. 2014, 104, 132–135. [Google Scholar] [CrossRef] [PubMed]
- Bowen, H.J.M.; Dymond, J.A. Strontium and barium in plants and soils. Proceeding R. Soc. Br. 1955, 144, 355–368. [Google Scholar]
- Lowman, F.G.; Rice, T.R.; Richards, F.A. Accumulation and redistribution of radionuclides by marine organisms. In Radioactivity in the Marine Environment; National Academy of Sciences: Washington, DC, USA, 1971; pp. 161–199. [Google Scholar]
- Pentreath, R.J. General review of literature relevant to coastal water discharge. In Behaviour of Radionuclides Released in to Coastal Waters, IAEA-TECDOC-329; IAEA: Vienna, Austria, 1985; pp. 17–66. [Google Scholar]
- Hameed, P.S.; Shaheed, K.; Somasundaram, S.S.N. A study on distribution of natural radionuclide polonium-210 in a pond ecosystem. J. Biosci. 1997, 22, 627–634. [Google Scholar] [CrossRef]
- Carvalho, F.P.; Fowler, S.W. A double-tracer technique to determine the relative importance of water and food as sources of polonium-210 to marine prawns and fish. Mar. Ecol. Prog. Ser. 1994, 103, 251–264. [Google Scholar] [CrossRef]
- Beasley, T.M.; Heyraud, M.; Higgo, J.J.W.; Cherry, R.D.; Fowler, S.W. 210Po and 210Pb in zooplankton fecal pellets. Mar. Biol. 1978, 44, 325–328. [Google Scholar] [CrossRef]
- Al-Yamani, F.Y.; Prusova, I. Common Copepods of the Northwestern Arabian Gulf: Identification Guide; Al-Yamani, F.Y., Ed.; Kuwait Institute for Scientific Research: Safat, Kuwait, 2003; ISBN 99906-41-18-8. [Google Scholar]
- Mehrbach, C.; Culberson, C.H.; Hawley, J.E.; Pytkowicx, R.M. Measurement of the apparent dissociation constants of carbonic acid in seawater at atmospheric pressure. Limnol. Oceanogr. 1973, 18, 897–907. [Google Scholar] [CrossRef]
- Dickson, A.; Millero, F. A comparison of the equilibrium constants for the dissociation of carbonic acid in seawater media. Deep. Sea Res. Part A. Oceanogr. Res. Pap. 1987, 34, 1733–1743. [Google Scholar] [CrossRef]
- Benoit, G.; Hemond, H.F. Improved methods for the measurement of 210Po, 210Pb, and 226Ra. Limnol. Oceanogr. 1988, 336, 1618–1622. [Google Scholar] [CrossRef]
- Uddin, S.; Bebhehani, M. Planchet Holder for Electrodeposition of Materials. U.S. Patent US 9,856,573, 2 January 2018. [Google Scholar]
- Bojanowski, R.; Fukai, R.; Ballestra, S.; Asari, H. Determination of natural radioactive elements in marine environmental material by ion-exchange and alpha spectrometry. Int. At. Energy Agency 1983, 74, 1–13. [Google Scholar]
- Fowler, S.W. Trace elements in zooplankton particulate products. Nature 1977, 269, 51–53. [Google Scholar] [CrossRef]
- Satheeswaran, T.; Yuvaraj, P.; Damotharan, P.; Karthikeyan, V.; Jha, D.K.; Dharani, G.; Balasubramanian, T.; Kirubagaran, R. Assessment of trace metal contamination in the marine sediment, seawater, and bivalves of Parangipettai, southeast coast of India. Mar. Pollut. Bull. 2019, 149, 110499. [Google Scholar] [CrossRef] [PubMed]
- Zhang, A.; Wang, L.; Zhao, S.; Yang, X.; Zhao, Q.; Zhang, X.; Yuan, X. Heavy metals in seawater and sediments from the northern Liaodong Bay of China: Levels, distribution and potential risks. Reg. Stud. Mar. Sci. 2017, 11, 32–42. [Google Scholar] [CrossRef]
- Mahboob, S.; Ahmed, Z.; Khan, M.F.; Virik, P.; Al-Mulhm, N.; Baabbad, A.A. Assessment of heavy metals pollution in seawater and sediments in the Arabian Gulf, near Dammam, Saudi Arabia. J. King Saud Univ.-Sci. 2021, 34, 101677. [Google Scholar] [CrossRef]
- Altinok, I. A Review of Heavy Metals in Water, Sediment and Living Organisms in the Black Sea. Turk. J. Fish. Aquat. Sci. 2010, 10, 565–572. [Google Scholar]
- Al-Mutairi, K.A.; Yap, C.K. A Review of Heavy Metals in Coastal Surface Sediments from the Red Sea: Health-Ecological Risk Assessments. Int. J. Environ. Res. Public Health 2021, 18, 2798. [Google Scholar] [CrossRef] [PubMed]
- Heyraud, M.; Cherry, R.D. Polonium-210 and lead-210 in marine food chains. Mar. Biol. 1979, 52, 227–236. [Google Scholar] [CrossRef]
- Heyraud, M.; Cherry, R. Correlation of210Po and210Pb enrichments in the sea-surface microlayer with neuston biomass. Cont. Shelf Res. 1983, 1, 283–293. [Google Scholar] [CrossRef]
- Heyraud, M.; Fowler, S.W.; Beasley, T.M.; Cherry, R.D. Polonium-210 in euphausiids: A detailed study. Mar. Biol. 1976, 34, 127–136. [Google Scholar] [CrossRef]
- Fisher, N.; Nolan, C.; Fowler, S. Assimilation of metals in marine copepods and its biogeochemical implications. Mar. Ecol. Prog. Ser. 1991, 71, 37–43. [Google Scholar] [CrossRef]
- Fisher, N.S.; Olson, B.L.; Bowens, V.T. Plutonium uptake by marine phytoplankton in culture1. Limnol. Oceanogr. 1980, 25, 823–839. [Google Scholar] [CrossRef]
- Stewart, G.M.; Fisher, N.S. Experimental studies on the accumulation of polonium-210 by marine phytoplankton. Limnol. Oceanogr. 2003, 48, 1193–1201. [Google Scholar] [CrossRef]
- Stewart, G.M.; Fisher, N.S. Bioaccumulation of polonium-210 in marine copepods. Limnol. Oceanogr. 2003, 48, 2011–2019. [Google Scholar] [CrossRef]
- Carvalho, F.P.; Fowler, S.W. An experimental study on the bioaccumulation and turnover of polonium-210 and lead-210 in marine shrimp. Mar. Ecol. Prog. Ser. 1993, 102, 125–133. [Google Scholar] [CrossRef]
- Al Dousari, A.; Uddin, S. Cost Effective Digital Elevation Model using ASTER Stereo Data. Eur. J. Sci. Res. 2010, 41, 526–542. [Google Scholar]
- Al-Ghadban, A.N.; Uddin, S.; Beg, M.U.; Al Dousari, A.M.; Gevao, B. Ecological Consequences of River Manipulation and Drainage of Mesopotamian Marshes on the Arabian Gulf Ecosystem: Investigations on Changes in Sedimentology and Environment Quality with Special Reference to Kuwait Bay; Kuwait Institute for Scientific Research: Safat, Kuwait, 2008. [Google Scholar]
- Mazzocchi, M.G.; Paffenhoefer, G.A. Swimming and feeding behaviour of the planktonic copepod Clausocalanus furcatus. J. Plankton Res. 1999, 21, 1501–1518. [Google Scholar] [CrossRef]
- Dhanker, R.; Kumar, R.; Hwang, J.-S. Predation by Pseudodiaptomus annandalei (Copepoda: Calanoida) on rotifer prey: Size selection, egg predation and effect of algal diet. J. Exp. Mar. Biol. Ecol. 2012, 414–415, 44–53. [Google Scholar] [CrossRef]
- Gonçalves, R.J.; Kiørboe, T. Perceiving the algae: How feeding-current feeding copepods detect their nonmotile prey. Limnol. Oceanogr. 2015, 60, 1286–1297. [Google Scholar] [CrossRef]


| Microalgae | 209Po Concentration (Bq mL−1) |
|---|---|
| Isochrysis galbana | 0.088 ± 0.004 |
| Chaetoceros muelleri | 0.075 ± 0.003 |
| Dunaliella salina | 0.050 ± 0.002 |
| pH 8.2 | pH 7.7 | Model | pH | Replicate | ||||
|---|---|---|---|---|---|---|---|---|
| F5,23 | p | F1 | p | F4 | p | |||
| pH | 8.20 ± 0.01 | 7.69 ± 0.01 | 3828.0 | <0.0001 | 19,137.3 | <0.0001 | 1.1 | 0.41 |
| AT | 2890 ± 1 | 2610 ± 1 | 55,171.0 | <0.0001 | 275,848.0 | <0.0001 | 1.4 | 0.26 |
| Salinity | 42 ± 0 | 42 ± 1 | 1.0 | 0.45 | . | . | . | . |
| pCO2 | 307.0 ± 1.4 | 1131.0 ± 9.9 | 1394.7 | <0.0001 | 6969.6 | <0.0001 | 1.17 | 0.36 |
| Isochrysis galbana | Chaetoceros muelleri | Dunaliella salina | |||||||||
|---|---|---|---|---|---|---|---|---|---|---|---|
| Sample | Time | Mass (g) | Activity (mBq) | Concentration (Bq/g) | Mass (g) | Activity (mBq) | Concentration (Bq/g) | Mass (g) | Activity (mBq) | Concentration (Bq/g) | |
| Parvocalanus crassirostis | Fecal Pellet | 12 | 0.0517 | 550 | 10.64 | 0.0533 | 399 | 7.49 | 0.0562 | 281 | 5.00 |
| Fecal Pellet | 24 | 0.0566 | 498 | 8.80 | 0.0545 | 409 | 7.50 | 0.0533 | 267 | 5.01 | |
| Fecal Pellet | 36 | 0.0590 | 519 | 8.80 | 0.0561 | 421 | 7.50 | 0.0545 | 273 | 5.01 | |
| Fecal Pellet | 48 | 0.0583 | 513 | 8.80 | 0.0549 | 412 | 7.50 | 0.0537 | 269 | 5.01 | |
| Copepod | 48 | 0.0038 | 34.0 | 8.95 | 0.0040 | 36.4 | 9.10 | 0.0039 | 19.5 | 5.00 | |
| Water-microalgae | 48 | 1213 | 1176 | 808 | |||||||
| Ʃ algal food added | 48 | 40 mL | 3520 | 40 mL | 3000 | 40 mL | 2000 | ||||
| Loss | 48 | 193 | 146.6 | 82.5 | |||||||
| Euterpina acutifrons | Fecal Pellet | 12 | 0.0721 | 634 | 8.79 | 0.0672 | 504 | 7.50 | 0.0727 | 364 | 5.02 |
| Fecal Pellet | 24 | 0.0688 | 605 | 8.79 | 0.0695 | 521 | 7.50 | 0.0698 | 349 | 5.00 | |
| Fecal Pellet | 36 | 0.0730 | 642 | 8.79 | 0.0733 | 550 | 7.50 | 0.0709 | 355 | 5.01 | |
| Fecal Pellet | 48 | 0.0710 | 625 | 8.80 | 0.0718 | 539 | 7.51 | 0.0731 | 366 | 5.01 | |
| Copepod | 48 | 0.0042 | 48.9 | 11.64 | 0.0039 | 43.8 | 11.23 | 0.0041 | 20.5 | 5.00 | |
| Water-microalgae | 48 | 807 | 733 | 439 | |||||||
| Ʃ algal food added | 48 | 40 mL | 3520 | 40 mL | 3000 | 40 mL | 2000 | ||||
| Loss | 48 | 158.1 | 109.2 | 106.5 | |||||||
| Acartia pacifica | Fecal Pellet | 12 | 0.0670 | 590 | 8.81 | 0.0711 | 533 | 7.50 | 0.0683 | 342 | 5.01 |
| Fecal Pellet | 24 | 0.0698 | 614 | 8.80 | 0.0736 | 552 | 7.50 | 0.0685 | 343 | 5.01 | |
| Fecal Pellet | 36 | 0.0663 | 583 | 8.79 | 0.0644 | 483 | 7.50 | 0.0631 | 316 | 5.01 | |
| Fecal Pellet | 48 | 0.0702 | 618 | 8.80 | 0.0685 | 514 | 7.50 | 0.0674 | 337 | 5.00 | |
| Copepod | 48 | 0.0040 | 41 | 10.25 | 0.0038 | 38.5 | 10.13 | 0.0040 | 22 | 5.50 | |
| Water-microalgae | 48 | 910 | 779 | 551 | |||||||
| Ʃ algal food added | 48 | 40 mL | 3520 | 40 mL | 3000 | 40 mL | 2000 | ||||
| Loss | 48 | 164 | 100.5 | 89.0 | |||||||
| Isochrysis galbana | Chaetoceros muelleri | Dunaliella salina | |||||||||
|---|---|---|---|---|---|---|---|---|---|---|---|
| Sample | Time | Mass (g) | Activity (mBq) | Concentration (Bq/g) | Mass (g) | Activity (mBq) | Concentration (Bq/g) | Mass (g) | Activity (mBq) | Concentration (Bq/g) | |
| Parvocalanus crassirostis | Fecal Pellet | 12 | 0.0572 | 524 | 9.16 | 0.0512 | 390 | 7.62 | 0.0567 | 290 | 5.11 |
| Fecal Pellet | 24 | 0.0545 | 513 | 9.41 | 0.0548 | 417 | 7.61 | 0.0542 | 273 | 5.04 | |
| Fecal Pellet | 36 | 0.0572 | 509 | 8.90 | 0.0581 | 438 | 7.54 | 0.0551 | 278 | 5.05 | |
| Fecal Pellet | 48 | 0.0575 | 510 | 8.87 | 0.0554 | 419 | 7.56 | 0.0542 | 272 | 5.02 | |
| Copepod | 48 | 0.0043 | 39 | 9.07 | 0.0046 | 40.8 | 8.87 | 0.0045 | 22.9 | 5.09 | |
| Water-microalgae | 48 | 1268 | 1147.2 | 769.1 | |||||||
| Ʃ algal food added | 48 | 40 mL | 3520 | 40 mL | 3000 | 40 mL | 2000 | ||||
| Loss | 48 | 157 | 148 | 95 | |||||||
| Euterpina acutifrons | Fecal Pellet | 12 | 0.0689 | 612 | 8.88 | 0.0682 | 518 | 7.60 | 0.0722 | 361 | 5.00 |
| Fecal Pellet | 24 | 0.0693 | 610 | 8.80 | 0.0698 | 524 | 7.51 | 0.0703 | 354 | 5.04 | |
| Fecal Pellet | 36 | 0.0707 | 623 | 8.81 | 0.0699 | 531 | 7.60 | 0.0709 | 358 | 5.05 | |
| Fecal Pellet | 48 | 0.0698 | 621 | 8.90 | 0.0711 | 536 | 7.54 | 0.0725 | 364 | 5.02 | |
| Copepod | 48 | 0.0045 | 52 | 11.56 | 0.0043 | 49.1 | 11.42 | 0.0044 | 22.5 | 5.11 | |
| Water | 48 | 869 | 729.9 | 440.8 | |||||||
| Ʃ algal food added | 48 | 40 mL | 3520 | 40 mL | 3000 | 40 mL | 2000 | ||||
| Loss | 48 | 133 | 112 | 99.7 | |||||||
| Acartia pacifica | Fecal Pellet | 12 | 0.0688 | 610 | 8.87 | 0.0703 | 529 | 7.52 | 0.0691 | 348 | 5.04 |
| Fecal Pellet | 24 | 0.0693 | 612 | 8.83 | 0.0721 | 546 | 7.57 | 0.0695 | 349 | 5.02 | |
| Fecal Pellet | 36 | 0.0686 | 605 | 8.82 | 0.0695 | 523 | 7.53 | 0.0688 | 346 | 5.03 | |
| Fecal Pellet | 48 | 0.0699 | 616 | 8.81 | 0.0692 | 521 | 7.53 | 0.0694 | 351 | 5.06 | |
| Copepod | 48 | 0.0047 | 51 | 10.85 | 0.0045 | 46 | 10.22 | 0.0044 | 25 | 5.68 | |
| Water | 48 | 868 | 737 | 507 | |||||||
| Ʃ algal food added | 48 | 40 mL | 3520 | 40 mL | 3000 | 40 mL | 2000 | ||||
| Loss | 48 | 158 | 98 | 74 | |||||||
Disclaimer/Publisher’s Note: The statements, opinions and data contained in all publications are solely those of the individual author(s) and contributor(s) and not of MDPI and/or the editor(s). MDPI and/or the editor(s) disclaim responsibility for any injury to people or property resulting from any ideas, methods, instructions or products referred to in the content. |
© 2022 by the authors. Licensee MDPI, Basel, Switzerland. This article is an open access article distributed under the terms and conditions of the Creative Commons Attribution (CC BY) license (https://creativecommons.org/licenses/by/4.0/).
Share and Cite
Behbehani, M.; Uddin, S.; Dupont, S.; Fowler, S.W.; Gorgun, A.U.; Al-Enezi, Y.; Al-Musallam, L.; Kumar, V.V.; Faizuddin, M. Ocean Acidification-Mediated Food Chain Transfer of Polonium between Primary Producers and Consumers. Toxics 2023, 11, 14. https://doi.org/10.3390/toxics11010014
Behbehani M, Uddin S, Dupont S, Fowler SW, Gorgun AU, Al-Enezi Y, Al-Musallam L, Kumar VV, Faizuddin M. Ocean Acidification-Mediated Food Chain Transfer of Polonium between Primary Producers and Consumers. Toxics. 2023; 11(1):14. https://doi.org/10.3390/toxics11010014
Chicago/Turabian StyleBehbehani, Montaha, Saif Uddin, Sam Dupont, Scott W. Fowler, Aysun U. Gorgun, Yousef Al-Enezi, Lamya Al-Musallam, Vanitha V. Kumar, and Mohammad Faizuddin. 2023. "Ocean Acidification-Mediated Food Chain Transfer of Polonium between Primary Producers and Consumers" Toxics 11, no. 1: 14. https://doi.org/10.3390/toxics11010014