Effects of Environmental Conditions on Cathode Degradation of Polymer Electrolyte Fuel Cell during Potential Cycle †
Abstract
:1. Introduction
2. Experimental Method
2.1. MEA and Single Cell Specifications
2.2. Load Cycle Durability Test
3. Results and Discussion
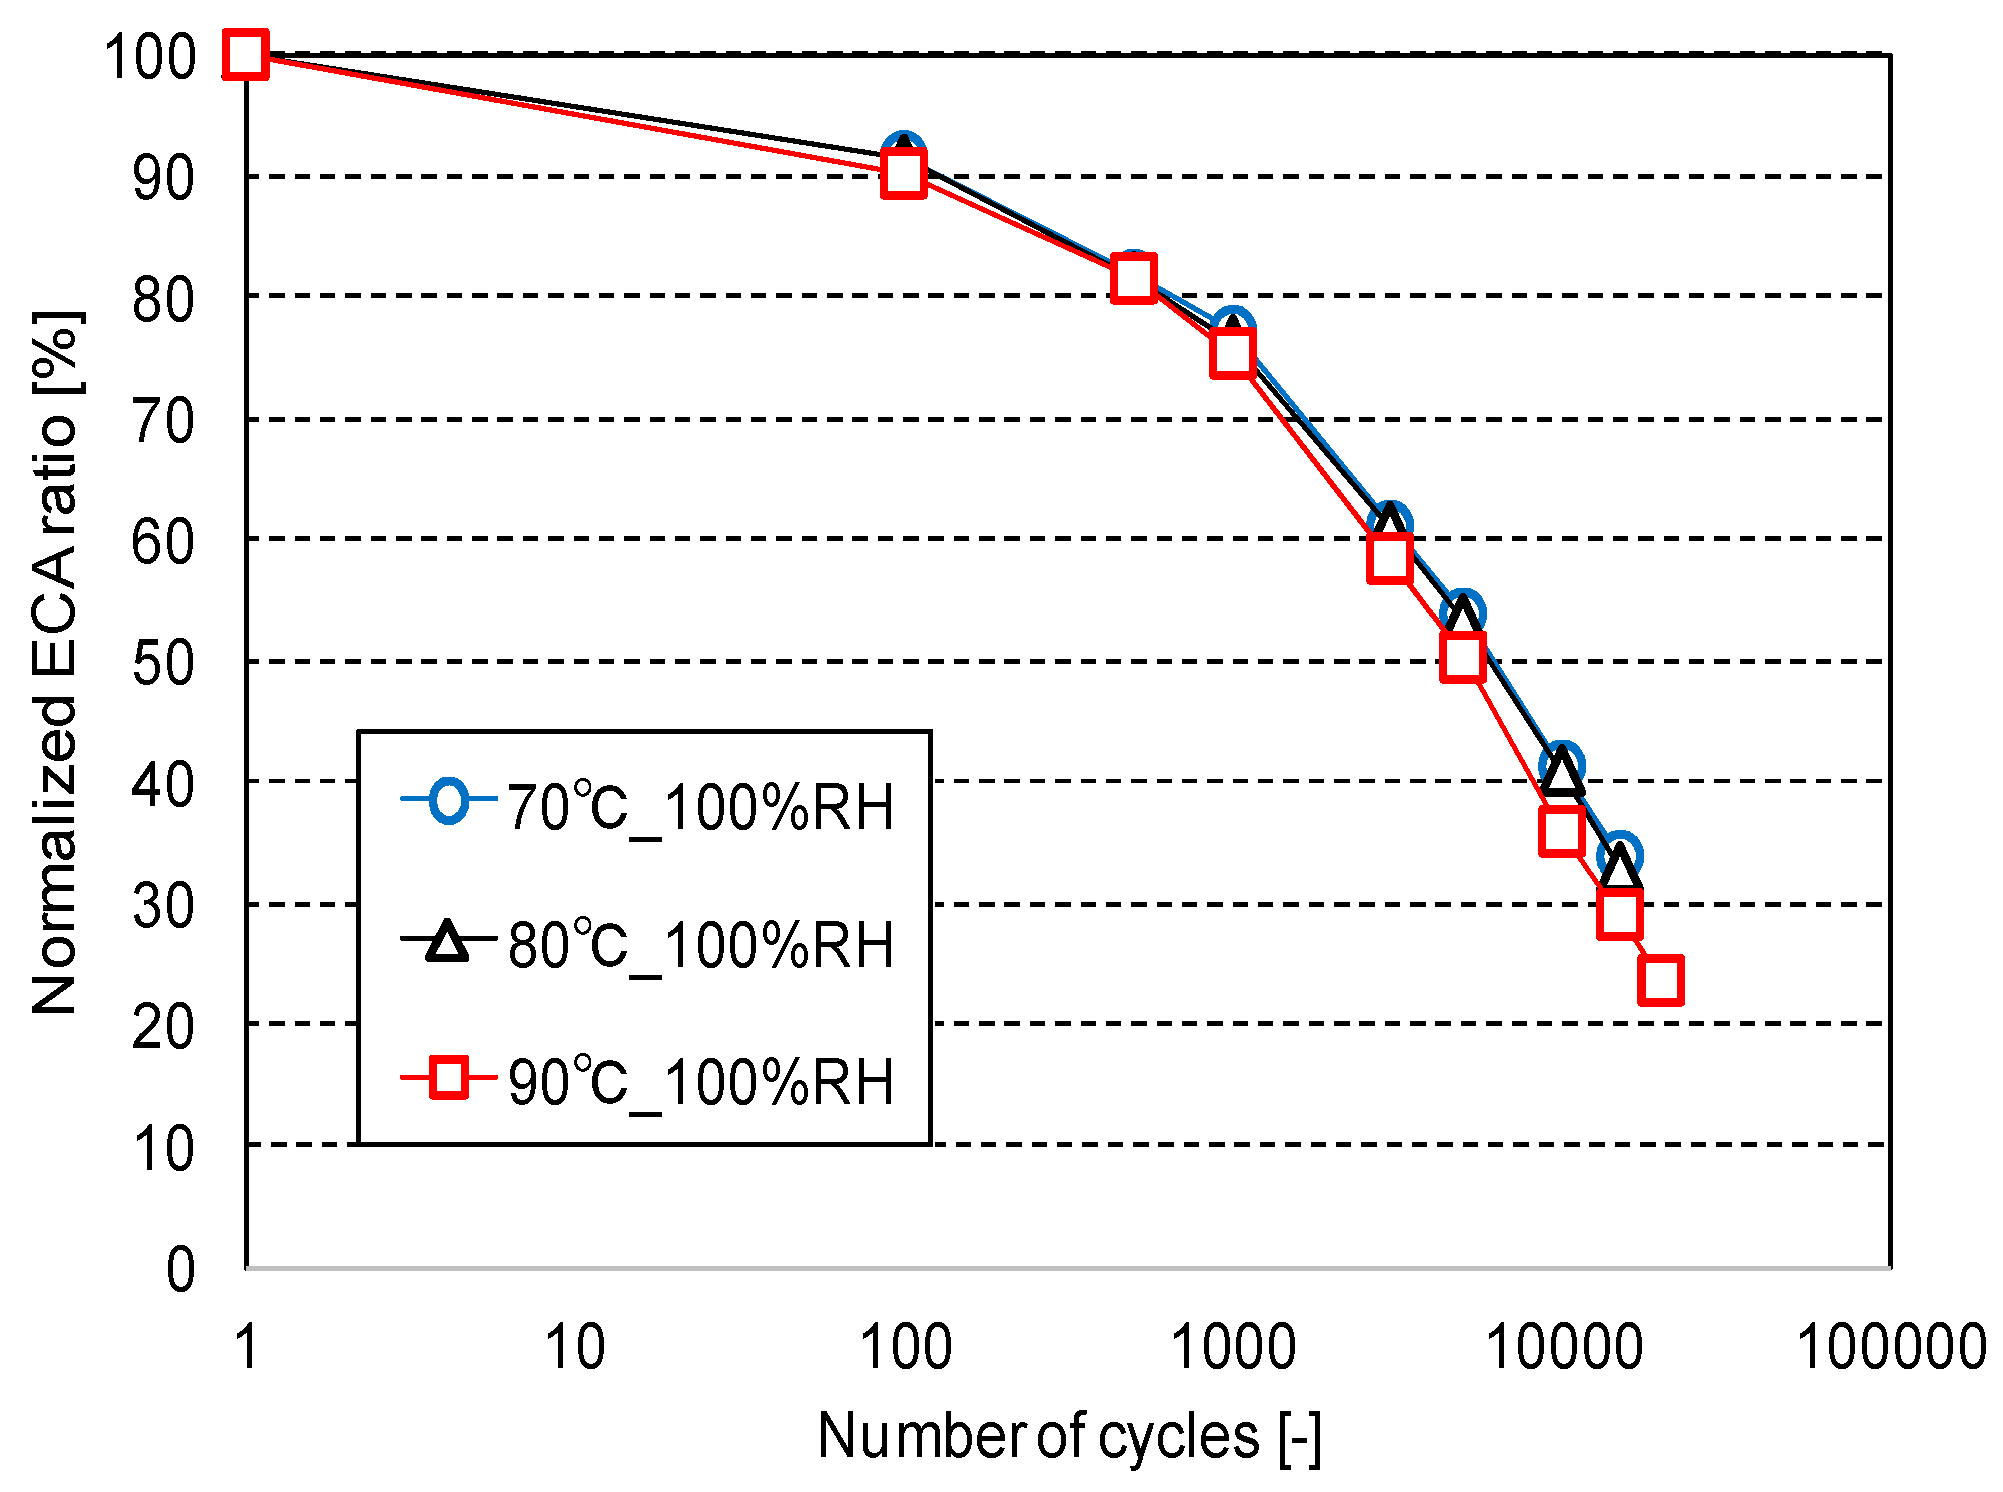
3.1. Effects of Cell Temperature
3.2. Effects of Humidity
4. Conclusions
Author Contributions
Funding
Conflicts of Interest
References
- Li, Y.; Moriyama, K.; Gu, W.; Arisetty, S.; Wang, C.Y. A One-Dimensional Pt Degradation Model for Polymer Electrolyte Fuel Cells. J. Electrochem. Soc. 2015, 162, F834–F842. [Google Scholar] [CrossRef] [Green Version]
- Takei, C.; Kakinuma, K.; Kawashima, K.; Tashiro, K.; Watanabe, M.; Uchida, M. Load cycle durability of a graphitized carbon black-supported platinum catalyst in polymer electrolyte fuel cell cathodes. J. Power Sour. 2016, 324, 729–737. [Google Scholar] [CrossRef] [Green Version]
- Wu, B.A.; Qunhui, S.; Yulin, D.; Fuller, T.F. The effect of humidity and oxygen partial pressure on degradation of Pt/C catalyst in PEM fuel cell. Electrochim. Acta 2009, 54, 1826–1833. [Google Scholar]
- Ohyagia, S.; Matsudaa, T.; Iseki, Y.; Sasakia, T.; Kaito, C. Effects of operating conditions on durability of polymer electrolyte membrane fuel cell Pt cathode catalyst layer. J. Power Sour. 2011, 196, 3743–3749. [Google Scholar] [CrossRef]
- Hashimasa, Y.; Numata, T.; Shimizu, T. Comparison of test results on load cycle durability of polymer electrolyte fuel cell cathode catalysts. Int. J. Hydrog. Energy 2015, 40, 11543–11549. [Google Scholar] [CrossRef]
- Hashimasa, Y.; Shimizu, T.; Matsuda, Y.; Imamura, D.; Akai, M. Verification of Durability Test Methods of an MEA for Automotive Application. ECS Trans. 2013, 50, 723–732. [Google Scholar] [CrossRef]
- Vielstich, W.; Gasteiger, H.A.; Lamm, A. Handbook of Fuel Cells Fundamentals, Technology and Applications, Volume 3: Fuel Cell Technology and Applications; John Wiley & Sons: West Sussex, UK, 2013; 597p. [Google Scholar]


| Parameter | Measurement Condition |
|---|---|
| Cell temperature | 70, 80, 90 °C |
| Relative humidity | 65, 100, 150% RH |
| Gaseous species | Hydrogen (anode), Nitrogen (cathode) |
| Flow rate | 0.2 (anode), 0.8 (cathode) L min−1 |
| Pressure | Atmospheric |
| Cell Temperature | 80 °C |
| Hydrogen Flow Rate | 0.2 L min−1 |
| Nitrogen Flow Rate | 0 L min−1 |
| Anode/Cathode Relative Humidity | 100% |
| Scan Range | 0.05–0.9 V vs. RHE |
| Scan Rate | 50 mV s−1 |
| Scan Cycle | 5 |
| Cell Temperature | 80 °C |
| Hydrogen Utilization Ratio | 70% |
| Air Utilization Ratio | 40% |
| Hydrogen Dew Point | 77 °C |
| Air Dew Point | 60 °C |
| Outlet Pressure | Atmospheric |
© 2019 by the authors. Licensee MDPI, Basel, Switzerland. This article is an open access article distributed under the terms and conditions of the Creative Commons Attribution (CC BY) license (http://creativecommons.org/licenses/by/4.0/).
Share and Cite
Hashimasa, Y.; Daitoku, H.; Numata, T. Effects of Environmental Conditions on Cathode Degradation of Polymer Electrolyte Fuel Cell during Potential Cycle. World Electr. Veh. J. 2019, 10, 24. https://doi.org/10.3390/wevj10020024
Hashimasa Y, Daitoku H, Numata T. Effects of Environmental Conditions on Cathode Degradation of Polymer Electrolyte Fuel Cell during Potential Cycle. World Electric Vehicle Journal. 2019; 10(2):24. https://doi.org/10.3390/wevj10020024
Chicago/Turabian StyleHashimasa, Yoshiyuki, Hiroshi Daitoku, and Tomoaki Numata. 2019. "Effects of Environmental Conditions on Cathode Degradation of Polymer Electrolyte Fuel Cell during Potential Cycle" World Electric Vehicle Journal 10, no. 2: 24. https://doi.org/10.3390/wevj10020024
APA StyleHashimasa, Y., Daitoku, H., & Numata, T. (2019). Effects of Environmental Conditions on Cathode Degradation of Polymer Electrolyte Fuel Cell during Potential Cycle. World Electric Vehicle Journal, 10(2), 24. https://doi.org/10.3390/wevj10020024


