Article

Range Extension via Electrothermal Recuperation

1
Institute of Automotive Technology, Technical University of Munich, Boltzmannstr. 15, 85748 Garching, Germany
2
Webasto Thermo & Comfort SE, Friedrichshafener Strasse 9, 82205 Gilching, Germany
*
Author to whom correspondence should be addressed.
World Electr. Veh. J. 2020, 11(2), 41; https://doi.org/10.3390/wevj11020041
Submission received: 17 March 2020 / Revised: 15 May 2020 / Accepted: 19 May 2020 / Published: 25 May 2020

Abstract

:
One of the decisive reasons for the slow market penetration of electric vehicles is their short driving range, especially in cold temperatures. The goal of this paper was to increase the driving range in cold temperatures. Electric vehicles recover kinetic energy by recuperation and storage in the battery. However, if the battery is fully charged or cold, the option of recuperation is severely limited. Braking energy is dissipated into the environment via the mechanical brake, and the range thus decreases. Electrothermal recuperation (ETR) enables the braking power to be used in heater systems and thus saves energy in the overall system. In this paper, ETR was investigated with a highly responsive serial layer heater. An overall model consisting of the electric powertrain, the heating circuit, and the vehicle interior was developed and validated. The limitations of recuperation capability were determined from driving tests. The factors state of charge and battery temperature were varied in the conducted simulations in order to quantify the range increase through ETR. The results showed that the range could be increased via electrothermal recuperation by up to 8% at −10 °C in a real driving cycle, using a serial heater. A control strategy of the heating circuit enabled the coolant circuit to function as buffer storage. The interior temperature—and consequently user comfort—remained unchanged.

1. Introduction

The short range of battery electric vehicles (BEVs) remains a reason for their lack of wide acceptance among car buyers. In addition to their high price, this has led to a low sales rates for electric vehicles [1,2]. In the winter in particular there is an additional, marked loss of range of up to 35% [3,4,5]. The main reason is the energy-intensive heating of the interior and the battery, because far less waste heat is available compared to an internal combustion engine vehicle due to the high efficiency of the electric motor and the power electronics. An additional electric heater must be installed in the electric vehicle to guarantee user comfort, which influences the driver’s concentration ability and therefore safety. Consuming up to 10 kW [6], this heater is by far the largest auxiliary energy consumer in the electric vehicle alongside the air-conditioning system.
In addition, at low temperatures, the battery has a lower removable capacity, higher internal resistance, and a reduced charging performance [5,7,8]. While the capacity directly influences the range, increasing internal resistance leads to higher losses and reduced chargeability. Low temperatures, as well as a high state of charge (SoC) affect the ability to recover braking energy, which is actually a charging situation [9]. Consequently, less recovered energy from braking is available for the traction system. Instead, the vehicle is slowed down by the hydraulic friction brake, and the thermal energy from the brake discs dissipates into the environment.
This publication analyzes the use of a highly responsive and at the same time close-to-standard heater in recuperation situations [6]. In the case of a cold and/or fully charged battery, the amount of recuperation energy that the battery is not able to absorb is transformed into heat in the electric heater and is temporarily stored in the heating circuit (Figure 1) in a process known as electrothermal recuperation (ETR) [10]. In the above-mentioned recuperation situations, the heater does not extract any electrical energy from the battery for a short continuous period. This means that there is more energy available for propulsion and thus a greater driving range. The basic condition of this system is unchanged user comfort due to a lack of temperature fluctuations.

2. State of the Art

This section provides the basics of interior heating and recuperation of electric vehicles. First, the energy consumption due to electric heating is presented in detail. Afterwards, the recuperation is illustrated, whereby the focus is on ETR in addition to the classic electrical recuperation. Finally, current research on ETR is discussed and critically reviewed.

2.1. Electric Vehicle Interior Heating

Due to the high efficiency of the battery, the power electronics, and the motor in a BEV, the energy and the temperature level of the waste heat are not sufficient to heat the vehicle interior and thus guarantee user comfort. Consequently, electric vehicles need electric heaters which use electrical energy from the battery and thus have a direct influence on the vehicle range [11].
Electric resistance heaters and/or heat pumps are used in electric vehicles. Electric resistance heaters are often based on the principle of positive temperature coefficients (PTCs). The operating point is adjusted to the heater core temperature and the coolant temperature is regulated in stages. PTC heaters can be installed as air heaters directly in the inlet section of the ventilation system or connected to a heat exchanger via a coolant circuit [12]. In contrast to the PTC, the resistance of a layer heater applied to the heat exchanger behaves almost independently of temperature. The power control is infinitely variable via pulse width modulation [6].
Another heating technology is the heat pump, which works in the reverse manner to an air-conditioning system. Heat energy from the environment can be absorbed by the expansion of the refrigerant. As a result, the coefficient of performance (CoP) can be greater than 1, in contrast to resistance heaters. At its best, the CoP is about 3. However, at low temperatures the CoP decreases and the condenser can freeze in negative temperatures and high air humidity, which means that no more heat output is possible. Therefore, heat pumps are usually only offered in combination with resistance heaters. Due to the high power of up to 10 kW [6] for electric heating, the range of an electric vehicle is significantly influenced. Iora et al. [11] investigated the range decrease of a Nissan Leaf. The heating power was assumed to be linear between 6 kW at −15 °C and 0.2 kW at 20 °C, which means a heat output of about 3.5 kW at 0 °C. Measurements from a BMW i3 showed that the heating power was overestimated. At approximately 0 °C, the stationary heat output was 1.7 kW. Over the total duration of the used New European Driving Cycle (NEDC), the heating power of a vehicle that was fully preconditioned to the ambient temperature at the start of the journey was 2.8 kW on average, according to the measurements. Therefore, the duration of the journey is crucial. A range loss of more than 60% is assumed to be overestimated. The range is assumed to depend on the battery’s charging capacity. With a non-chargeable battery, the range is only 78% at 20 °C [11]. In the investigations of Adermann et al. [13] the heating energy of the heat pump used was 7% of the total energy. Looking at the published data provided, a share of approximately 15% was shown for journeys with a cold interior (0 °C). The results of Broglia et al. [14] showed a maximum increase of 34% energy consumption, compared to the summer range, for a minimum ambient temperature of −5 °C. In direct comparison with a PTC heater and a heat pump, the heat-pump system exhibits significantly higher energy savings of 60% in electric busses [15]. However, with a service life of twelve years, the high acquisition cost and higher maintenance cost of a heat pump system are not compensated [15].

2.2. Recuperation

The powertrain of an electric vehicle consists of the traction battery, the power electronics, and one or more machines. During braking, the motor is able to transform kinetic energy into electrical energy, which is then rectified by the power electronics and charged into the battery (recuperation). Vehicle safety is a major factor influencing the recuperation performance [16]. On the one hand, the braking power can exceed the maximum recuperation power of the powertrain, and on the other hand, the ratio of braking power between the axles and, if necessary, also between the wheels must remain unaffected by recuperation. For this reason, a mechanical brake system is still installed in the vehicle to guarantee vehicle safety. The control of the braking torque between recuperative and mechanical braking is called brake blending (Figure 2) [17].
In the driving data collected by Adermann et al. [13], the average proportion of recuperation energy was 18% of the total driving energy. Less energy was recuperated when driving with a cold battery (average 14%). In other studies, the amount of recuperation energy was of a similar dimension [18] or up to 30% of the total driving energy [19,20].

2.2.1. Limitation of Recuperation due to the Battery

As previously described, driving stability plays an important role in recuperation capability [16]. The machine also limits recuperation (Figure 2). The ETR uses the option of store recuperation energy in parallel to the feed into the battery. Therefore, the factors affecting the battery’s recuperation limitation are described here in more detail.
The two significant factors for driving range reductions are the SoC and the battery temperature. With rising SoC, the battery voltage also increases. The overvoltage required for charging or recuperation as the difference between the open-circuit voltage and the safety-relevant charging cut-off voltage is reduced, which limits the charging power. Furthermore a higher cut-off voltage accelerates battery aging [21]. In most vehicles, however, only a limited range within the SoC is released for use [22]. This results in a greater difference in voltages, which counteracts the effect described above.
The SoC and battery temperature are two of the main stress factors of battery aging [23]. During the operation of electric vehicles, battery aging occurs, which leads to a lower capacity and an increased internal resistance. For the user, this means a shorter driving range and lower performance [24]. While charging the battery, the lithium ions usually intercalate into the grid structures of the anode, which consists of graphite [25]. Lithium plating is the deposition of metallic lithium on the surface of the anode [26]. The amount of cyclable lithium is reduced and the capacity of the cell decreases. The metallic lithium forms dendrites, which in the worst case can lead to a short circuit of the cell [27]. Lithium plating mainly occurs if the anode potential drops below the standard potential of Li/Li+ due to the charging current [9].
Due to the higher internal resistance at low temperatures, the charging overvoltage is higher if the same current is applied [26]. A higher state of charge also reduces the overvoltage potential. Therefore, especially at cold temperatures and high SoC in combination with high C-rates, the aging mechanism (lithium plating) occurs more intensively [26,28,29]. Waldmann et al. [9] named lithium plating as the main aging effect below 25 °C. Lithium plating as an irreversible aging mechanism that should be prevented by limiting the charging [8] and consequently the recuperation capability. In contradiction to this is the higher depth of discharge (DoD) with reduced recuperation [24], which is another stress factor of battery aging. Accordingly, a high recuperation capacity reduces battery aging by reducing the DoD [24].

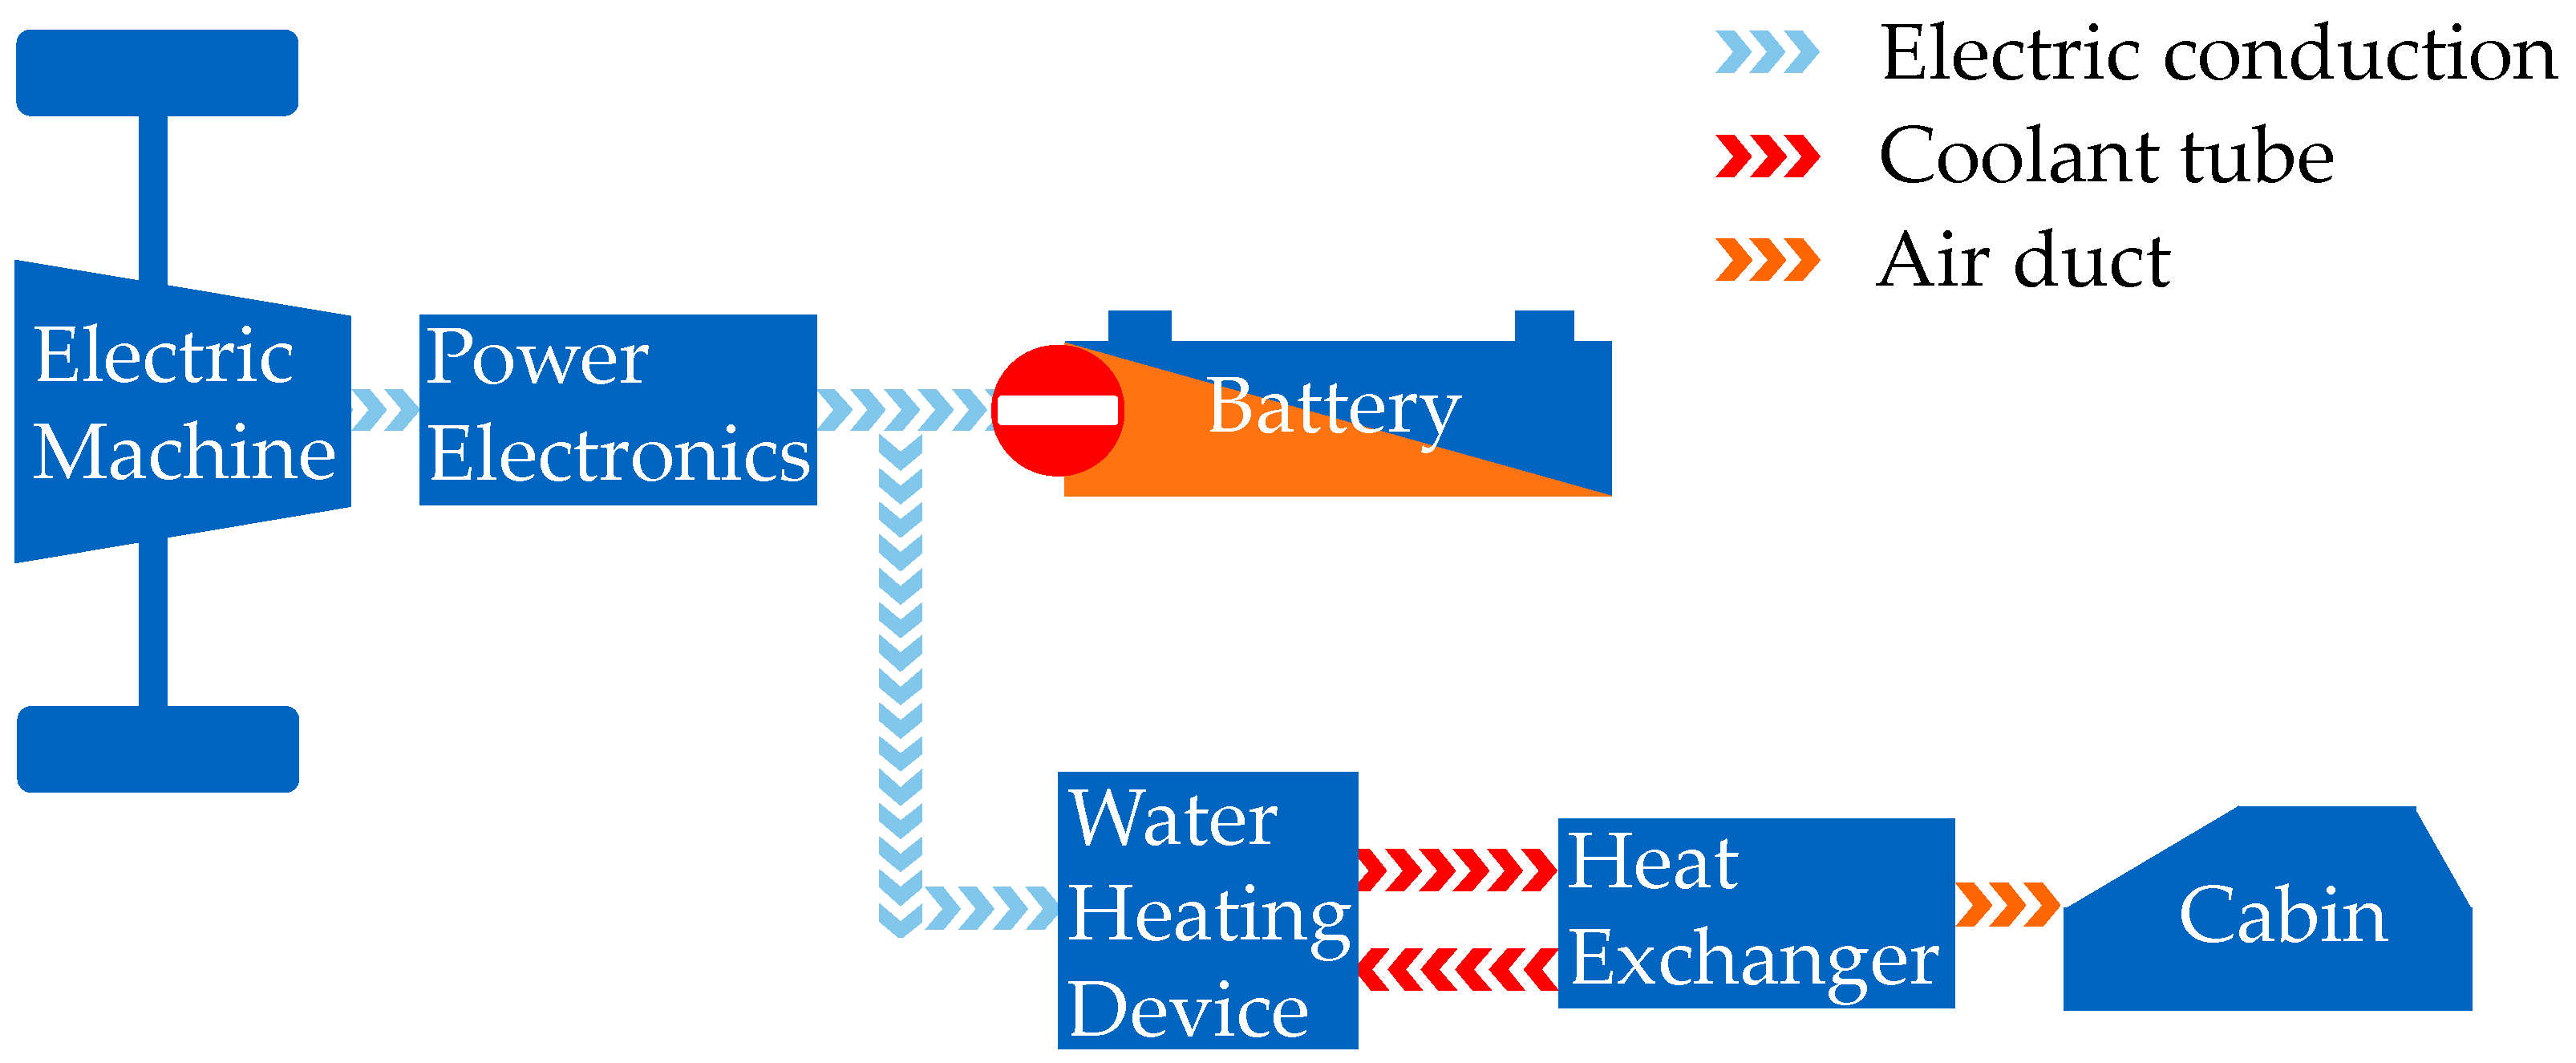
2.2.2. Electrothermal Recuperation (ETR)

Range reductions due to energy consumption of the auxiliary consumers as well as the limitations of the electrical recuperation have led to demand for optimized thermal management in electric vehicles. ETR utilizes the electrical recuperation power that cannot be recharged to the traction battery. This margin of recuperation power is used for the direct supply of energy to the cabin heating system, and thus leads to an increase in overall efficiency. Current research is already investigating the field of ETR in order to increase the range of electric vehicles.
Lieb et al. [30] analyzed the potential of the ETR using an electrical brake resistor to transfer the generated heat into the coolant circuit. The utilized driving data consisted of the Artemis cycle, examined for three different electric vehicle classes. The simulation assumed the battery temperature to be equal to the ambient temperature. Limitations in electrical recuperation enabled the concept to convert power at the brake resistor into heat, which was fed into the cooling circuit and used to heat the passenger cabin. An advantage of the brake resistor was the usable overload capacity, which allowed high peaks of recuperation power to be handled. The results of Lieb et al. [30] showed a maximum reduction in the net power demand of 12% depending on the state of charge (SoC) and the battery temperature. The highest savings were achieved at a high SoC and low battery temperatures.
Further investigations by Lieb [31] indicated the potential of the ETR by using an electrical brake resistor, replacing the series heater in the cooling circuit. The battery temperature could vary from −20 °C to 20 °C. The driving cycle used was the Artemis cycle for three different cases (urban, rural road, and motorway) as well as three different electric vehicle classes (micro, compact, and heavy). For a fully charged battery, a battery temperature between 0 °C and −10 °C, and the urban cycle, the energy-saving potential could increase to as much as 15%. The rural road cycle yielded an energy-saving potential of 4–7%. Low temperatures of between −5 °C and −10 °C and state of charge less than 70% indicated the thermal inertia of the brake resistor, which led to an overall energy loss due to heat losses and the wasting of the excess recuperation power in comparison to the series heater.
Moreover, Lieb’s [31] results were shown for three defined driving behaviors. In this case, the driving behavior was separated into three 24-h driving cycles (commuter with garage, commuter without garage, and urban car sharing) with specified charging behavior and preconditioning of the traction battery. The commuter behavior was characterized by two Artemis rural road cycles (return journey) representing the journey to work and back home. The urban car-sharing cycle was characterized by six sweeps of the Artemis urban cycle. The results for the three 24-h driving cycles indicated a maximum energy-saving potential of 12% for the urban car sharing cycle, considering an ambient temperature of 10 °C. Decreasing temperatures showed a tendency of decreasing energy-saving potential due to increasing driving resistances as well as heating power.
Lastly, Lieb’s [31] results were weighted over the period of one year for the underlying regions Scandinavia, Germany, and Spain. The results showed the highest potentials for Scandinavia and Germany due to a lower mean annual temperature in comparison to Spain. Potentials of 8.5% to 9% could be achieved.
Research by Sawazki et al. [10] showed the energy-saving potential of the ETR for simulations of an electric vehicle using the Worldwide harmonized Light vehicle Test Cycle (WLTC). The operating strategy was defined by the recuperation power, divided into the usage of electric recuperation and ETR. Simulations were examined for ambient temperatures between −20 °C and 10 °C. The heating power demand of the brake resistor varied between 0 kW and 5 kW, depending on the ambient temperature. Within a given simulation, the heating power was constant. The power capability of the traction battery varied between 0 kW and 30 kW and was assumed to be constant during a cycle run. Results indicated an energy-saving potential of approximately 5% for a traction-battery potential-power capability of 0 kW and an ambient temperature of −20 °C. Increasing the ambient temperature yielded a potential of 6.3% for −10 °C and 7.8% for 10 °C, respectively. A decrease in the ambient temperature increased the amount of heating power required, and thus decreased the energy-saving potential of the ETR due to more direct feeding of electric recuperation power to the heating device. An increase in the traction battery capacity also lowered the energy-saving potential.
The ETR in the presented research studies was based on the usage of brake resistors to convert recuperation power into heating power. Replacing the series heater with the brake resistor increased the system’s complexity and resulted in an increase in weight, installation space, and costs. Therefore, this study utilizes the ETR via a series layer heater.
Furthermore, Lieb’s [31] results indicated the disadvantage of the brake resistor at low temperatures and low states of charge, which could lead to an overall energy loss due to high thermal inertia. This study intends to achieve a quick heating-up time via the use of the series heater.
The investigation of Sawazki et al. [10] presumed a constant power capacity of the traction battery as well as a direct dependency between the ETR and the ambient temperature. The ambient temperature defines the amount of required heating power, and thus influences the efficiency of the ETR. Realistically, the power capacity of the traction battery cannot be assumed to be constant: instead it depends on the battery temperature and the SoC.

2.3. Review of the State of the Art

Based on the state of the art, this research investigates the use of a highly responsive series heater for ETR. In contrast to the braking resistor [31], the heat-up time and efficiency in nominal operation is not affected. The presented research [30,31] studies disregarded the application of real driving data by using driving cycles such as Artemis cycle or WLTC. Due to deviations in energy consumption between driving cycles and real driving data, this study tends towards simulations with real driving data in order to achieve more realistic results. In order to increase the accuracy of the ETR, this study classifies the temperature into ambient temperature, battery temperature, coolant temperature, and cabin temperature.

3. Modeling

The overall approach included three individual steps. In order to create comparable and reproducible conditions for quantifying the range extension of ETR, the BMW i3 test vehicle was modeled in MATLAB/Simulink and validated by performing real drives (step 1). In the second step, the adopted battery model was likewise adapted to the BMW i3 test vehicle and validated. The recuperation behavior of the battery was investigated by driving tests and reproduced in a map of the maximum battery recuperation current, depending on the state of charge and the battery temperature. Finally, the model of the heating circuit was developed and validated using the driving data.

3.1. Longitudinal Dynamics

In this subsection, the longitudinal dynamics of the test vehicle are introduced, as published by Danquah et al. [32] in the research project ‘’sim2gether”. An open source library was specified for a variety of modular vehicle components, which were subsequently utilized in this study in order to create a complete-vehicle model of the test vehicle. The embodied longitudinal dynamics model consisted of the subsystems Cycle, Driver, Electric Vehicle Controller Unit (EVCU), Drivetrain, and Longitudinal Vehicle, with a parallel bus structure for internal communication.
A forward simulation of the longitudinal dynamics was utilized for the purpose of precisely reproducing driving behavior. The Driver subsystem used a PI controller to represent a real driver. It controlled the position of the accelerator and brake pedal in order to control the velocity of the vehicle, so as to target the velocity of the imported driving cycle, provided by the Cycle subsystem. Recorded real driving cycles with the test vehicle were used as cycle input for achieving the goal of realistic simulation results. The cycle data sample time was set to 0.1 s to ensure accuracy. The output of the signals accelerator pedal position and brake pedal position were transferred to the subsystem EVCU, where the calculation of the required torque curve took place.
The subsystem Drivetrain consisted of the models of the electric machine (EM), the gearbox, and the wheels. Power losses were modeled via the components’ efficiency factors. Running the simulation with attached callbacks created an efficiency diagram of the EM, using the test vehicle’s characteristic data [33]. Starting from the vehicle torque curve, the required EM torque curve and the loaded EM current profile for the battery model were calculated.
The calculation of the driving resistance was achieved in the subsystem Longitudinal Vehicle, and considered slope resistance, roll resistance, acceleration resistance, and air resistance. Slope resistance was assumed to be zero, since the slope of the utilized real driving cycle is negligible.
To ensure the validity of the results, the complete-vehicle model was validated with recorded real driving data. Figure 3 indicates the predetermined and actual velocity profiles of the Worldwide harmonized Light vehicle Test Cycle (WLTC). In addition, the corresponding real driving cycles of a circuit created at the Technical University of Munich, known as the “FTM cycle” [13], are shown.
Figure 4 indicates the deviation between the driving data. By 1508s, the velocity difference had reached a peak difference of 15 km/h, which can be explained by the control behavior of the PI controller for extraordinarily high accelerations. Nevertheless, this study analyzed the potential of ETR by comparing two simulations. Therefore, the validation results are considered as sufficiently accurate.

3.2. Battery Model

The battery model was based on the work of Reiter et al. [34]. The battery model used in the longitudinal dynamics model was based on an electrical equivalent circuit model which includes the SoC-bound battery voltage, the specific hysteresis curve, the internal resistance, and the battery cells’ capacitive behavior [34]. All battery-specific values are valid for Panasonic’s cylindrical NCR18650PF cells. The test vehicle used a similar cell chemistry but a different geometry (prismatic). Nevertheless, the model was parameterized in order to illustrate the test vehicle’s battery pack. Possible temperature dependencies of the parameters other than the internal resistance were neglected.
In addition to the electrical equivalent circuit model, a basic thermal model was included. The battery cells’ heat production—both reversible and irreversible—was considered, and the heat transfer between the battery pack and the environment was integrated into the model [34]. Temperature differences in between the cells and inside single cells were not considered. The resistances and capacities of the electrical equivalent circuit model were varied to match the test vehicle’s battery behavior. The battery pack was modeled using 96 NCR18650PF cells in series and 22 in parallel. This matched the 96 parallel prismatic cells existing in the test vehicle in terms of pack voltage and energy capacity. The thermal battery model was originally also based on the above-mentioned cylindrical cells. It is changed to fit the real prismatic cells used in the BMW i3. Therefore, the cell’s geometric data was changed, and empirical assumptions were made to fit the thermal behavior to the measured data in real driving cycles.

Limit of the Charging Power

As described in Section 2.2, the charging current of the battery depends on the battery temperature and the state of charge. In order to realistically reproduce the vehicle’s behavior, a characteristic map described the maximum recuperation current as a function of the above factors. In order to determine the characteristic map, targeted braking maneuvers were performed on a private road and on an air-conditioned chassis dynamometer. In addition, real driving cycles in urban, rural, and motorway traffic were also used for the generation. To determine whether there was a limitation of the recuperation current, the recorded speed profiles were fed into the described simulation model of the test vehicle. If the maximum recorded current differed from the simulated battery current, a limitation of the recuperation was assumed. The individual recuperation phases covered a temperature range from −10 °C to 18 °C and a state of charge from 16.5% to 87.1%. Since the maximum net charge state of the test vehicle was 90%, the SoC range was almost completely covered. A total of 282 measuring points were used to generate the characteristic map. Figure 5 shows the map of the maximum battery recuperation current as a function of the battery temperature and the state of charge.
It was shown that the battery temperature has a significant influence on the maximum recuperation current, while the state of charge limits the current only slightly. The latter is mainly due to the net charge limit of 90%, because this provides a sufficiently large gap to the final discharge voltage. A regression analysis performed using MATLAB yielded the maximum recuperation current as a function of battery temperature and state of charge:
I = f ( T B a t ,   S o C ) = 69.14   A + 6.203 A ° C 0.686 A %   S o C + 0.0895   ( A K ) 2 0.05548 A K %   S o C
The model was assessed as being of satisfactory quality, based on the quadratic error of 98.54%.

3.3. Vehicle Heating Circuit

The vehicle’s heating circuit consisted of five main elements: the water heating device, two coolant tubes, the heat exchanger and the passenger cabin (Figure 1). The heating circuit’s purpose was to increase the cabin temperature to a set value and to sustain it for the sake of optimal passenger comfort. The cabin temperature was manipulated by sucking in cool fresh air, mixing it with recycled air from the passenger cabin in the desired ratio and heating it in the heat exchanger before blowing it into the cabin. Pumped through the heating circuit, the cold thermal fluid was heated inside of the water heating device with near-optimal efficiency. The heated coolant was then transported through the first coolant tube where it lost some of its thermal energy due to convection on the tube’s surface. Inside the heat exchanger, which was simplified as a cross-flow heat exchanger, the thermal fluid transferred its heat to the mixture of fresh and recycled air that is transiting. The heated air was then blown into the cabin, while the cooled-down thermal fluid was pumped through the second diabatic coolant tube back into the water heating device where the cycle repeated. A fixed thermal capacity corresponded to the heat capacity of the air and the objects inside the vehicle cabin at the desired temperature, and was implemented as a single block capacity. Heat conduction through the vehicle body to the surface was implemented as constant, and convection losses were implemented partially through the vehicle’s surface using the longitudinal velocity, and through the leakage mass flow of the air due to overpressure. The corresponding equations were adopted from Nitz and Hucho [35].
The modeling of the heating circuit and the cabin was based on the work of Wagner et al. [36]. Validation of the heating circuit model was run on a dedicated testbench inside a climate chamber, with the modules used inside the test vehicle. The cabin model was validated with the data provided from tests using a VW e-Golf. As in this paper the model was validated only on a testbench, some parametrization had to be performed in order to fit the models to the real vehicle. The thermal fluid’s mass flow was set to the fixed value of 500 L/h measured in the test vehicle. Since the coolant tubes showed good results in simulation, they were adopted from Wagner et al. [36]. The water heating device’s transmitted heating energy was reduced by the efficiency factor of 0.989 provided by the manufacturer, and its maximum possible power draw was set to 7 kW for permanent usage and 20 kW for ETR. Its power state was controlled by a P controller which attained a minimum thermal fluid temperature. In order to obtain the necessary water heating device power, the amount of power intended by the ETR algorithm was added to the controller’s set power value. The airflow through the heat exchanger was controlled by a P controller in order to attain the desired cabin temperature. The mass flow could be controlled within values that were measured on the vehicle. Since Wagner et al. [36] created the cabin model for a VW e-Golf, whose interior is not optimized for quick heating up, the cabin’s heat capacity was lowered in the model in order to fit the BMW i3′s cabin. Additionally, all components of the heating circuit, including the cabin model, were validated using the data obtained from real driving cycles.

3.4. ETR Algorithm

The ETR algorithm was based on the determination of the drive power required to drive the vehicle. The limitation of the battery was initially neglected, resulting in a theoretical reference value. Meanwhile, a usable power limit was calculated from the current limit of the battery. The excess power that could not be absorbed by the battery was calculated from the difference between the theoretical reference value and the actual usable recuperation power. This power surplus was fed directly into the heater. The heater could absorb the excess power up to an overload power of 20 kW. The remaining braking power was dissipated via the friction brakes.

4. Results and Discussion

The selection options for reasonable driving cycles for the simulations were limited to several conditions. Since 2017 the WLTC has been used as the standardized driving cycle in Europe. It should thus be used as a reference for future research. Since there were also real driving cycles based on the FTM route [13], which are closer to actual traffic situations, one of those cycles was used for simulation as well. The diagram of the maximum battery current as depicted in Figure 5 only includes values at temperatures higher than −10 °C. In order to obtain simulation results over a wide temperature span but keep the amount of data to a manageable level, the simulations were performed at −10 °C, 0 °C, and 10 °C. In each simulation, all the vehicle components temperatures were set to the ambient temperature to simulate a cold start. The cabin’s target temperature was set to 22 °C and the battery’s SoC was initialized at 86.8% and 60%. The simulations were performed with and without ETR for every driving cycle and temperature.

4.1. Range Extension

An overview of the energy consumption at a single simulation is given in Figure 6. At −10 °C, the vehicle consumed 4.99 kWh for the whole cycle without ETR, and 4.62 kWh with ETR. This can be translated into a driving range increase of 8.04% due to ETR for the simulated use case. At higher ambient temperatures, the percentage gain in range dropped to 5.41% at 0 °C and to 1.54% at 10 °C.
In contrast to Lieb [31], an absolute decrease in driving range could not be determined at higher temperatures. This could be due to the improved dynamic behavior of the layer heater compared to a break resistor. At −10 °C, the coolant heater’s power draw differed strongly between the strategies with and without ETR, as seen in Figure 7 and compared to 10 °C in Figure 8.
Due to the battery’s current limitation at low temperatures, the heating strategy often used ETR to decrease friction brake usage. After those high-power heating phases, the coolant temperature was high enough for the heater to be turned off completely. However, at 10 °C the strategy’s power consumption was equal for extended periods of time, due to the increased battery current capacity. This explains the small driving range increase at higher temperatures (Figure 8).
Apart from a recuperation restriction due to low temperature, there was also a restriction due to a high SoC. When starting a driving cycle with a fully charged battery, ETR could further improve the driving range. Table 1 shows the theoretical maximum driving range for a fully charged battery, extrapolated from the FTM cycle and the WLTC at different battery temperatures, and the cumulated energy consumption during the cycles, respectively. The selected test vehicle (BMW i3) was not able to charge the traction battery higher than 86.8% SoC, so as not to damage it through high voltage at recuperation. Therefore, a fully charged battery was considered with a starting state of charge SoCStart = 86.8%.
During the FTM cycle, at 10 °C the vehicle’s energy consumption could be lowered by about 1.54% by using ETR. This led to a theoretical range increase of 1.6 km per battery charge. At 0 °C the relative energy saving and range extension increased to 5.41%. The vehicle could travel an additional 4.72 km per full charge. Due to the battery’s marked current limitation at −10 °C, a range increase of 8.04% or 5.80 km could be achieved through ETR. Simulating the WLTC, the range increase and energy saving was qualitatively equal but lower in impact overall. This can be explained by the less dynamic driving profile, as shown in Figure 3.
The simulation results with a SoC of 60% are shown in Table 2. In this simulation, the different current limitations were solely due to the battery temperature. The range was calculated for a starting SoC of 60% and not scaled up to a fully charged battery. Therefore, the range was lower overall compared to the previous simulations.
Due to the battery’s higher current capability at lower SoCs, the overall range extension provided by the ETR was lower compared to the previous simulation. Nevertheless, during the FTM cycle, a driving range extension of 0.52% or 0.38 km was achieved at 10 °C, 2.32% or 1.46 km at 0 °C, and 6.23% or 3.16 km at −10 °C. During the WLTC at 10 °C, no range increase could be determined by using the ETR. At lower temperatures the energy saving increased, but it reached lower values compared to the FTM cycle.
Although the ETR was able to reduce the amount of energy lost to the environment through heat dissipation at the friction brakes, it was still necessary to use the friction brakes at low temperatures in order to follow the driving profile. In particular, the range increase at −10 °C could potentially be increased by the integration of an even more powerful heater. Using the simulation results, the additional range extension can be estimated to reach from 0% in the worst case up to 8.04% in the best case. Compared to the results of Lieb [31] (maximum of 15% energy saving for urban cycles and 4–7% energy saving for rural road cycles), the results obtained in this study are considered to be within a plausible range.
In comparison to the results of Lieb et al. [30] (maximum of 12% energy saving), the results obtained in this study show a lower range extension. The results can be explained by the underlying driving cycles. Lieb et al. [30] obtained a 12% energy saving for urban driving cycles, whereas this study utilizes a real driving cycle with a mixture of urban, rural, and highway cycle sections. This leads to lower amounts of recuperation and consequently to a lower potential for the ETR. Furthermore, the results obtained in this study are considered more realistic due to the usage of real driving data.
The results of Sawazki et al. [10] (6.3% energy saving at −10 °C and 0 kW power capacity of the traction battery) cannot be compared directly to the results of this study due to the assumption of Sawazki et al. [10] of the constant power capacity of the traction battery. A look at the results of this study for simulations at a battery temperature of −10 °C shows a tendency of a maximum recuperation power around 5 kW. This allows the comparison to the results of Sawazki et al. [10], where energy savings of circa 3.7% for a battery temperature of −10 °C and a constant power capability of 5 kW were obtained. The energy saving in this study, given the same start parameters, is 4.54%, and is hence considered to be compatible with the aforementioned results.
Finally, in addition to the determined driving range extension, the temperature influence on the car passengers cannot be neglected. Therefore, the next section analyzes the influence of the ETR on the cabin temperature.

4.2. Effects on Cabin Temperature

According to the cooling fluid’s data sheet, the maximum temperature must not exceed 100 °C. Without using the ETR, the coolant temperature was controlled to reach and sustain 50 °C. This temperature was high enough to heat up the cabin from −10 °C to 22 °C in 22 min and 15 s. Without ETR, the coolant temperature never exceeded the desired value of 50 °C and therefore stayed within the permitted temperature range.
Our testing showed that the water heating device could reach a maximum power output of 20 kW. The maximum permitted temperature was reached after a continuous heater operation at maximum power for 20 s, according to measurements of the test vehicle’s heating circuit. During the real driving cycle, the longest continuous recuperation phase was less than 10 s. Therefore, the heating cycle’s heat capacity was enough to absorb the energy surplus resulting from recuperative breaking.
Figure 9 shows the coolant, air outlet, and cabin temperature during the simulation with the FTM cycle. It shows spikes in the coolant and air outlet temperatures during periods of time where ETR is active. In the worst-case scenario, the coolant temperature stayed below its maximum permitted temperature and reached a maximum of 70 °C at an ambient temperature of −10 °C. The air outlet temperature reached a maximum of 68 °C. By controlling the air mass flow, the same heat flow was blown into the interior at a higher temperature. The interior temperature therefore remained constant. Whether this is within the driving range of passengers’ comfort will be evaluated in future research.
While using ETR, the desired cabin temperature was reached after 21 min and 48 s. This improvement in heating speed was due to somewhat higher air outlet temperatures. This improvement was achieved without the need of additional energy from the battery, since the difference in used heating energy would otherwise be dissipated at the friction brakes. The benefit in heating speed would potentially be higher for a different driving cycle, where high deceleration values are present at an earlier stage. Therefore, the earlier availability of an energy surplus that can be electrothermally recuperated is the main reason for this.

5. Conclusions

This paper describes the potential range extension of a battery electric vehicle using ETR. The cabin heating was achieved through a highly dynamic high voltage layer heater. The paper’s goal was to minimize the vehicle’s overall energy consumption at low ambient temperatures and high SoC values, and thus increase its range.
A longitudinal vehicle model, which included detailed models of the traction battery and the heating circuit, was developed. A map of the battery’s temperature- and SoC-dependent current limitation was created based on braking tests with the test vehicle. The heating circuit was validated with data measured during real driving cycles using the test vehicle. With the validated longitudinal vehicle model, two different driving cycles were simulated at ambient temperatures from −10 °C to 10 °C. Additionally, a fully charged and a partially discharged battery were considered for the starting conditions.
The results show a significant reduction in the energy consumption that can be achieved through ETR. With a fully charged battery, a range increase of up to 8.04% was achieved at an ambient temperature of −10 °C. At 10 °C, a possible range increase of 1.54% was determined. When starting the simulation at a lower SoC, the range increase at the same temperatures reached up to 6.23% and 0.52% respectively. Overall, a higher potential range increase was observed for a real driving cycle compared to the WLTC due to higher vehicle decelerations and thus higher braking needs.

6. Outlook

By using the recuperation power directly for heating, the battery was charged at a lower current during the recuperation phase. By temporarily storing the energy in the coolant circuit, the high-voltage heater was deactivated in subsequent acceleration phases. As a result, the vehicle electrical system power was smoothed. Because the C-rate is a major stress factor in battery aging [23], reduced cyclical battery aging is expected. Such a perspective will be investigated in the further course of the research project.
In addition, other types of high-voltage heaters, especially PTC heaters, are being investigated with regard to their suitability for ETR. Air heaters are also being considered. Due to the absence of a coolant circuit in the latter, the energy cannot be stored temporarily. The ETR capability of air heaters is estimated to be low.
For a more detailed investigation of user comfort, a Comutational Fluid Dynamics (CFD) interior model is being developed which shows the temperatures and air velocities at individual body locations. A comfort model is used to evaluate the overall perception of the vehicle user.

Author Contributions

Conceptualization, M.S.; methodology, M.S.; software, M.S., M.L. (Marcel Lewke), and J.B.; validation, M.S., M.L. (Marcel Lewke), and J.B.; investigation, M.S.; writing—original draft preparation, M.S., M.L. (Marcel Lewke), and J.B.; writing—review and editing, M.S., T.H., and M.L. (Markus Lienkamp); visualization, M.S., M.L. (Marcel Lewke), and J.B.; supervision, M.L. (Markus Lienkamp); project administration, M.S.; funding acquisition, M.L. (Markus Lienkamp) and T.H. All authors have read and agreed to the published version of the manuscript.

Funding

The authors would like to thank Webasto Thermo & Comfort SE for funding this research.

Acknowledgments

The drivetrain model used was based on the research of Benedikt Danquah. The heating circuit model was developed in the publication by Wagner et al. The validation of the model on the vehicle was carried out within the scope of the present paper.

Conflicts of Interest

The authors declare no conflicts of interest.

References

  1. Noel, L.; de Rubens, G.Z.; Sovacool, B.K.; Kester, J. Fear and loathing of electric vehicles: The reactionary rhetoric of range anxiety. Energy Res. Soc. Sci. 2019, 48, 96–107. [Google Scholar] [CrossRef]
  2. Pasaoglu, G.; Scarcella, G.; Alemanno, A.; Zubaryeva, C.; Thiel, C. Attitude of European Car Drivers Towards Electric Vehicles: A Survey; European Commission: Luxembourg, 2012. [Google Scholar]
  3. Horrein, L.; Bouscayrol, A.; Lhomme, W.; Depature, C. Impact of Heating System on the Range of an Electric Vehicle. IEEE Trans. Veh. Technol. 2017, 66, 4668–4677. [Google Scholar] [CrossRef]
  4. Reyes, J.R.M.D.; Parsons, R.V.; Hoemsen, R. Winter Happens: The Effect of Ambient Temperature on the Travel Range of Electric Vehicles. IEEE Trans. Veh. Technol. 2016, 65, 4016–4022. [Google Scholar] [CrossRef]
  5. Samdani, E.; Lo, J.; Fowler, M.; Fraser, R.; Gimenez, L. Impact of Temperature on the A123 Li-Ion Battery Performance and Hybrid Electric Vehicle Range; SAE Technical Paper Series; SAE: Warrendale, PA, USA, 2013. [Google Scholar]
  6. Webasto Thermo & Comfort SE. Brochure: High Voltage Heater HVH 50/70 and HVH 100: The Future at Its Best: Innovative Heating Solution for E-Mobility. Available online: https://www.webasto-comfort.com/int/product-overview/product/show/hvh/## (accessed on 26 February 2020).
  7. Aris, A.M.; Shabani, B. An Experimental Study of a Lithium Ion Cell Operation at Low Temperature Conditions. Energy Procedia 2017, 110, 128–135. [Google Scholar] [CrossRef]
  8. Ge, H.; Aoki, T.; Ikeda, N.; Suga, S.; Isobe, T.; Li, Z.; Tabuchi, Y.; Zhang, J. Investigating Lithium Plating in Lithium-Ion Batteries at Low Temperatures Using Electrochemical Model with NMR Assisted Parameterization. J. Electrochem. Soc. 2017, A1050–A1059. [Google Scholar] [CrossRef]
  9. Waldmann, T.; Wilka, M.; Kasper, M.; Fleischhammer, M.; Wohlfahrt-Mehrens, M. Temperature dependent ageing mechanisms in Lithium-ion batteries—A Post-Mortem study. J. Power Sources 2014, 262, 129–135. [Google Scholar] [CrossRef]
  10. Sawazki, E.; Brüll, M.; Deinhard, S.; Baumgärtner, C. Potenziale zur Reichweitensteigerung von Elektrofahrzeugen im Winter. Automobiltechnische Zeitung 2015, 36–41. [Google Scholar] [CrossRef]
  11. Iora, P.; Tribioli, L. Effect of Ambient Temperature on Electric Vehicles’ Energy Consumption and Range: Model Definition and Sensitivity Analysis Based on Nissan Leaf Data. World Electr. Veh J. 2019, 10, 2. [Google Scholar] [CrossRef] [Green Version]
  12. Großmann, H. Pkw-Klimatisierung: Physikalische Grundlagen und Technische Umsetzung, 2nd ed.; Springer: Berlin/Heidelberg, Germany, 2013. [Google Scholar]
  13. Adermann, J.; Kreibich, J.; Lienkamp, M. Experimental Study of Energy Consumption Variation in Recurring Driving Trips. J. Electr. Eng. 2017, 253–261. [Google Scholar] [CrossRef] [Green Version]
  14. Broglia, L.; Autefage, G.; Ponchant, M. Impact of passenger thermal comfort and electric devices temperature on range: A system simulation approach. In Proceedings of the EVS26 International Battery, Hybrid and Fuel Cell Electric Vehicle Symposium, Los Angeles, CA, USA, 6–9 May 2012; pp. 1–8. [Google Scholar]
  15. Göhlich, D.; Ly, T.-A.; Kunith, A.; Jefferies, D. Economic assessment of different air-conditioning and heating systems for electric city buses based on comprehensive energetic simulations. In Proceedings of the EVS28 International Electric Vehicle Symposium and Exhibition, Goyang, Korea, 3–6 May 2015; pp. 1–9. [Google Scholar]
  16. Helfrich, T.; Lienkamp, M. Perceptible changes in driving dynamics due to regenerative braking: Analysis and reduction through active chassis systems. In Proceedings of the Advanced Vehicle Control AVEC’16, Munich, Germany, 13–16 September 2016; pp. 573–578. [Google Scholar]
  17. Breuer, B.; Bill, K.H. Bremsenhandbuch, 5th ed.; Springer: Wiesbaden, Germany, 2017. [Google Scholar]
  18. Spichartz, P.; Bubmann, L.; Sourkounis, C. Comparison of recuperation strategies for electric vehicles regarding energy efficiency. In Proceedings of the IECON 2014—40th Annual Conference of the IEEE Industrial Electronics Society, Dallas, TX, USA, 29 October–1 November 2014; pp. 2984–2990. [Google Scholar]
  19. Braess, H.-H.; Seiffert, U. Vieweg Handbuch Kraftfahrzeugtechnik, 7th ed.; Springer: Wiesbaden, Germany, 2013. [Google Scholar]
  20. Ferraris, A.; Airale, A.G.; Messana, A.; Xu, S.; Carello, M. The Regenerative Braking for a L7E Range Extender Hybrid Vehicle. In Proceedings of the IEEE International Conference on Environment and Electrical Engineering and 2018 IEEE Industrial and Commercial Power Systems Europe (EEEIC/I & CPS Europe), Palermo, Italy, 12–15 June 2018; IEEE: Piscataway, NJ, USA, 2018. [Google Scholar]
  21. Gao, Y.; Jiang, J.; Zhang, C.; Zhang, W.; Ma, Z.; Jiang, Y. Lithium-ion battery aging mechanisms and life model under different charging stresses. J. Power Sources 2017, 356, 103–114. [Google Scholar] [CrossRef]
  22. BMW Group. Der Neue BMW i3; Technische Daten; BMW Group: Munich, Germany, 2017; pp. 1–8. [Google Scholar]
  23. Gewald, T.; Candussio, A.; Wildfeuer, L.; Lehmkuhl, D.; Hahn, A.; Lienkamp, M. Accelerated Aging Characterization of Lithium-ion Cells: Using Sensitivity Analysis to Identify the Stress Factors Relevant to Cyclic Aging. Batteries 2020, 6, 6. [Google Scholar] [CrossRef] [Green Version]
  24. Keil, P.; Jossen, A. Aging of Lithium-Ion Batteries in Electric Vehicles: Impact of Regenerative Braking. In Proceedings of the EVS28 International Electric Vehicle Symposium and Exhibition, Goyang, Korea, 3–6 May 2015. [Google Scholar] [CrossRef] [Green Version]
  25. Petzl, M.; Kasper, M.; Danzer, M.A. Lithium plating in a commercial lithium-ion battery—A low-temperature aging study. J. Power Sources 2015, 275, 799–807. [Google Scholar] [CrossRef]
  26. Keil, P. Aging of Lithium-Ion Batteries in Electric Vehicles. Ph.D. Thesis, Lehrstuhl für Elektrische Energiespeichertechnik, München, Germany, April 2017. [Google Scholar]
  27. Von Lüders, C.; Keil, J.; Webersberger, M.; Jossen, A. Modeling of lithium plating and lithium stripping in lithium-ion batteries. J. Power Sources 2019, 414, 41–47. [Google Scholar] [CrossRef]
  28. Zinth, V.; von Lüders, C.; Hofmann, M.; Hattendorff, J.; Buchberger, I.; Erhard, S.; Rebelo-Kornmeier, J.; Jossen, A.; Gilles, R. Lithium plating in lithium-ion batteries at sub-ambient temperatures investigated by in situ neutron diffraction. J. Power Sources 2014, 271, 152–159. [Google Scholar] [CrossRef]
  29. Bednorz, R.; Gewald, T. Investigation of the Effects of Charging Processes on Lithium-Ion Cells with SiC Anodes at Low Temperatures. In Proceedings of the Conference on Future Automotive Technology, Fürstenfeldbruck, Germany, 13–16 May 2020. [Google Scholar]
  30. Lieb, J.; Sawazki, E.; Brull, M.; Baker, B. Potential of an electric brake resistor to increase the efficiency of electric vehicles. In Proceedings of the Electric Vehicle Symposium 27, Barcelona, Spain, 17–20 November 2013. [Google Scholar] [CrossRef] [Green Version]
  31. Lieb, J. Effizienzsteigerung durch Bremswiderstände in batterieelektrischen Fahrzeugen. Ph.D. Thesis, Lehrstuhl für Fahrzeugmechatronik, Dresden, Germany, 2015. [Google Scholar]
  32. Danquah, B.; Koch, A.; Weiß, T.; Lienkamp, M. Modular, Open Source Simulation Approach: Application to Design and Analyze Electric Vehicles. In Proceedings of the Fourteenth International Conference on Ecological Vehicles and Renewable Energies, Monte-Carlo, Monaco, 8–10 May 2019. [Google Scholar] [CrossRef]
  33. Kalt, S. Electric Machine Design Tool for Permanent Magnet Synchronous Machines. In Proceedings of the Fourteenth International Conference on Ecological Vehicles and Renewable Energies, Monte-Carlo, Monaco, 8–10 May 2019. [Google Scholar] [CrossRef]
  34. Reiter, C.; Wildfeuer, L.; Wassiliadis, N.; Krahl, T.; Dirnecker, J.; Lienkamp, M. A Holistic Approach for Simulation and Evaluation of Electrical and Thermal Loads in Lithium-Ion Battery Systems. In Proceedings of the Fourteenth International Conference on Ecological Vehicles and Renewable Energies (EVER), Monte-Carlo, Monaco, 8–10 May 2019. [Google Scholar] [CrossRef]
  35. Nitz, J.; Hucho, W.-H. The Heat Transfer Coefficient of a Passenger Car’s Body; SAE Technical Paper No. 790399; SAE: Warrendale, PA, USA, 1979; pp. 1–12. [Google Scholar]
  36. Wagner, D.; Steinsträter, M.; Förth, M.; Stohwasser, M.; Hoffmann, J.; Lienkamp, M. Battery independent regenerative braking using model predictive control with auxiliary power consumers. Forsch. Ingenieurwes 2019, 843–852. [Google Scholar] [CrossRef]
Figure 1. Schematic diagram of the electric drive train and heating circuit.
Wevj 11 00041 g001
Figure 2. Distribution of the braking torque between friction brake and motor, according to reference [17] (p. 465), [19] (p. 651).
Wevj 11 00041 g002
Figure 3. Velocity of the predetermined driving cycles and the actual driven vehicle velocity. WLTC: Worldwide harmonized Light vehicle Test Cycle.
Wevj 11 00041 g003
Figure 4. Differences between the driving cycles and the actual driven vehicle velocity.
Wevj 11 00041 g004
Figure 5. Maximum battery recuperation current depending on battery temperature and state of charge (SoC).
Wevj 11 00041 g005
Figure 6. Vehicle energy consumption during one FTM cycle at different temperatures.
Wevj 11 00041 g006
Figure 7. Power consumption of the coolant heater in one FTM cycle at −10 °C. ETR: Electrothermal recuperation.
Wevj 11 00041 g007
Figure 8. Power consumption of the coolant heater in one FTM cycle at 10 °C.
Wevj 11 00041 g008
Figure 9. Coolant, air outlet, and cabin temperature during the FTM cycle at −10 °C.
Wevj 11 00041 g009
Table 1. Driving ranges and range extensions for different battery starting temperatures and a fully charged battery (starting state of charge, SoCStart = 86.8%) for the WLTC and the FTM cycle.
CycleBattery Starting Temperature in °CEnergy Consumption in kWh (ETR off)Energy Consumption in kWh (ETR on)Range in km (ETR off)Range in km (ETR on)Range Extension in %
FTM103.473.42103.73105.331.54
04.133.9287.0891.805.41
−104.994.6272.0977.898.04
WLTC104.344.31100.61101.150.53
05.014.8487.0990.083.43
−105.955.6973.3176.644.54
Table 2. Ranges and range extensions for different battery starting temperatures and a partially charged battery (SoCStart = 60%) for the WLTC and FTM cycle.
CycleBattery Starting Temperature in °CEnergy Consumption in kWh (ETR off)Energy Consumption in kWh (ETR on)Range in km (ETR off)Range in km (ETR on)Range Extension in %
FTM103.413.4072.9273.300.52
03.983.8962.5263.982.32
−104.894.6050.7853.946.23
WLTC104.324.3269.8569.850
04.914.8661.4662.010.89
−105.895.7151.1752.843.26

