A Comprehensive TCO Evaluation Method for Electric Bus Systems Based on Discrete-Event Simulation Including Bus Scheduling and Charging Infrastructure Optimisation


Abstract
:1. Introduction
- An object-oriented, discrete-event simulation framework, enabling the energetic simulation of large bus fleets—including charging events en-route and in the depot—based on exact, non-idealised scheduling data,
- A scheduling algorithm to construct electric bus schedules adapted to range and/or charging time constraints and service delays,
- A genetic algorithm to enable cost-optimised placement of opportunity charging stations and
- A TCO calculation module based on dynamic costing.
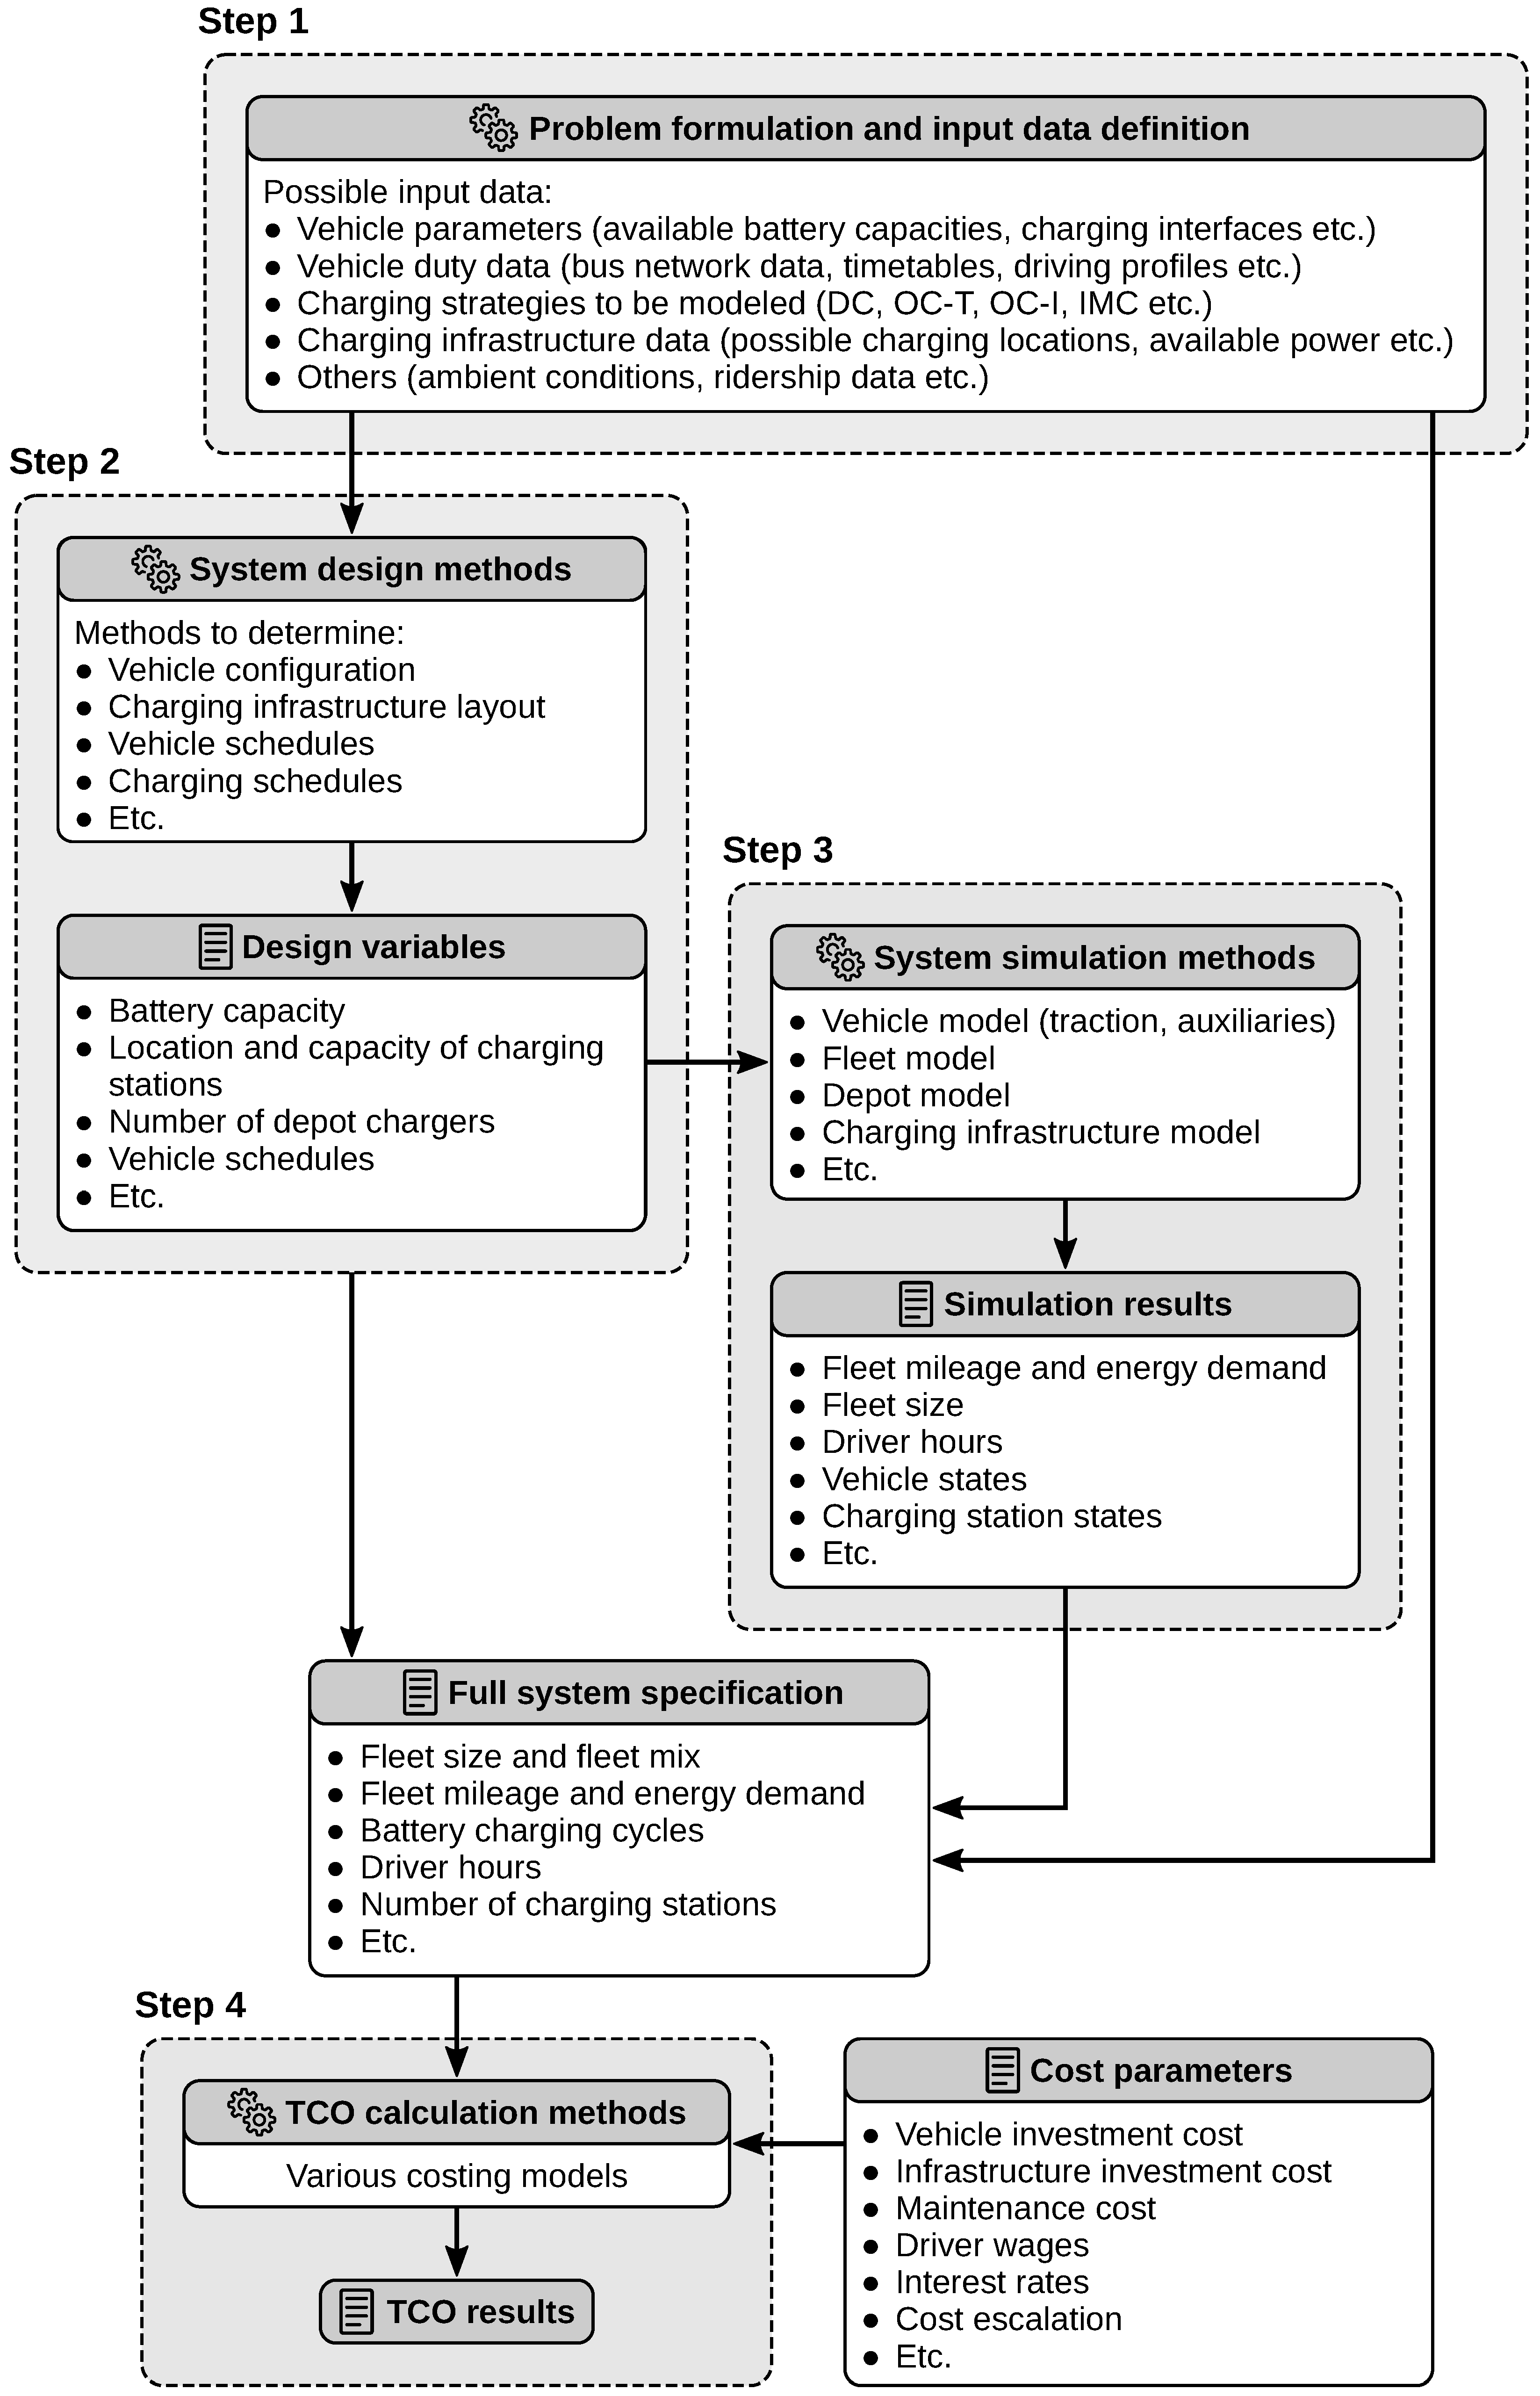
2. General Workflow in Electric Bus System Planning and TCO Analysis
- Problem formulation and input data definition
- System design methods
- System simulation methods
- TCO calculation methods.
3. Literature Review
3.1. Problem Formulation and Input Data Definition
- Simplified bus line and timetable data. Real-world timetables are reduced to headway and trip duration (sometimes variable over the course of the day), neglecting absolute departure and arrival times; bus lines are commonly reduced to a single route variant [5,8,9,13,14,15]. (It is common for bus lines to have full-length services operating “from end to end” as well as services operating on a shorter route inbetween, or to have several different branches. We term each of these a route variant.) A slightly more detailed timetable representation is found in Ke et al. [16] where absolute departure times and variable trip durations are considered, but resampled to 5-minute intervals.
- Exact bus line and timetable data. No simplifications are made to timetable data; any sequence of trips on any line and any route variant can be considered. This approach is common to all works specifically dealing with bus scheduling (see Section 3.2), but seldom encountered in electric bus TCO studies, exceptions being Rogge et al. [17], Lindgren [18] and Jefferies and Göhlich [6].
3.2. System Design Methods
- Whether or not an optimal solution to the vehicle scheduling problem (VSP) is sought (column ”optimisation”).
- The ability to handle multiple depots.
- The ability to specify vehicle type restrictions for each trip. This is highly relevant to practical operation as different trips are often served by different vehicle types (e.g., small or large vehicles).
- The charging strategies considered (see Section 1 for their respective definitions).
- Whether route restrictions are imposed in terms of energy (i.e., battery capacity), time or distance.
- Whether charging duration is evaluated based on the actual vehicle state of charge (SOC) or assumed constant.
- Whether partial charging is allowed or a full charge is assumed at each charging event.
- Whether charging stations and/or depots have a limited number of charging points (capacity constraints).
- Whether a variable fleet mix is determined, for example, an optimal combination of short-range and long-range electric buses or an optimal combination of diesel and electric buses.
- Whether or not the approach determines the optimal location of OC charging stations (OC charging location optimisation).
3.3. System Simulation Methods
3.3.1. Vehicle Modelling
3.3.2. Fleet Modelling
3.3.3. Depot Modelling
3.4. TCO Calculation Methods
3.5. Comparison of Electric Bus TCO Studies
- The charging strategies considered,
- Whether exact timetable data is used as input,
- Whether delays are considered during system design,
- Whether bus scheduling is performed for fleet size calculation and in what manner,
- Whether charging at the depot is considered for fleet size calculation,
- How the location and/or number of required charging points is determined,
- Whether staff (i.e., driver) demand is part of the calculation.
4. Electric Bus System Simulation and Planning Tool
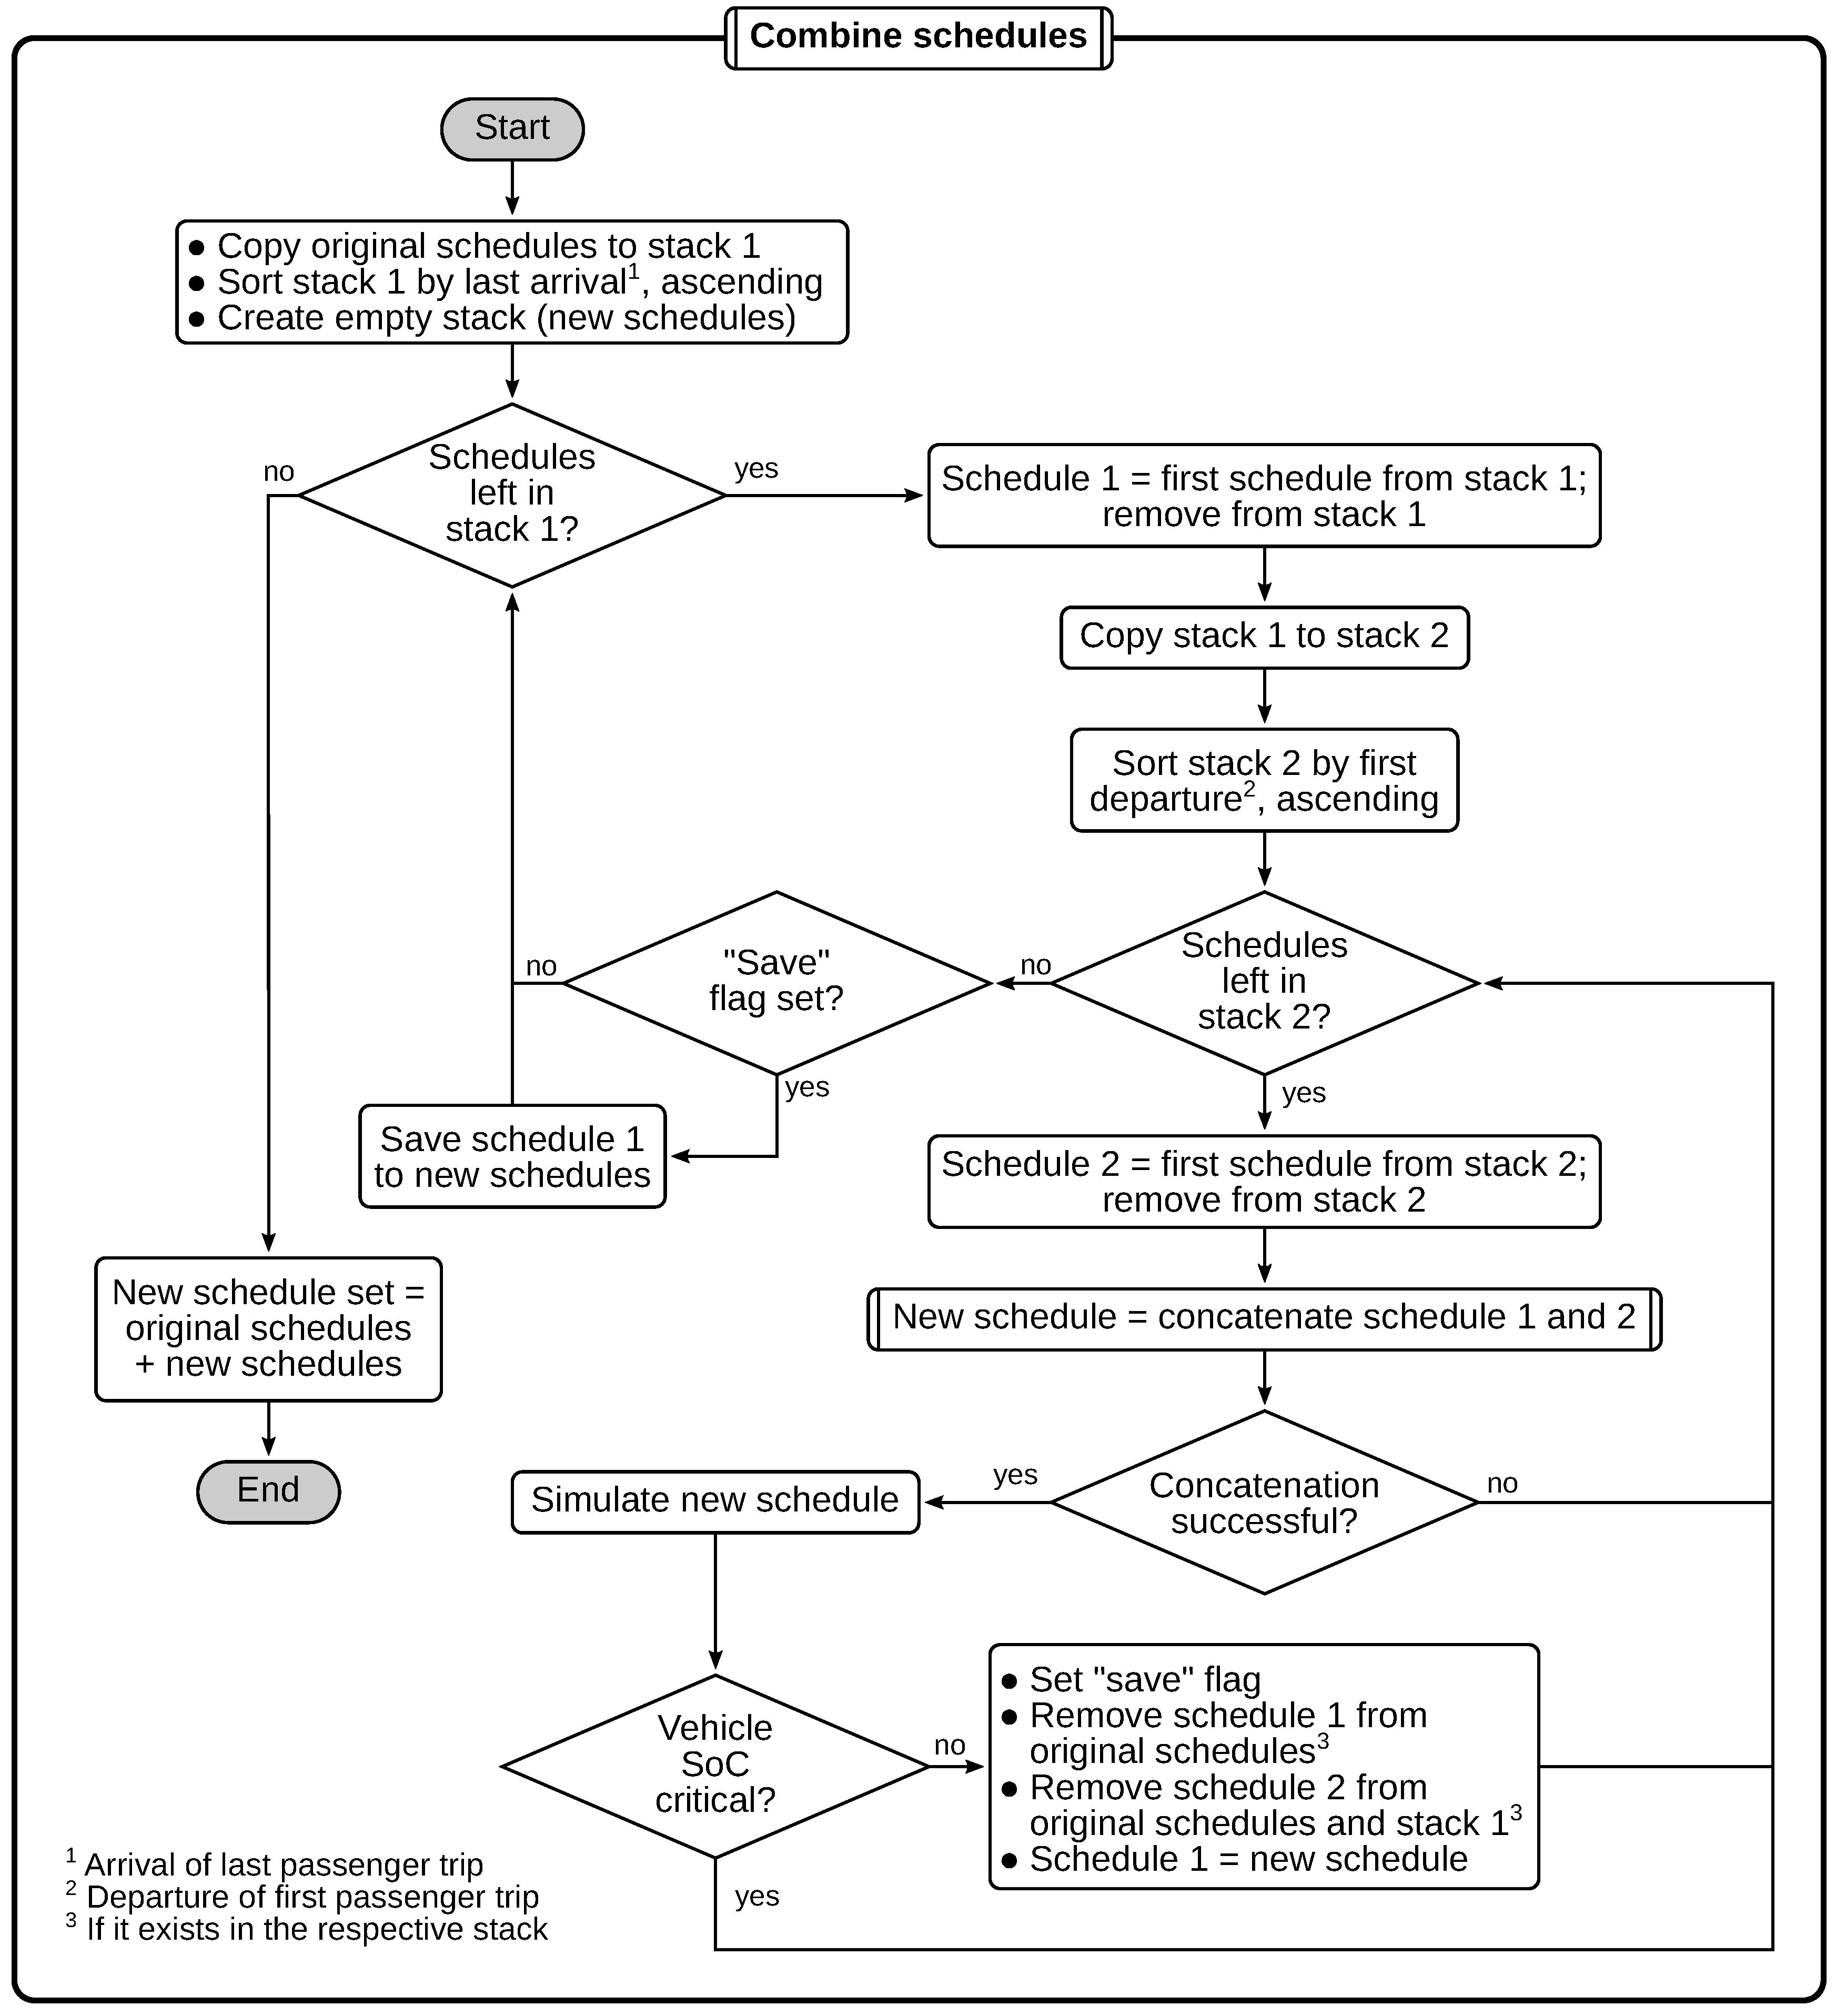
4.1. Bus Scheduling Algorithm
4.2. Schedule Simulation
- A list of schedules to be served is provided, as well as the geographical grid comprising grid points and connecting arcs. Typically, the schedules cover a single operational day, but any time window up to a week is possible.
- The ambient (omitted in Figure 4) provides ambient temperature and insolation.
- The charging network consists of charging points for stationary charging and charging arcs where vehicles can charge while in motion. Points and arcs each correspond to a point or arc in the grid, respectively. Charging facilities have a specific charging interface through which they can transfer energy to a vehicle. They are implemented as a SimPy resource with a defined capacity (i.e., the number of charging slots available). If a vehicle issues a charging request and all slots are occupied, it must queue for a free slot in order to charge.
- One or more depots exist where vehicles start and end their respective schedules.
- A central dispatcher reads the list of schedules and, when a schedule is about to commence, requests a vehicle of the required type from the depot specified in the schedule. It also assigns a driver to the vehicle.
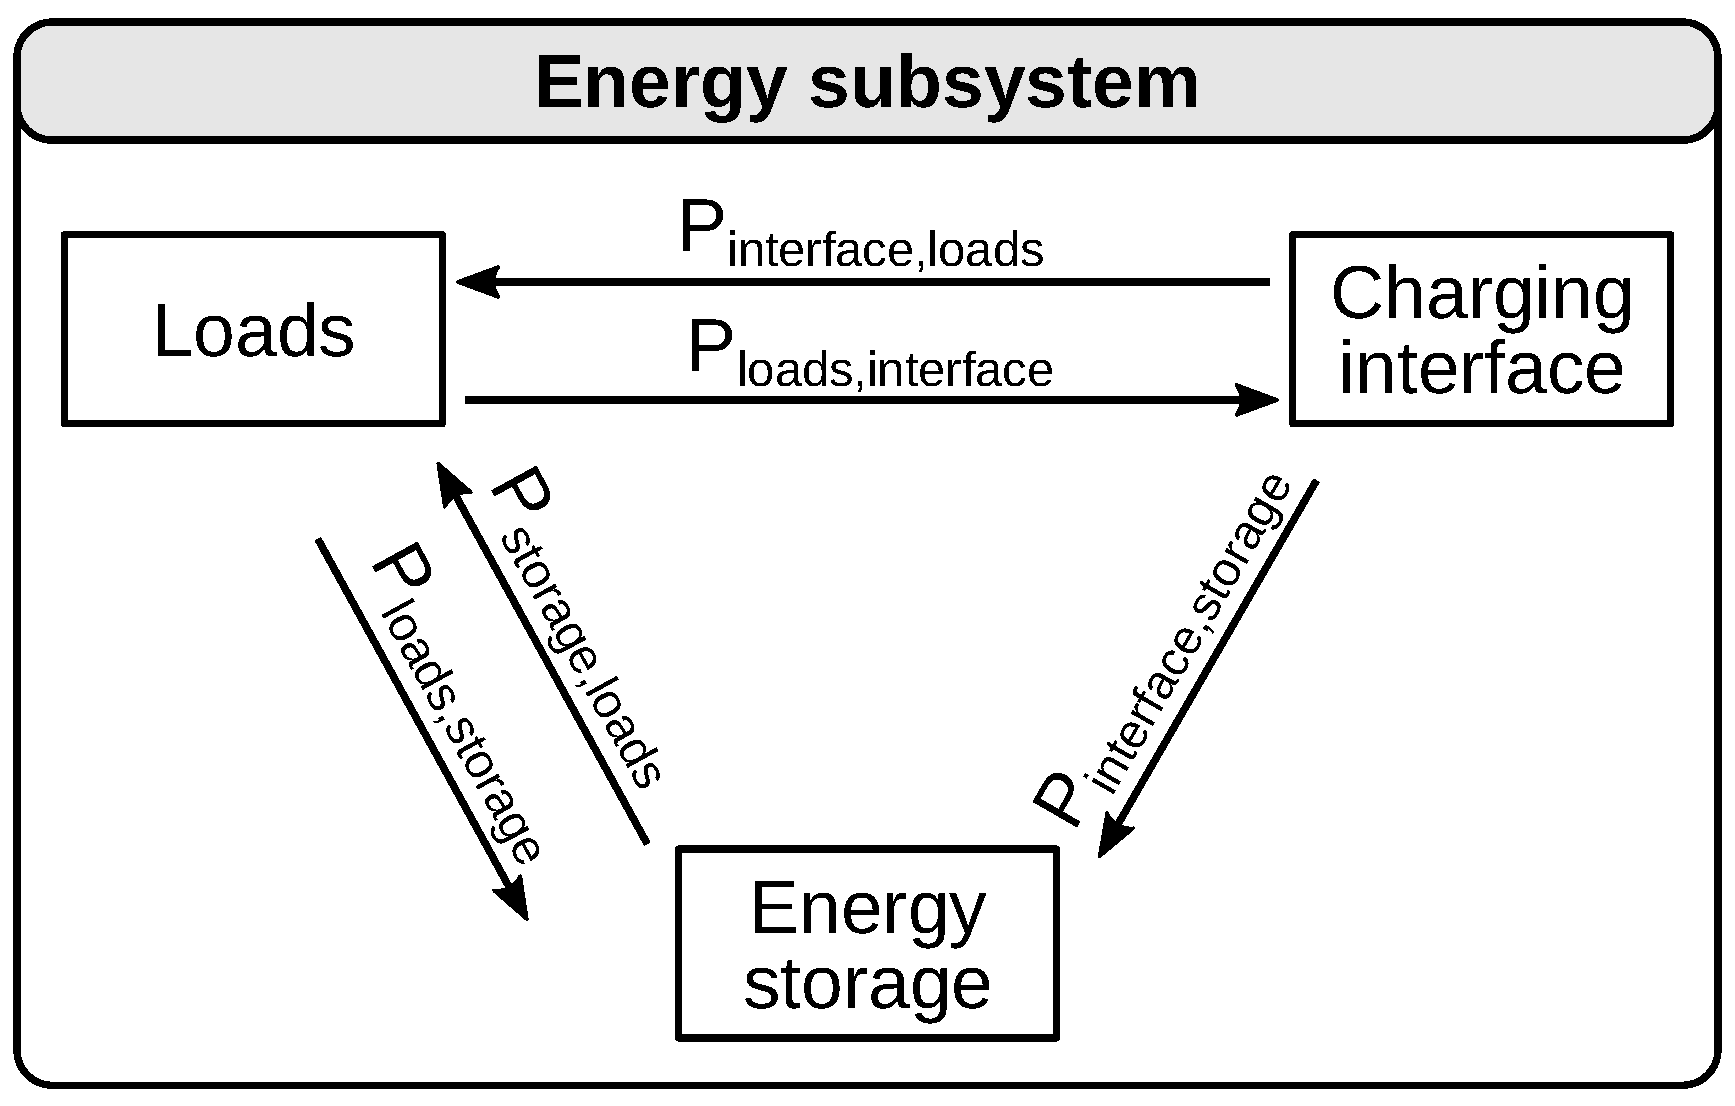
- Each vehicle provides various actions: Switching the ignition and air-conditioning on and off, driving along a specified leg of a schedule, driving along a specified velocity profile, modifying the payload (through boarding and alighting of passengers), etc. It has several sub-components, mainly the traction device, auxiliary devices and energy storage, as well as one or more charging interfaces. The vehicle model is explained in detail in Section 4.2.2 and Appendix C.
- The driver executes vehicle actions according to the schedule. It also keeps track of the time spent driving and idling.
4.2.1. Discrete-Event Simulation Framework
4.2.2. Vehicle Model
4.2.3. Depot Model
4.3. Year Simulation and TCO Calculation
4.4. Genetic Algorithm for Charging Infrastructure Optimisation
5. Case Study: Electrification Scenarios for an Urban Bus Network
5.1. Vehicle Specifications and Energy Consumption
5.1.1. Parameterising the Longitudinal Dynamics Model
5.1.2. Defining Vehicle Types for the Simulation
5.2. Simulation of Existing Schedules With Electric Buses
5.3. Fully Electrified Scenarios: Scheduling and Charging Infrastructure Optimisation
5.4. Fully Electrified Scenarios: System Simulation
- Generally, the electric bus scenarios require at least 20 more vehicles (+12%) compared to the 234 vehicles in the diesel reference scenario. The only exception is the long-range DC scenario (scenario 3) that requires only three more vehicles (+1.3%).
- Reducing the charging power at the depot from 150 to 60 kW incurs a significantly larger fleet in the case of depot charging (+14 vehicles or 4%). In the case of opportunity charging, the increase in fleet size is less pronounced (+2 vehicles or 0.8%).
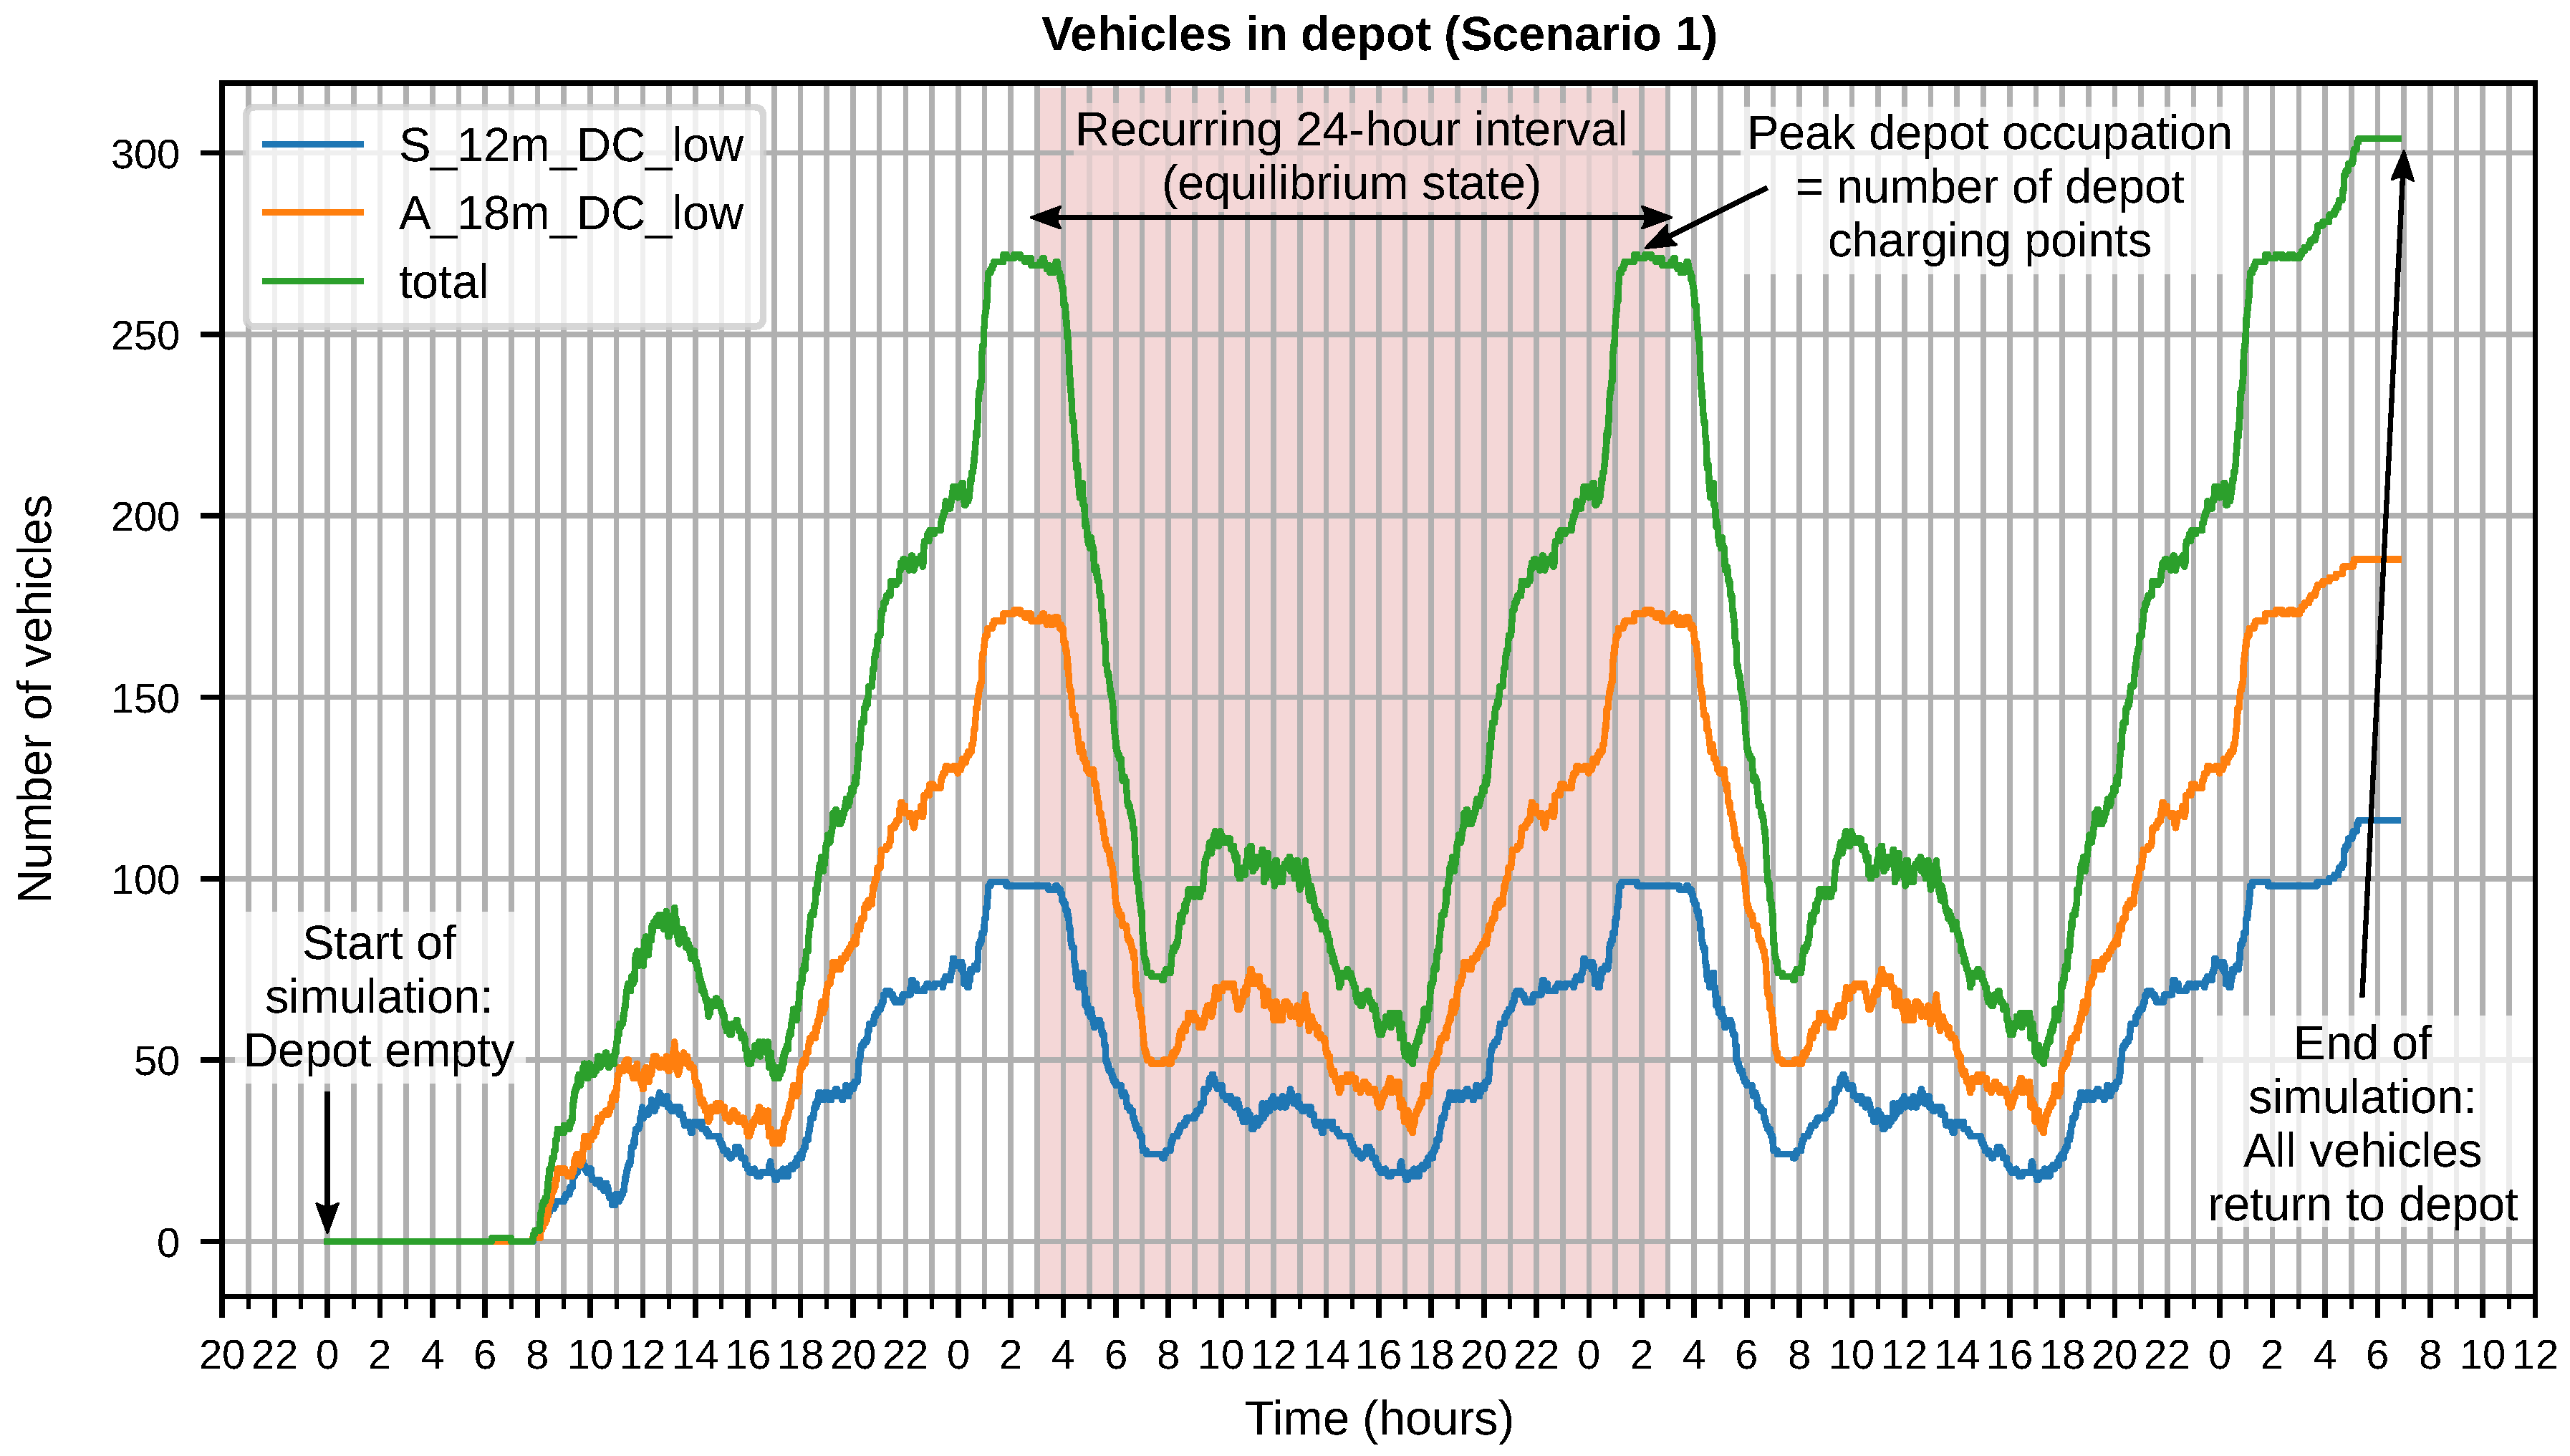
- Increasing the DC vehicles’ range from 120 to 200 km increases the required fleet size substantially by 32 vehicles or 10%. This is because in the 200 km case, many vehicles run out of energy during the afternoon when vehicle demand is at its peak and, thus, many new vehicles have to be generated. In the 120 km case, however, most vehicles return to the depot for charging before the afternoon peak and can then cover the entire afternoon shift uninterrupted. This surprising result illustrates the limits of the greedy scheduling algorithm: the objective pursued by the algorithm to maximise schedule length does not necessarily lead to a minimum fleet size.
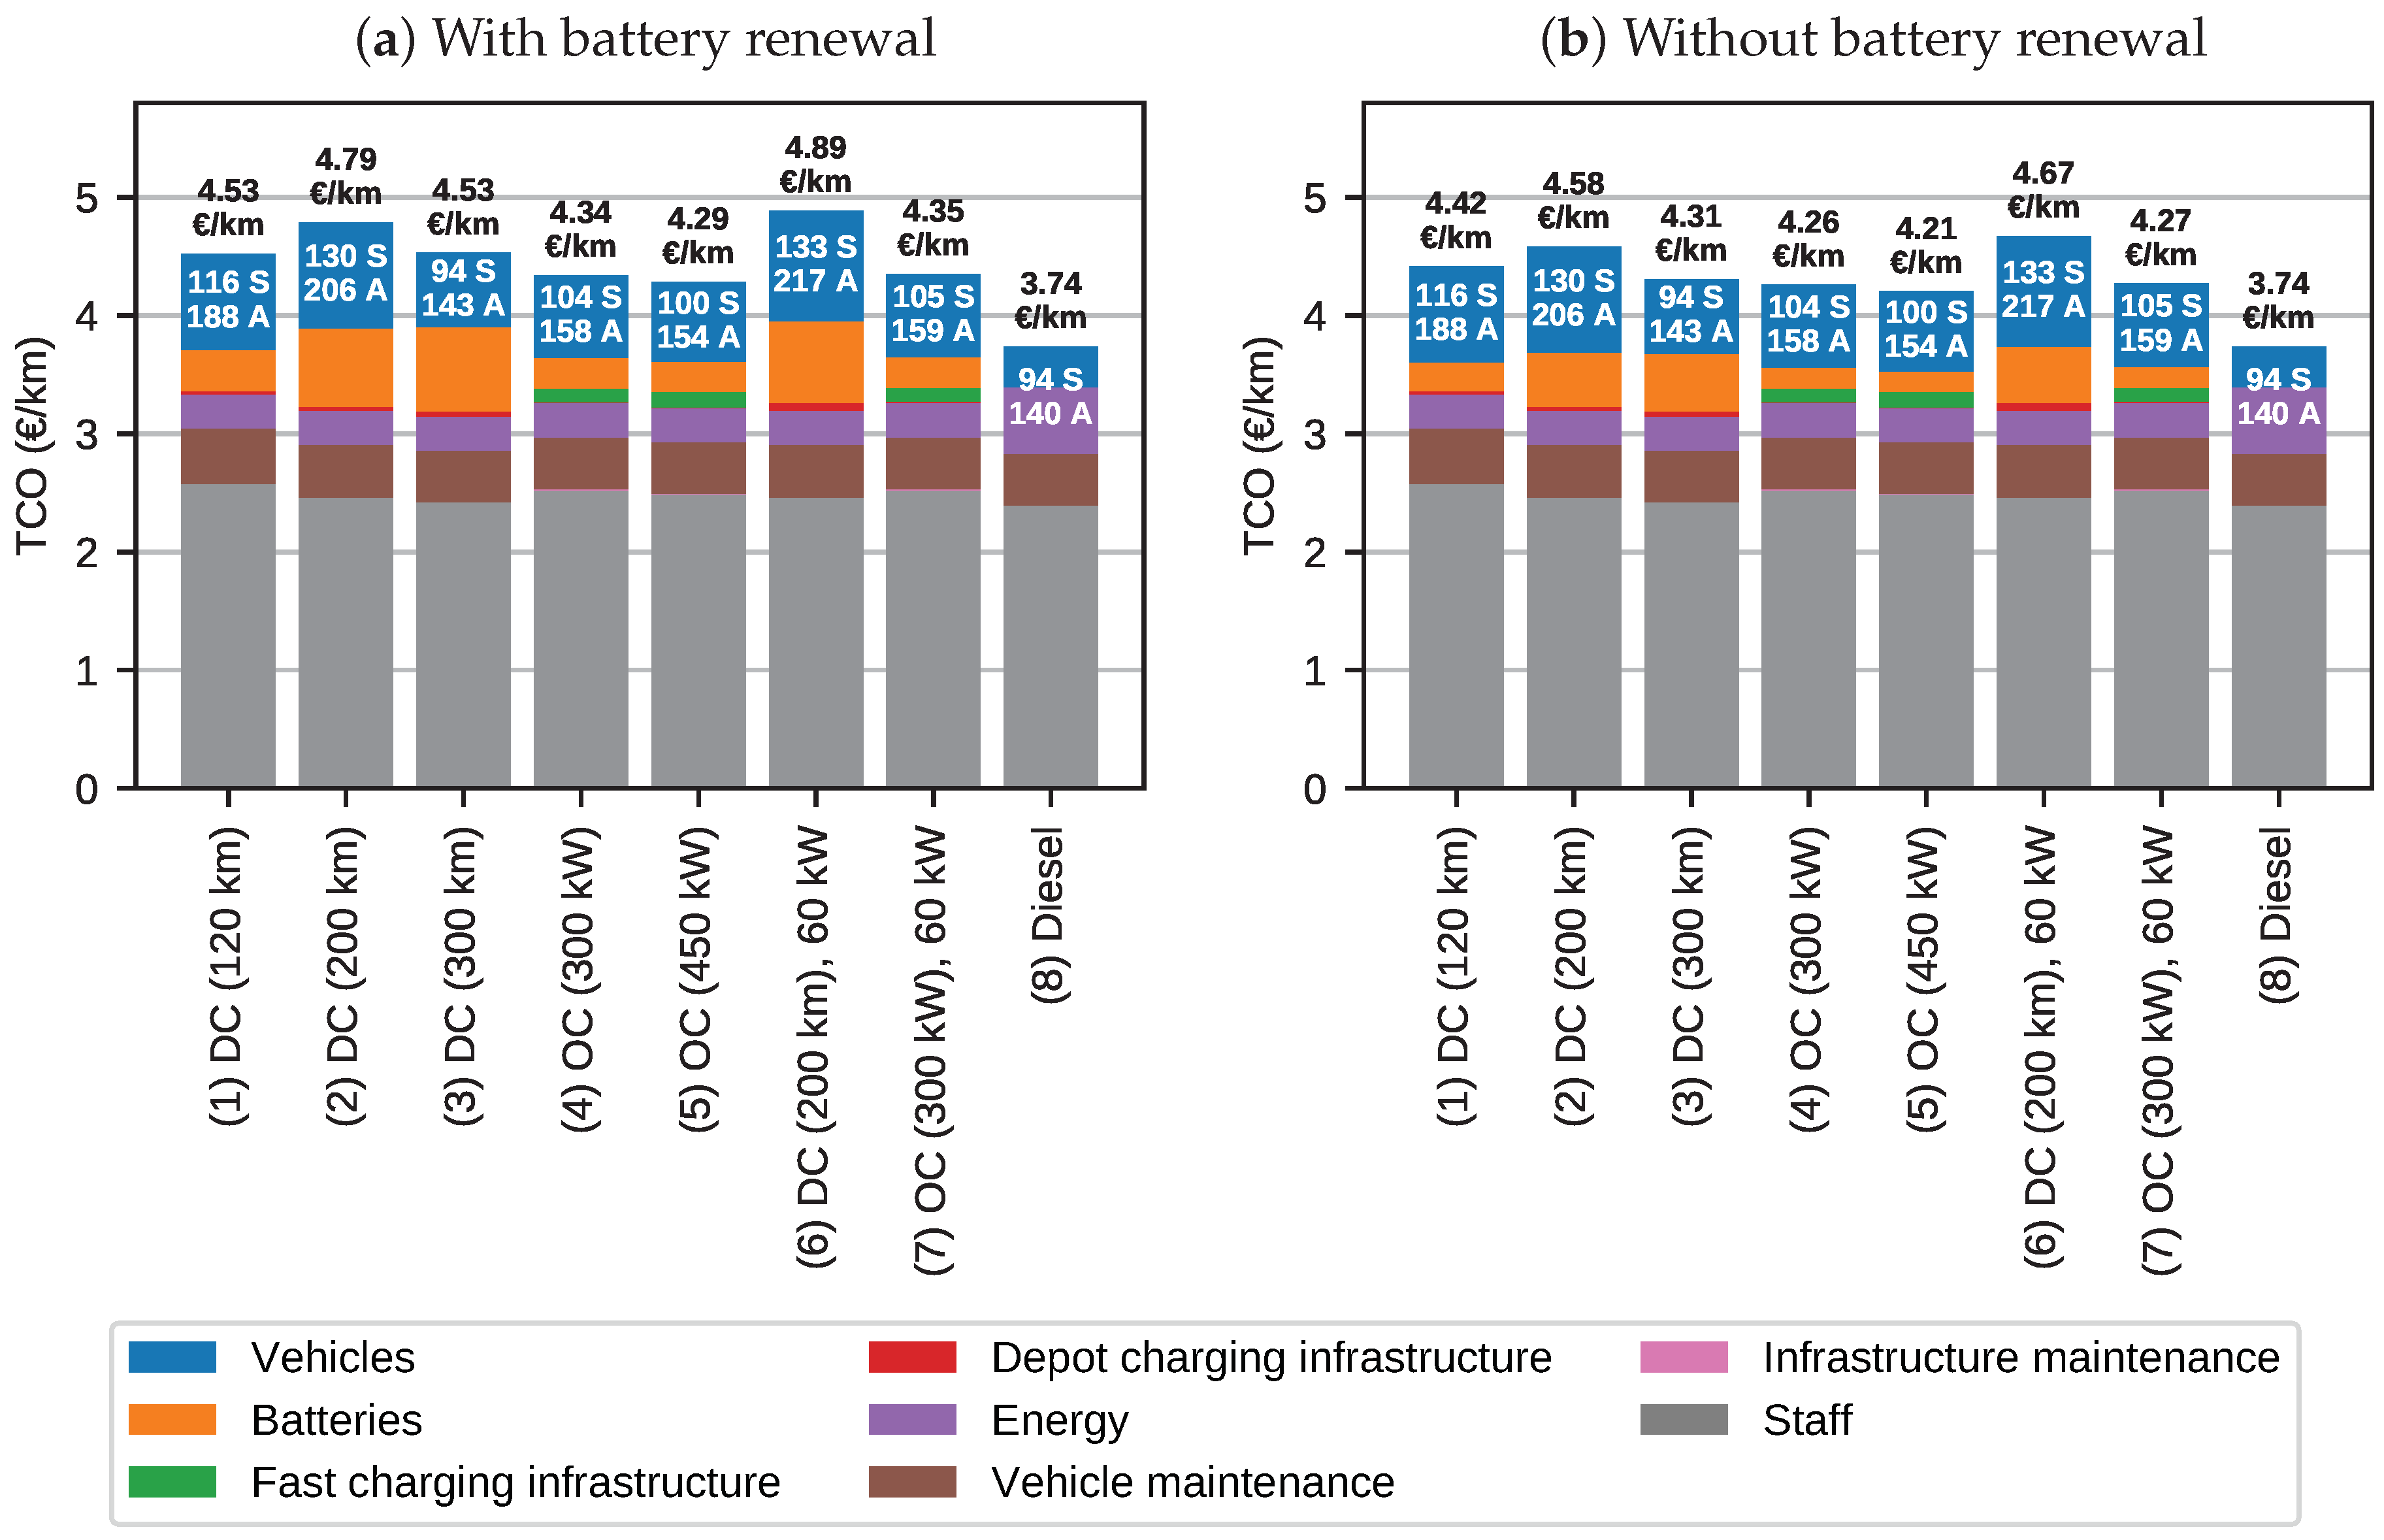
5.5. Fully Electrified Scenarios: TCO Comparison
- In the calculation with battery renewal, the lowest-cost DC electric bus scenario has a TCO 4–6% higher than the OC scenarios. Without battery renewal, this gap reduces to 1–2%.
- Reducing the depot charging power from 150 to 60 kW has a more pronounced impact on the TCO of the DC scenario (+2%) than on the TCO of the OC scenario (+0.2%), as would be expected from the vehicle demand presented in the previous section.
- If no battery renewal is necessary, system cost is reduced by 2% to 4%.
- The short-range and long-range DC scenarios have equal TCO if battery renewal is considered; in this case, the reduced vehicle demand in the long-range scenario is countered by higher battery replacement cost. The calculation without battery renewal, however, favours the long-range scenario, albeit by a narrow margin (−2.5% compared to the short-range scenario).
- The 450 kW OC scenario is slightly more competitive than the 300 kW scenario by a very small margin (−1%).
- Charging infrastructure has little influence on TCO: Its contribution ranges from 0.6% to 1.0% for DC and from 3.0% to 3.4% for OC.
- Staff cost (driver wages) accounts for 50% to 64% of TCO depending on the scenario. The electric bus scenarios increase the staff cost by the following, compared to the diesel scenario: DC (120 km): 8%; DC (200 km): 3%; DC (300 km): 1%; OC (300 kW): 5%; OC (450 kW): 4%.
- The electric bus scenarios incur an overall TCO 15–31% higher than the diesel scenario if battery renewal is considered, and 13–25% without battery renewal.
6. Discussion
6.1. OC Infrastructure Optimisation
6.2. Scheduling
6.3. Vehicle and Infrastructure Demand (System Simulation)
6.4. TCO calculation
7. Conclusions and Outlook
- The strict condition to fully charge at every charging station enforced by the scheduling algorithm reduces the efficiency of the OC schedules.
- The objective of the scheduling algorithm—maximising the schedule length—does not concur with the objective of minimum fleet size or minimum cost, leading to partly unexpected results especially in the case of DC. Development of a refined algorithm is already underway. It takes into account the concurrence of trips and leads to a more even distribution of depot trips over time, potentially mitigating the adverse effect observed in this work.
- The scheduling algorithm currently does not support charging station capacity constraints.
- In this study, we limited the duration of an operational day to 24 h. However, with OC, vehicles could remain in service for several consecutive days without returning to the depot, reducing the number of depot trips and, therefore, the TCO. This should be examined in future works.
- We did not evaluate a mixed scenario of OC and DC lines, even though it is a likely option for real-world application. Determining the best choice of technology on a per-line basis is, however, an optimisation problem in itself, requiring the development of additional methodology.
- The possibility of opportunity charging with central charging stations (OC-C) was not evaluated. This would also require further development of the scheduling algorithm.
- The schedule simulation currently relies on a simple, constant consumption vehicle model. This should be improved especially if the topography of the bus network includes steep gradients.
- The battery model currently does not consider variable charging power depending on the current state of charge. Also, no evaluation of the battery lifetime based on the actual charging/discharging cycle (e.g., as in [68]) is carried out. Both could be improved for better accuracy.
Author Contributions
Funding
Acknowledgments
Conflicts of Interest
Abbreviations
| API | Application programming interface |
| CAPEX | Capital expenditures |
| CCS | Combined charging system |
| DC | Depot charging |
| GA | Genetic algorithm |
| HVAC | Heating, ventilation and air-conditioning |
| IMC | In-motion charging |
| MILP | Mixed-integer linear programming |
| NPV | Net present value |
| OC (OC-T, OC-I, OC-C) | Opportunity charging (terminal stops, intermediate stops, central charging stations) |
| OPEX | Operational expenditures |
| SOC | State of charge |
| SOH | State of health |
| TCO | Total cost of ownership |
| VDV | Verband deutscher Verkehrsunternehmen (German association of public |
| transport operators) | |
| VSP | Vehicle scheduling problem |
Appendix A. Scheduling Algorithm Flowcharts

Appendix B. All Inputs to Schedule Simulation
Appendix C. Equations for Vehicle Model
Appendix C.1. Energy Flow and Energy Storage Model

Appendix C.2. Traction Model
Appendix C.3. HVAC Model
Appendix D. Equations for TCO Model
References
- ZeEUS Project. ZeEUS eBus Report #2: An Updated Overview of Electric Buses in Europe. Available online: http://zeeus.eu/uploads/publications/documents/zeeus-report2017-2018-final.pdf (accessed on 25 June 2020).
- Verband deutscher Verkehrsunternehmen (VDV). E-Bus-Projekte in Deutschland. Available online: https://www.vdv.de/e-bus-projekt.aspx (accessed on 25 June 2020).
- Wilkens, A. Induktives Laden: Mannheim Will Keine Weiteren Primove-Elektrobusse. Available online: https://www.heise.de/newsticker/meldung/Induktives-Laden-Mannheim-will-keine-weiteren-Primove-Elektrobusse-4060084.html (accessed on 25 June 2020).
- Sommariva, R. Trolleybuses in Berlin, BVG is Considering Massive Deployment in Spandau District. Available online: https://www.sustainable-bus.com/news/trolleybuses-in-berlin-bvg-is-considering-massive-deployment-in-spandau-district/ (accessed on 25 June 2020).
- Kunith, A.W. Elektrifizierung des Urbanen öffentlichen Busverkehrs: Technologiebewertung für den Kosteneffizienten Betrieb Emissionsfreier Bussysteme. Ph.D. Thesis, Technische Universität Berlin, Berlin, Germany, 2017. [Google Scholar] [CrossRef]
- Jefferies, D.; Göhlich, D. Integrated TCO Assessment of Bus Network Electrification Considering Rescheduling and Delays: Modelling Framework and Case Study. EVS31 International Electric Vehicle Symposium & Exhibition, Kobe, Japan. 2018. Available online: https://www.researchgate.net/publication/329210166_Integrated_TCO_Assessment_of_Bus_Network_Electrification_Considering_Rescheduling_and_Delays (accessed on 25 June 2020).
- Göhlich, D.; Fay, T.A.; Jefferies, D.; Lauth, E.; Kunith, A.; Zhang, X. Design of urban electric bus systems. Des. Sci. 2018, 4. [Google Scholar] [CrossRef] [Green Version]
- Fusco, G.; Alessandrini, A.; Colombaroni, C.; Valentini, M.P. A Model for Transit Design with Choice of Electric Charging System. Procedia-Soc. Behav. Sci. 2013, 87, 234–249. [Google Scholar] [CrossRef] [Green Version]
- Lajunen, A. Lifecycle costs and charging requirements of electric buses with different charging methods. J. Clean. Prod. 2018, 172, 56–67. [Google Scholar] [CrossRef]
- Gao, Z.; Lin, Z.; LaClair, T.J.; Liu, C.; Li, J.M.; Birky, A.K.; Ward, J. Battery capacity and recharging needs for electric buses in city transit service. Energy 2017, 122, 588–600. [Google Scholar] [CrossRef] [Green Version]
- Lajunen, A.; Lipman, T. Lifecycle cost assessment and carbon dioxide emissions of diesel, natural gas, hybrid electric, fuel cell hybrid and electric transit buses. Energy 2016, 106, 329–342. [Google Scholar] [CrossRef]
- Macedo, J.; Soares, G.; Kokkinogenis, Z.; Perrotta, D.; Rossetti, R.J.F. A Framework for Electric Bus Powertrain Simulation in Urban Mobility Settings: Coupling SUMO with a Matlab/Simulink Nanoscopic Model, 1st ed.; SUMO User Conference: Berlin, Germany, 2013. [Google Scholar]
- Bi, Z.; de Kleine, R.; Keoleian, G.A. Integrated Life Cycle Assessment and Life Cycle Cost Model for Comparing Plug-in versus Wireless Charging for an Electric Bus System. J. Ind. Ecol. 2017, 21, 344–355. [Google Scholar] [CrossRef]
- De Filippo, G.; Marano, V.; Sioshansi, R. Simulation of an electric transportation system at The Ohio State University. Appl. Energy 2014, 113, 1686–1691. [Google Scholar] [CrossRef]
- Sebastiani, M.T.; Luders, R.; Fonseca, K.V.O. Evaluating Electric Bus Operation for a Real-World BRT Public Transportation Using Simulation Optimization. IEEE Trans. Intell. Transp. Syst. 2016, 17, 2777–2786. [Google Scholar] [CrossRef]
- Ke, B.R.; Chung, C.Y.; Chen, Y.C. Minimizing the costs of constructing an all plug-in electric bus transportation system: A case study in Penghu. Appl. Energy 2016, 177, 649–660. [Google Scholar] [CrossRef]
- Rogge, M.; van der Hurk, E.; Larsen, A.; Sauer, D.U. Electric bus fleet size and mix problem with optimization of charging infrastructure. Appl. Energy 2018, 211, 282–295. [Google Scholar] [CrossRef] [Green Version]
- Lindgren, L. Electrification of City Bus Traffic-A Simulation Study Based on Data from Linköping. Available online: http://lup.lub.lu.se/record/d5834bb3-c0f0-4c7c-a493-69b10291d1f1 (accessed on 25 June 2020).
- Li, L.; Lo, H.K.; Xiao, F. Mixed bus fleet scheduling under range and refueling constraints. Transp. Res. Part Emerg. Technol. 2019, 104, 443–462. [Google Scholar] [CrossRef]
- Kovalyov, M.Y.; Rozin, B.M.; Guschinsky, N.N. Mathematical Model and Random Search Algorithm for the Optimal Planning Problem of Replacing Traditional Public Transport with Electric. Autom. Remote Control. 2020, 81, 803–818. [Google Scholar] [CrossRef]
- Vilppo, O.; Markkula, J. Feasibility of electric buses in public transport. In Proceedings of the EVS28 International Electric Vehicle Symposium and Exhibition, Seoul, Korea, 3–5 May 2015. [Google Scholar]
- Kunith, A.; Mendelevitch, R.; Göhlich, D. Electrification of a city bus network-An optimization model for cost-effective placing of charging infrastructure and battery sizing of fast charging electric bus systems. DIW Discussion Papers. 2016. Available online: http://www.diw.de/documents/publikationen/73/diw_01.c.534056.de/dp1577.pdf (accessed on 25 June 2020).
- Liu, Z.; Song, Z. Robust planning of dynamic wireless charging infrastructure for battery electric buses. Transp. Res. Part Emerg. Technol. 2017, 83, 77–103. [Google Scholar] [CrossRef]
- Berthold, K.; Förster, P.; Rohrbeck, B. Location Planning of Charging Stations for Electric City Buses. In Operations Research Proceedings; Springer International Publishing: Cham, Switzerland, 2017; pp. 237–242. [Google Scholar] [CrossRef]
- Xylia, M.; Leduc, S.; Patrizio, P.; Kraxner, F.; Silveira, S. Locating charging infrastructure for electric buses in Stockholm. Transp. Res. Part Emerg. Technol. 2017, 78, 183–200. [Google Scholar] [CrossRef]
- Pihlatie, M.; Kukkonen, S.; Halmeaho, T.; Karvonen, V.; Nylund, N.O. Fully electric city buses-The viable option. In Proceedings of the 2014 IEEE International Electric Vehicle Conference (IEVC), Florence, Italy, 17–19 December 2014; pp. 1–8. [Google Scholar] [CrossRef]
- Paul, T.; Yamada, H. Operation and charging scheduling of electric buses in a city bus route network. In Proceedings of the 17th International IEEE Conference on Intelligent Transportation Systems (ITSC), Qingdao, China, 8–11 October 2014. [Google Scholar] [CrossRef]
- Wang, H.; Shen, J. Heuristic approaches for solving transit vehicle scheduling problem with route and fueling time constraints. Appl. Math. Comput. 2007, 190, 1237–1249. [Google Scholar] [CrossRef]
- Li, J.Q. Transit Bus Scheduling with Limited Energy. Transp. Sci. 2014, 48, 521–539. [Google Scholar] [CrossRef]
- Adler, J.D.; Mirchandani, P.B. The Vehicle Scheduling Problem for Fleets with Alternative-Fuel Vehicles. Transp. Sci. 2017, 51, 441–456. [Google Scholar] [CrossRef]
- Wen, M.; Linde, E.; Ropke, S.; Mirchandani, P.; Larsen, A. An adaptive large neighborhood search heuristic for the Electric Vehicle Scheduling Problem. Comput. Oper. Res. 2016, 76, 73–83. [Google Scholar] [CrossRef] [Green Version]
- Reuer, J.; Kliewer, N.; Wolbeck, L. The Electric Vehicle Scheduling Problem-A study on time-space network based and heuristic solution approaches. In Proceedings of the Conference on Advanced Systems in Public Transport (CASPT), Rotterdam, The Netherlands, 19–23 July 2015. [Google Scholar]
- van Kooten Niekerk, M.E.; van den Akker, J.M.; Hoogeveen, J.A. Scheduling electric vehicles. Public Transp. 2017, 9, 155–176. [Google Scholar] [CrossRef]
- Sinhuber, P.; Rohlfs, W.; Sauer, D.U. Study on Power and Energy Demand for Sizing the Energy Storage Systems for Electrified Local Public Transport Buses. In Proceedings of the IEEE Vehicle Power and Propulsion Conference (VPPC), Seoul, Korea, 9–12 October 2012; pp. 315–320. [Google Scholar]
- Hegazy, O.; El Baghdadi, M.; Coosemans, T.; Van Mierlo, J. Co-design Optimization Framework for Electrified Buses in Cities:Brussels Case Study. In Proceedings of the EVS31 International Electric Vehicle Symposium & Exhibition, Kobe, Japan, 30 September–3 October 2018. [Google Scholar]
- Lajunen, A.; Kalttonen, A. Investigation of thermal energy losses in the powertrain of an electric city bus. In Proceedings of the 2015 IEEE Transportation Electrification Conference and Expo (ITEC), Dearborn, Michigan, 14–17 June 2015. [Google Scholar] [CrossRef]
- Jefferies, D.; Ly, T.; Kunith, A.; Göhlich, D. Energiebedarf Verschiedener Klimatisierungssysteme für Elektro-Linienbusse; Deutsche Kälte- und Klimatagung: Dresden, Germany, 2015. [Google Scholar]
- Göhlich, D.; Ly, T.; Kunith, A.; Jefferies, D. Economic assessment of different air-conditioning and heating systems for electric city buses based on comprehensive energetic simulations. In Proceedings of the EVS28 International Electric Vehicle Symposium and Exhibition, Seoul, Korea, 3–5 May 2015. [Google Scholar]
- Jäger, B.; Wittmann, M.; Lienkamp, M. Agent-based Modeling and Simulation of Electric Taxi Fleets. 6. Conference on Future Automotive Technology; Fürstenfeldbruck, Germany, 2017. Available online: https://mediatum.ub.tum.de/1378513 (accessed on 25 June 2020).
- Gacias, B.; Meunier, F. Design and operation for an electric taxi fleet. OR Spectrum 2014, 37, 171–194. [Google Scholar] [CrossRef] [Green Version]
- Cheng, S.F.; Nguyen, T.D. TaxiSim: A Multiagent Simulation Platform for Evaluating Taxi Fleet Operations. IEEE/WIC/ACM International Conference on Intelligent Agent Technology. 2011. Available online: https://works.bepress.com/sfcheng/1/ (accessed on 25 June 2020).
- van Lon, R.R.S.; Holvoet, T. RinSim: A Simulator for Collective Adaptive Systems in Transportation and Logistics. In Proceedings of the 2012 IEEE Sixth International Conference on Self-Adaptive and Self-Organizing Systems, Lyon, France, 10–14 September 2012. [Google Scholar] [CrossRef] [Green Version]
- Meignan, D.; Simonin, O.; Koukam, A. Simulation and evaluation of urban bus-networks using a multiagent approach. Simul. Model. Pract. Theory 2007, 15, 659–671. [Google Scholar] [CrossRef]
- Cats, O.; Larijani, A.N.; Koutsopoulos, H.N.; Burghout, W. Impacts of Holding Control Strategies on Transit Performance. Transp. Res. Rec. J. Transp. Res. Board 2011, 2216, 51–58. [Google Scholar] [CrossRef] [Green Version]
- Lajunen, A. Energy consumption and cost-benefit analysis of hybrid and electric city buses. Transp. Res. Part Emerg. Technol. 2014, 38, 1–15. [Google Scholar] [CrossRef]
- Lauth, E.; Mundt, P.; Göhlich, D. Simulation-based Planning of Depots for Electric Bus Fleets Considering Operations and Charging Management. In Proceedings of the 4th International Conference on Intelligent Transportation Engineering (ICITE), Singapore, 7 September 2019. [Google Scholar] [CrossRef]
- Python Software Foundation. Python. Available online: https://www.python.org/ (accessed on 25 June 2020).
- Scherfke, S. SimPy: Discrete Event Simulation for Python. Available online: https://simpy.readthedocs.io/en/latest/ (accessed on 25 June 2020).
- Heidelberg Institute for Geoinformation Technology (HeiGIT). Openrouteservice. Available online: https://openrouteservice.org/ (accessed on 25 June 2020).
- UITP. UITP Project “SORT”–Standardised on-Road Test Cycles; UITP: Brussels, Belgium, 2009. [Google Scholar]
- Mitschke, M.; Wallentowitz, H. Dynamik der Kraftfahrzeuge; Springer Fachmedien Wiesbaden: Wiesbaden, Germany, 2014. [Google Scholar] [CrossRef]
- Verband Deutscher Verkehrsunternehmen (VDV). VDV-Schrift 236: Klimatisierung von Linienbussen der Zulassungsklassen I und II, Für Konventionell Angetriebene Diesel- und Gasbusse Sowie Für Hybrid-, Brennstoffzellen- und Elektrobusse; VDV: Cologne, Germany, 2015. [Google Scholar]
- Bünnagel, C. Irizar ie bus-Power aus dem Baskenland. Verk. Tech. 2018, 10, 363–369. [Google Scholar] [CrossRef]
- Ebusco. The New Ebusco 2.2. Available online: https://www.ebusco.com/wp-content/uploads/EBUSCO_brochure_2-2_digi.pdf (accessed on 25 June 2020).
- Hondius, H. Daimler Buses stellt vollelektrischen Mercedes-Benz Citaro vor. Stadtverkehr 2018, 5, 10–15. [Google Scholar]
- Berliner Verkehrsbetriebe AöR (BVG). Die Omnibusflotte der BVG. Available online: https://unternehmen.bvg.de/index.php?section=downloads&download=579 (accessed on 25 June 2020).
- Färber, F. Heizen im Elektrobus. In Proceedings of the 10. VDV-Konferenz Elektrobusse, Berlin, Germany, 5–6 February 2019. [Google Scholar]
- Akasol AG. Akasol Akasystem 15 AKM 64 CYC. Available online: https://www.akasol.com/library/Downloads/Datenbl%C3%A4tter/02-05-2019/Data%20sheet-AKASOL-AKASystem-15AKM64CYC-WEB.pdf (accessed on 25 June 2020).
- Impact Clean Power Technology S.A. UVES LTO Standard Battery Pack LTO 15.2 kWh. Available online: https://icpt.pl/wp-content/uploads/2018/07/ICPT_UVES_LTO_Standard_leaflet.pdf (accessed on 25 June 2020).
- Bundesinstitut für Bau-, Stadt- und Raumforschung. Aktualisierte und Erweitere Testreferenzjahre (TRY) von Deutschland für Mittlere und Extreme Witterungsverhältnisse. Available online: http://www.bbsr-energieeinsparung.de/EnEVPortal/DE/Regelungen/Testreferenzjahre/Testreferenzjahre/01_start.html?nn=739044¬First=true&docId=743442 (accessed on 25 June 2020).
- Statistisches Bundesamt. Genesis-Online: Die Datenbank des Statistischen Bundesamtes. Available online: https://www-genesis.destatis.de/genesis/online (accessed on 25 June 2020).
- Fülling, T. Neue Berliner E-Busse können nur halben Tag fahren. Available online: https://www.morgenpost.de/berlin/article226090187/Neue-E-Busse-in-Berlin-koennen-nur-halben-Tag-fahren.html (accessed on 25 June 2020).
- Fülling, T. BVG kauft 156 neue Busse im “Schweden-Design”. Available online: https://www.morgenpost.de/berlin-aktuell/article122117680/BVG-kauft-156-neue-Busse-im-Schweden-Design.html (accessed on 14 July 2020).
- Sauer, D.U. Aktueller Stand der Entwicklungen von Batterietechnik und Batteriemarkt. In Proceedings of the 11. VDV-Konferenz Elektrobusse, Berlin, Germany, 4–5 February 2020. [Google Scholar]
- Statistisches Bundesamt. Daten zur Energiepreisentwicklung-Lange Reihen bis März 2020. Available online: https://www.destatis.de/DE/Themen/Wirtschaft/Preise/Publikationen/Energiepreise/energiepreisentwicklung-pdf-5619001.html (accessed on 25 June 2020).
- Krämer, K.; Hanke, D. Lange Stille. Bozankaya Elektrobus Sileo S 12. Omnibusspiegel 2015, 2, 5–9. [Google Scholar]
- Kölner Verkehrs-Betriebe AG. KVB stellt den Betrieb der Linie 133 auf E-Busse um: Zehnmonatiges Testprogramm wurde erfolgreich abgeschlossen: Pressemitteilung. Available online: https://www.presseportal.de/pm/122503/3501162 (accessed on 25 June 2020).
- Göhlich, D.; Fay, T.A.; Park, S. Conceptual Design of Urban E-Bus Systems with Special Focus on Battery Technology. Proc. Des. Soc. Int. Conf. Eng. Des. 2019, 1, 2823–2832. [Google Scholar] [CrossRef] [Green Version]
- Verein deutscher Ingenieure (VDI). VDI-Richtlinie 2078: Berechnung von Kühllast und Raumtemperaturen von Räumen und Gebäuden; VDI: Düsseldorf, Germany, 2012. [Google Scholar]


| Source | Optimisation | Multiple Depots | Vehicle Type Restrictions Per Trip | Charging Strategies | Route Restriction | Charging Duration Dependent on Vehicle SOC | Partial Charging Allowed | Charging Station Capacity Constraint | Depot Capacity Constraint | Variable Fleet Mix | OC Charging Location Optimisation | ||
|---|---|---|---|---|---|---|---|---|---|---|---|---|---|
| DC | OC-T | OC-C | |||||||||||
| Rogge et al. [17] | • | ∘ | ∘ | • | ∘ | ∘ | energy | • | ∘ | – | ∘ | • | – |
| Ke et al. [16] | ∘ | ∘ | ∘ | • | ∘ | • | energy | • | ∘ | ∘ | ∘ | ∘ | ∘ |
| Jefferies and Göhlich [6] | ∘ | ∘ | • | • | • | ∘ | energy | • | ∘ | ∘ | ∘ | ∘ | ∘ |
| Paul and Yamada [27] | ∘ | – | ∘ | ∘ | • | ∘ | none | • | • | ∘ | – | • | ∘ |
| Wang and Shen [28] | • | • | ∘ | • | ∘ | ∘ | time | ∘ | – | – | • | ∘ | – |
| Li [29] | • | ∘ | ∘ | • | • | • | distance | ∘ | – | • | • | ∘ | ∘ |
| Adler and Mirchandani [30] | • | • | ∘ | • | • | • | energy | ∘ | – | ∘ | • | ∘ | ∘ |
| Wen et al. [31] | • | • | ∘ | • | • | • | energy | • | • | ∘ | ∘ | ∘ | ∘ |
| Li et al. [19] | • | • | • | • | • | • | energy | ∘ | – | • | ∘ | • | • |
| Reuer et al. [32] | • | ? | ∘ | • | • | • | energy | ∘ | – | ∘ | ? | • | ∘ |
| van Kooten Niekerk et al. [33] | • | ∘ | ∘ | • | • | • | energy | • | • | ∘ | ∘ | ∘ | ∘ |
| Source | ChargingStrategies | Exact Timetables | Delays | Fleet SizeCalculation | ChargingInfrastructureDemand Calculation | Staff Demand Calc. | |
|---|---|---|---|---|---|---|---|
| E-Scheduling | Depot | ||||||
| Fusco et al. [8] | OC-I, OC-T | ∘ | • | approx. | ∘ | heuristic | ∘ |
| Bi et al. [13] | DC, OC-I | ∘ | ∘ | none | ∘ | ? | ∘ |
| Jefferies and Göhlich [6] | DC, OC-T | • | • | exact | • | heuristic | • |
| Kunith [5] | DC, OC-I | ∘ | ∘ | approx. | approx. | optimisation | partly |
| Rogge et al. [17] | DC | • | ∘ | exact | • | optimisation | • |
| Ke et al. [16] | DC, OC-T | • | ∘ | approx. | • | ? | ∘ |
| Lajunen [9] | DC, OC-I, OC-T | ∘ | ∘ | ? | ∘ | heuristic | ∘ |
| Lindgren [18] | OC-I, IMC | • | ∘ | none | ∘ | optimisation | ∘ |
| Vilppo and Markkula [21] | OC-T | ∘ | ∘ | none | ∘ | heuristic | ∘ |
| Pihlatie et al. [26] | DC, OC-T | ∘ | ∘ | none | ∘ | heuristic | ∘ |
| Quantity | Symbol | Value | Source |
|---|---|---|---|
| Rolling resistance coefficient | 0.0075 | [51] | |
| Drag coefficient | 0.66 | [34] | |
| Frontal projection area | 8.8 m | [34] | |
| Rotational mass factor | 1.1 | [5] |
| Profile | Spec. Consumption (kWh/km) | Relative Deviation | |
|---|---|---|---|
| Simulation | Experiment | ||
| SORT 1 | 1.62 | 1.63 | −0.5 % |
| SORT 2 | 1.43 | 1.40 | +1.7 % |
| SORT 3 | 1.36 | 1.37 | −1.1 % |
| Depot Charging | Opportunity Charging | Sources and Comments | ||||
|---|---|---|---|---|---|---|
| Short Range | Medium Range | Long Range | Low Power | High Power | ||
| Desired range (km) | 120 | 200 | 300 | 60 | ||
| Base weight (kg) | 11175/16097 | [53,54,55] | ||||
| Kerb weight (kg) | 12646/18164 | 13696/19638 | 14383/20604 | 13764/19734 | Vehicle + battery | |
| Maximum passenger occupation | 70/99 | [56] | ||||
| UA value (kW/K) | 0.562/0.843 | Calculated from [57] | ||||
| Insolation area (m) | 11.4/17.1 | |||||
| Aux power excl. HVAC (kW) | 4.0/5.4 | Simulation | ||||
| Number of HVAC units | 1/2 | |||||
| Battery parameters | ||||||
| - Energy density (Wh/kg) | 171 | 171 | 205 | 53 | [58,59] | |
| - Capacity (kWh) | 252/353 | 431/606 | 658/925 | 137/193 | Simulation | |
| - SOC (min-max) | 0.05–0.95 | 0.10–0.95 | ||||
| - Maximum C rate | 0.62 | 4.35 | [58,59] | |||
| - SOH | 0.80 | |||||
| Fast charging parameters | ||||||
| - Charging power (kW) | 300 | 450 | ||||
| - Efficiency | 0.95 | |||||
| - Dead time before-after (s) | 15–15 | |||||
| Depot charging parameters | ||||||
| - Charging power (kW) | 60–150 | |||||
| - Efficiency | 0.95 | |||||
| - Dead time before-after (s) | 60–60 | |||||
| Traction consumption (kWh/km) | 0.73/0.99 | 0.77/1.05 | 0.80/1.09 | 0.77/1.06 | Simulation | |
| Total consumption (kWh/km) | 1.51/2.12 | 1.55/2.18 | 1.58/2.22 | 1.55/2.18 | Simulation | |
| Case | Number of Schedules | Mean Distance (km) | Mean Duration (h) | Mean Efficiency (%) |
|---|---|---|---|---|
| DC (120 km) | 667 | 96.7 | 5.9 | 88.2 |
| DC (200 km) | 441 | 138.6 | 8.6 | 91.5 |
| DC (300 km) | 350 | 171.2 | 10.7 | 92.8 |
| OC (300 kW) | 340 | 176.1 | 12.3 | 93.3 |
| OC (450 kW) | 327 | 182.3 | 12.4 | 93.4 |
| Diesel | 302 | 195.8 | 12.3 | 93.7 |
| Scenario No. | Name | Fleet Size | Fast Charging Slots | Depot Charging Slots |
|---|---|---|---|---|
| 1 | DC (120 km) | 116/188/304 | 0 | 272 |
| 2 | DC (200 km) | 130/206/336 | 0 | 305 |
| 3 | DC (300 km) | 94/143/237 | 0 | 205 |
| 4 | OC (300 kW) | 104/158/262 | 127 | 223 |
| 5 | OC (450 kW) | 100/154/254 | 117 | 215 |
| 6 | DC (200 km), 60 kW | 133/217/350 | 0 | 319 |
| 7 | OC (300 kW), 60 kW | 105/159/264 | 127 | 225 |
| 8 | Diesel | 94/140/234 | 0 | 201 |
| Quantity | Value | Source |
|---|---|---|
| Base year and project start | 2020 | Assumption |
| Project duration | 12 years | Assumption |
| Discount rate (general inflation) | 1.4% p.a. | [61] (1999–2019) |
| Interest rate | 4% | Assumption |
| Electric bus base cost (without battery) | 450,000 €/585,000 € | Calculated based on [62,63,64] |
| Diesel bus cost | 250,000 €/325,000 € | [62,63] |
| Vehicle lifetime | 12 years | Assumption |
| Battery cost (NMC) | 500 €/kWh | [64] |
| Battery cost (LTO) | 800 €/kWh | Assumption |
| Battery cost escalation | −8% p.a. | Calculated based on [64] |
| Battery lifetime | 6 years, 12 years | Assumption |
| 300 kW fast charging station | 200,000 € per slot | Own market research |
| 450 kW fast charging station | 250,000 € per slot | Own market research |
| Fast charging station construction/grid connection | 225,000 € per station | Own market research |
| Depot charging station | 100,000 € per slot | Own market research |
| Charging infrastructure lifetime | 20 years | Assumption |
| Charging station efficiency | 95% | Assumption |
| Electricity cost | 0.15 €/kWh | |
| Electricity cost escalation | +3.8% p.a. | [65] (2005–2019) |
| Diesel cost | 1 €/L | |
| Diesel cost escalation | +0.7% p.a. | [65] (2005–2019) |
| Fast charging station maintenance | 1000 €/a per slot | Own market research |
| Source | Relative TCO Difference | Comments | ||
|---|---|---|---|---|
| OC vs. Diesel | DC vs. Diesel | DC vs. OC | ||
| Bi et al. [13] | −18% | −12% | 8% | No staff cost |
| Kunith [5] | 4 … 18% | 53 … 83% | 47 … 55% | Additional staff cost (for DC only) |
| Lajunen and Lipman [11] | 22 … 29% | 34 … 44% | 7 … 18% | No staff cost |
| Pihlatie et al. [26] | 7 … 25% | 43 … 60% | 26 … 40% | No staff cost |
| Vilppo and Markkula [21] | −6% | n/a | n/a | No staff cost |
| Ke et al. [16] | n/a | n/a | 8% | No staff cost |
| This work | 35 … 45% | 42 … 58% | 6 … 13% | Additional staff cost |
© 2020 by the authors. Licensee MDPI, Basel, Switzerland. This article is an open access article distributed under the terms and conditions of the Creative Commons Attribution (CC BY) license (http://creativecommons.org/licenses/by/4.0/).
Share and Cite
Jefferies, D.; Göhlich, D. A Comprehensive TCO Evaluation Method for Electric Bus Systems Based on Discrete-Event Simulation Including Bus Scheduling and Charging Infrastructure Optimisation. World Electr. Veh. J. 2020, 11, 56. https://doi.org/10.3390/wevj11030056
Jefferies D, Göhlich D. A Comprehensive TCO Evaluation Method for Electric Bus Systems Based on Discrete-Event Simulation Including Bus Scheduling and Charging Infrastructure Optimisation. World Electric Vehicle Journal. 2020; 11(3):56. https://doi.org/10.3390/wevj11030056
Chicago/Turabian StyleJefferies, Dominic, and Dietmar Göhlich. 2020. "A Comprehensive TCO Evaluation Method for Electric Bus Systems Based on Discrete-Event Simulation Including Bus Scheduling and Charging Infrastructure Optimisation" World Electric Vehicle Journal 11, no. 3: 56. https://doi.org/10.3390/wevj11030056
APA StyleJefferies, D., & Göhlich, D. (2020). A Comprehensive TCO Evaluation Method for Electric Bus Systems Based on Discrete-Event Simulation Including Bus Scheduling and Charging Infrastructure Optimisation. World Electric Vehicle Journal, 11(3), 56. https://doi.org/10.3390/wevj11030056