Article

Investigation of Thermal Effects in Different Lightweight Constructions for Vehicular Wireless Power Transfer Modules

1
Mercedes-Benz AG, 059/X631, 71059 Sindelfingen, Germany
2
Institut für Leichtbau und Kunststofftechnik, Technische Universität Dresden, 01307 Dresden, Germany
*
Author to whom correspondence should be addressed.
These authors contributed equally to this work.
World Electr. Veh. J. 2020, 11(4), 67; https://doi.org/10.3390/wevj11040067
Submission received: 26 June 2020 / Revised: 29 September 2020 / Accepted: 20 October 2020 / Published: 23 October 2020
(This article belongs to the Special Issue Wireless Power Transfer for EVs)

Abstract

:
This paper presents a thermal investigation of lightweight on-board receiver modules of wireless power transfer systems for electric vehicles. The studied modules are capable of receiving up to 11 kW at a resonance frequency of 85 kHz over a distance of 110–160 mm. The receiver modules were built as sandwich and space–frame concept to design stiff and lightweight structures. The high transmission power of automotive wireless power transfer systems combined with the multi-part assembly of receiver modules led to challenges in heat management. To address this, the physical behaviour of the proposed lightweight concepts were studied on component and system level using a hardware-in-the-loop testing facility for wireless power transfer systems. Special emphasis was laid on the validation of a thermal simulation model, which uses analytical calculated power losses taking into account their temperature dependency. The proposed simulation model is consistent with the experimental validation of the critical active components. The performed systematic studies build the basis for a more sophisticated thermal dimensioning of various constructions for wireless power transfer modules.

1. Introduction

Wireless power transfer systems (WPTS) are considered as key factors in increasing the acceptance of electric vehicles (EVs) [1,2]. Compared to plugin charging, wireless charging provides power transfer without user intervention. This results in an increase of comfort and safety by eliminating cable handling. Thus, WPTS are considered as a low-maintenance charging technology for EVs.
The operating principle of WPTS is based on the electromagnetc interaction of an off-board Ground Pad Module (GPM) and an on-board Car Pad Module (CPM). The GPM usually consists of four main elements: a rectifier circuit, an inverter, a matching network including a capacitor and a transmitter coil. The rectifier and inverter convert the alternating current (AC) from the power grid connection into direct current (DC) and back into a high frequency (HF)-AC. The HF-AC drives the series resonant tank, composed of a matching networks including a resonance capacitor C GPM and a transmitter coil L GPM . The CPM usually is built of a series or parallel resonant tank, consisting of a receiver coil L CPM and a matching network including a resonance capacitor C CPM , a rectifier and if necessary a DC/DC converter. The architecture of an exemplary WPTS is illustrated in Figure 1.
This paper focuses on the on-board CPM. The restricted installation space in today’s car designs requires CPM designs with maximum efficiency and compactness. Hence, a high volume-related power density is required. As given in [3], the maximum efficiency of the coil system of WPTS is described by
η max = k 2 · Q GPM Q CPM 1 + 1 + k 2 · Q GPM Q CPM 2 1 2 k Q ,
Q GPM = ω 0 · L GPM R AC , GPM ,
Q CPM = ω 0 · L CPM R AC , CPM ,
where k can be described as the magnetic coupling coefficient and Q represents the geometric mean of the inductor quality factor of GPM Q GPM and CPM Q CPM at a specific transmission frequency ω 0 . Consequently, maximizing the product of magnetic coupling and quality factor results in a maximum of efficiency. Considering a specific air gap, magnetic coupling increases by increasing the coil dimensions of the transmitter and receiver modules. The quality factor increases with expansion of coil dimensions at a specific frequency neglecting AC losses. Thus, the transmission efficiency depends mainly on coil dimensions related to the air gap and transmission frequency. However, the use of additional components such as ferrites or shielding also influences the transmission efficiency [4]. This must be taken into account in the optimization process.
In automotive WPTS, the main electrical system specifications and boundary conditions are standardized in the SAE J2954 [5]. Accordingly, transmission frequency, air gap and coil dimensions are predefinded parameters. Thus, optimizing the entire system of coil, ferrites, shielding and power electronics is key to increase the transmission efficiency. This requires a multi-objective optimization considering electrical, thermal and mechanical requirements. The dependencies between transmission efficiency, litz wire dimensioning [6,7,8] and coil geometry [9,10,11] are extensively studied. The influence of ferrites [4,9,12,13] and shielding [14,15] is also well known in literature. The tradeoff between efficiency and compactness of magnetic circuit and power electronics is also extensively researched using pareto front of coil efficiency [16,17,18]. A comprehensive investigation of multi-objective optimization of WPTS considering electrical and thermal requirements is given in [19].
CPMs are usually mounted on the underside of EVs [20]. This conceptional position results in high mechanical requirements to guarantee mechanical and electrical functionality within the lifecycle of EVs [20,21,22]. Therefore, CPMs require a solid and stiff construction. The vehicle integration of conventional CPMs provides protection by a safety case and an additional underbody cover. This counteracts the target to achieve a high compactness. In this respect, the vertical dimension (z-dimension) is key due to components above. Thus, novel CPM constructions with a high volume-related power density and reduced z-dimension are required. Figure 2 illustrates a qualitative comparison of conventional and proposed concepts.
Especially, systematic lightweight design using functional integration is considered as expedient approach to reduce weight and volume while maintaining electrical functionality. In this respect, sandwich and space–frame constructions are effective in integrating and protecting macro-scaled components like magnetic circuits of CPMs [24,25,26].
To the knowledge of the authors, a comprehensive investigation of different types of construction for WPTS cannot be found in literature. Therefore, this paper focuses on the investigation of CPM concepts considering additional mechanical and thermal requirements. Based on an exemplary 11 kW WPTS presented in Section 2, the paper introduces a sandwich and a space–frame concept in Section 3. The concepts aim for using similar z-dimension compared to a 3.6 kW system presented in [20]. As shown in [19,27], the thermal management is a major challenge of WPTS featuring high area-related power density. Therefore, the paper introduces a thermal simulation model, which is validated using comprehensive experimental studies based on an exemplary WPTS. In order to keep testing efforts within reasonable bounds, the experimental procedure presented in Section 5 is divided into two steps. The first part shows the electric–thermal investigation of CPM without GPM interaction. In the second part, the perfomance of the complete magnetic circuit considering CPM and GPM is validated. The simulative and experimental results of the proposed concepts presented in Section 6 are discussed in Section 7.

2. Exemplary Wireless Power Transfer System

The setup of the utilized wireless power transfer system is shown in Figure 3. The power electronics of the GPM uses a reduced and simplified implementation. The AC/DC stage is a silicon B6-rectifier, which transforms the 3-phase input voltage into DC voltage feeding a DC link capacitor C DC , link . A power factor correction (PFC) is not implemented, as the test system is operating on an isolated grid. As power inverter a SiC-MOSFET half bridge module is utilized, which switches up to 100 A RMS with up to 100 kHz frequency. The resonant tank of the GPM contains a transmitter coil L GPM and a matching network including a serial capacitor C GPM . The series resonant tank of the CPM is built of a coil L CPM and a capacitor C CPM . As rectifier a SiC-B4 bridge is used. The current is filtered with another DC link capacity C filt . An actively controlled or passive DC/DC conversion is not implemented per design as the output voltage of the CPM resonant tank is above battery voltage. The power control strategy is considered to be a mix between frequency-control and interleave mode operation. However, in experimental setup the power is controlled manually via the ouput voltage of the isolated power supply.
Dimensioning of WPTS requires a multi-objective optimization process based on analytical and numerical calculations [16]. The first step is the definiton of system specifications and design constraints. System specifications of WPTS are mainly characterized by output power, air gap, voltage levels and requirements based on standardization. Design constraints result, for instance, from limited vehicular installation space and fixed mounting points. Table 1 summarizes the main system specifications and design constraints of the exemplary WPT system.
The coil area of the exemplary WPTS is restricted to an area of 300 mm × 300 mm due to limited installation space. According to SAE J2954 [5], interoperability is required within air gaps of 100 mm to 210 mm. Misalignment requirements and transmission frequency are defined in SAE J2954 [5]. The DC-Link voltage of the CPM is fixed to HV battery voltage, the DC-link voltage is adjustable between 0 V–540 V.
Based on the system specifications and the design constraints, geometric and material specifications of active components of CPM are defined. Under the consideration of skin depth related to frequency, a round stranded copper wire with 840 × 0.1 mm strands is used. To utilize the maximum of installation area with a minimum of z-dimension, the coil shape is designed rectangular with 15 single-layer windings. The GPM coil design is derived on basis of CPM coil design using several analytical and numerical iterative models as described in [16]. Thus, the GPM coil is measured to 600 mm × 750 mm using a single-layer rectangular coil layout and identical round stranded wire of CPM. This is necessary to fulfill the system specifications in terms of air gap combined with lateral misalignment. Figure 4 illustrates the used active components and the geometrical dimensions. The corresponding parameters are given in Table 2.
Considering a transmission frequency of 85 kHz, manganese-zinc power ferrites BFM8 [28] are used to ensure low power losses and an adequate saturation flux density. The dimensions of a single ferrite plate are 49 mm × 49 mm × 3 mm. To be consistent to SAE J2954 [5] and to reduce power losses, the arrangement of the single ferrites results in a layout, which covers the winding area of the coil completely. Moreover, additional ferrites are aligned and stacked along the entire perimeter of the coil on inner and outer radius. The lateral ferrites are made of PLT32/20/3.2/R-3F36 [29] with high permeability measured at dimensions of 18 mm × 10 mm × 2.4 mm.

3. Description of Proposed CPM Concepts

Due to the conceptual installation position, the dimensioning of CPMs requires the consideration of additional mechanical requirements such as underfloor impact scenarios given in [20]. Therefore, CPMs require a solid and stiff construction with a high volume-related power density. Accordingly, two functionally integrative lightweight CPM concepts are proposed as a sandwich and space frame construction, in which the WPTS is integrated. The proposed demonstrators are intended for experimental testing in a laboratory. Therefore, we use simplified generic prototypes scaled to the dimensions of 390 mm × 390 mm, where the z-dimensions depend on the respective concept. This scaling and the simplification reduces manufacturing costs and save resources. Furthermore, no additional electronic components except the coils were integrated in the generic prototypes. These components are installed in an additional box.
The dimensioning of the passive elements is executed using analytical estimations under consideration of quasi-static load cases given in [20]. Regardless of the concept, all passive elements are conceptualized from high-temperature plastic materials, since alternating electromagnetic fields induces eddy current losses in metal parts.

3.1. Sandwich Concept

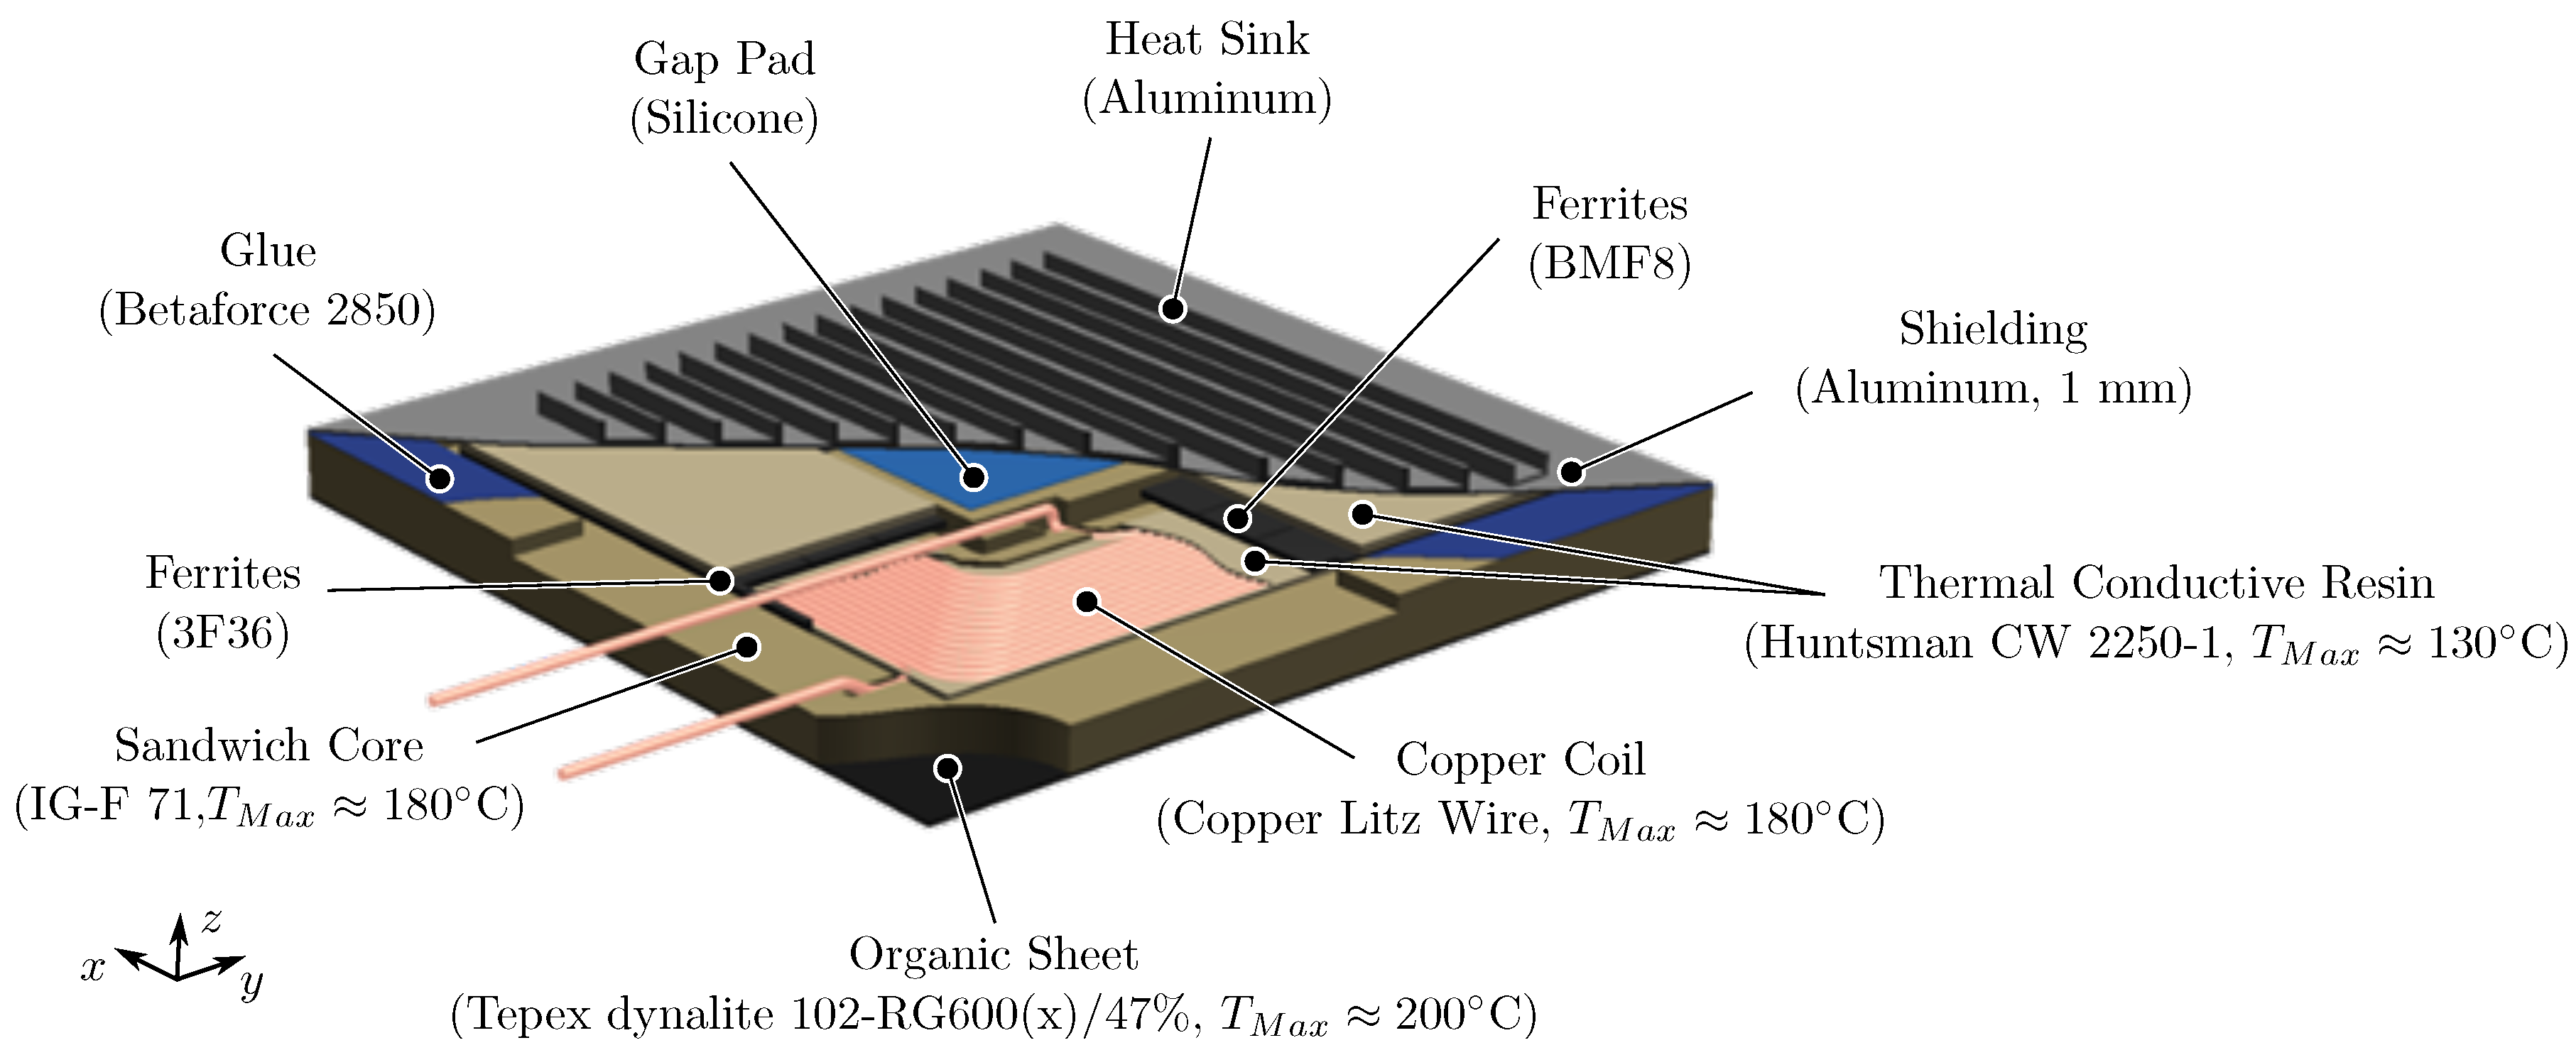
The sandwich concept is based on a sandwich core using Rohacell 71 IG F [30] shaped by controlled milling. The sandwich core is designed as carrier of the active components. Thus, coil and ferrites are embedded into the core using thermal conductive resin CW 2250-1 [31]. The resin improves the thermal bonding between the coil and the ferrite cores. The ferrite plates are arranged to cover up the complete coil winding area. The lateral ferrites are located in cutouts within the sandwich core. Simulating the underbody cover, an organic sheet [32] is glued to the backside of the sandwich core using Betaforce 2850 [33]. Equally, the passive aluminum shielding (390 mm × 390 mm × 1 mm) is glued to the top side of the sandwich core. To improve the thermal transfer between ferrites and shielding, thermal gap filler pads [34] (145 mm × 145 mm × 0.5 mm) are used. Additionally, aluminum heat sinks (145 mm × 20 mm × 10 mm) are glued to the aluminium shielding using ACC Silicones SILCOTHERM [35]. Thus, they completely cover the surface of the coil. The total z-dimension of this construction measures 30 mm with a weight of 5.7 kg. The proposed sandwich concept including the maximum temperature ratings of the components is illustrated in Figure 5.

3.2. Space-Frame Concept

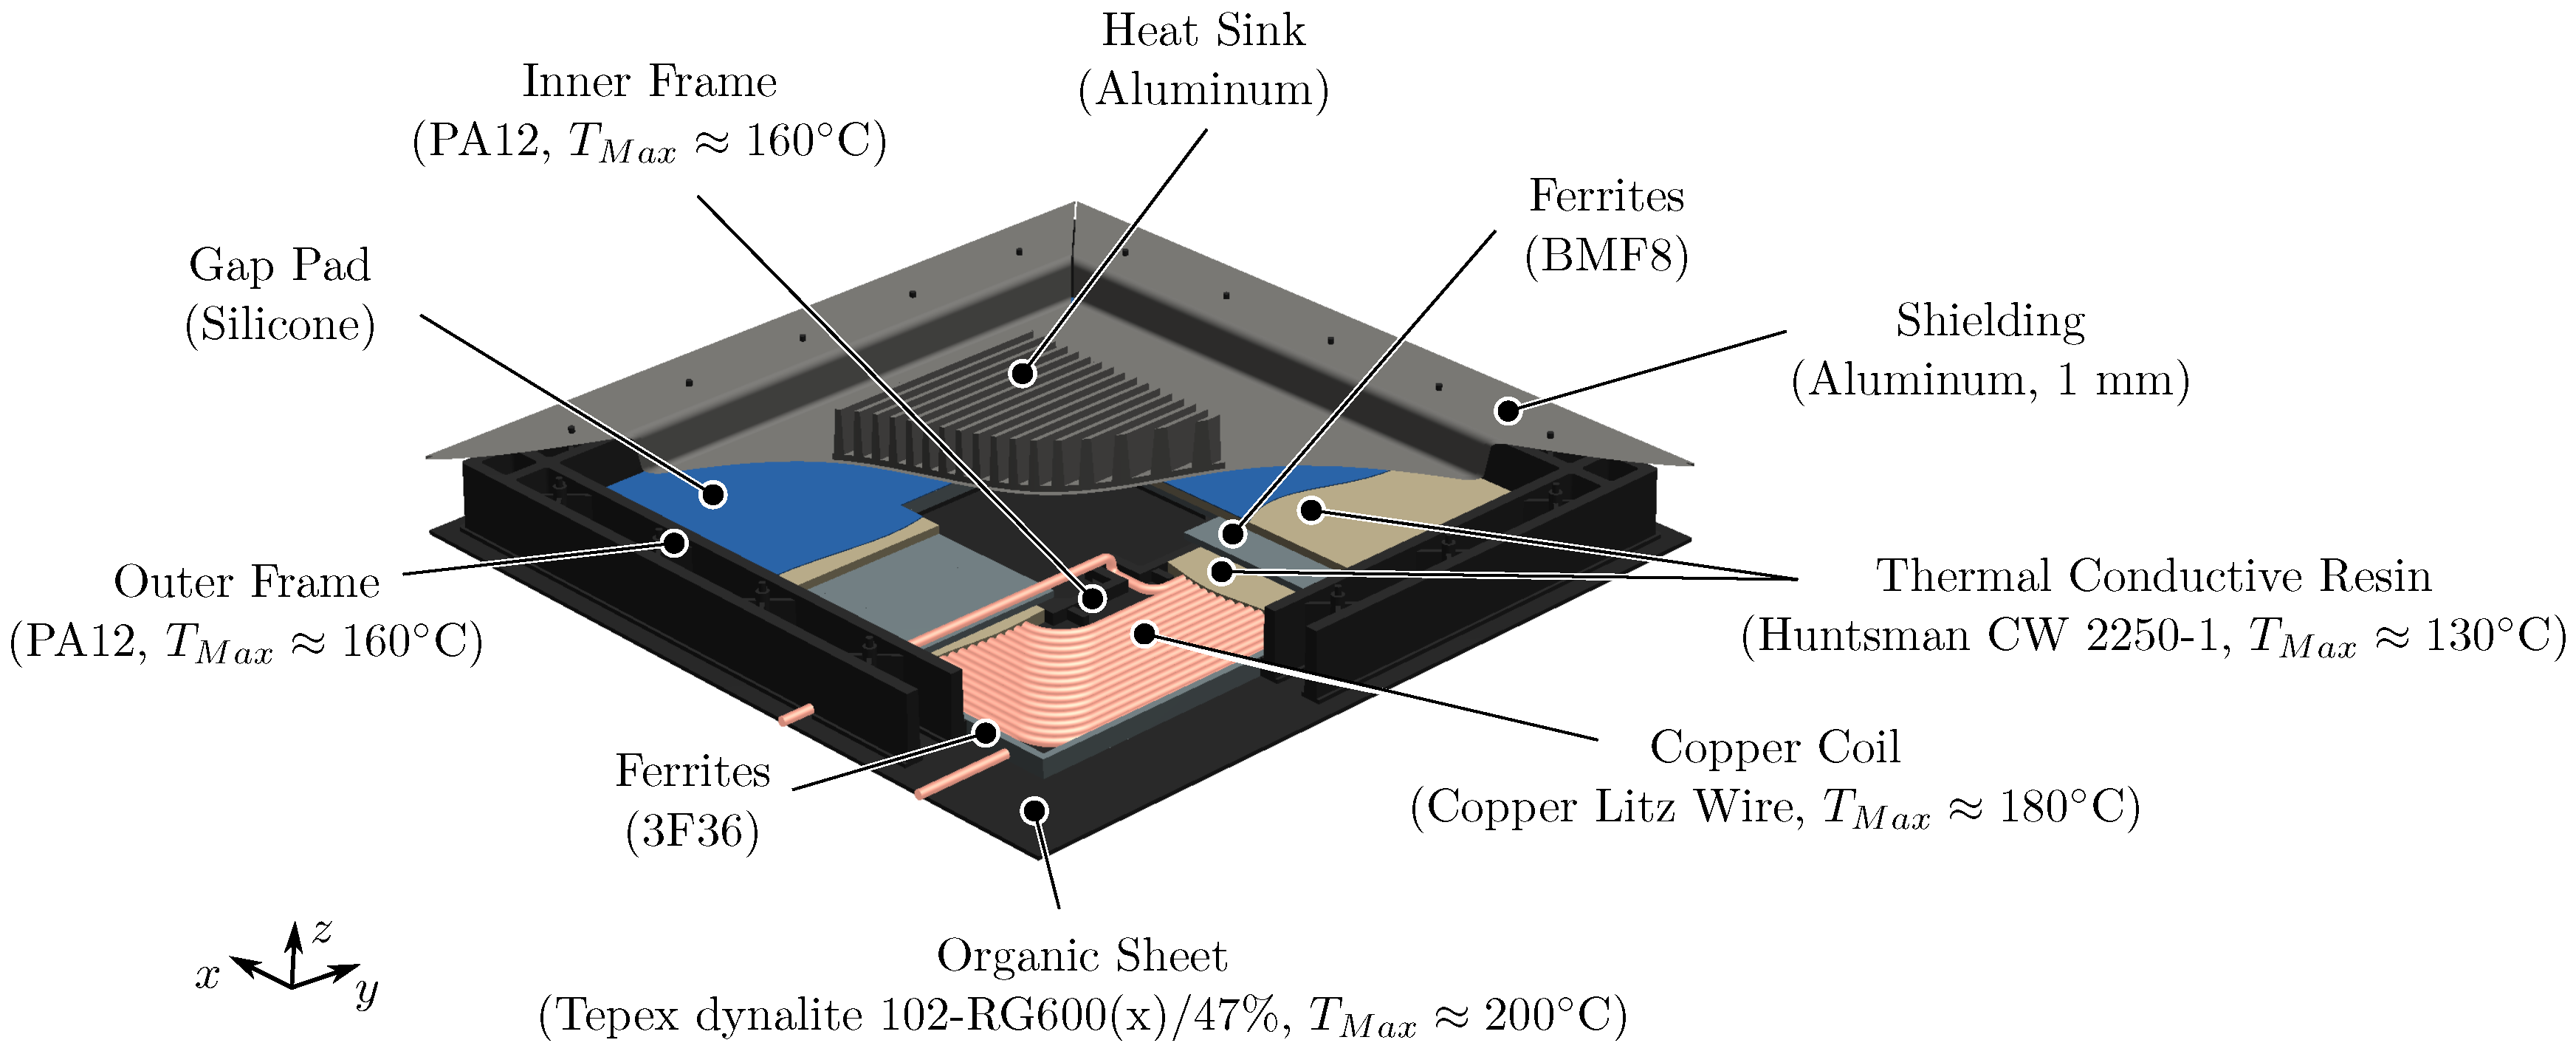
The space–frame concept is based on local ribs providing the stiffness required to protect the active components. The ribs are made of PA12 manufactured by 3D printing. They are glued with Betaforce 2850 [33] to an organic sheet [32], which is used for the simulation of the underbody cover. The active components are located inside the space–frame. To arrange coil and lateral ferrites, an additional frame made of PA12 on the inside is glued to the organic sheet. Analogous to the sandwich concept, the use of thermal conductive resin improves the thermal bonding between coil and ferrites. Equally, the passive aluminum shielding is also glued to the top of the outer frame. To reduce manufacturing costs, the shielding is assembled by four identical bent sheet metal parts. Accordingly, the shielding has gaps at the corners. To improve the thermal transfer between the area of active components and shielding, thermal gap filler pads [34] (145 mm × 145 mm × 0.5 mm) are used. Additionally, aluminum heat sinks [36] are glued to the shielding using ACC Silicones SILCOTHERM [35]. The total z-dimension measures 38 mm with a weight of 7.8 kg. The proposed space–frame concept including the maximum temperature ratings of the components is illustrated in Figure 6.

4. Thermal Model

The thermal management of WPTS featuring high area-related power density is a major challenge [19,27]. The simulative evaluation of the thermal management of WPTS requires an electrically and thermally coupled analysis [19,27]. Since a coupled electromagnetic–thermal simulation is a time-intensive and complex procedure, a simplified thermal model is derived using analytical calculations to estimate the power losses. The presented procedure follows the works of [19,37,38]. These approaches are extended taking into account the temperature dependency of the losses.

4.1. Calculation of Power Losses

The total power loss P loss ( T ) results from the sum of the individual losses considering coil losses P coil ( T ) , core losses of ferrites P core ( T ) and eddy current losses of the shielding P eddy ( T )
P loss ( T ) = P coil ( T ) + P core ( T ) + P eddy ( T ) .

4.1.1. Coil Losses

The total coil losses P coil ( T ) are defined by the sum of the individual losses due to skin effect P skin ( T ) and proximity effect P prox ( T ) :
P coil ( T ) = P skin ( T ) + P prox ( T ) .
Neglecting edge effects and contacting, an analytical two-dimensional model is sufficient to determine coil losses [16]. As given in [38], the ohmic losses including losses caused by skin effect are calculated by
P skin ( T ) = N · F skin ( f ) · R DC ( T ) · I ^ N 2 · l litz ,
R DC ( T ) = ρ litz ( T ) l litz N A str = 4 ρ litz ( T ) l litz π N d str 2 ,
ρ litz ( T ) = ρ litz , 20 1 + α litz , 20 Δ T ,
where N describes the number of strands in the litz wire, R DC ( T ) is the temperature dependent resistance per unit length of a single strand of the litz wire, I ^ is the current peak value, l litz is the total length of litz wire and F skin ( f ) is a frequency-dependent factor modeling the skin effect [38]. The temperature dependent resistance R DC ( T ) is calculated taking into account the cross sectional area of a single strand of litz wire A str and the temperature-dependent specific resistance of the litz wire material ρ litz ( T ) , where ρ litz , 20 describes the specific resistance of the litz wire material at 20 °C and α litz , 20 considers a specific temperature coefficient of the litz material at 20 °C.
The coil losses P prox ( T ) are subdivided into internal losses P prox , int ( T ) and external losses P prox , ext ( T ) . Internal losses P prox , int ( T ) describe losses due to adjacent strands depending on number and diameter of strands. As given in [38], external losses P prox , ext ( T ) are caused by external magnetic fields
P prox ( T ) = P prox , int ( T ) + P prox , ext ( T ) ,
P prox ( T ) = N · G prox ( f ) · R DC ( T ) · ( I ^ 2 2 π 2 d litz 2 P prox , int + H ext 2 d d litz 2 P prox , ext ) .
The variable d litz is the outer diameter of the litz wire and G prox ( f ) denotes a frequency dependent factor that models the proximity effect [38]. However, knowledge about the external field H ext is required to calculate the external losses P prox , ext . To calculate the external field H ext , an analytical approach is presented in [16], which is based on a simpliefed two-dimensional model.
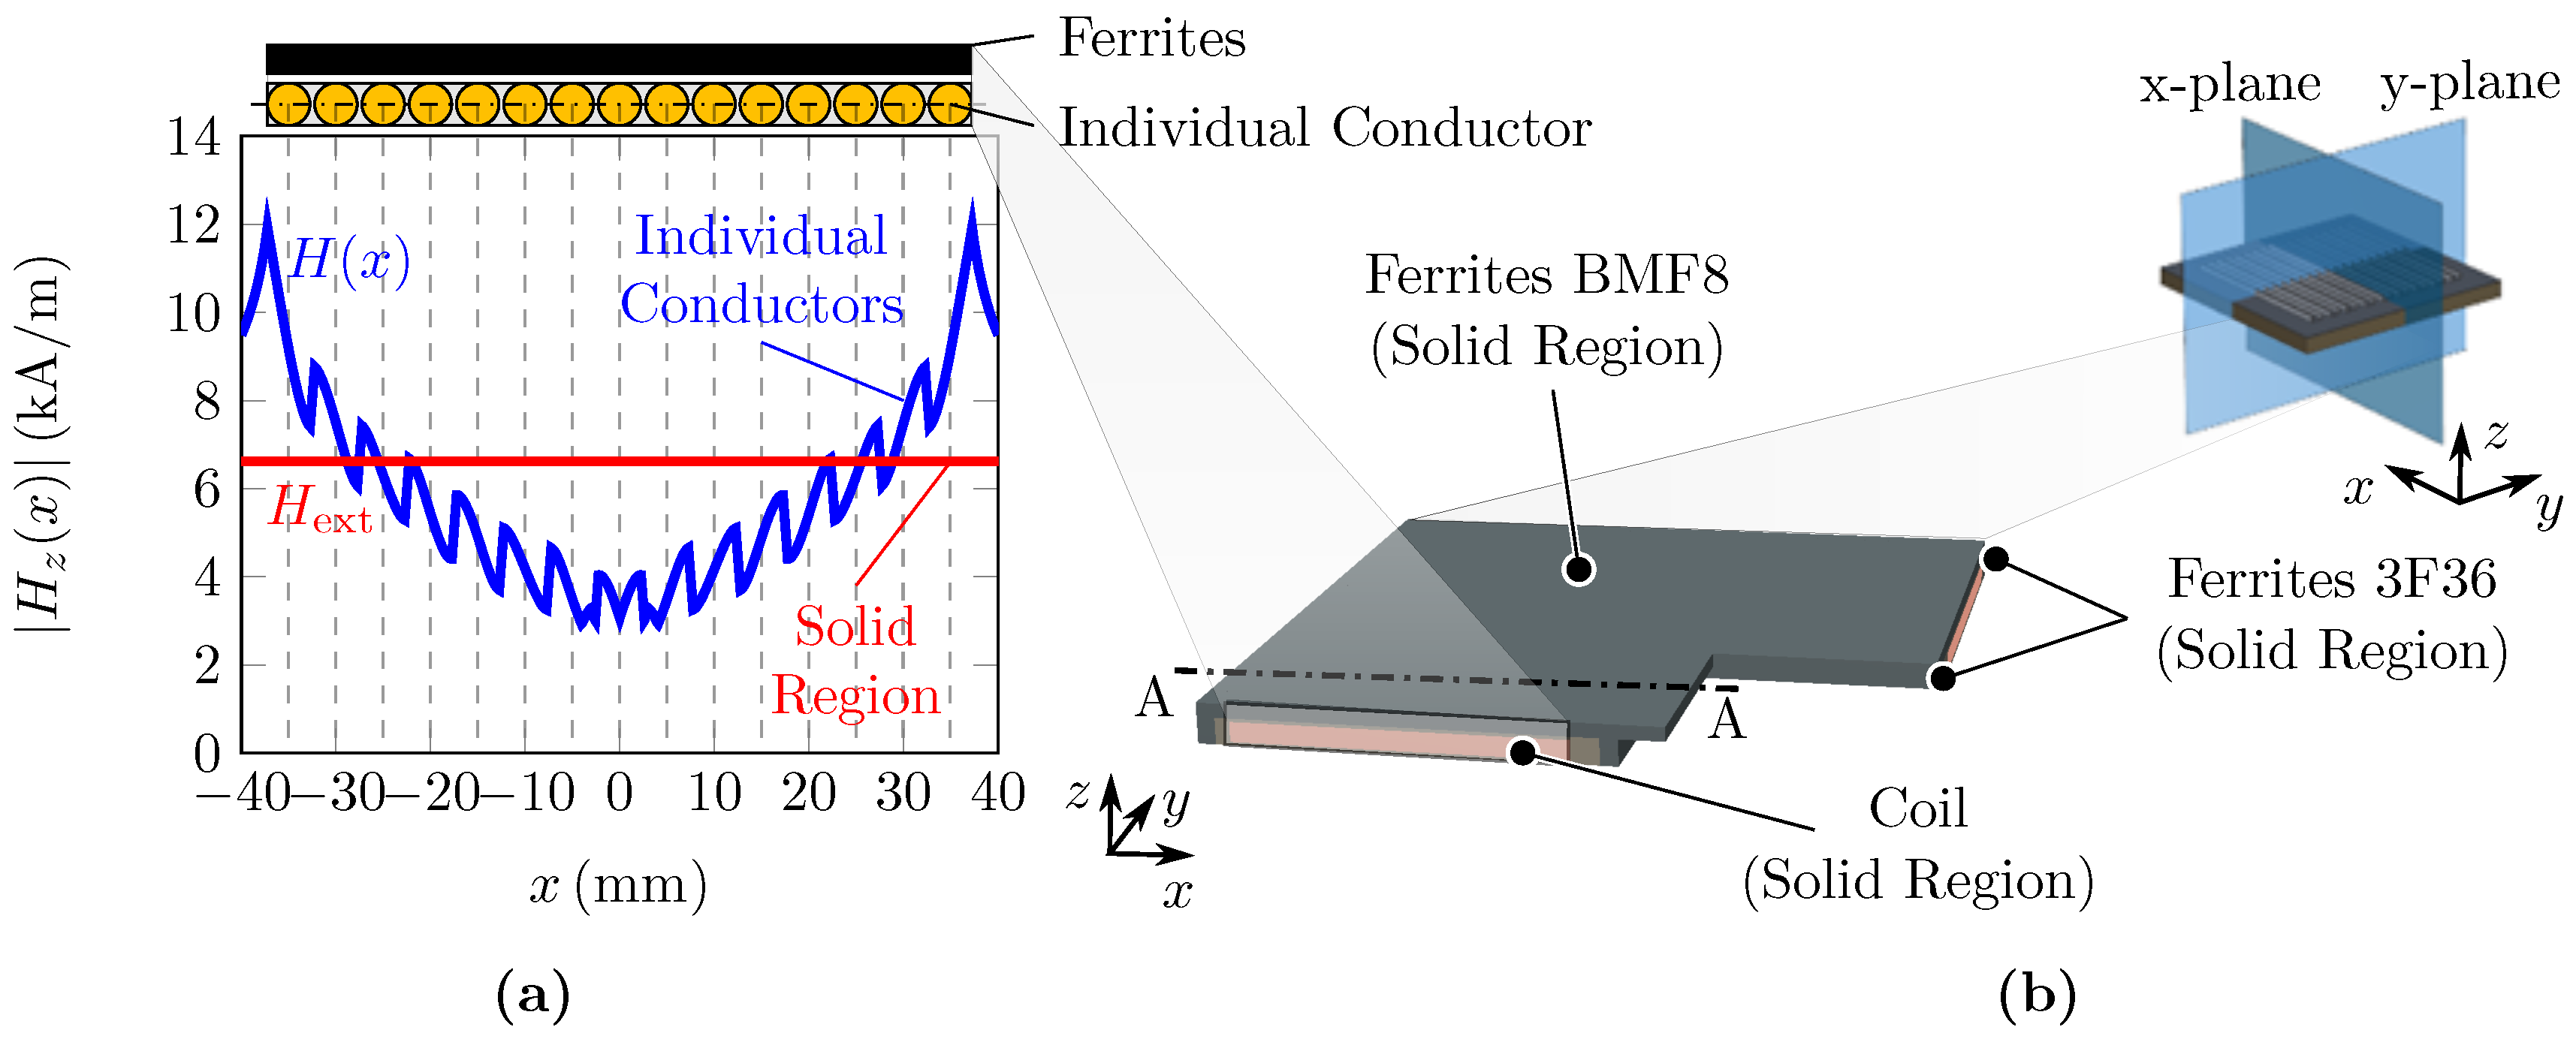
As the resulting magnetic field is the superposition of the single magnetic fields of each current carrying conductor, the external magnetic field is not constant across the winding space. Therefore, the external magnetic field H ( x ) is calculated individually at the center of each turn considering the assumptions given in [16]. As given in [16], the z-component of the magnetic field of a turn at the position x = x i is calculated by
H z ( x , x i ) = I ^ ( x x i ) π 2 d litz 2 | ( x x i ) |   < d litz 2 I ^ 2 π ( x x i ) otherwise .
To take the influence of the ferrites into account, the mirroring method [39] is applied. This method mirrors the entire coil symmetrically to the plane spanned by the ferrites. Thus, the magnetic field of the mirrored coil is superimposed with the magnetic field of the original coil.
Using the parameters given in Table 3, the external magnetic field of each conductor is calculated as given in Figure 7a considering the coil and the ferrites covering the coil as shown in Figure 7b. The influence of the lateral ferrites 3F36 is neglected, because the superimposed magnetic field is analytically very difficult to calculate and its impact is expected to be small in comparison. The magnitude of the external magnetic field H ext is derived from the mean value of H z ( x ) above the cross-sectional area. In the proposed model, the mean value H ext = 6.62 kA / m is taken as representative of all turns.
Based on the calculation of H ext , the temperature depending coil losses P coil ( T ) are determined taking into account the parameters given in Table 3. Applied to the coil volume, the results of the temperature-dependent power density p coil ( T ) shown in Figure 8a are achieved.

4.1.2. Core Losses

As given in [37], the core losses P core are calculated according to the Steinmetz equation resulting in the temperature-dependent power density p core ( T )
p core ( T ) = C m · f x · B max y · C t 2 T 2 C t 1 T + C t · 10 3 .
The dimensionless coefficients ( C m , x, y, C t , C t 1 , C t 2 ) are values determined by the manufacturers, which are often not provided and need to be approximated out of the given manufacturer data. In this case, the core losses needs to be taken from the data sheet. Considering the exemplary WPTS of Figure 4, the coefficients of the material PLT32/20/3.2/R-3F36 are known resulting in
p 3 F 36 ( T ) = 6.83 · f 1.44 · B max 3.27 · 8.4 · 10 5 T 2 0.011 T + 1.23 · 10 3 ,
which is visualized in Figure 8b assuming a peak value of magnetic flux density B max = 200 mT , which is derived from a magnetic simulation. The power density p BMF 8 ( T ) of the BMF8 ferrite material given in Figure 8b is taken from the data sheet [28].

4.1.3. Eddy Current Losses

Electromagnetic shieldings are made of non-magnetic, conductive materials to protect the components from magnetic fields. However, alternating electromagnetic fields cause the induction of eddy currents in the material. Those eddy currents result in losses P eddy ( T ) , which can calculated by
P eddy ( T ) = I eddy 2 · R eddy ( T ) ,
where I eddy is the induced eddy current and R eddy ( T ) is the temperature dependent eddy current resistance of the shielding material [19]. However, the calculation of the induced eddy current I eddy requires a highly complex three-dimensional electromagnetic model. Besides, the experimental setup has a strong impact on the magnitude of eddy current losses. Therefore, these losses were determined experimentally. Using the experimental setup of the component level testing presented in Section 5, the input power required for the 11 kW operating point with and without shielding of the proposed concepts were measured. The total eddy current power loss density p eddy ( t ) are calculated by the difference of these values. Thus, only time-dependent eddy current losses are available. Figure 8c shows the time-dependent power density p eddy ( t ) . Required data of eddy current losses exceeding 60 min are assumed to be constant equal to the average eddy current losses within 60 min.

4.2. Thermal Simulation Model

Using the material parameters in Table 4, a transient 3D finite element (FE) thermal simulation using NX 12.0 Thermal/Flow is executed. The volume-related power loss densities in Figure 8 serve as thermal loads on the coil, the ferrites and the shielding. These thermal loads are uniformly distributed over the volume of the respective component.
The thermal simulation model takes advantage of axial symmetry by only simulating a quarter model as shown in Figure 7b. The copper windings of the litz wires are modeled as solid copper region, which is a common simplification for transformers [19]. The material properties of this region, a composite of copper windings and resin, are determined proportionally according to the mixing rules from [41]. The volume of the coil windings in the total volume of the soild region is 71%. Similarly, the ferrites are simplified as a solid region.
First, the system is simulated as a free convection model to derive and compare its inherent thermal behavior. The heat transfer coefficient α is assumed to 10 W/m2 K according to [42]. Second, forced convection is applied adjusting heat transfer coefficient α to 25 W/m2 K taken from [43]. Analogous to literature, heat transfer by heat radiation is neglected [19,44]. The used material parameters of the thermal model are summarized in Table 4.

5. Experimental Setups

The multi-part assembly of the proposed concepts leads to challenges in the thermal management. Especially, the thermal conductive resin with a maximum operating temperature of 130 °C might be critical. Since the resin embeds the active components of both proposed concepts, we set a temperature limit T Max = 130   ° C for the sandwich and space–frame concept. Consequently, the maximum operating temperatures of the active components shall not exceed the definied temperature limit.
To validate the thermal management of the proposed concepts experimentally, the individual component temperatures are measured. The experimental analysis is divided into two sections. First, the thermal measurement of the CPM without interaction of the GPM is examined on component level. Second, the performance of the complete magnetic circuit considering CPM and GPM is validated. The testing was executed on a Hardware-in-the-Loop (HiL) test bench for inductive power transfer systems at TU Dresden.

5.1. Component Level Testing

For the experimental validation on component level, thermal measurements are conducted assuming minimum battery voltage. This results in a maximum battery current and thus in a maximum coil current I coil within the CPM. This scenario implies the most challenging case for thermal management inducing a current of approximately I coil 33 A RMS to the receiver coil. Figure 9 shows the experimental setup of the component level testing.
Using the power electronics of the transmitter side and an adapted compensation capacitor, the CPM is excited with the specific harmonic current I coil , which is measured and monitored by a Rogowski Coil of type PEM CWTMini HF06B [49]. To determine the temperature gradient within the cross-section of the CPM, fibre optical thermal sensors [50] were positioned to each active component of CPM. Due to the expected temperature gradient from the inner to the outer coil winding, three sensors were positioned across the cross section of windings. Additionally, sensors are attached to the ferrites covering the coil, the shielding and the foam core. Furthermore, the thermographic camera VarioCAM HD head 600 [51] measures the surface temperature T surf of the CPM. The system is considered without forced-air cooling assuming natural convection.

5.2. System Level Testing

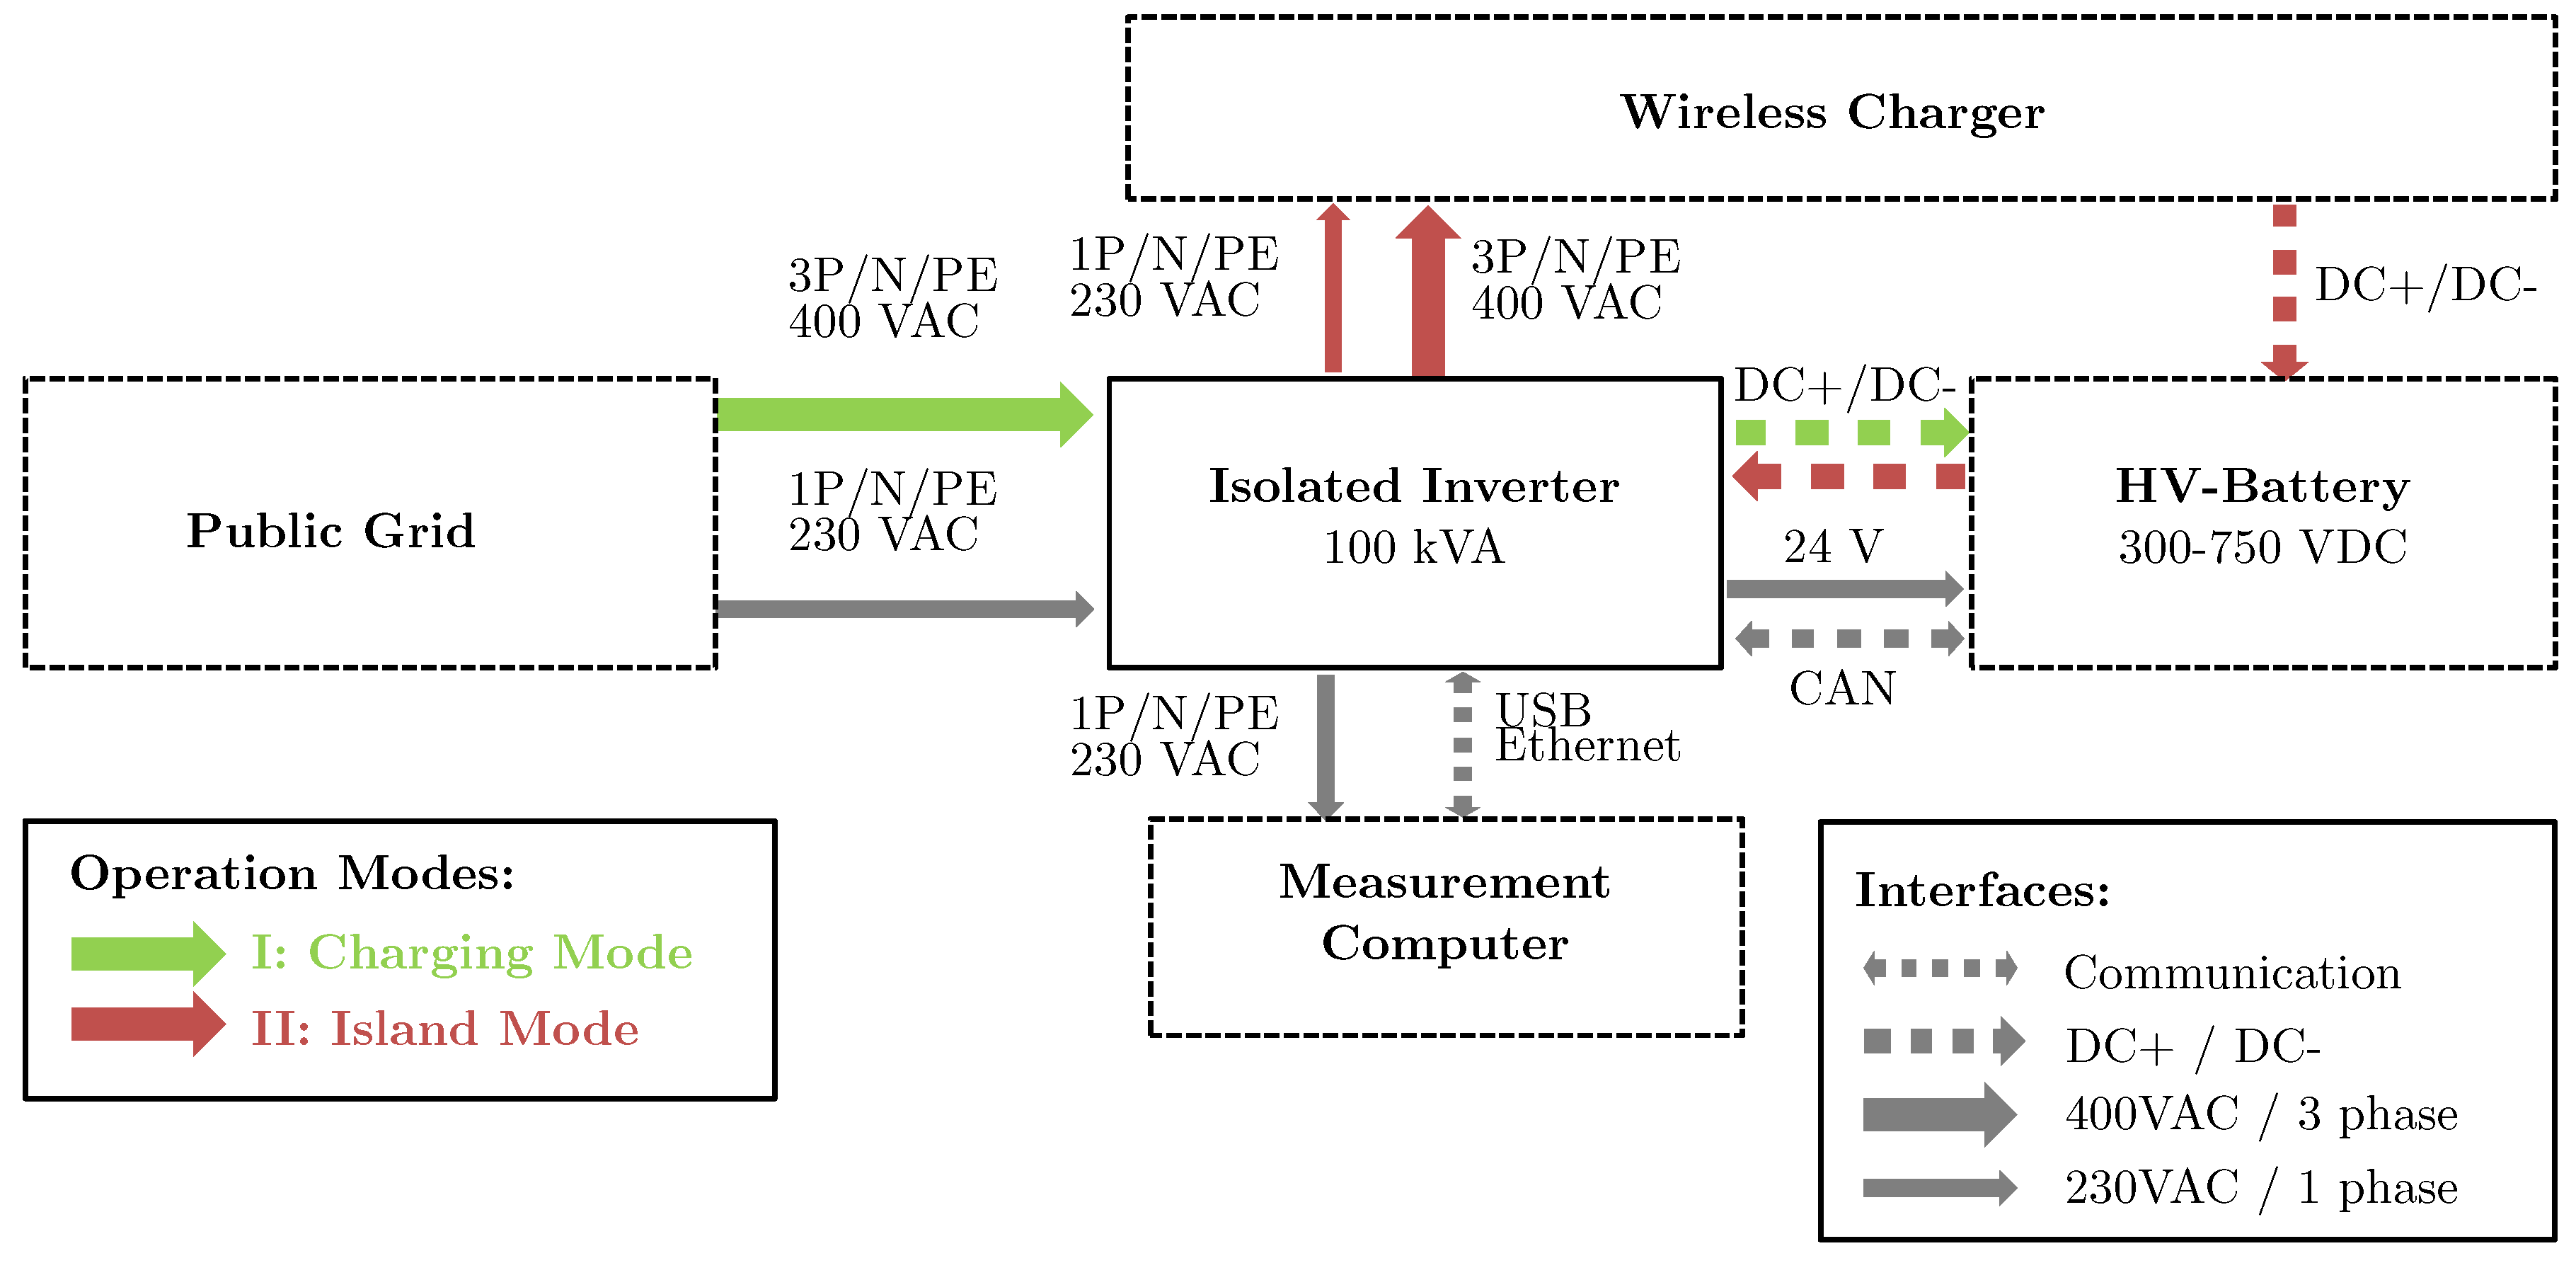
For validation of the component level testing and the thermal simulation model, the system is examined using a Hardware-in-the-Loop (HIL) test bench. According to SAE J2954 [5], the CPM is fixed while the GPM is manually adjustable to examine the system behaviour during three-dimensional positioning. The material of the test stand is completely non-metallic using wood or plastic. An exemplary 400 V battery system, as used in automotive applications, is used as load for the WPTS. This ensures operation and test under realistic electric conditions. To supply the power electronics of the WPTS, an isolated grid inverter provides a 3-phase grid with adjustable output voltage and frequency. In this way, the emulation of different grid types is possible. Furthermore, a save commissioning and testing environment is ensured. The inverter itself is powered from the battery system, which closes the loop. With this setup, illustrated in Figure 10, it is possible to operate either at a constant state of charge for efficiency tests or to perform complete charging cycles. Different measurement equipment for voltage and current measurements allows monitoring the input and output power. Moreover, magnetic field probes can validate field simulations and monitor stray fields.
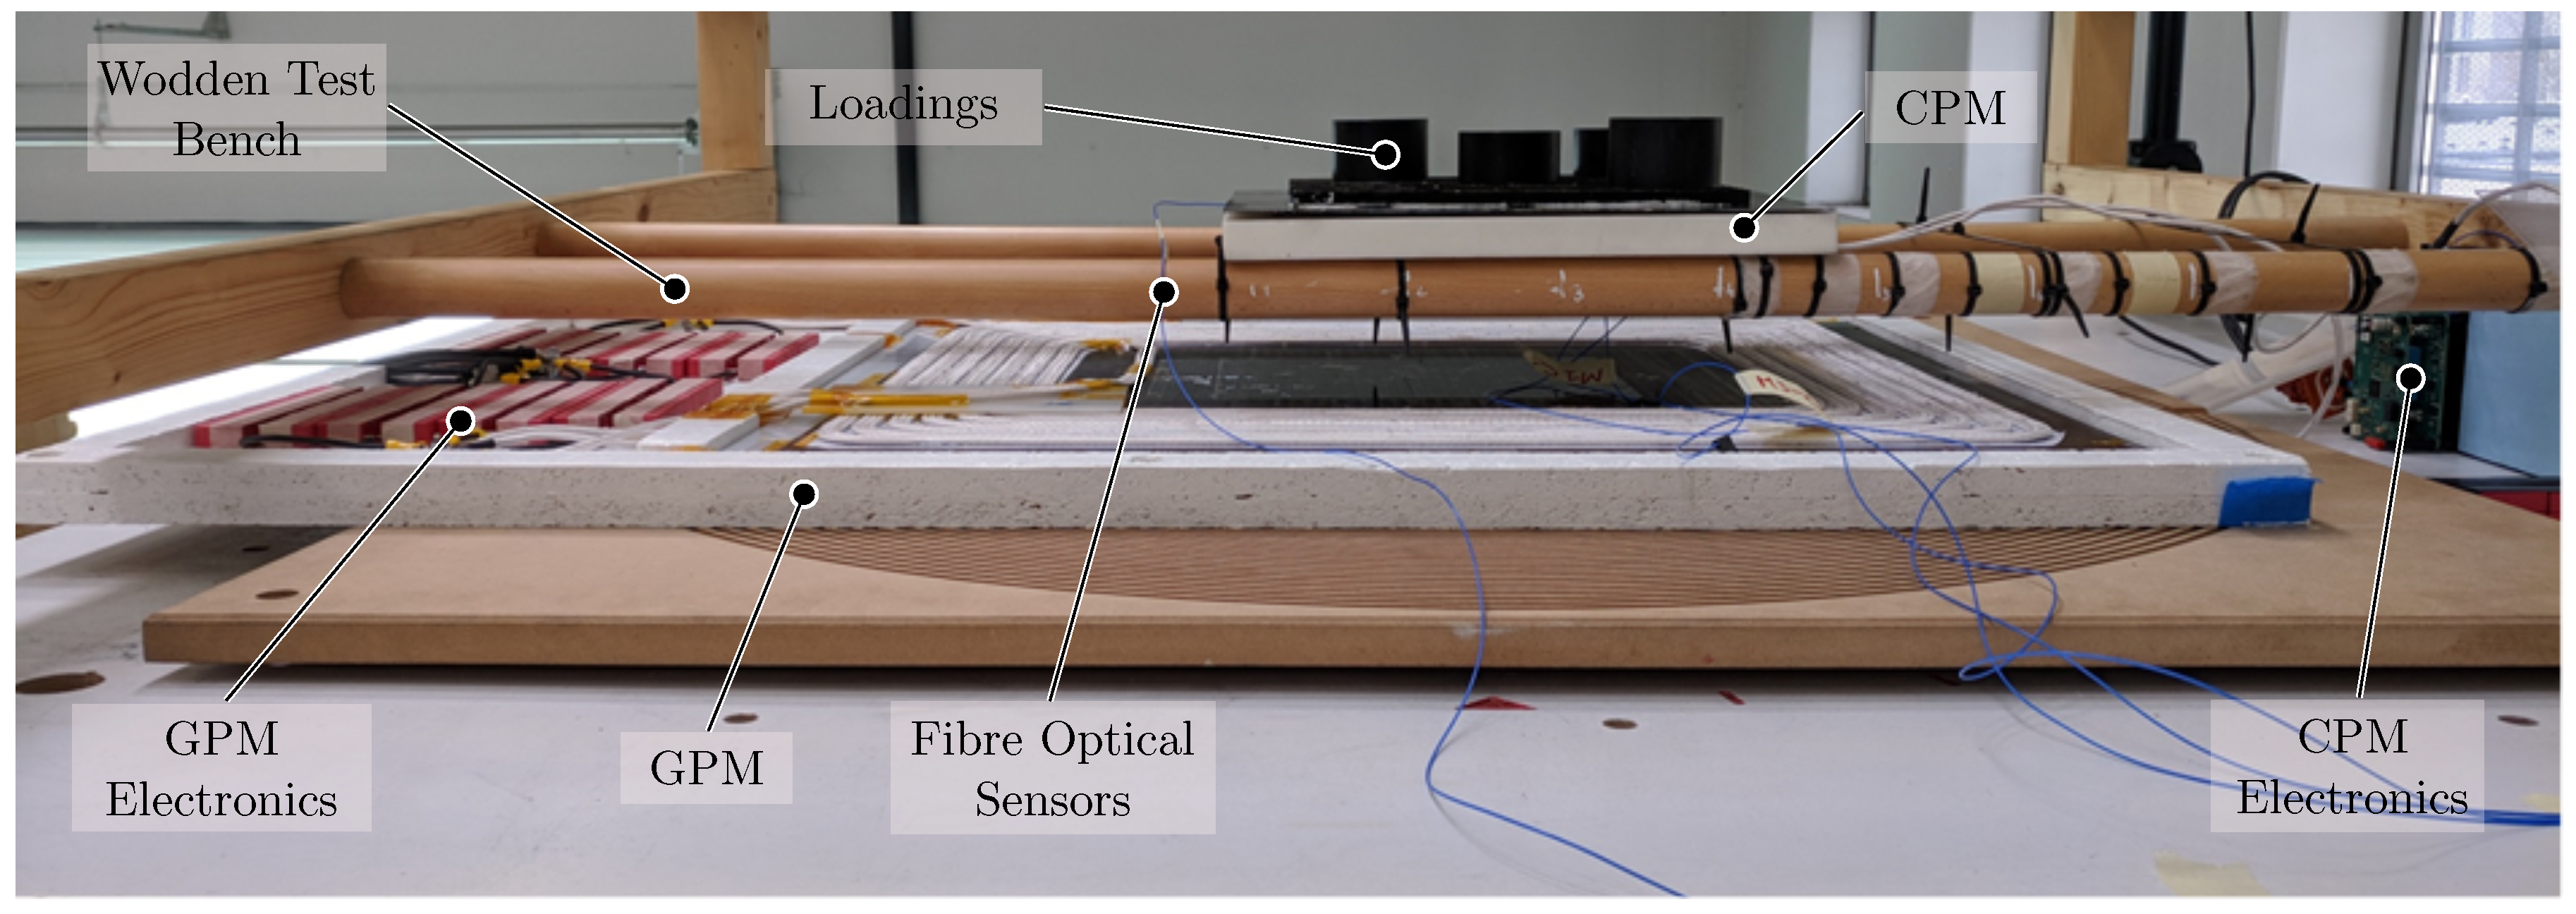
Similar to the component level testing, the temperature of coil and shielding are the most critical regarding thermal management. Thus, these temperatures are measured with fibre optical sensors. To attach the sensors to the coil and to ensure reusability, we used a releasable bond between shielding and foam core or frame. To guarantee a sufficient thermal bonding to the shielding, loadings support the connection, which are shown in Figure 11. In addition, the transmission efficiency according to SAE J2954 [5] is measured at an input power of 11 kW.

6. Results

6.1. Sandwich Concept

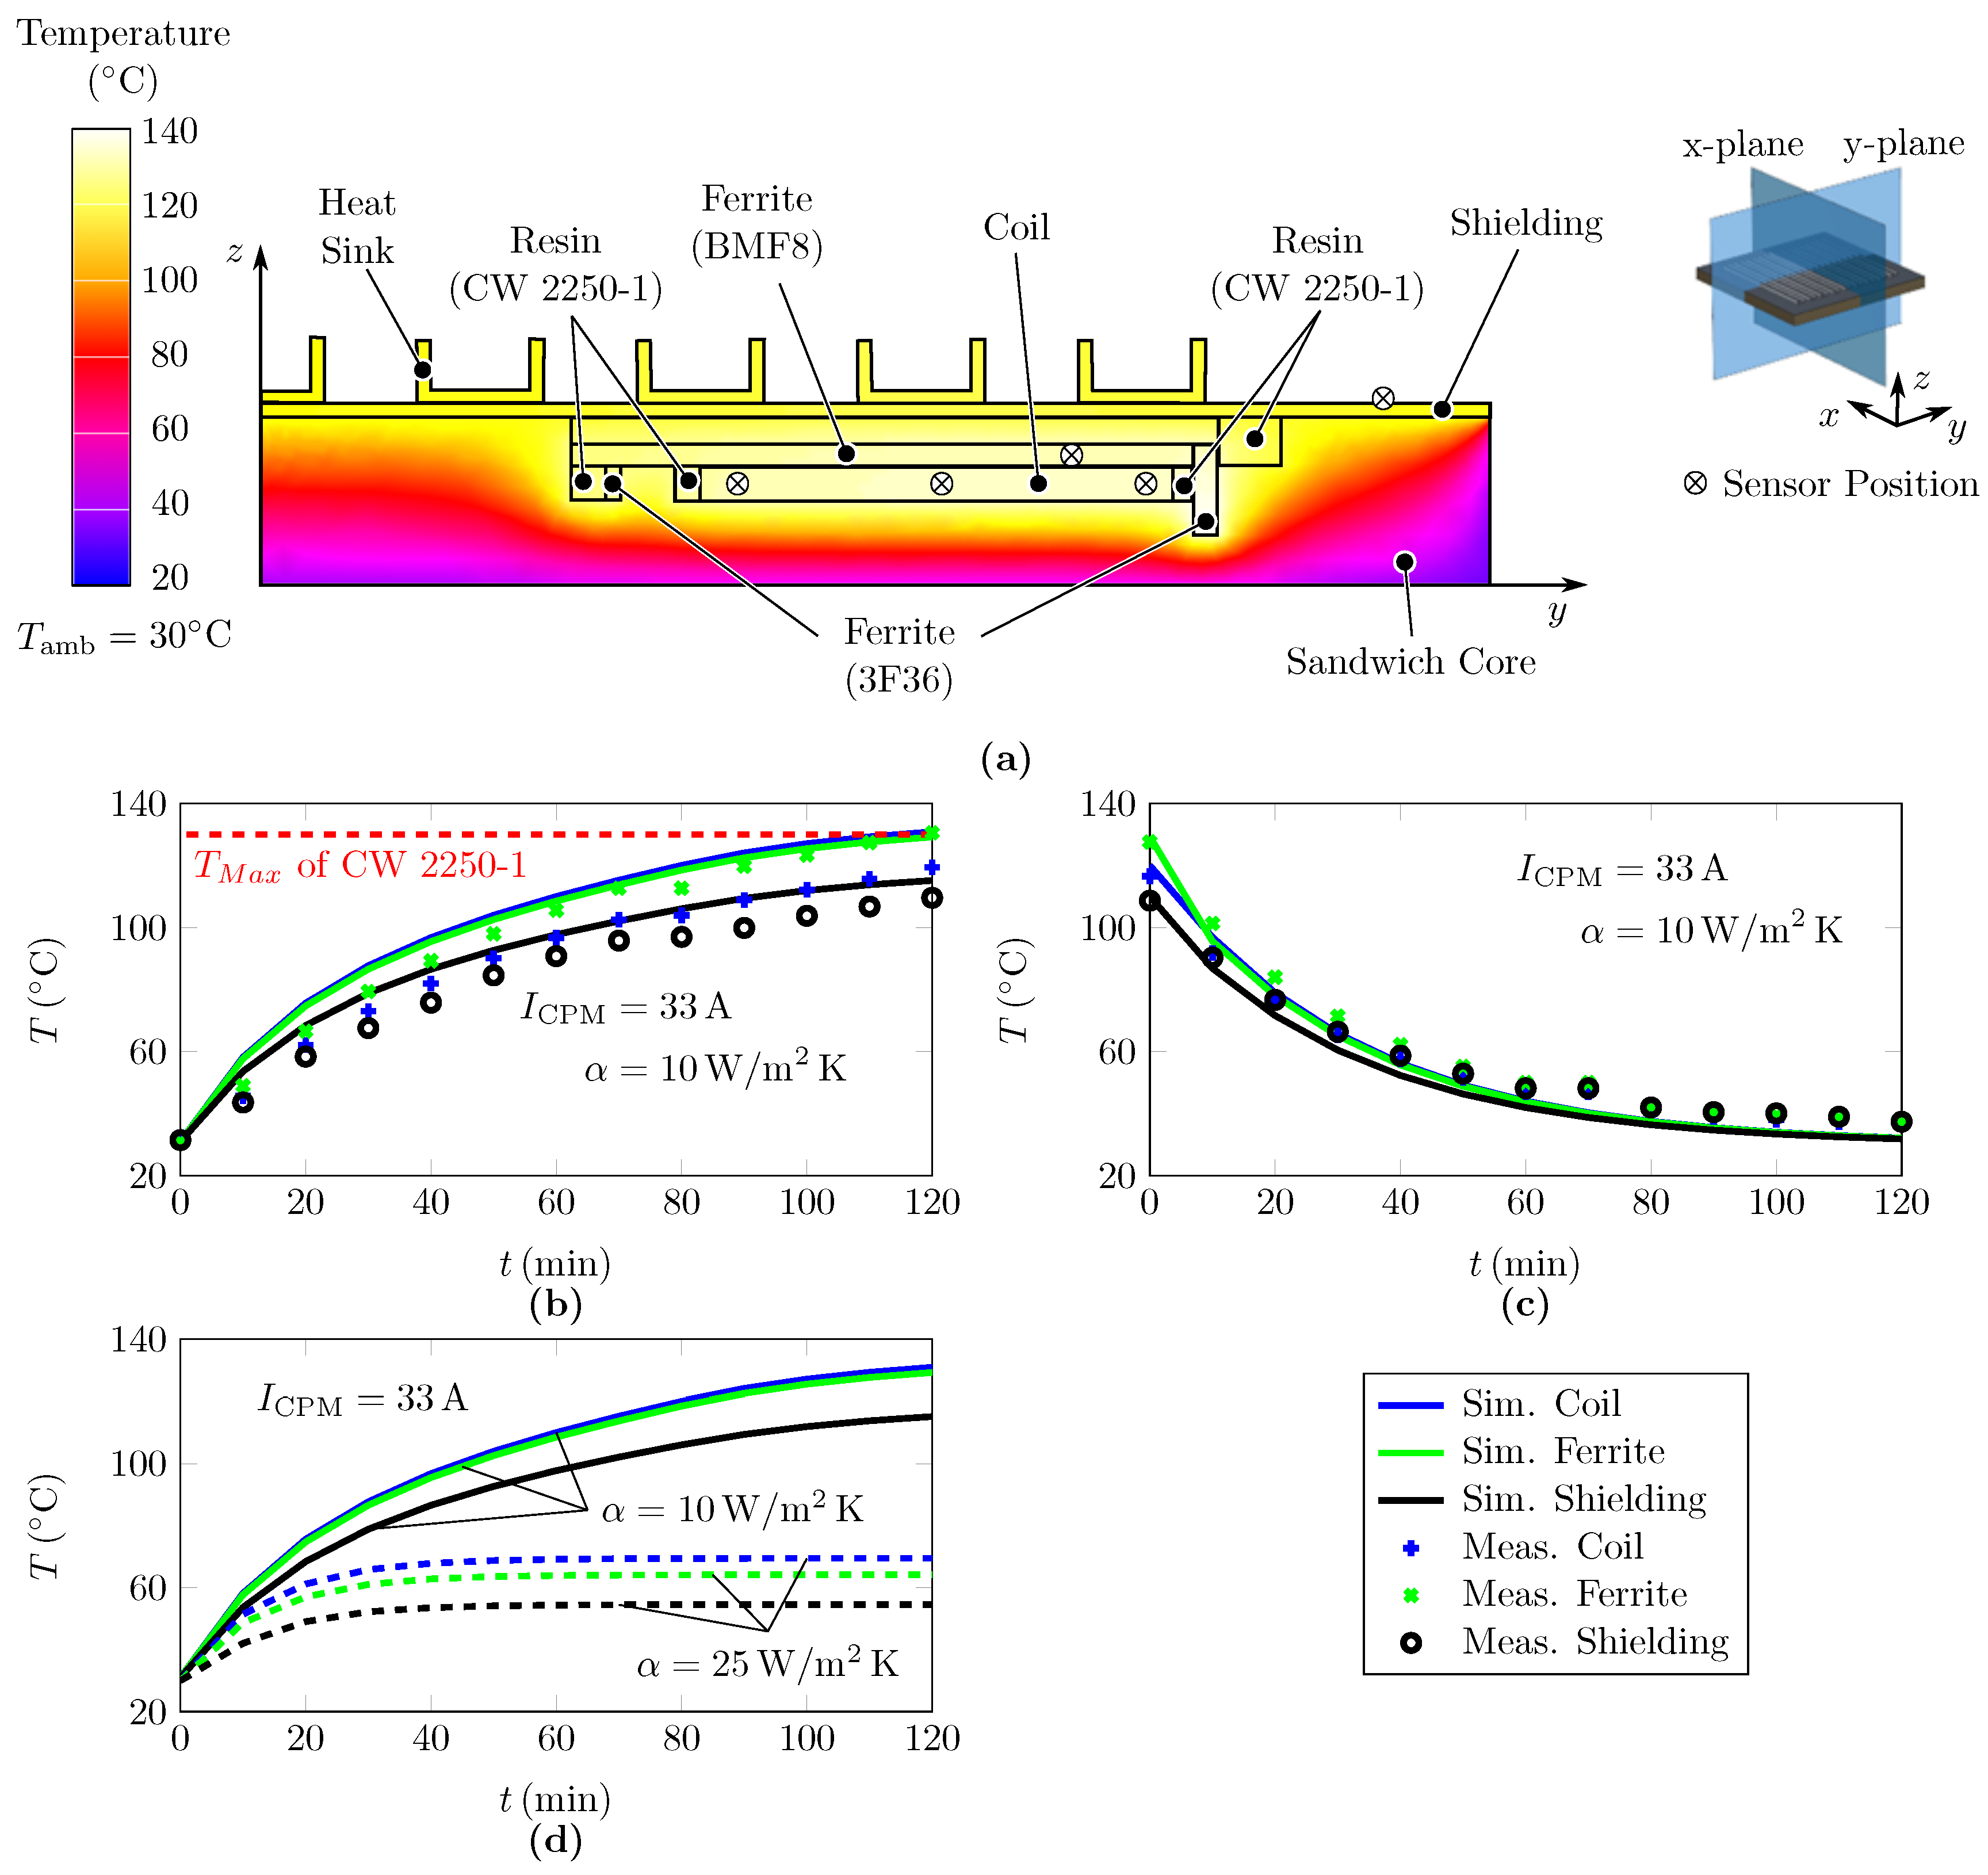
Component level testing:Figure 12 summarizes the results of the thermal investigation of the sandwich concept, taking into account the electric requirements of component level testing ( I CPM = 33 A ) and natural convection. The thermal limit T Max of this concept is reached within a time of 120 min shown in Figure 12b. In this respect, the ferrite temperature T fer = 130.5   ° C exceeds the temperature limit of the used epoxy CW 2250-1 under natural convection. Aside from the coil, the 3F36 ferrites contribute a significant thermal load, wich is shown in Figure 12a. This can be reduced using ferrites more appropriate to the chosen frequency. As expected, the lower thermal conductivity of the foam core impedes the heat transfer to the bottom side of the prototype.
Considering the results of the thermal FE studies presented in Figure 12b, the temperature rise of the ferrites and the shielding are mapped sufficiently accurate with an average deviation of less than 5 K. The measured coil temperature in Figure 12b is determined from the mean value of the three temperatures given by the fibre optical sensors, as a temperature distribution can be represented in the FE model. Therefore, the discrepancy between the average of the measured temperatures of the coil and the simulated values from FE analysis is expected to be higher compared to the ferrites. However, the quantitative behavior of the concept-critical elements is well reproduced. To evaluate the accurancy of the FE model more detailed, we measured and simulated the cool-down of the CPM. The results presented in Figure 12c show a good consistency of the FE analysis with the experimental validation. Thus, the assumed heat transfer coefficient α of 10 W/m2 K is considered to be valid. To evaluate the thermal feasibility of the sandwich concept, a FE analysis with forced convection is applied adjusting the heat transfer coefficient α to 25 W/m2 K. The active cooling results in a significant reduction of the steady-state temperatures shown in Figure 12d. The temperatures of coil and ferrites are not critical regarding the thermal limit of the used thermal conductive resin. Thus, the thermal feasibility of the proposed sandwich concept using active air cooling is considered to be valid.
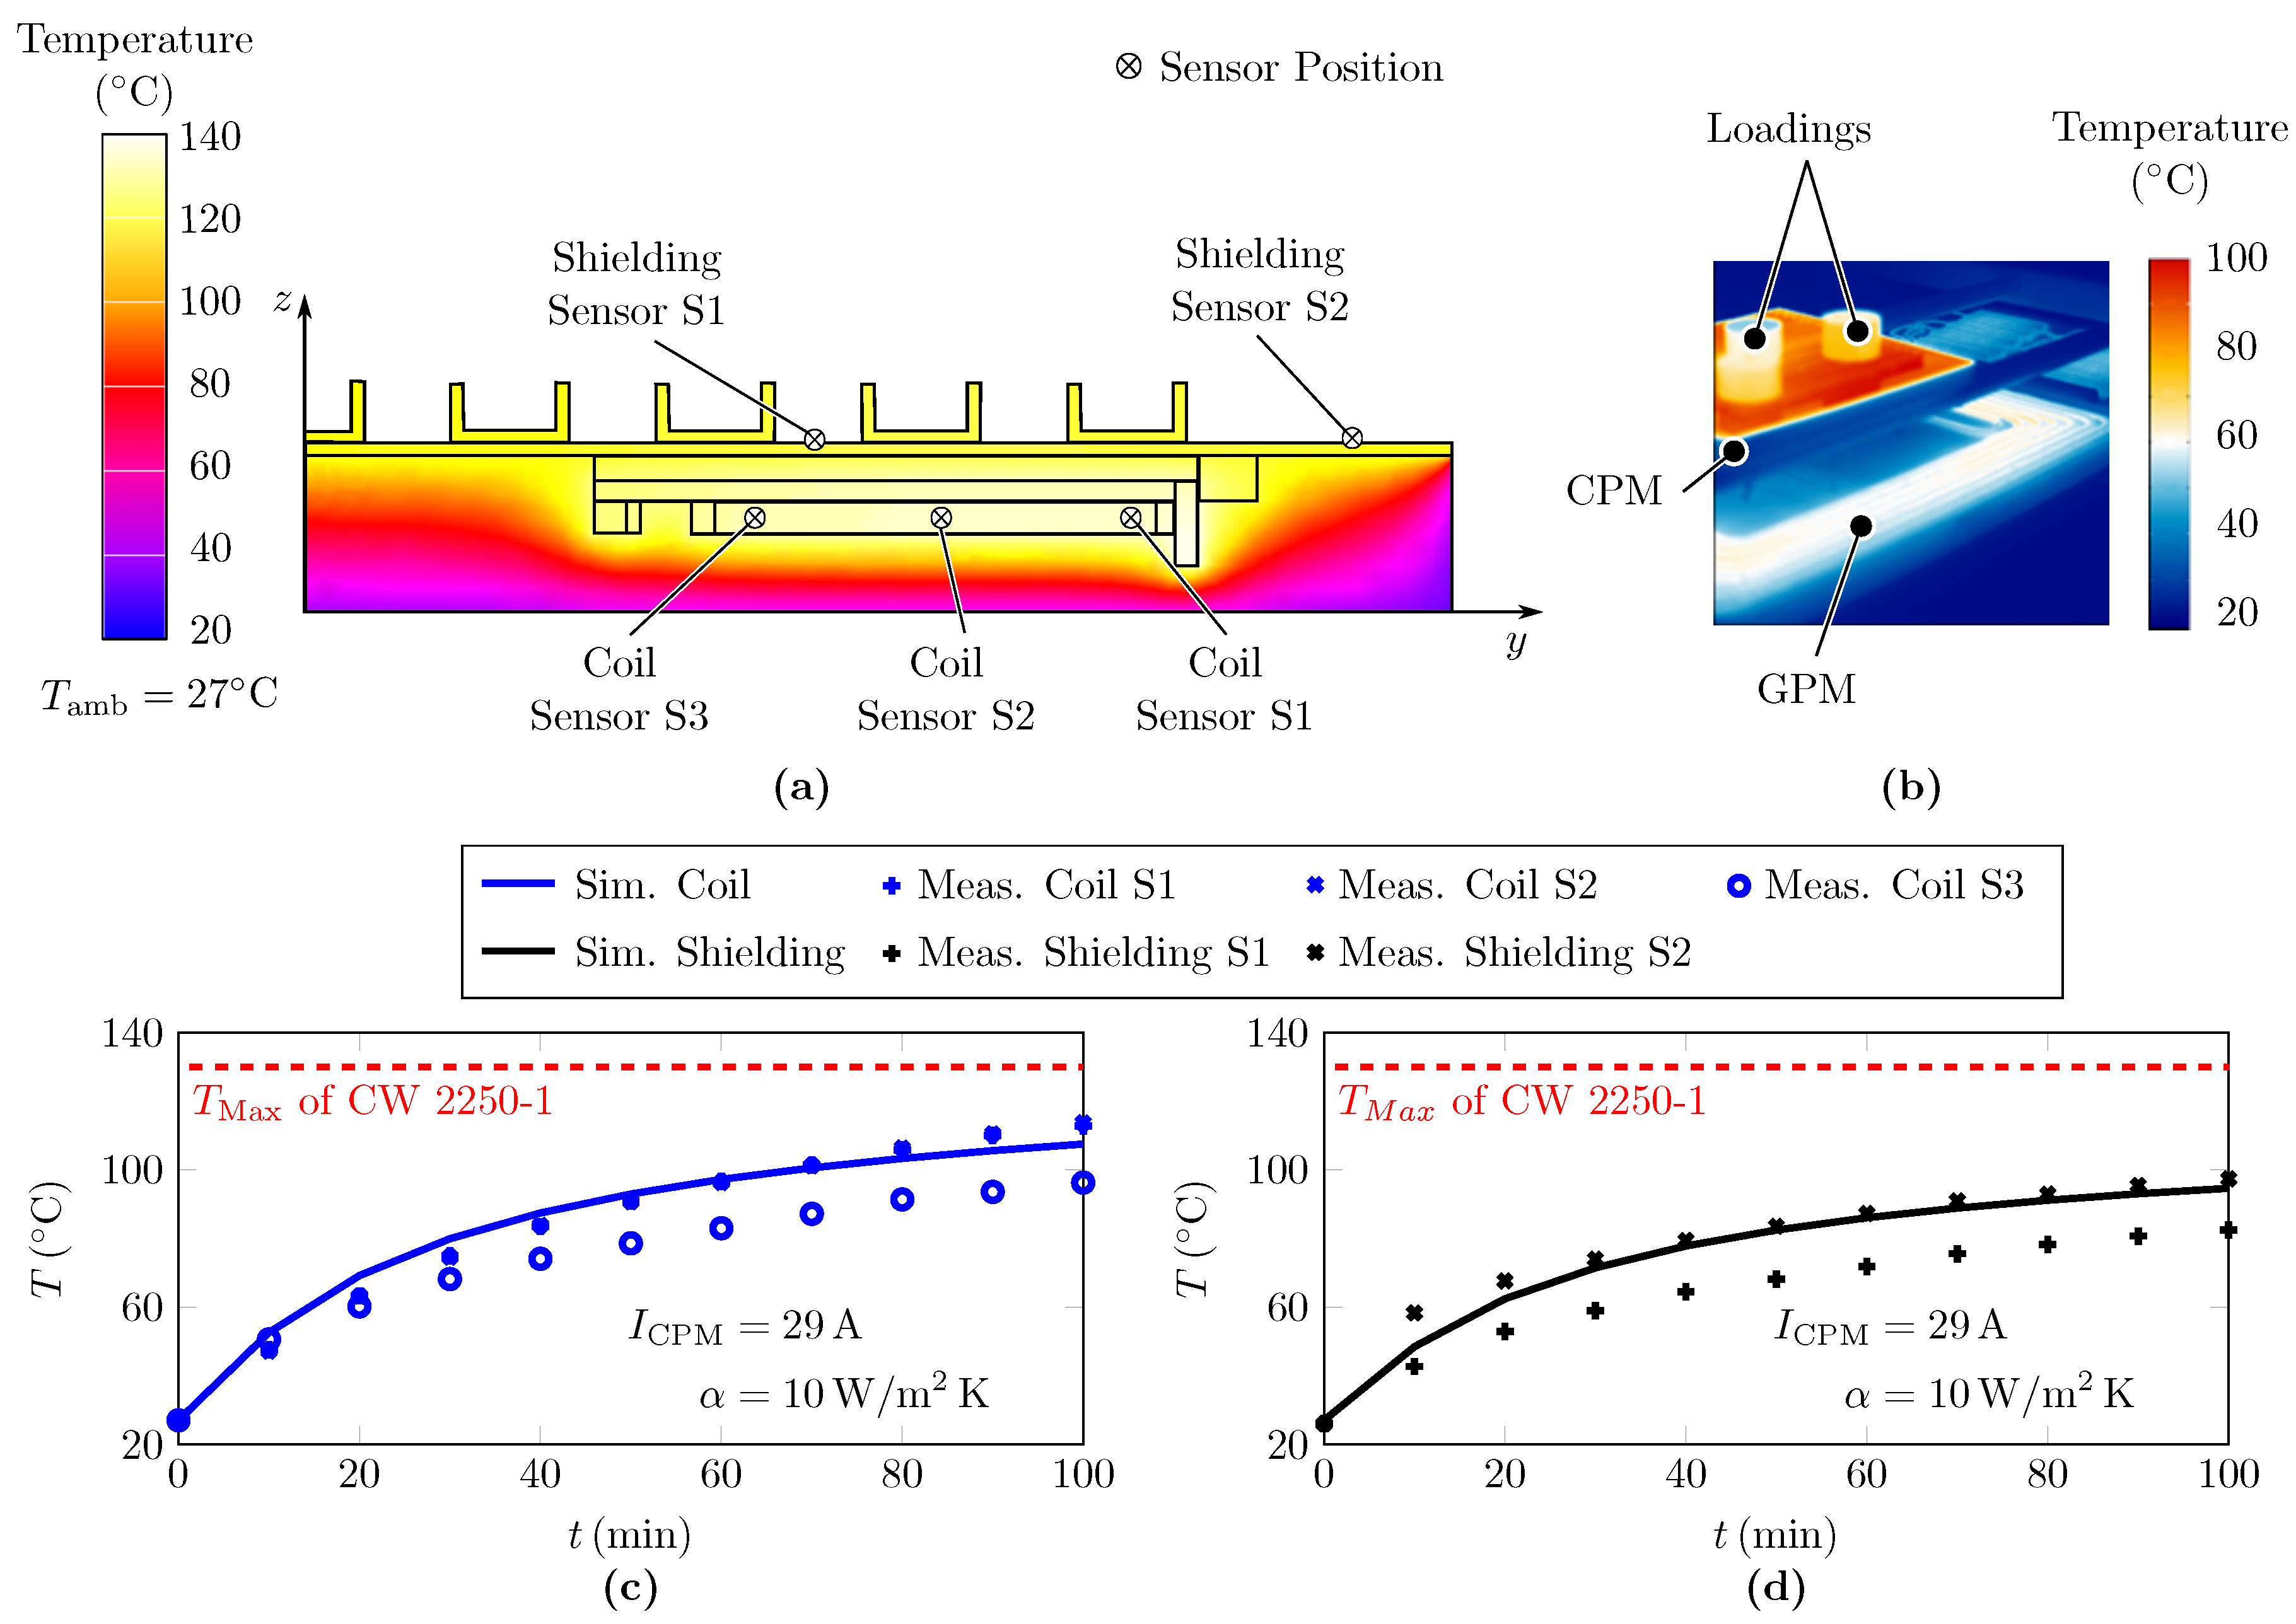
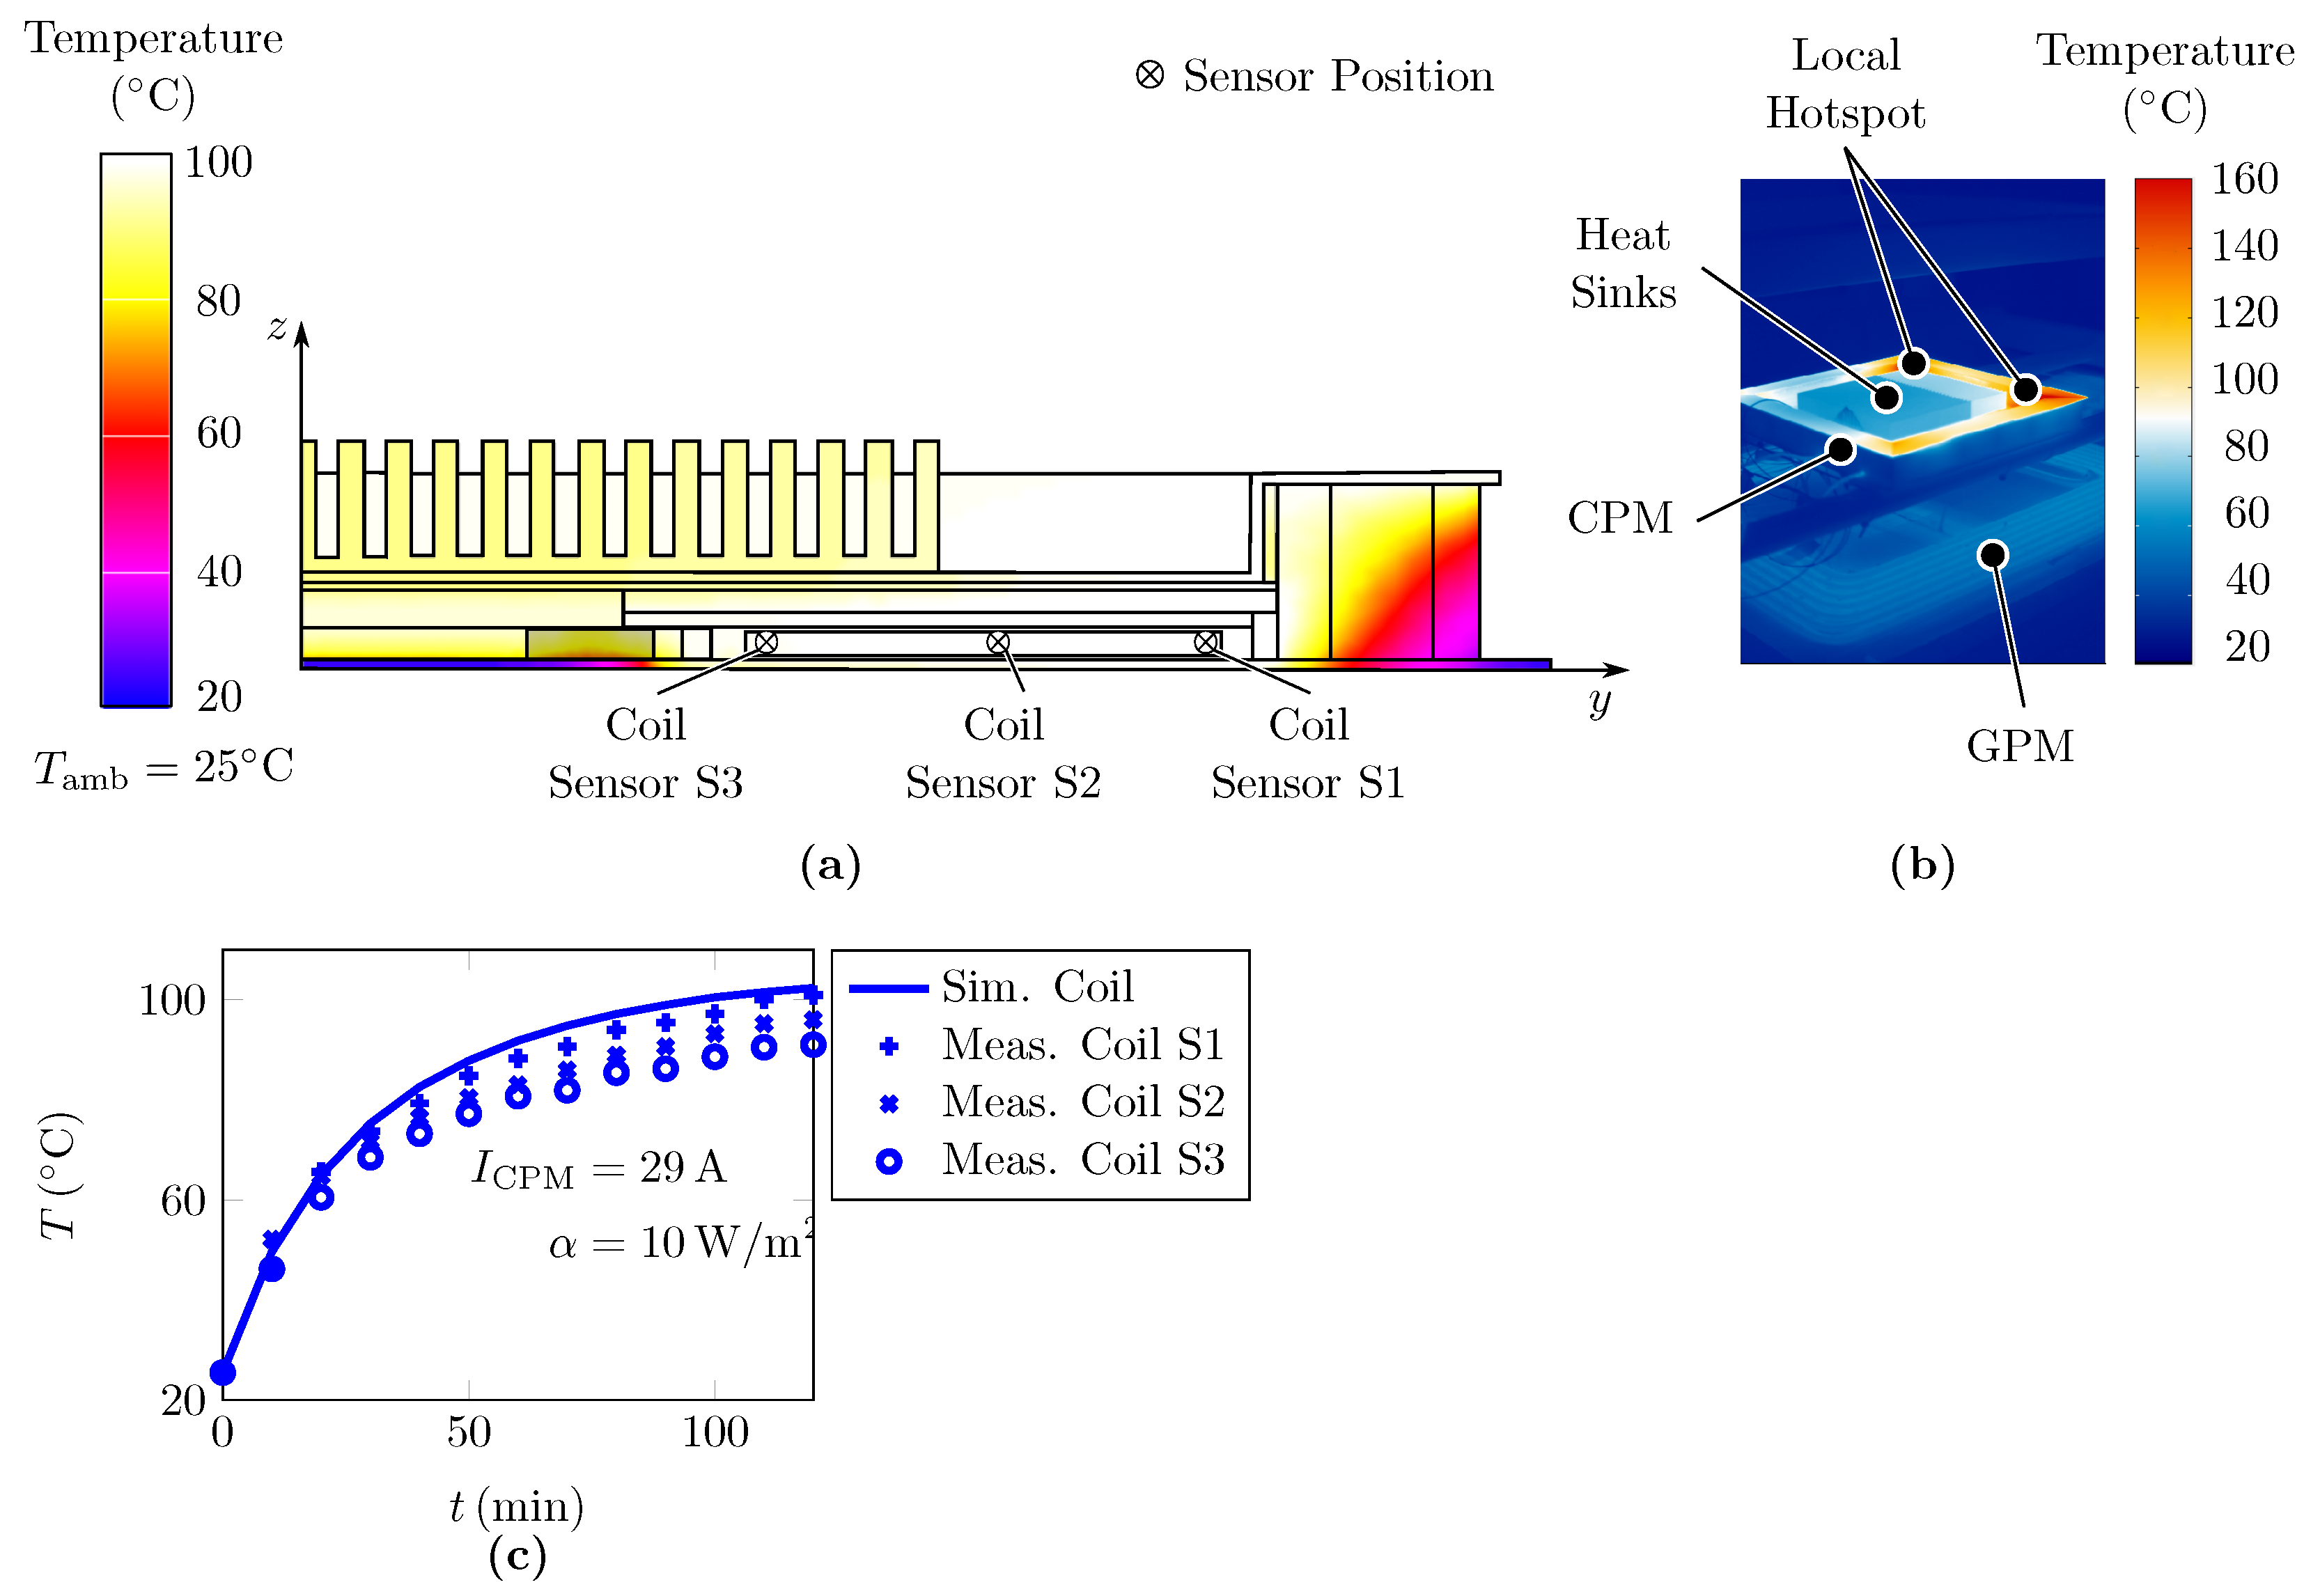
System level testing:Figure 13 summarizes the results of the thermal analysis of the sandwich concept, taking into account natural convection and the electric requirements of system level testing. A slightly higher battery voltage of this setup results in lower CPM current ( I CPM = 29 A RMS ). The results of the coil temperature measurement are presented in Figure 13c. The sensor positions and the results of FE-analysis are shown in Figure 13a. As predicted, the substitute modeling of the coil in the FE model makes the assessment of the temperature gradient across the coil windings impossible. As a result, the temperature rise of the outer windings is mapped accurately, whereas the discrepancy increases towards inner windings. Moreover, compared to the component level testing, this effect might be amplified by the additional losses caused by the magnetic field of the GPM. However, the average accuracy of the proposed FE model is approximately 5 K in the critical coil temperature. The results of the FE analysis and experimental validation of the shielding temperatures are shown in Figure 13d. The simulation result of the shielding temperature is calculated from the mean of the shielding surface. The experimental validation shows a significant temperature gradient towards the center of the shielding surface temperature. Due to uniform distribution of the power losses over the shielding surface in the FE model, this is not reproduced. In this respect, a fully coupled electromagnetic–termal simulation with a highly decrete shielding model might be more accurate. However, the FE model reproduces the measured temperatures of the shielding edge well, which is crucial for thermal management. In this respect, the simulation results in Figure 13a and the thermographic image of Figure 13b show a good consistency. Taking into account the testing specifications of SAE J2954 [5] and the system specifications of Table 1, the DC-DC efficiency of the sandwich concept is measured over the measured period according to Figure 13c at an input power of 11 kW between 88.7% and 91.7%.

6.2. Space-Frame Concept

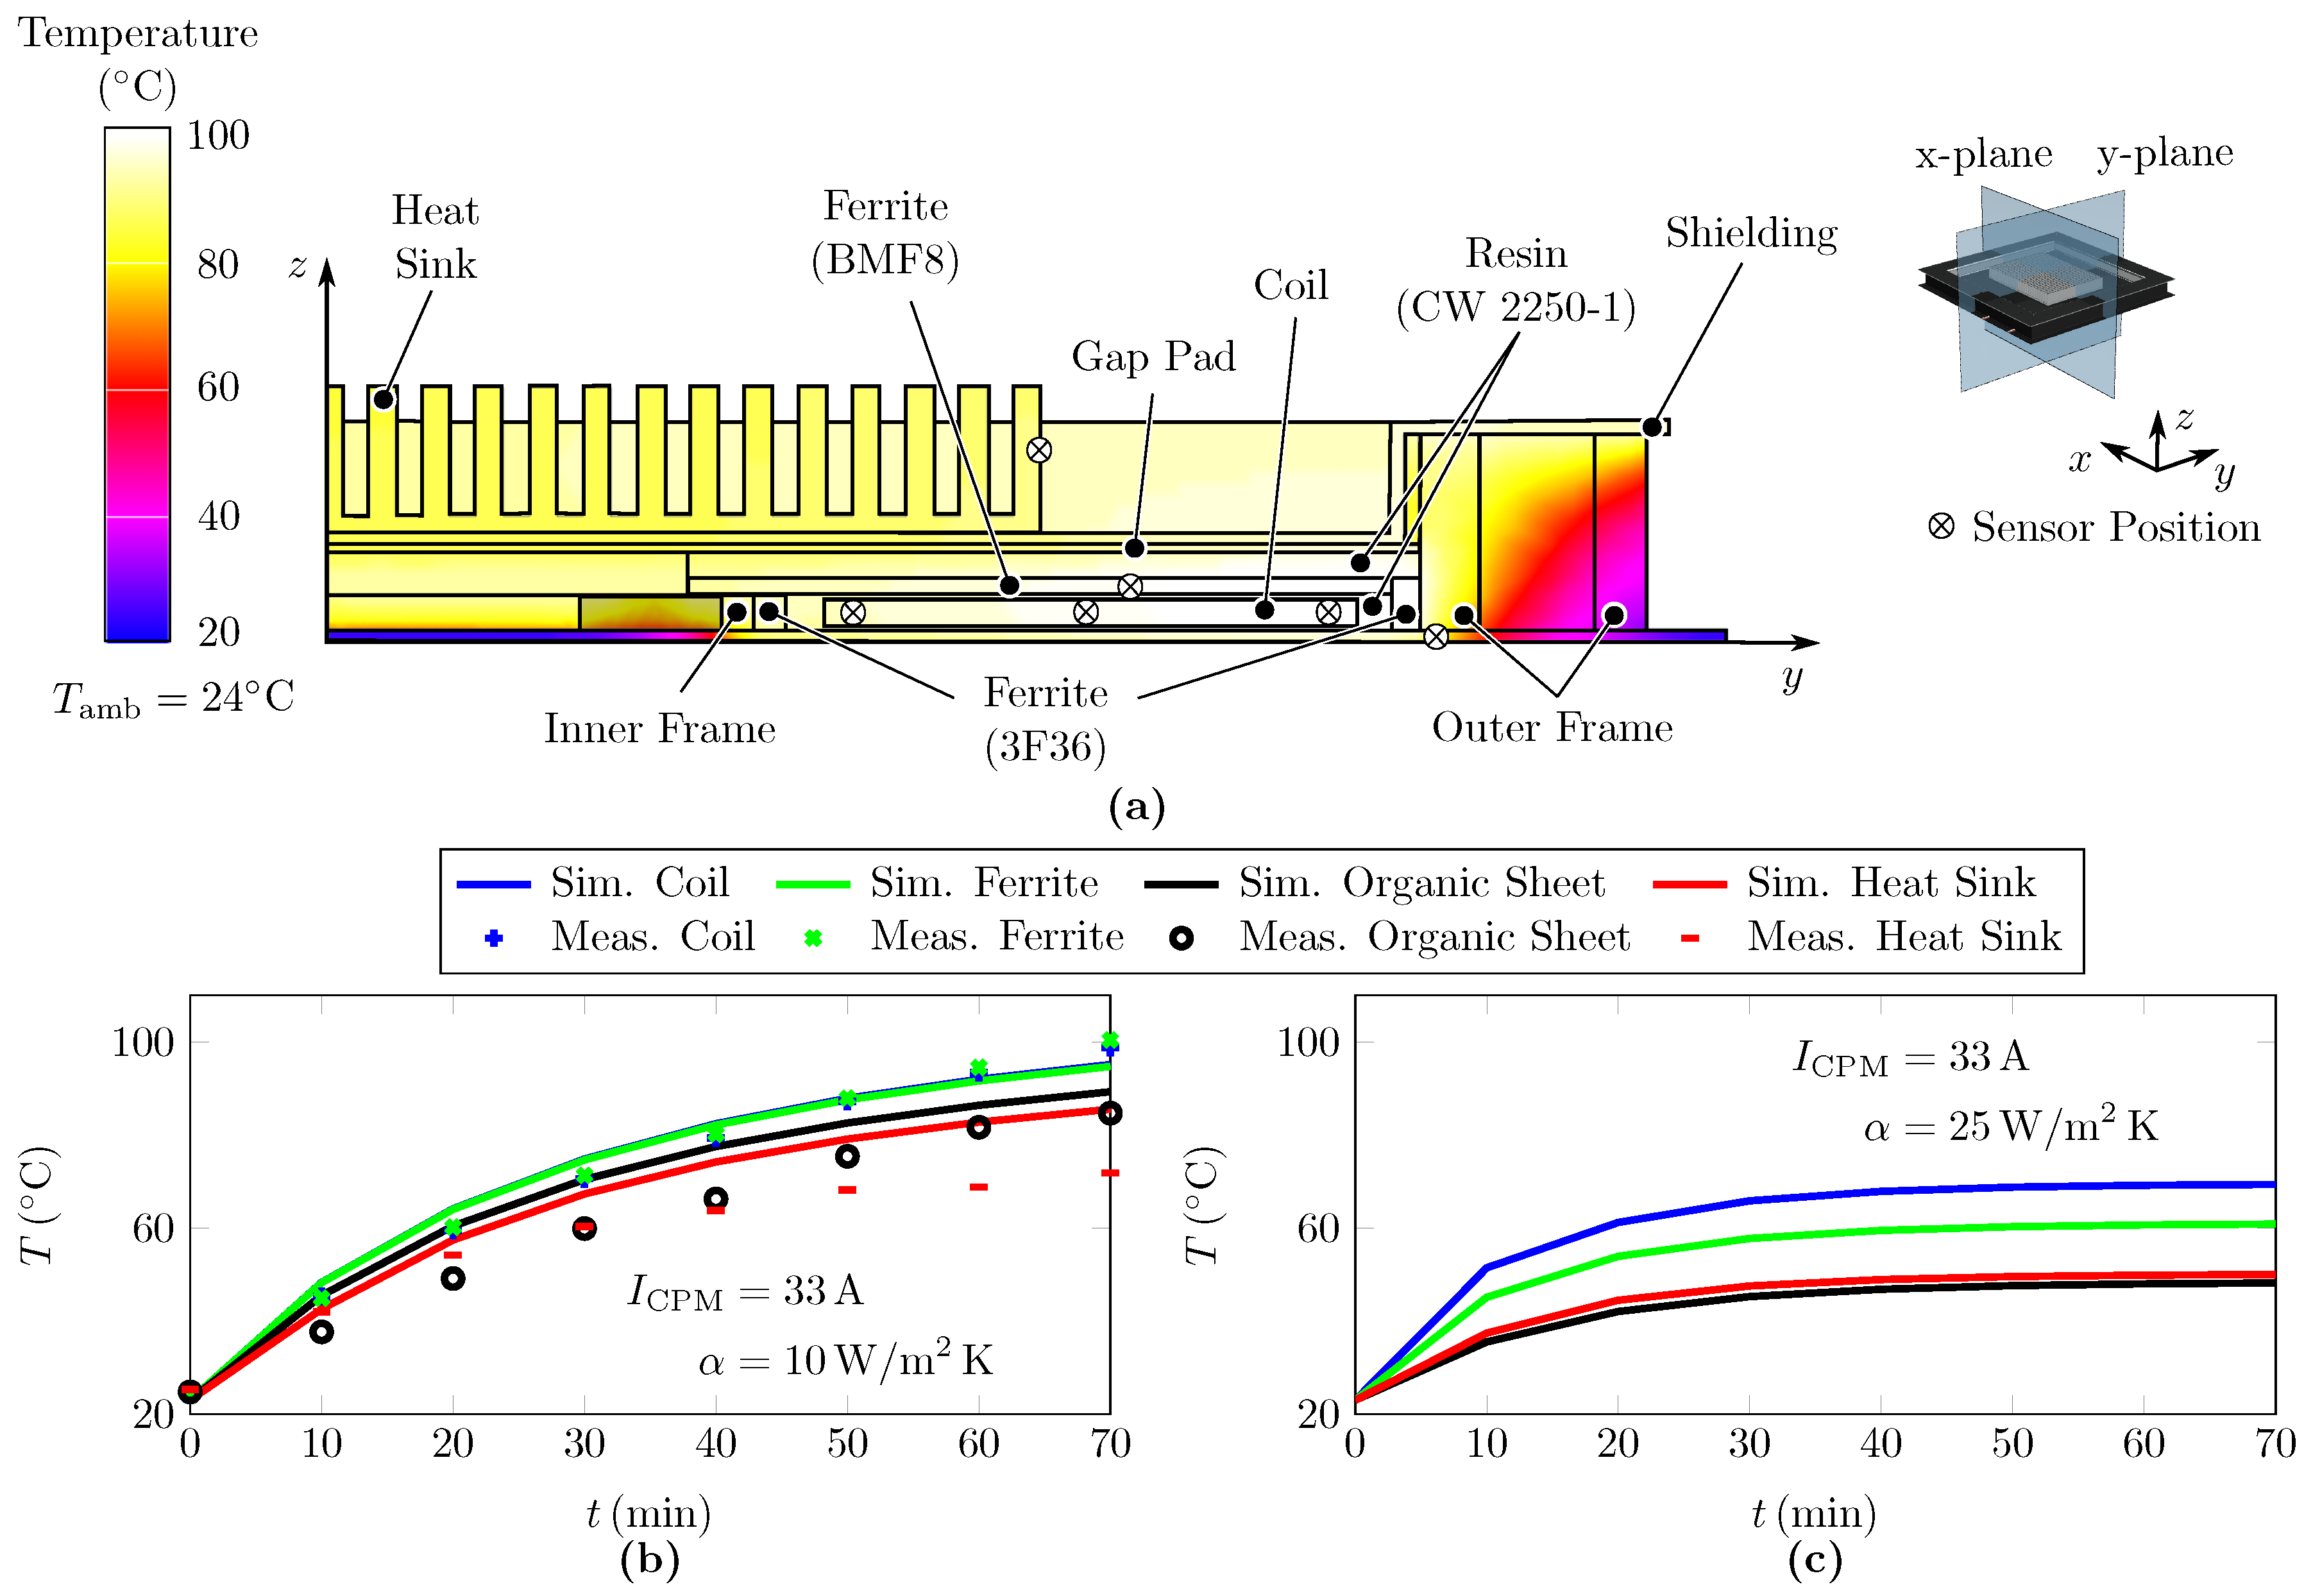
Component level testing:Figure 14 summarizes the results of the thermal analysis of the space–frame concept. Taking into account the electric requirements of component level testing ( I C P M = 33 A RMS ) and natural convection, we measured the temperature rise within a time of 70 min. Compared to the sandwich concept, the improved heat transfer to the bottom and top side combined with the bigger heat sinks enables a significant heat reduction. Consequently, the temperature gradient from center to top and bottom side decreases, shown in Figure 14a. Thus, the maximum operating temperature of the thermal conductive resin is not reached within the measuring time.
The results of the thermal FE analysis presented in Figure 14b show a good consistency with the experimental validation. Especially, the critical temperatures of coil and ferrites are reproduced well. The temperature rise of the organic sheet is qualitatively consistent to the experimental validation. Quantitatively, the FE analysis shows a higher critical temperature of the organic sheet. The same applies to the shielding. The gaps at the corners of the shielding induces local hotspots. Therefore, we measured the temperature of the heat sinks. As postulated in the previous section, the FE model reproduces well the temperature at the edge of the schielding. Since the heat sinks are located in the center, there is a discrepancy between FE analysis and experimental validation. Figure 14c representing the FE analysis with forced convection ( α =   25   W / m 2   K ) shows a temperature reduction of the active components of approximately 30 °C. Thus, the thermal feasibility of the proposed space–frame concept with active air cooling is considered to be valid. Without active air cooling, the thermal feasibilty might be challenging. Especially, the temperature dependency of the mechanical properties of organic sheet and frame requires a detailed thermal-mechanical investigation.
System level testing:Figure 15 summarizes the results of the thermal analysis of the space–frame concept. Considering the electric requirements of system level testing ( I CPM = 29 A RMS ) and natural convection, we measured the temperature rise within a time of 120 min. As postulated in the previous section, the cutouts at the corners of the shielding result in local hotspots shown in the thermographic image of Figure 15b. Therefore, the temporary temperature along the shielding edge is not uniform. Thus, the temperature measurement using fibre optical sensors is pointless. Besides, the FE model does not reproduce the temperature rise of the heat sink according to the component level testing. Therefore, we only measured the temperature rise of the coil shown in Figure 15c. Analogous to the sandwich concept, the temperature rise of the outer windings is mapped accurately, whereas the discrepancy increases towards inner windings. However, the proposed FE model is sufficiently accurate in the critical coil temperature. However, proof of thermal feasibility requires further experimental validation with a completely closed shielding. Thus, the shielding temperature is to be expected as uncritical, similar to the sandwich concept. Taking into account the testing specifications of SAE J2954 [5] and the system specifications of Table 1, the DC-DC efficiency of the sandwich concept is measured over the measured period according to Figure 13c at an input power of 11 kW between 87.8% and 90.1%.

7. Discussion

Regardless of the conept, the thermal behaviour in component and system level testing is comparable. With regard to the proposed sandwich concept, the component level test derives the thermal limitation at runtime of 120 minutes under natural convection conditions. Assuming forced convection, the thermal feasibility of the sandwich concept is considered as valid based on simulation results. Compared to the sandwich concept, the space–frame concept has an improved heat dissipation resulting in a significant heat reduction. Especially, the results with forced convection prove the thermal feasibility of the concept. Nevertheless, the shielding design represented by a sheet metal part induces local hotspots. This makes a detailed analysis of thermal effects of the shielding impossible. Accordingly, additional experimental validations of the space–frame concept are required. The results of the experimental testing are used to validate a thermal simulation model. The presented thermal model expands literature known approaches taking into account the temperature dependence of the coil and core losses. The eddy current losses of the shielding are time-dependent taken from experimental investigations. Due to the uniform distribution of power losses, temperature gradients of coils and shieldings are not mapped. In this respect, a fully coupled electromagnetic–thermal simulation might be more accurate. However, the critical temperatures of the active components are reproduced well regardless of the concept. Thus, the proposed FE model enables the mapping of the critical component temperatures of a CPM. This supports design and dimensioning of the active and passive components of CPMs in terms of heat management.

8. Conclusions

This paper presents a systematic investigation of thermal effects of novel on-board receiver modules for vehicular wireless power transfer systems. The studied CPMs are designed as sandwich and space–frame concept. The presented investigations were performed at component and system level using a Hardware-in-the-Loop testing facility for wireless power transfer systems. The results of the component level tests and system level tests are comparable. Thus, the component level test offers a reasonable substitute test for investigating the thermal performance of CPM constructions. In this respect, the space–frame concept shows an improved heat management compared to the sandwich concepts. Under the assumption of forced convection, both concepts are proved to be feasible from a thermal point of view. The experimental results are used to validate a thermal simulation model, which accurately reproduces the critical temperatures of the active components. Thus, the proposed systematic analysis forms the basis of a more sophisticated thermal model for dimensioning CPM concepts. However, further studies with improved shielding to prevent local hotspots and a coupled electromagnetic–thermal simulation to map temperature gradients across the active components are required.

Author Contributions

The authors contributed to this work by collaboration. Conceptualization, S.Z., M.H. and P.L.; software, S.Z.; validation, S.Z., M.H. and P.L.; investigation A.W.; writing—review and editing, A.W.; supervision, N.M. All authors have read and agreed to the published version of the manuscript.

Funding

This research received no external funding.

Conflicts of Interest

The authors declare no conflict of interest.

Abbreviations

The following abbreviations are used in this manuscript:
ACAlternating current
CPMCar Pad Module
DCDirect current
EVsElectric vehicles
FEFinite elements
FOMFigure-of-Merit
GPMGround Pad Module
HFHigh frequency
HiLHardware-in-the-Loop
MOSFETMetal–oxide–semiconductor field-effect transistor
PFCPower factor correction
RMSRoot Mean Square
WPTSWireless power transfer systems

References

  1. Fett, D.; Ensslen, A.; Jochem, P.; Fichtner, W. A Survey on User Acceptance of Wireless Electric Vehicle Charging. World Electr. Veh. J. 2018, 9, 36. [Google Scholar] [CrossRef] [Green Version]
  2. Khutwad, S.R.; Gaur, S. Wireless charging system for electric vehicle. In Proceedings of the 2016 International Conference on Signal Processing, Communication, Power and Embedded System (SCOPES), Odisha, India, 3–5 October 2016; IEEE: Piscataway, NJ, USA, 2016; pp. 441–445. [Google Scholar] [CrossRef]
  3. Vilathgamuwa, D.M.; Sampath, J.P.K. Wireless Power Transfer (WPT) for Electric Vehicles (EVs)—Present and Future Trends. In Plug In Electric Vehicles in Smart Grids; Rajakaruna, S., Shahnia, F., Ghosh, A., Eds.; Power Systems; Springer: Singapore, 2015; pp. 33–60. [Google Scholar] [CrossRef]
  4. Lin, Z.; Wang, L.; Huang, Z. Studies on the different assembles of magnetic shielding pieces in electromagnetic induction-type wireless charging system. Appl. Phys. A 2019, 125, 1413. [Google Scholar] [CrossRef]
  5. Society of Automotive Engineers. (R) Wireless Power Transfer for Light-Duty Plug-In/Electric Vehicles and Alignment Methodology; Society of Automotive Engineers: Warrendale, PA, USA, 2017. [Google Scholar]
  6. Aditya, K.; Peschiera, B.; Youssef, M.; Williamson, S.S. Modelling and calculation of key design parameters for an Inductive Power Transfer system using Finite Element Analysis—A comprehensive discussion. In Proceedings of the 2015 IEEE Transportation Electrification Conference and Expo (ITEC), Dearborn, MI, USA, 14–17 June 2015; IEEE: Piscataway, NJ, USA, 2015; pp. 1–6. [Google Scholar] [CrossRef]
  7. Barth, D.; Klaus, B.; Leibfried, T. Litz wire design for wireless power transfer in electric vehicles. In Proceedings of the 2017 IEEE Wireless Power Transfer Conference (WPTC), Taipei, Taiwan, 10–12 May 2017; IEEE: Piscataway, NJ, USA, 2017; pp. 1–4. [Google Scholar] [CrossRef]
  8. Wang, S.; Dorrell, D.G. Copper Loss Analysis of EV Charging Coupler. IEEE Trans. Magn. 2015, 51, 1–4. [Google Scholar] [CrossRef]
  9. Kim, J.; Kim, J.; Kong, S.; Kim, H.; Suh, I.S.; Suh, N.P.; Cho, D.H.; Kim, J.; Ahn, S. Coil Design and Shielding Methods for a Magnetic Resonant Wireless Power Transfer System. Proc. IEEE 2013, 101, 1332–1342. [Google Scholar] [CrossRef]
  10. Chen, W.; Liu, C.; Lee, C.; Shan, Z. Cost-Effectiveness Comparison of Coupler Designs of Wireless Power Transfer for Electric Vehicle Dynamic Charging. Energies 2016, 9, 906. [Google Scholar] [CrossRef] [Green Version]
  11. Bosshard, R.; Kolar, J.W.; Wunsch, B. Accurate finite-element modeling and experimental verification of inductive power transfer coil design. In Proceedings of the 2014 IEEE Applied Power Electronics Conference and Exposition—APEC 2014, Fort Worth, TX, USA, 16–20 March 2014; IEEE: Piscataway, NJ, USA, 2014; pp. 1648–1653. [Google Scholar] [CrossRef]
  12. Dolara, A.; Leva, S.; Longo, M.; Castelli-Dezza, F.; Mauri, M. Coil design and magnetic shielding of a resonant wireless power transfer system for electric vehicle battery charging. In Proceedings of the 2017 IEEE 6th International Conference on Renewable Energy Research and Applications (ICRERA), San Diego, CA, USA, 5–8 November 2017; IEEE: Piscataway, NJ, USA, 2017; pp. 200–205. [Google Scholar] [CrossRef]
  13. Lin, H.N.; Wu, C.H.; Huang, J.F.; Tseng, W.D.; Lin, J.Y.T.; Lin, M.S. Near-and far-field shielding effectiveness analysis of magnetic materials and their effect on wireless power charger. In Proceedings of the 2018 IEEE International Symposium on Electromagnetic Compatibility and 2018 IEEE Asia-Pacific Symposium on Electromagnetic Compatibility (EMC/APEMC), Singapore, 14–18 May 2018; IEEE: Piscataway, NJ, USA, 2018; pp. 1071–1076. [Google Scholar] [CrossRef]
  14. Wielandt, S.; De Strycker, L.; Goemaere, J.P.; Stevens, N. Influence of shielding materials on coil characteristics in inductive wireless power systems. In Proceedings of the International Symposium on Electromagnetic Compatibility (EMC Europe), Brugge, Belgium, 2–6 September 2013; IEEE: Piscataway, NJ, USA, 2013. [Google Scholar]
  15. Lu, M.; Ngo, K.D.T. Comparison of passive shields for coils in inductive power transfer. In Proceedings of the 2017 IEEE Applied Power Electronics Conference and Exposition (APEC), Tampa, FL, USA, 6–30 March 2017; IEEE: Piscataway, NJ, USA, 2017; pp. 1419–1424. [Google Scholar] [CrossRef]
  16. Bosshard, R.; Kolar, J.W. Multi-Objective Optimization of 50 kW/85 kHz IPT System for Public Transport. IEEE J. Emerg. Sel. Top. Power Electron. 2016, 4, 1370–1382. [Google Scholar] [CrossRef]
  17. Bosshard, R.; Muhlethaler, J.; Kolar, J.W.; Stevanovic, I. The η-α-Pareto front of inductive power transfer coils. In Proceedings of the IECON 2012—38th Annual Conference on IEEE Industrial Electronics Society, Montreal, QC, Canada, 25–28 October 2012; IEEE: Piscataway, NJ, USA, 2012; pp. 4270–4277. [Google Scholar] [CrossRef]
  18. Lu, M.; Ngo, K.D.T. Pareto fronts for coils’ efficiency versus stray magnetic field in inductive power transfer. In Proceedings of the 2016 IEEE PELS Workshop on Emerging Technologies: Wireless Power Transfer (WoW), Knoxville, TN, USA, 4–6 October 2016; IEEE: Piscataway, NJ, USA, 2016; pp. 140–144. [Google Scholar] [CrossRef]
  19. Bosshard, R. Multi-Objective Optimization of Inductive Power Transfer Systems for EV Charging. Ph.D. Thesis, ETH Zürich, Zürich, Switzerland, 2015. [Google Scholar]
  20. Zimmer, S.; Rothenberg, S.; Tattko, B.; Baumer, T.; Baier, k.; Glöggler, C. Vehicle Integration of wireless power transfer systems: An experimental safety investigation of underfloor impact scenarios. In Proceedings of the 31th International Electric Vehicle Symposium & Exhibition (EVS31), Kobe, Japan, 30 November–3 October 2018. [Google Scholar]
  21. Barth, H.; Jung, M.; Braun, M.; Schmuelling, B.; Reker, U. Concept Evaluation of an Inductive Charging System for Electric Vehicles. In Smart Grids and E-mobility; Stoa, P., Günther, E., Eds.; Ostbayerisches Technologie-Transfer-Institut (OTTI): Regensburg, Germany, 2011. [Google Scholar]
  22. Onar, O.C.; Campbell, S.L.; Seiber, L.E.; White, C.P.; Chinthavali, M. Vehicular integration of wireless power transfer systems and hardware interoperability case studies. In Proceedings of the 2016 IEEE Energy Conversion Congress and Exposition (ECCE), Milwaukee, WI, USA, 18–22 September 2016; IEEE: Piscataway, NJ, USA, 2016; pp. 1–8. [Google Scholar] [CrossRef]
  23. Ombach, G. Technische Herausforderungen bei der Suche nach einer optimalen Lösung für die drahtlose Energieübertrage für Kraftfahrzeuge. In Proceedings of the Elektronik im Fahrzeug 2013, Baden-Baden, Germany, 16–17 October 2013; VDI Wissensforum GmbH, Ed.; VDI Wissensforum GmbH: Düsseldorf, Germany, 2013. [Google Scholar]
  24. Nestler, M.; Hensel, S.; Müller, R.; Drossel, W.G. Process design for the shaping of sandwich sheets with sensor and actuator functionality. Procedia Eng. 2017, 207, 872–877. [Google Scholar] [CrossRef]
  25. Pascual, C.; de Castro, J.; Schueler, A.; Vassilopoulos, A.P.; Keller, T. Total light transmittance of glass fiber-reinforced polymer laminates for multifunctional load-bearing structures. J. Compos. Mater. 2013, 48, 3591–3604. [Google Scholar] [CrossRef] [Green Version]
  26. Winter, J. Fahrdrahtlose Energieübertragung bei Schienenfahrzeugen des Vollbahnverkehrs; Deutsches Zentrum für Luft- und Raumfahrt e.V.: Stuttgart, Germany, 2014. [Google Scholar]
  27. Moghaddami, M.; Sarwat, A. Time-Dependent Multi-Physics Analysis of Inductive Power Transfer Systems. In Proceedings of the 2018 IEEE Transportation Electrification Conference and Expo (ITEC), Long Beach, CA, USA, 13–15 June 2018; IEEE: Piscataway, NJ, USA, 2018; pp. 130–134. [Google Scholar] [CrossRef]
  28. Blinzinger Elektronik GmbH. Data Sheet: Ferrite Core BMF8; Blinzinger Elektronik GmbH: Forchtenberg, Germany, 2020. [Google Scholar]
  29. Digi-Key Electronics Germany Gmbh. Data Sheet: PLT32/20/3.2/R-3F36; Digi-Key Electronics Germany Gmbh: Munich, Germany, 2020. [Google Scholar]
  30. Evonik Resource Efficiency GmbH. Product Information: ROHACELL’IG-F; Evonik Resource Efficiency GmbH: Marl, Germany, 2020. [Google Scholar]
  31. Huntsman International LLC. Advanced Materials: Araldite’CW 2250-1; Huntsman International LLC: Salt Lake City, UT, USA, 2020. [Google Scholar]
  32. LANXESS Deutschland GmbH. Material Data Sheet: Tepex dynalite 102-RG600(x)/47%: Roving Glass—PA6 Consolidated Composite Laminate; Lanxess: Cologne, Germany, 2020. [Google Scholar]
  33. Huntsman International LLC. Betaforce; Huntsman International LLC: Salt Lake City, UT, USA, 2020. [Google Scholar]
  34. ARCTIC GmbH. Thermal Pad: High Performance Gap Filler; ARCTIC GmbH: Freienbach, Switzerland, 2020. [Google Scholar]
  35. ACC Silicones Ltd. SILCOTHERM’: Werkstoffe zur Wärmeleitung; ACC Silicones Ltd.: Bridgwater, UK, 2020. [Google Scholar]
  36. Conrad Electronic SE. Fischer Elektronik SK 42 150 SA Strangkühlkörper 0.75 K/W (L × B × H) 200 × 150 × 25 mm; Conrad Electronic SE: Hirschau, Germany, 2020. [Google Scholar]
  37. Klaus, B. Aspekte zur Praxisnahen Auslegung Induktiver Energieübertragungssysteme für Elektrofahrzeuge. Ph.D. Thesis, Karlsruher Institut für Technologie (KIT), Karlsruhe, Germany, 2018. [Google Scholar]
  38. Biela, J. Wirbelstromverluste in Wicklungen Induktiver Bauelemente; Skriptum, ETH Zürich: Zürich, Germany, 2012. [Google Scholar]
  39. Mühletaler, J. Modeling and Multi-Objective Optimization of Inductive Power Components. Ph.D. Thesis, ETH Zürich, Zürich, Germany, 2012. [Google Scholar]
  40. Weißgerber, W. Elektrotechnik für Ingenieure–Formelsammlung: Elektrotechnik Kompakt, 5th ed.; Durchgesehene Aufl. 2015; Lehrbuch; Springer Vieweg: Wiesbaden, Germany, 2015. [Google Scholar]
  41. Ashby, M.F. Materials Selection in Mechanical Design, 3rd ed.; Butterworth-Heinemann: Oxford, UK, 2005. [Google Scholar]
  42. Groth, C.; Müller, G. FEM für Praktiker, 5th ed.; Edition Expertsoft; Expert-Verl.: Renningen, Germany, 2009; Volume 45. [Google Scholar]
  43. VDI-Wärmeatlas: Mit 320 Tabellen; VDI-Buch, Springer Vieweg: Berlin, Germany, 2013.
  44. Alsayegh, M.; Saifo, M.; Clemens, M.; Schmuelling, B. Magnetic and Thermal Coupled Field Analysis of Wireless Charging Systems for Electric Vehicles. IEEE Trans. Magn. 2019, 55, 1–4. [Google Scholar] [CrossRef]
  45. Deutsches Kupferinstitut: Düsseldorf, Germany, 2020. Cu-ETP. Available online: http://te-x-te.de/images/DA_DKI.pdf (accessed on 23 September 2020).
  46. Ferroxcube. Soft Ferrites: Ferrite Material Survey; Ferroxcube: Hong Kong, China, 2020. [Google Scholar]
  47. Kern GmbH. Polyamid 6 (PA 6); Kern GmbH: Großmaischeid, Germany, 2020. [Google Scholar]
  48. Schwarzwälder Metallhandel GmbH. Werkstoffdatenblatt: EN AW 5754 [EN AW-Al Mg3]; Schwarzwälder Metallhandel GmbH: Trossingen, Germany, 2020. [Google Scholar]
  49. Cosinus Messtechnik GmbH. Data Sheet: CWT Mini; Cosinus Messtechnik GmbH: Taufkirchen, Germany, 2020. [Google Scholar]
  50. Weidmann Technologies Deutschland GmbH. TS2: Fiber Optic Temperature Sensor; Weidmann Technologies Deutschland GmbH: Dresden, Germany, 2020. [Google Scholar]
  51. InfraTec GmbH. VarioCAM’HD Head: Infrarot-Thermografiesystem für den Industrie—und Laboreinsatz; InfraTec GmbH: Dresden, Germany, 2020. [Google Scholar]
Figure 1. Exemplary wireless power transfer system.
Wevj 11 00067 g001
Figure 2. z-dimension of different WPTS constructions: (a) conventional construction for WPTS with a transmission power of 3.6 kW given in [20], (b) conventional construction for WPTS with a transmission power of 11 kW e.g. given in [23] and (c) proposed concept for WPTS with a transmission power of 11 kW.
Wevj 11 00067 g002
Figure 3. Setup of the utilized wireless power transfer system.
Wevj 11 00067 g003
Figure 4. Design parameters of the exemplary WPTS.
Wevj 11 00067 g004
Figure 5. Sandwich concept and maximum temperature ratings of the components.
Wevj 11 00067 g005
Figure 6. Space–frame concept and maximum temperature ratings of the components.
Wevj 11 00067 g006
Figure 7. (a) Analytically calculated magnetic field H ( x ) of individual conductors and derived external magnetic field H ext from the mean value of H ( x ) of section A-A in (b) the simplified model with solid regions of coil and ferrites taking advantage of axial symmetry.
Wevj 11 00067 g007
Figure 8. Power loss densities: (a) p coil ( T ) , (b) p core ( T ) and (c) p eddy ( t ) .
Wevj 11 00067 g008
Figure 9. Experimental setup of the thermal analysis and position of the fibre optical thermal sensors exemplary on sandwich concept.
Wevj 11 00067 g009
Figure 10. Block diagram of the Hardware-in-the-Loop test bench.
Wevj 11 00067 g010
Figure 11. Photograph of the experimental setup of the system level testing exemplary on the sandwich concept.
Wevj 11 00067 g011
Figure 12. (a) Results of the thermal FE analysis of sandwich concept on component level at t = 120 min , (b) comparision of heating results of FE analysis and component level testing with natural convection, (c) comparision of cool-down results of FE simulation and component level testing with natural convection and (d) comparision of FE analysis with natural ( α   =   10   W / m 2   K ) and forced convection ( α   =   25   W / m 2   K ).
Wevj 11 00067 g012
Figure 13. (a) Results of the thermal FE analysis of sandwich concept on system level at t = 100 min , (b) thermographic image at t = 100 min , (c) heating results of FE analysis and system level testing of the coil and (d) the shielding under natural convection ( α =   10   W / m 2   K ).
Wevj 11 00067 g013
Figure 14. (a) Results of the thermal FE analysis of space–frame concept on component level at t = 70 min , (b) comparision of heating results of FE analysis and component level testing with natural convection ( α =   10   W / m 2   K ), (c) FE analysis with forced convection ( α =   25   W / m 2   K ).
Wevj 11 00067 g014
Figure 15. (a) Results of the thermal FE analysis of space–frame concept on system level at t = 120 min , (b) thermographic image at t = 120 min , (c) heating results of FE analysis and system level testing of the coil under natural convection ( α =   10   W / m 2   K ).
Wevj 11 00067 g015
Table 1. System specification and boundary conditions of the exemplary WPTS.
ParameterVariableValueUnit
Output Power P out 11kW
GPM DC-Link Voltage U GPM , DC 0–540V
CPM DC-Link Voltage U CPM , DC 300–470V
Battery Voltage U batt 300–470V
Air Gapz100–210mm
Misalignment longitudinal Δ x ±75mm
Misalignment transversal Δ y ±150mm
Transmission Frequency f 0 81.38–90kHz
Area of CPM coil ( x , y ) A coil , max 300 × 300mm2
Table 2. Coil parameters of proposed 11 kW WPTS.
ParameterVariableValueUnit
Coil length L GPM 600mm
L CPM 300mm
Coil width W GPM 750mm
W CPM 300µm
Number of windings N GPM 7
N CPM 15
Self-Inductance L GPM 77µH
L CPM 112µH
Mutual InductanceM7.4–18.6µH
Magnetic Couplingk0.08–0.2
AC-Resistance R AC , GPM <40m Ω
R AC , CPM 100m Ω
RMS-Current I GPM 35–100A RMS
I CPM 23–36A RMS
Table 3. Parameters for the calculation of coil losses P coil ( T ) .
NameParameterValueUnit
Transmission frequencyf85kHz
Peak coil current I ^ 33A
Magnitude of external magnetic field H ext 6.62kA  m 1
Number of strands in the litz wireN15
Total length of litz wire l litz 12.7m
Outer diameter of the litz wire d litz 4.5mm
Specific resistance of litz wire material at 20 °C [40] ρ litz , 20 0.018 Ω  mm  m 1
Specific temperature coefficent of litz wire material at 20 °C [40] α litz , 20 0.004 K 1
Table 4. Material parameters of the thermal simulation model.
Density ρ
g cm 3
Heat Capacity c p
J kg K
Thermal Expansion Coeffient α th
10 6 1 K
Thermal Conductivity λ
W m K
Copper [45]8.9238517381
BMF8 [46]4.875014.2
3F36 [46]4.875014.2
IG-F 71 [30]0.075200380.03
CW 2250-1 [31]1.581800650.76
PA [47]1.141700800.23
Organic sheet1.351280160.28
Silicone [35]3.27102006
Aluminium [48]2.6690025117
Publisher’s Note: MDPI stays neutral with regard to jurisdictional claims in published maps and institutional affiliations.