


A Strategy for Measuring Voltage, Current and Temperature of a Battery Using Linear Optocouplers


Abstract
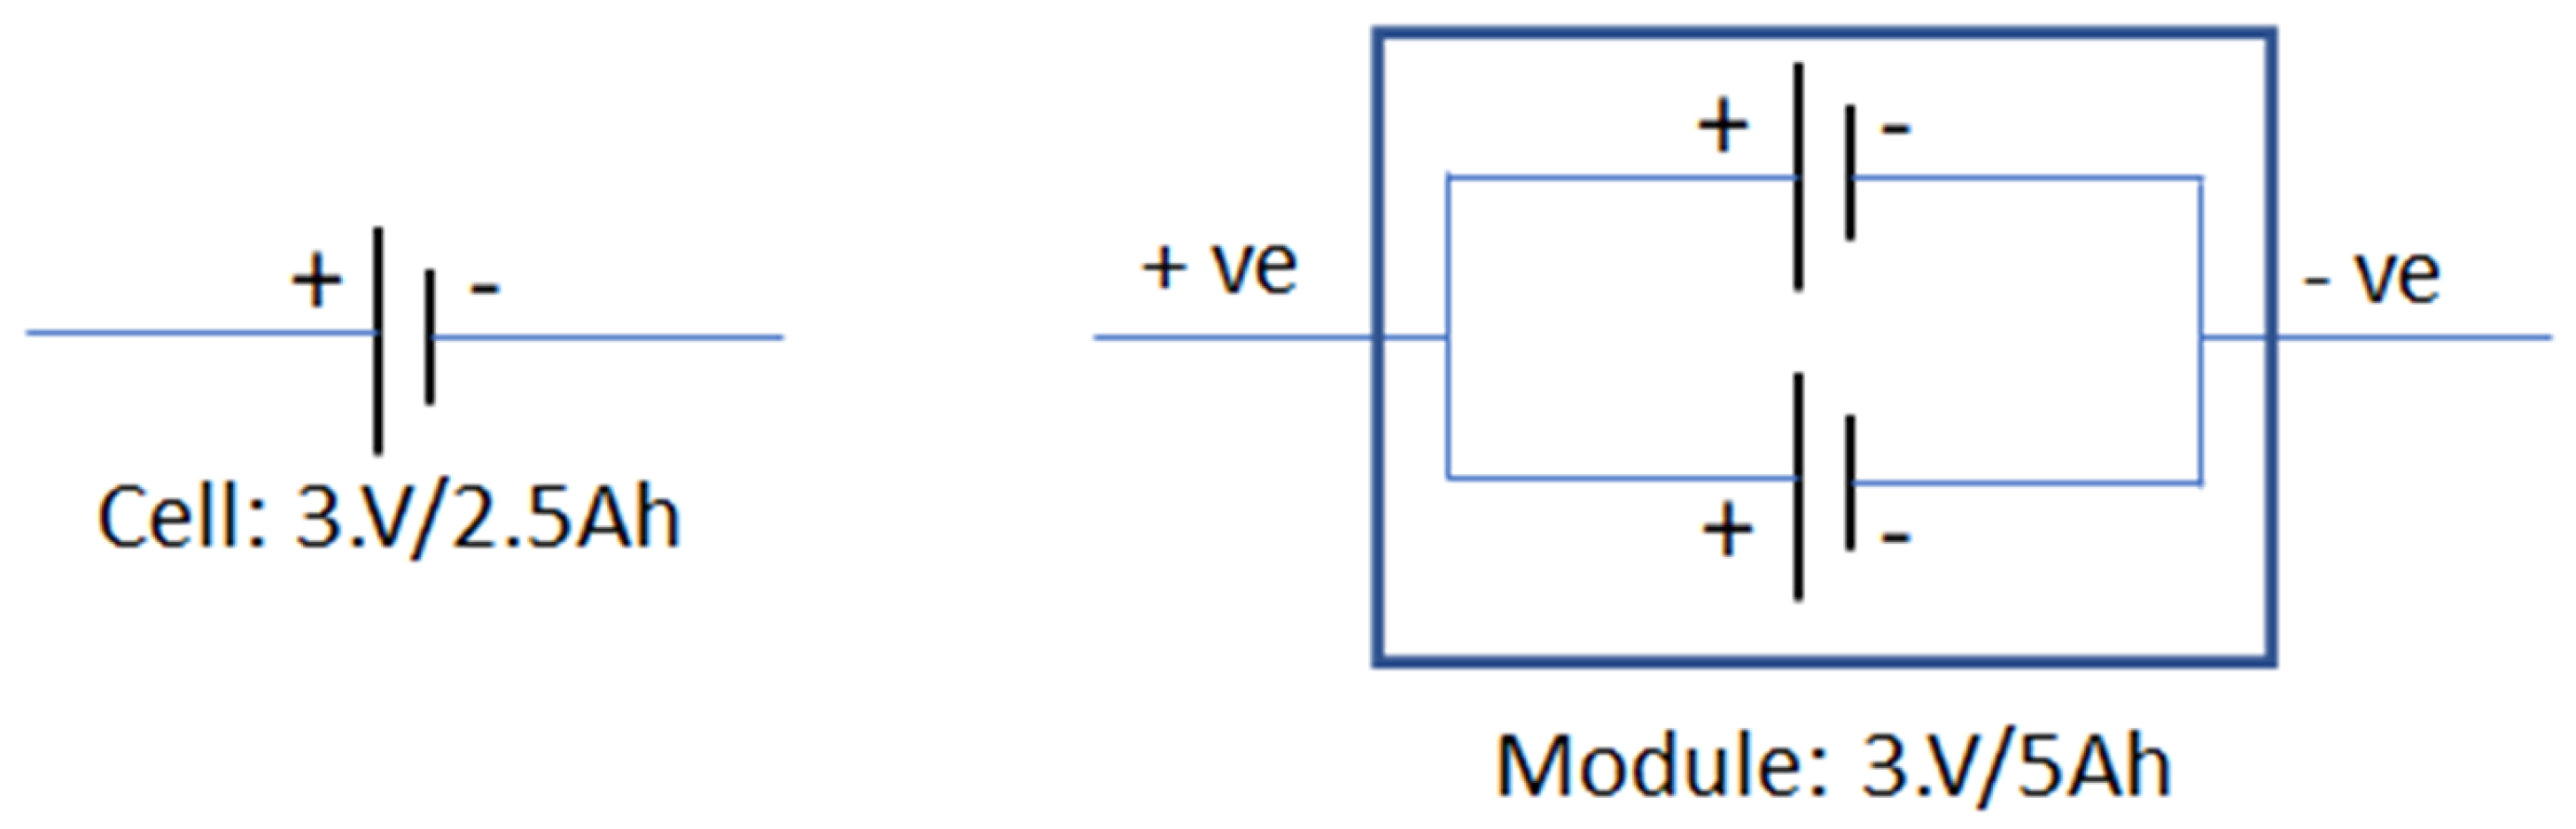
1. Introduction
- Protecting the cells and battery packs from being damaged;
- Making the batteries operate within the proper voltage, current, and temperature range;
- Ensuring their safety and extending their service life as much as possible;
- Maintaining the battery to operate in a state in which the batteries could fulfill the vehicle’s requirements.
2. Literature Survey
2.1. Direct Measurement
2.1.1. Method of Open Circuit Voltage
2.1.2. Terminal Voltage Method
2.1.3. Impedance Method
2.2. Book-Keeping Estimation
2.3. Coulomb Counting Method
2.4. Adaptive Systems
2.5. Hybrid Methods
2.6. VOMA618A
2.7. IL300
3. Proposed Methodology
3.1. Voltage Measurement
- When the LED does not glow: Under this condition, the voltage at the collector terminal is equal to the reference voltage, as there is not a change in the resistance of the photodiode.
- When the LED glows: Under this condition, the resistance of the photodiode changes. Due to this change in the resistance, the voltage at the collector terminal is changed. The change in the voltage depends upon the parameters of the intensity of the LED glow and the resistance of the photodiode.
3.2. Current Measurement
3.3. Temperature Measurement
Measurement of Temperature
4. Experimental Setup
5. Conclusions
Author Contributions
Funding
Data Availability Statement
Conflicts of Interest
References
- Brandi, M.; Gall, H.; Wenger, M.; Lorentz, V.; Giegerich, M.; Baronti, F.; Fantechi, G.; Fanucci, L.; Roncella, R.; Saletti, R.; et al. Batteries and battery management systems for electric vehicles. In Proceedings of the IEEE Design, Automation Test in Europe Conference Exhibition, Dresden, Germany, 12–16 March 2012. [Google Scholar]
- Miao, Y. Current Li-Ion Battery Technologies in Electric Vehicles and Opportunities for Advancements. Energies 2019, 12, 1074. [Google Scholar] [CrossRef]
- Cherukuri, M.; Kanthi, M. Battery Management System Design for Electric Vehicle. In Proceedings of the IEEE International Conference on Distributed Computing, VLSI Electrical Circuits and Robotics, Manipal, India, 11–12 August 2019. [Google Scholar]
- Yup, T.; Wu, L.; Zhang, X.; Tian, G. High-precision voltage measurement IP core for battery management SoC of electric vehicles. In Proceedings of the IEEE International Conference on Solid-State and Integrated Circuit Technology, Guilin, China, 28–31 October 2014; pp. 1–3. [Google Scholar]
- Mawonou, K.S.R.; Eddahech, A.; Dumur, D.; Godoy, E.; Beauvois, D.; Mensler, M. Li-Ion Battery Pack SoC Estimation for Electric Vehicles. In Proceedings of the 44th Annual Conference of the IEEE Industrial Electronics Society, Washington, DC, USA, 21–23 October 2018; pp. 4968–4973. [Google Scholar]
- Xiong, R.; Li, L.; Tian, J. Towards a smarter battery management system: A critical review on battery state of health monitoring methods. J. Pow. Sour. 2018, 405, 18–29. [Google Scholar] [CrossRef]
- Shah, F.A.; Sheikh, S.S.; Mir, U.I.; Athar, S.O. Battery Health Monitoring for Commercialised Electric Vehicle Batteries: Lithium-Ion. In Proceedings of the International Conference on Power Generation Systems and Renewable Energy Technologies, Istanbul, Turkey, 26–27 August 2019; pp. 1–6. [Google Scholar]
- Buccolini, L.; Ricci, A.; Scavongelli, C.; DeMaso-Gentile, G.; Orcioni, S.; Conti, M. Battery Management System (BMS) simulation environment for electric vehicles. In Proceedings of the IEEE 16th International Conference on Environment and Electrical Engineering, Florence, Italy, 7–10 June 2016; pp. 1–6. [Google Scholar]
- Cheng, K.W.E.; Divakar, B.P.; Wu, H.; Ding, K.; Ho, H.F. Battery-Management System (BMS) and SOC Development for Electrical Vehicles. IEEE Trans. Veh. Technol. 2011, 60, 76–88. [Google Scholar] [CrossRef]
- Vaideeswaran, V.; Bhuvanesh, S.; Devasena, M. Battery Management Systems for Electric Vehicles using Lithium-Ion Batteries. In Proceedings of the IEEE Innovations in Power and Advanced Computing Technologies (i-PACT), Vellore, India, 22–23 March 2019; pp. 1–9. [Google Scholar]
- Dimitrov, B.; Collier, G.; Cruden, A. Design and Experimental Verification of Voltage Measurement Circuits Based on Linear Optocouplers with Galvanic Isolation for Battery Management Systems. World Electr. Veh. J. 2019, 10, 59. [Google Scholar] [CrossRef]
- Danko, M.; Adamec, J.; Taraba, M.; Drgona, P. Overview of batteries State of Charge estimation methods. Transp. Res. Proc. 2019, 40, 186–192. [Google Scholar] [CrossRef]
- Wang, H.; Liu, Y. Estimation of state of charge of batteries for electric vehicles. Int. J. Control Autom. 2013, 6, 185–194. [Google Scholar]
- Chang, W.Y. The state of Charge Estimating Methods for Battery: A review. Int. Sch. Res. Not. 2013, 2013, 953792. [Google Scholar] [CrossRef]
- Anbuky, A.H.; Pascoe, P.E. VRLA battery state-of-charge estimation in telecommunication power systems. IEEE Trans. Ind. Elec. 2000, 47, 565–573. [Google Scholar] [CrossRef]
- Wang, Y.; Tian, J.; Sun, Z.; Wang, L.; Xu, R.; Li, M.; Chen, Z. A comprehensive review of battery modeling and state estimation approaches for advanced battery management systems. Renew. Sustain. Energy Rev. 2020, 131, 110015. [Google Scholar] [CrossRef]
- Lu, L.; Han, X.; Jianqui, L.; Hua, J.; Ouyang, M. A review on the key issues for lithium-ion battery management in electric vehicles. J. Pow. Sour. 2013, 226, 272–288. [Google Scholar] [CrossRef]
- Hannan, M.A.; Lipu, M.S.H.; Hussain, A.; Mohamed, A. A review of lithium-ion battery state of charge estimation and management. Renew. Sustain. Energy Rev. 2017, 78, 834–854. [Google Scholar] [CrossRef]
- Liu, P.; Zhang, X. The Design of Smart Battery Management Systems. J. Comput. 2011, 6, 2484–2490. [Google Scholar] [CrossRef]
- Vitols, K. Design of an Embedded Battery Management System with Passive Balancing. In Proceedings of the 6th European Embedded Design in Education and Research IEEE, Milan, Italy, 11–12 September 2014. [Google Scholar]
- Pitorac, C. An Inside Look in The Electrical Structure of the Battery Management System Topic Number: Renewable Power Sources, Power Systems and Energy Conversion. Int. J. Technol. Res. Appl. 2015, 3, 8–12. [Google Scholar]
- Martins, D.; Kruck, A.M. Optocouplers in On-Board Chargers and Battery Monitoring Systems. 2019. Available online: https://www.vishay.com/docs/80224/applicationnote92.pdf (accessed on 13 October 2022).
- Zhou, W.; Zheng, Y.; Pan, Z.; Lu, Q. Review on the Battery Model and SOC Estimation Method. Processes 2021, 9, 1685. [Google Scholar] [CrossRef]
- Divakaran, A.M.; Minakshi, M.; Bahri, P.A.; Paul, S.; Kumari, P.; Divakaran, A.M.; Manjunatha, K.N. Rational design on materials for developing next generation lithium-ion secondary battery. Prog. Solid State Chem. 2021, 62, 100298. [Google Scholar] [CrossRef]
- Divakaran, A.M.; Hamilton, D.; Manjunatha, K.N.; Minakshi, M. Design, Development and Thermal Analysis of Reusable Li-Ion Battery Module for Future Mobile and Station-ary Applications. Energies 2020, 13, 1477. [Google Scholar] [CrossRef]
- Chaniotis, A.K.; Poulikakos, D. Modeling and optimization of catalytic partial oxidation methane reforming for fuel cells. J. Power Sources 2005, 142, 184–193. [Google Scholar] [CrossRef]


| Input Voltage of Optocoupler (Volts) | Difference | |
|---|---|---|
| 2.05 | 4100 | 61 |
| 2.1 | 4039 | 59 |
| 2.15 | 3980 | 54 |
| 2.2 | 3926 | 51 |
| 2.25 | 3875 | 61 |
| 2.3 | 3814 | 66 |
| 2.35 | 3748 | 57 |
| 2.4 | 3691 | 66 |
| 2.45 | 3625 | 66 |
| 2.5 | 3559 | … Continue |
| Charge/ Discharge | Starting/ Cut-Off | Cell 1 | Cell 2 | Cell 3 | Cell 4 | Cell 5 | Cell 6 | Cell 7 | Cell 8 | Total |
|---|---|---|---|---|---|---|---|---|---|---|
| Discharging | Starting | 4.130769 | 4.068254 | 4.005384 | 4.06666 | 4.06111 | 4.10919 | 4.10298 | 4.06951 | 32.61387 |
| Cutoff | 3.339344 | 3.244366 | 2.670313 | 3.30454 | 3.23333 | 3.27641 | 3.3022 | 3.20375 | 25.55226 | |
| Charging | Starting | 3.584058 | 3.577273 | 3.534746 | 3.55808 | 3.56102 | 3.53292 | 3.51818 | 3.52777 | 28.39408 |
| Cutoff | 4.204268 | 4.1875 | 4.109524 | 4.16095 | 4.17443 | 4.15393 | 4.11044 | 4.11214 | 33.2132 |
| Input Voltage (Vb Cell) | ADC Values | Output Voltage (Vout) | Vb Cell Vout (mV) | Relative Error (%) |
|---|---|---|---|---|
| 2.1 | 4039 | 2.101 | 1 | 0.04759638 |
| 3 | 2962 | 3.003 | 3 | 0.10987913 |
| 3.5 | 2385 | 3.502 | 2 | 0.0456934 |
| 3.8 | 2005 | 3.803 | 3 | 0.07362996 |
| 4 | 1744 | 4.004 | 4 | 0.10239505 |
| 4.2 | 1472 | 4.205 | 5 | 0.12365643 |
Publisher’s Note: MDPI stays neutral with regard to jurisdictional claims in published maps and institutional affiliations. |
© 2022 by the authors. Licensee MDPI, Basel, Switzerland. This article is an open access article distributed under the terms and conditions of the Creative Commons Attribution (CC BY) license (https://creativecommons.org/licenses/by/4.0/).
Share and Cite
Lakkireddy, G.R.; Mathe, S.E. A Strategy for Measuring Voltage, Current and Temperature of a Battery Using Linear Optocouplers. World Electr. Veh. J. 2022, 13, 225. https://doi.org/10.3390/wevj13120225
Lakkireddy GR, Mathe SE. A Strategy for Measuring Voltage, Current and Temperature of a Battery Using Linear Optocouplers. World Electric Vehicle Journal. 2022; 13(12):225. https://doi.org/10.3390/wevj13120225
Chicago/Turabian StyleLakkireddy, Gopal Reddy, and Sudha Ellison Mathe. 2022. "A Strategy for Measuring Voltage, Current and Temperature of a Battery Using Linear Optocouplers" World Electric Vehicle Journal 13, no. 12: 225. https://doi.org/10.3390/wevj13120225
APA StyleLakkireddy, G. R., & Mathe, S. E. (2022). A Strategy for Measuring Voltage, Current and Temperature of a Battery Using Linear Optocouplers. World Electric Vehicle Journal, 13(12), 225. https://doi.org/10.3390/wevj13120225