Abstract
The Dual Credit Policy is an important policy to promote the development of new energy vehicles unique to China. There is a lack of research that intuitively reflects the impact of the Dual Credit Policy on industrial development through an industry-based factual comparison of this policy. Based on the Taylor expansion and Cross-Entropy description, this article obtains the development regression function by the quantitative analysis of five indicators—the number of new energy vehicle-related patents, sales volume, production volume, the number of newly registered enterprises, infrastructure construction (the number of charging piles) before and after the implementation of the policy, and describes them quantitatively using the Taylor expansion to obtain the CPTI index. The CPCEI index is obtained by calculating the Cross-Entropy of the distribution of each indicator before and after policy implementation. The above two indices were compared for the growth trend and growth quantity, respectively. Finally, the following conclusions were obtained: 1. the Dual Credit Policy is more significantly promoted at the market level than the impact on the technical level; 2. although there is also incentive in infrastructure construction, it cannot fully react to the market demand; 3. the number of start-up’s operating in the new energy field increases, but the overall growth trend gradually slows down and fails to significantly change the existing structure of the market. This study suggests that the government should launch a special incentive policy for charging piles, and new energy manufacturers should expand their production capacity to meet the market demand.
1. Introduction
China’s Dual Credit Policy is a policy measure implemented to promote the development of New Energy Vehicles (NEVs). Its developmental timeline includes the introduction of the policy by the government in 2017, which required automobile manufacturers to ensure that a certain proportion of their total sales consisted of NEVs and set energy efficiency standards for vehicles. Subsequently, in 2019, the policy underwent modifications, further raising the requirements for manufacturers.
In 2021, the government released a new automotive industry development policy, continuing its support for the development of NEVs and announcing plans for carbon peaking and carbon neutrality aimed at further boosting the demand for NEVs. This policy plays a crucial role in the Chinese automotive market by encouraging manufacturers to increase the production and sales of NEVs. Additionally, it has significant implications for the global automotive market and the development of new energy technologies.
2. Literature Review
Research on China’s Dual Credit Policy began to gain momentum around 2018, and to date, there are relatively few studies available for reference. Prior to 2020, research on the Dual Credit Policy primarily focused on whether the government subsidies and macro support measures under this policy were excessive. For instance, researchers like Zheng Jichuan [1] found that combining research and development (R&D) subsidies with the Dual Credit Policy could enhance market mechanisms, promote technological innovation, and facilitate the healthy development of automotive companies. Shiqi Ou and others [2] studied the policy’s impact on the profits of plug-in electric vehicle companies, suggesting that pure electric cars with a range exceeding 250 km and plug-in hybrid SUVs might be popular. Some scholars also optimized the subsidies under the Dual Credit Policy [3].
In 2020, the subsidy intensity of this policy began to decrease, prompting scholars to shift their focus toward predicting the post-subsidy impact. As China’s new energy vehicle industry developed and supporting infrastructure improved, a market-driven reshuffling of enterprises ensued. Companies that had profited by deceiving the government for subsidies were gradually phased out due to low product quality. After 2020, scholars began to concentrate on demonstrating whether the Dual Credit Policy truly had a driving effect on the industry and validating it through various models. For example, Yuchao Li conducted empirical tests on the “corner overtaking theory” using a difference-in-differences (DID) model with China’s new energy vehicle industry as the research subject [4,5]. Ding Lian explored the impact of the Dual Credit Policy on production and cooperative research and development by constructing a game theory model [6]. Liu Chunling and others based their analysis on the Arrow-Karlin model, using the Hamilton function to analyze optimal control conditions for producing new energy vehicles in the context of cumulative points and carbon trading [6]. Their model was more comprehensive than others as it considered situations with no points, only points, or both points and carbon trading. Lu Chao and colleagues [7] argued that the Dual Credit Policy imposed higher requirements on the quality and energy efficiency of automotive products from the supply side. Their research considered coordination in the automotive supply chain regarding price, emissions reduction, and mileage, leading to three conclusions that provide guidance for supply chain coordination in automotive companies. Yu et al. [8] analyzed the impact of withdrawal and cumulative points on the optimal decisions of both automakers and dealers using the Stackelberg game.
To date, research on the aforementioned topics has become relatively abundant. The academic community largely agrees that the Dual Credit Policy effectively promoted the development of China’s new energy vehicle industry and strongly recommends it as a policy that other countries can emulate. However, there has been limited discussion regarding the underlying mechanisms and reasons for the policy’s effectiveness. Without a thorough study and analysis of the intrinsic logic and process by which the policy drives industry development, it may not be conducive to other countries attempting to formulate similar systems. Some scholars have conducted comparative analyses of the policy’s implementation process and industry feedback paths [9,10]. Nevertheless, these studies tend to focus on fundamental industry development logic and lack comprehensive data support and mathematical logic. To gain a more direct and clear understanding of how China’s Dual Credit Policy impacts industrial development, this study utilizes a large volume of data, condenses it into indices through mathematical modeling, and compares the indices before and after the policy’s implementation.
There are various methods for policy research, and quantifiable approaches include text analysis, cost-benefit (utility) analysis, multi-criteria decision analysis, policy simulation, and dynamic modeling, among others. Li et al. [11] employed cost-benefit (utility) analysis using Chinese publicly listed new energy vehicle companies as research samples, applying a difference-in-differences model to analyze the Dual Credit Policy based on firm heterogeneity. They analyzed changes in investment scale, intensity, and structure of new energy enterprises under this policy and found that the Dual Credit Policy significantly promoted R&D investment by new energy vehicle companies, with the growth in the scale of R&D investment being more significant than the growth in intensity. Cheng et al. [12] analyzed the production decisions of automakers under the fuel consumption credit and new energy vehicle credit systems, proposing optimizations for production decisions under the credit system. Li and Xiong [13] analyzed the dynamic changes in the operational and environmental performance of new energy vehicle enterprises under the Dual Credit Policy from the dimensions of significance, agility, and stability. They concluded that the Dual Credit Policy had released positive effects during its incubation period, with more significant and stable growth in environmental performance and more agile responses in operational performance. Lu et al. [14] introduced externalities from the field of economics and the Pirlo theory to explain the intrinsic mechanism of the Dual Credit Policy. Their research provides theoretical support for the positioning and direction of the Dual Credit Policy in the development of the new energy vehicle industry.
In existing policy research, both domestic and international scholars have proposed numerous models. Zang Wei et al. [15] conducted quantitative AI policy research using policy tools and the PMC policy evaluation model, employing text mining and content analysis methods to quantitatively analyze current AI policy texts in China. They combined this with an analysis of China’s AI research frontier trends to explore future policy development directions, providing specific and actionable recommendations for the formulation and revision of AI policies. To avoid the subjectivity of variable scoring, they used the results of policy text mining to assign values to variables based on the spatial vector model and used PMC indicator scores and PMC surface synthesis to reflect various dimensions of the policy. Although their policy quantification method is relatively traditional, it achieves multi-dimensional analysis and allows for a more comprehensive policy evaluation, making it very helpful for our research. Remal Abotah et al. [16] studied a comprehensive policy development evaluation model to assess the effectiveness of energy policy tools in increasing the adoption of renewable energy. They used a hierarchical decision model (HDM) to construct a comprehensive policy evaluation framework. Their policy evaluation model provides ideas from multiple perspectives for construction.
It can be seen that scholars have employed a wide range of models, all of which are reasonably explained. This paper proposes a new index to demonstrate the impact of policies on industrial development. The underlying logic is to approximate the coefficients of functions using the Taylor expansion method to analyze the trends in different variables. The Taylor expansion is widely used in fields such as physics, engineering, and the natural sciences [17]. It can be used to approximate the behavior of complex physical phenomena to better understand and predict experimental results. Similarly, this method has broad applicability in policy research. The Taylor expansion provides an effective tool for approximating complex industrial or economic models into simpler mathematical forms, making the analysis of policy impact more feasible. By analyzing the coefficients after Taylor expansion, researchers can understand the linear and nonlinear responses between different variables, revealing the potential impacts of policy changes. However, careful consideration of data quality and model applicability is needed, especially when policy changes are significant or nonlinear, to ensure the accuracy and reliability of the analysis.
3. Method and Proceeding
For a more concise description of the data and experiments, Table 1 presents the symbols used in this study to represent the relevant meanings.

Table 1.
Symbol representation and related meaning.
Based on previous studies on policy quantification, this study will measure the impact of the Dual Credit Policy on the development of the new energy vehicle industry in terms of technology, market, capital, and infrastructure development. The specific indicators of these aspects are the number of patents granted for new energy, the production of new energy vehicles, the sales of new energy vehicles, the registration of companies providing new energy services, and the number of charging piles. According to the relevant documents from the Ministry of Industry and Information Technology of the People’s Republic of China and combined with previous studies, 2017 is widely considered to be the first year when the Dual Credit Policy became widely known and played a role in the development of the industry, so this study looked for data from the five years before and five years after the policy was implemented, as shown in Table 2.
Table 2.
Relevant data before and after 5 years.
According to previous studies (some literature’s serial numbers), the time series data can be fitted to the time series development function of a certain indicator by regression and make a forecast of the future trend. This function can better reflect the development pattern of this indicator at that stage and is a good quantitative tool. Therefore, in this study, regression analysis is conducted separately for the above indicators before and after the policy to obtain the statistically optimal fit function. Comparing the changes of the two functions of the same indicator before and after the policy, the impact of the Dual Credit Policy on different indicators in terms of development trends can be reflected more clearly, thus illustrating the impact of the Dual Credit Policy on the overall industry.
In the comparison between the two functions before and after, this study adopts two treatments, the Taylor expansion and Cross-Entropy, for continuous functions and discontinuous point sets, respectively. The Taylor formula can expand the functions of different shapes in the form of continuous sub-polynomials of the independent variable, which serves the purpose of standardizing and unifying the description of the functions. By summing up the complex weights of different term coefficients, the eigenvalues of the growth trend of the function—i.e., the acceleration of the function change—can be effectively defined and extracted, i.e., the Taylor index of the effect of the double integration policy. Cross-Entropy is now widely used in machine learning. It is used similarly to describe the mathematical treatment of the difference between the function obtained from machine learning and the target function; the value can effectively feedback on the difference between the two and feedback to the computer to correct its learning results and make it more accurate for continuous iteration. In this study, with the help of the concept of Cross-Entropy, the changes of each index before and after the double integration policy are analyzed, and the Cross-Entropy index of the policy impact is finally obtained. It should be noted that the Cross-Entropy index of double integration policy impact is used to describe the change of indicators, while the Taylor index of double integration policy impact is used to express the change of the indicator development trend.
To facilitate statistical analysis, some necessary processing of the raw data is required. In this study, the above data are normalized and standardized according to the indicators. Further, considering the requirements of regression analysis for the dependent variable, this study uses the standardization process of determining the range, and the data interval is set to [0.2,0.8]. The formula is
The processing results are shown in Table 3.
Table 3.
Processed data.
Based on the above processing results, this study conducted regression analysis using IBM SPSS Statistics 26 data processing software and obtained ten sets of parameter estimates and function images. Based on the statistical residual sum-of-squares test, F-test, and significance test, this study selected the most appropriate function type possible to fit the ten functions of the five variables before and after the policy, and the process was as follows.
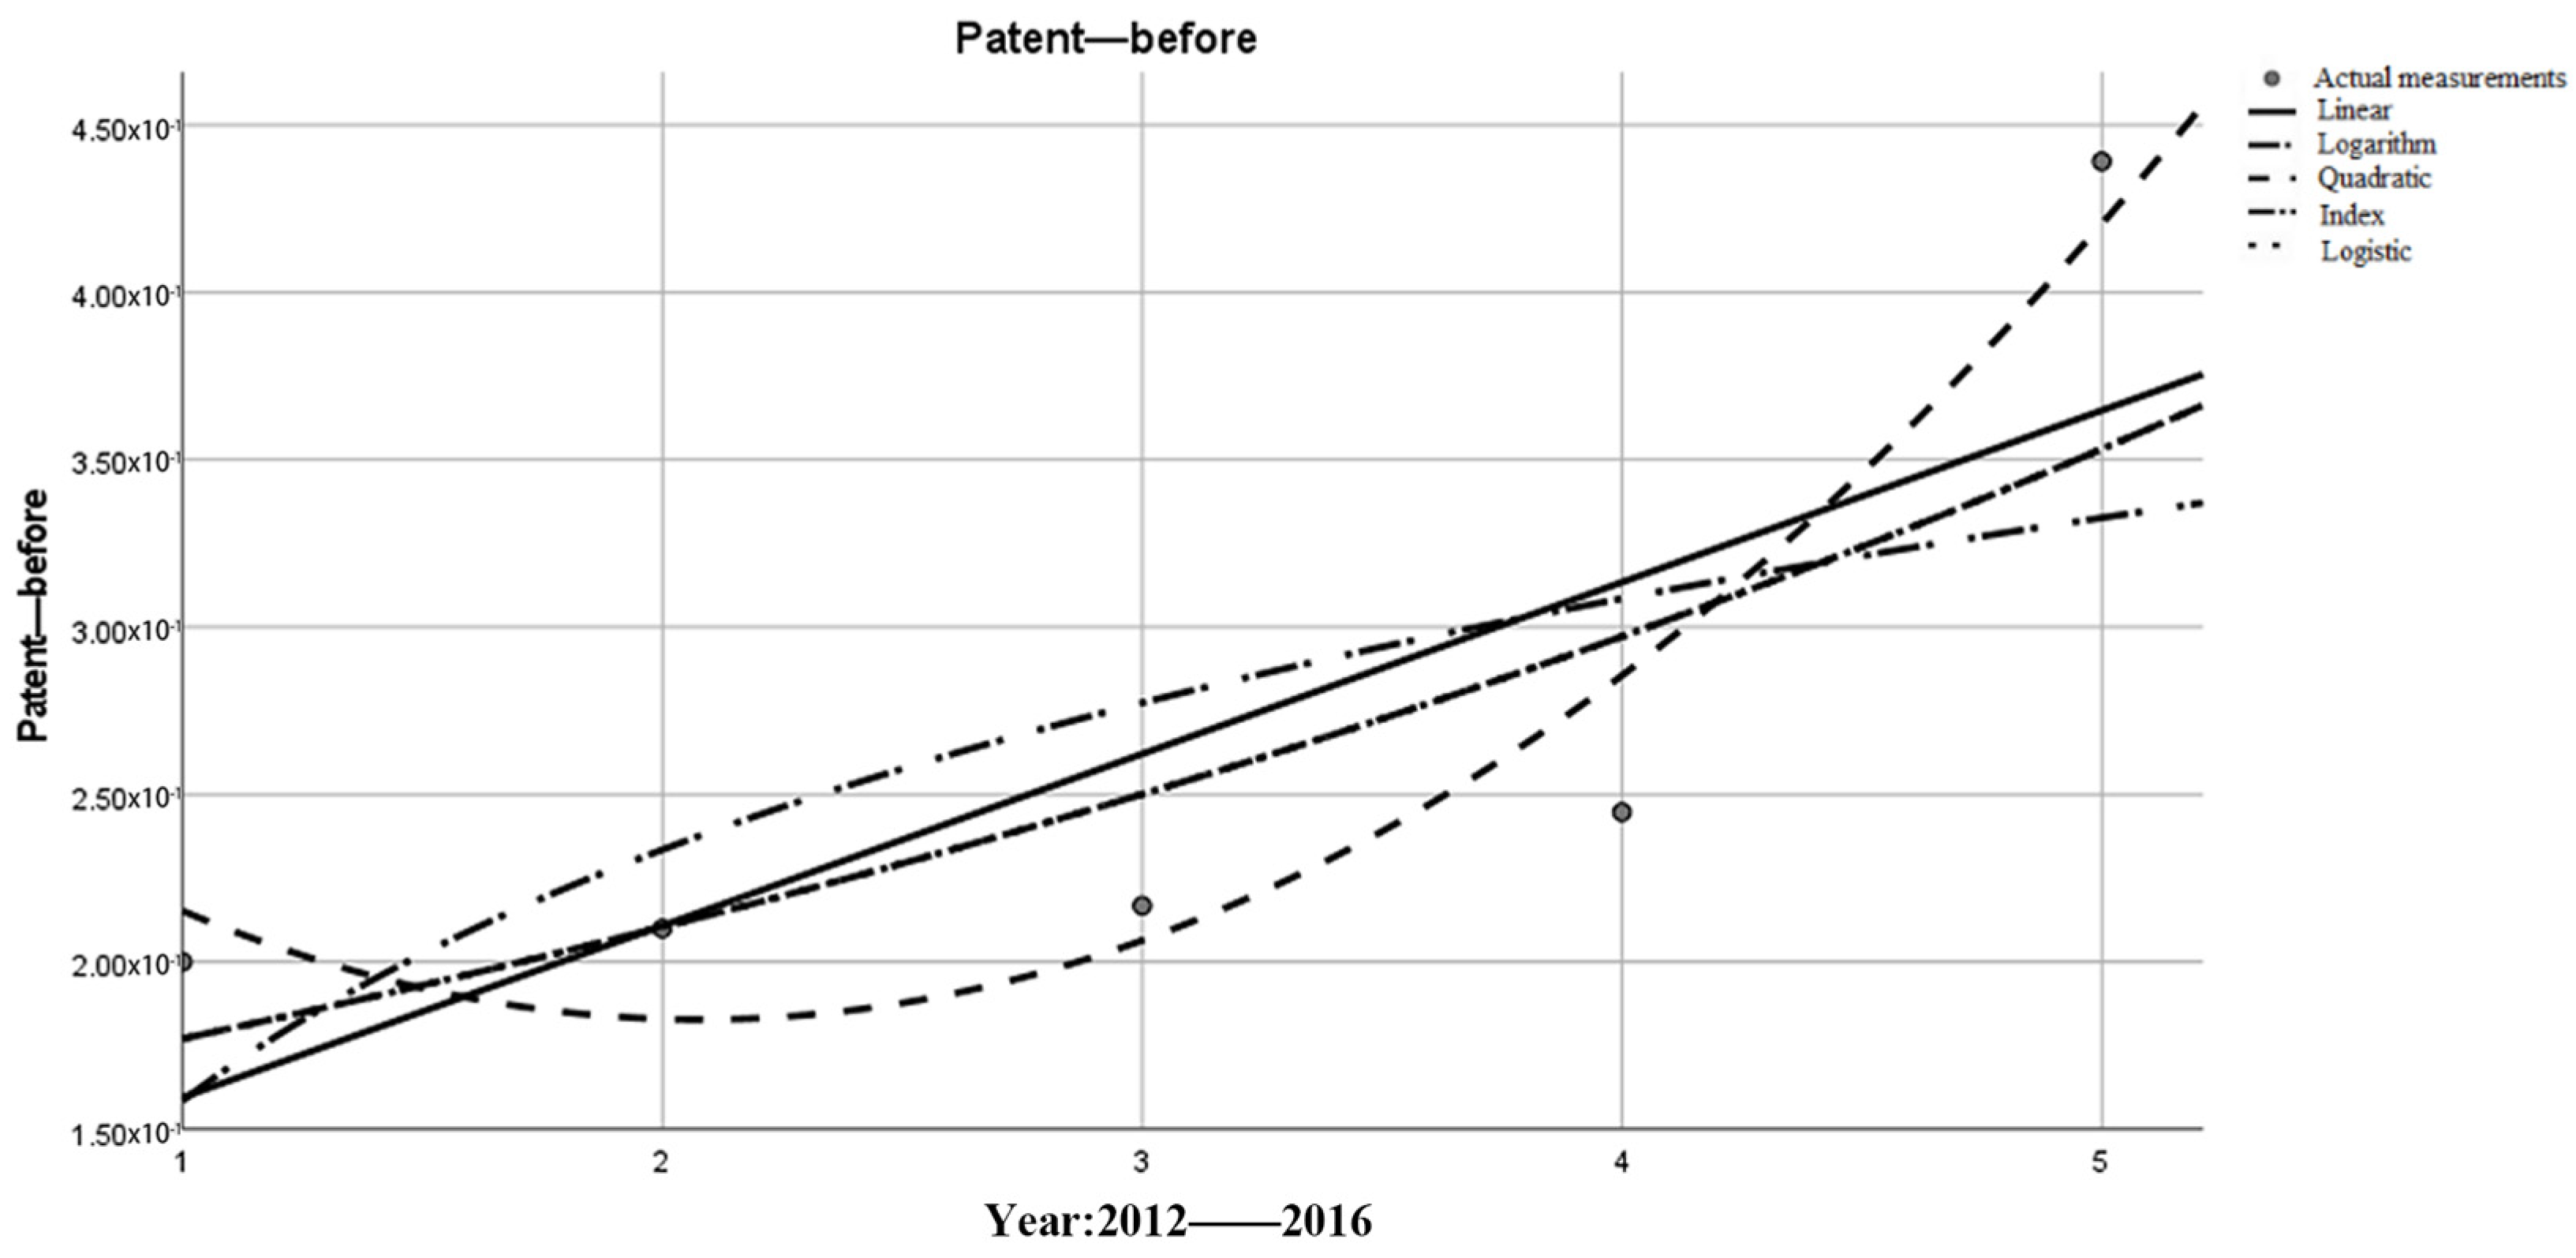
Table 4 represents the selection of the growth equation of the number of patents before the implementation of the policy.
Table 4.
Growth in the number of patents before the implementation of the policy.
Figure 1 shows a fitting function image of the changes in patent index over the five years prior to policy implementation.
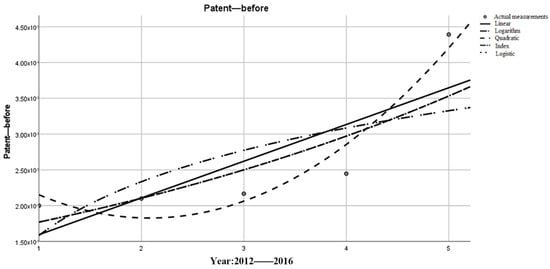
Figure 1.
Growth in the number of patents before the implementation of the policy.
According to the statistical requirements, the model with a smaller sum-of-squared residual and a larger and less significant F-test was chosen as the most suitable expression. Considered together, the exponential function was chosen as the mathematical expression in this study.
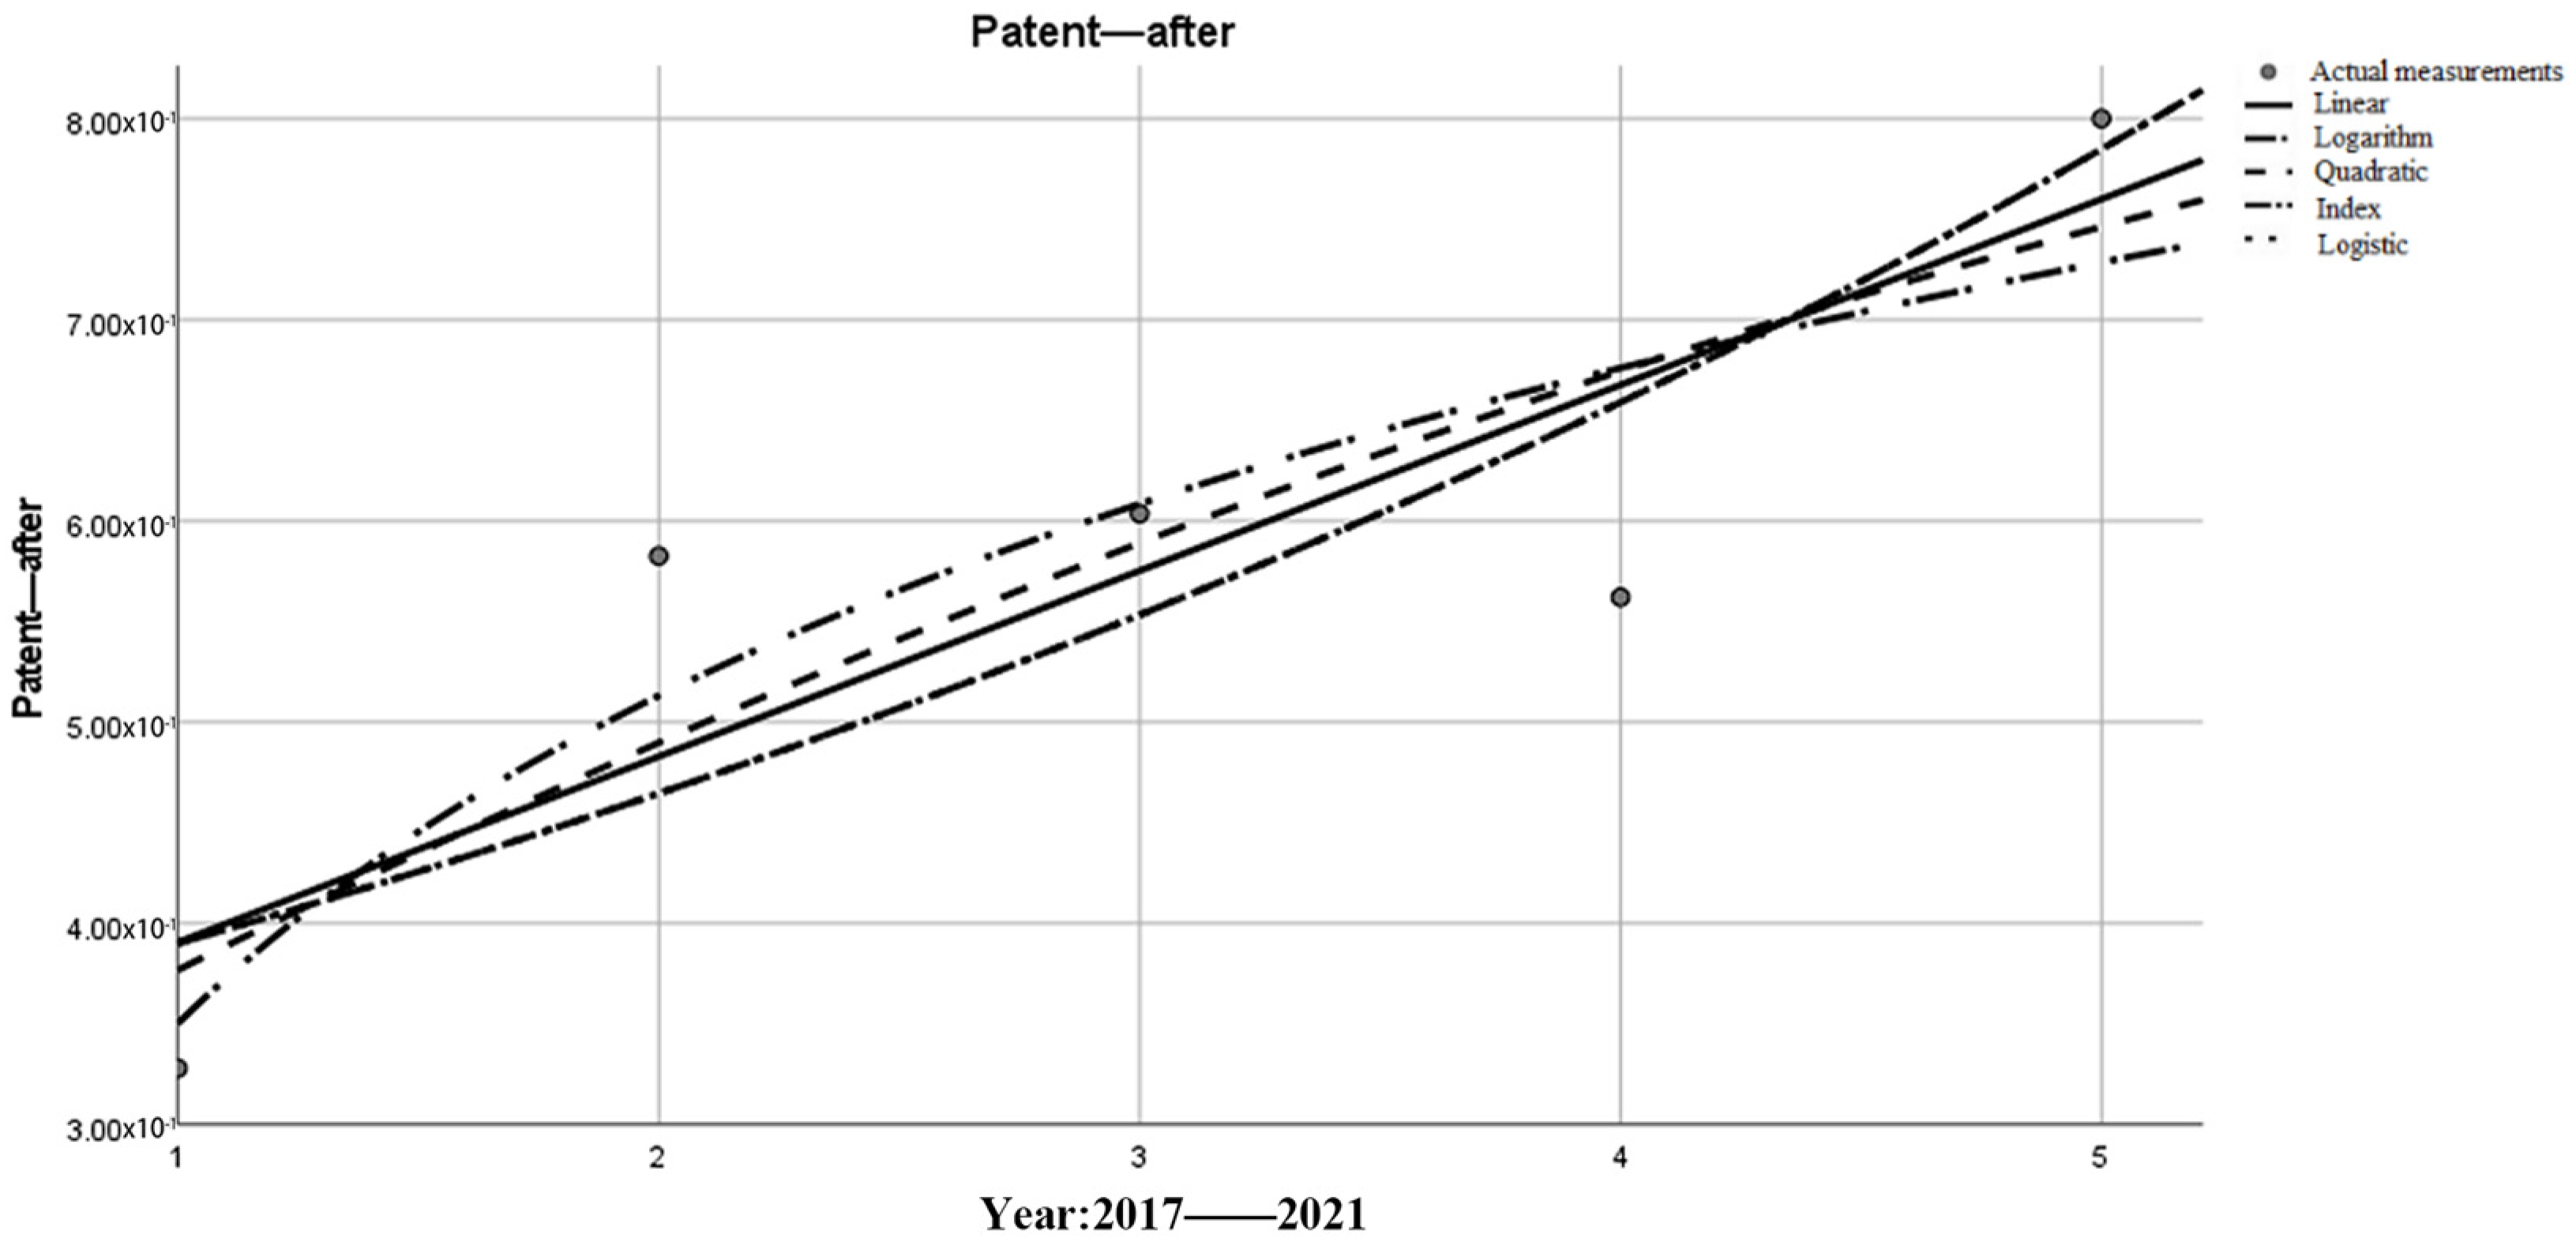
Table 5 represents the selection of the equation for the growth of the number of patents after the implementation of the policy. Figure 2 shows a fitting function image of the changes in patent index over the five years after policy implementation
Table 5.
The number of patents increased after the implementation of the policy.
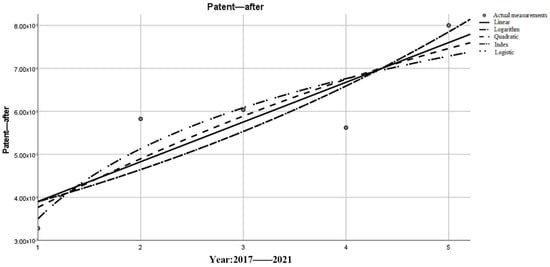
Figure 2.
The number of patents increased after the implementation of the policy.
The model with a small sum-of-squared residual and a larger and less significant F-test was chosen as the most suitable expression according to statistical requirements. Considering the influence of chance factors such as the new crown epidemic in the fourth year after the implementation of the policy, data with a large deviation from the overall trend in the fourth year are not considered. Based on this study, the exponential function was chosen as the mathematical expression.
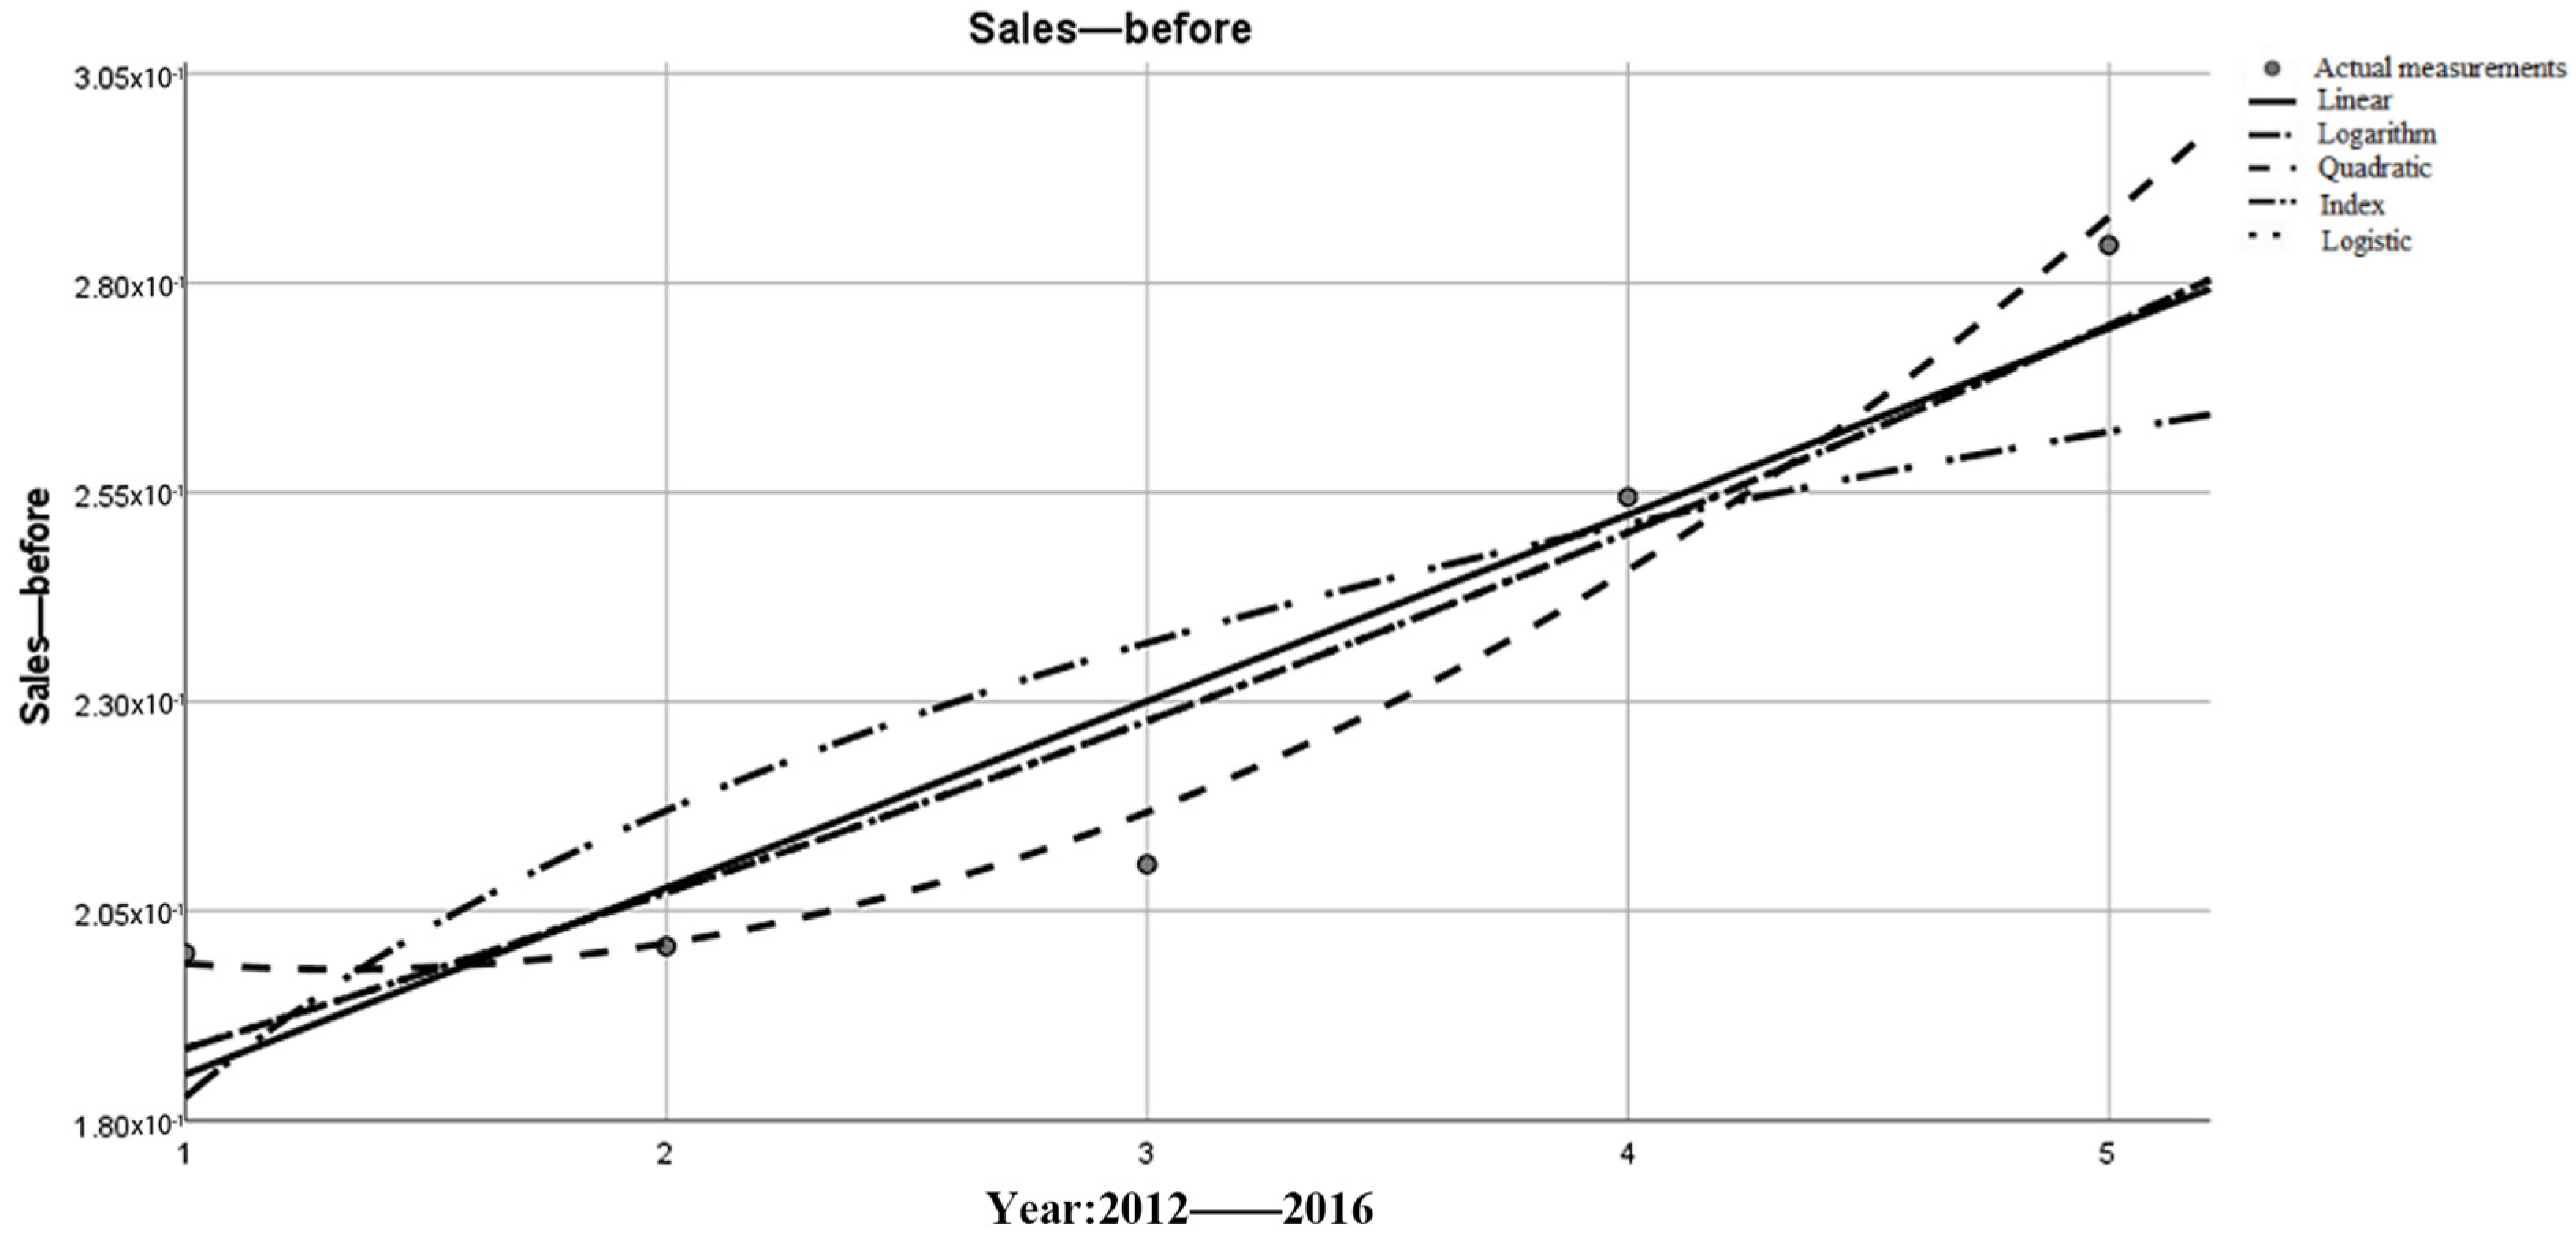
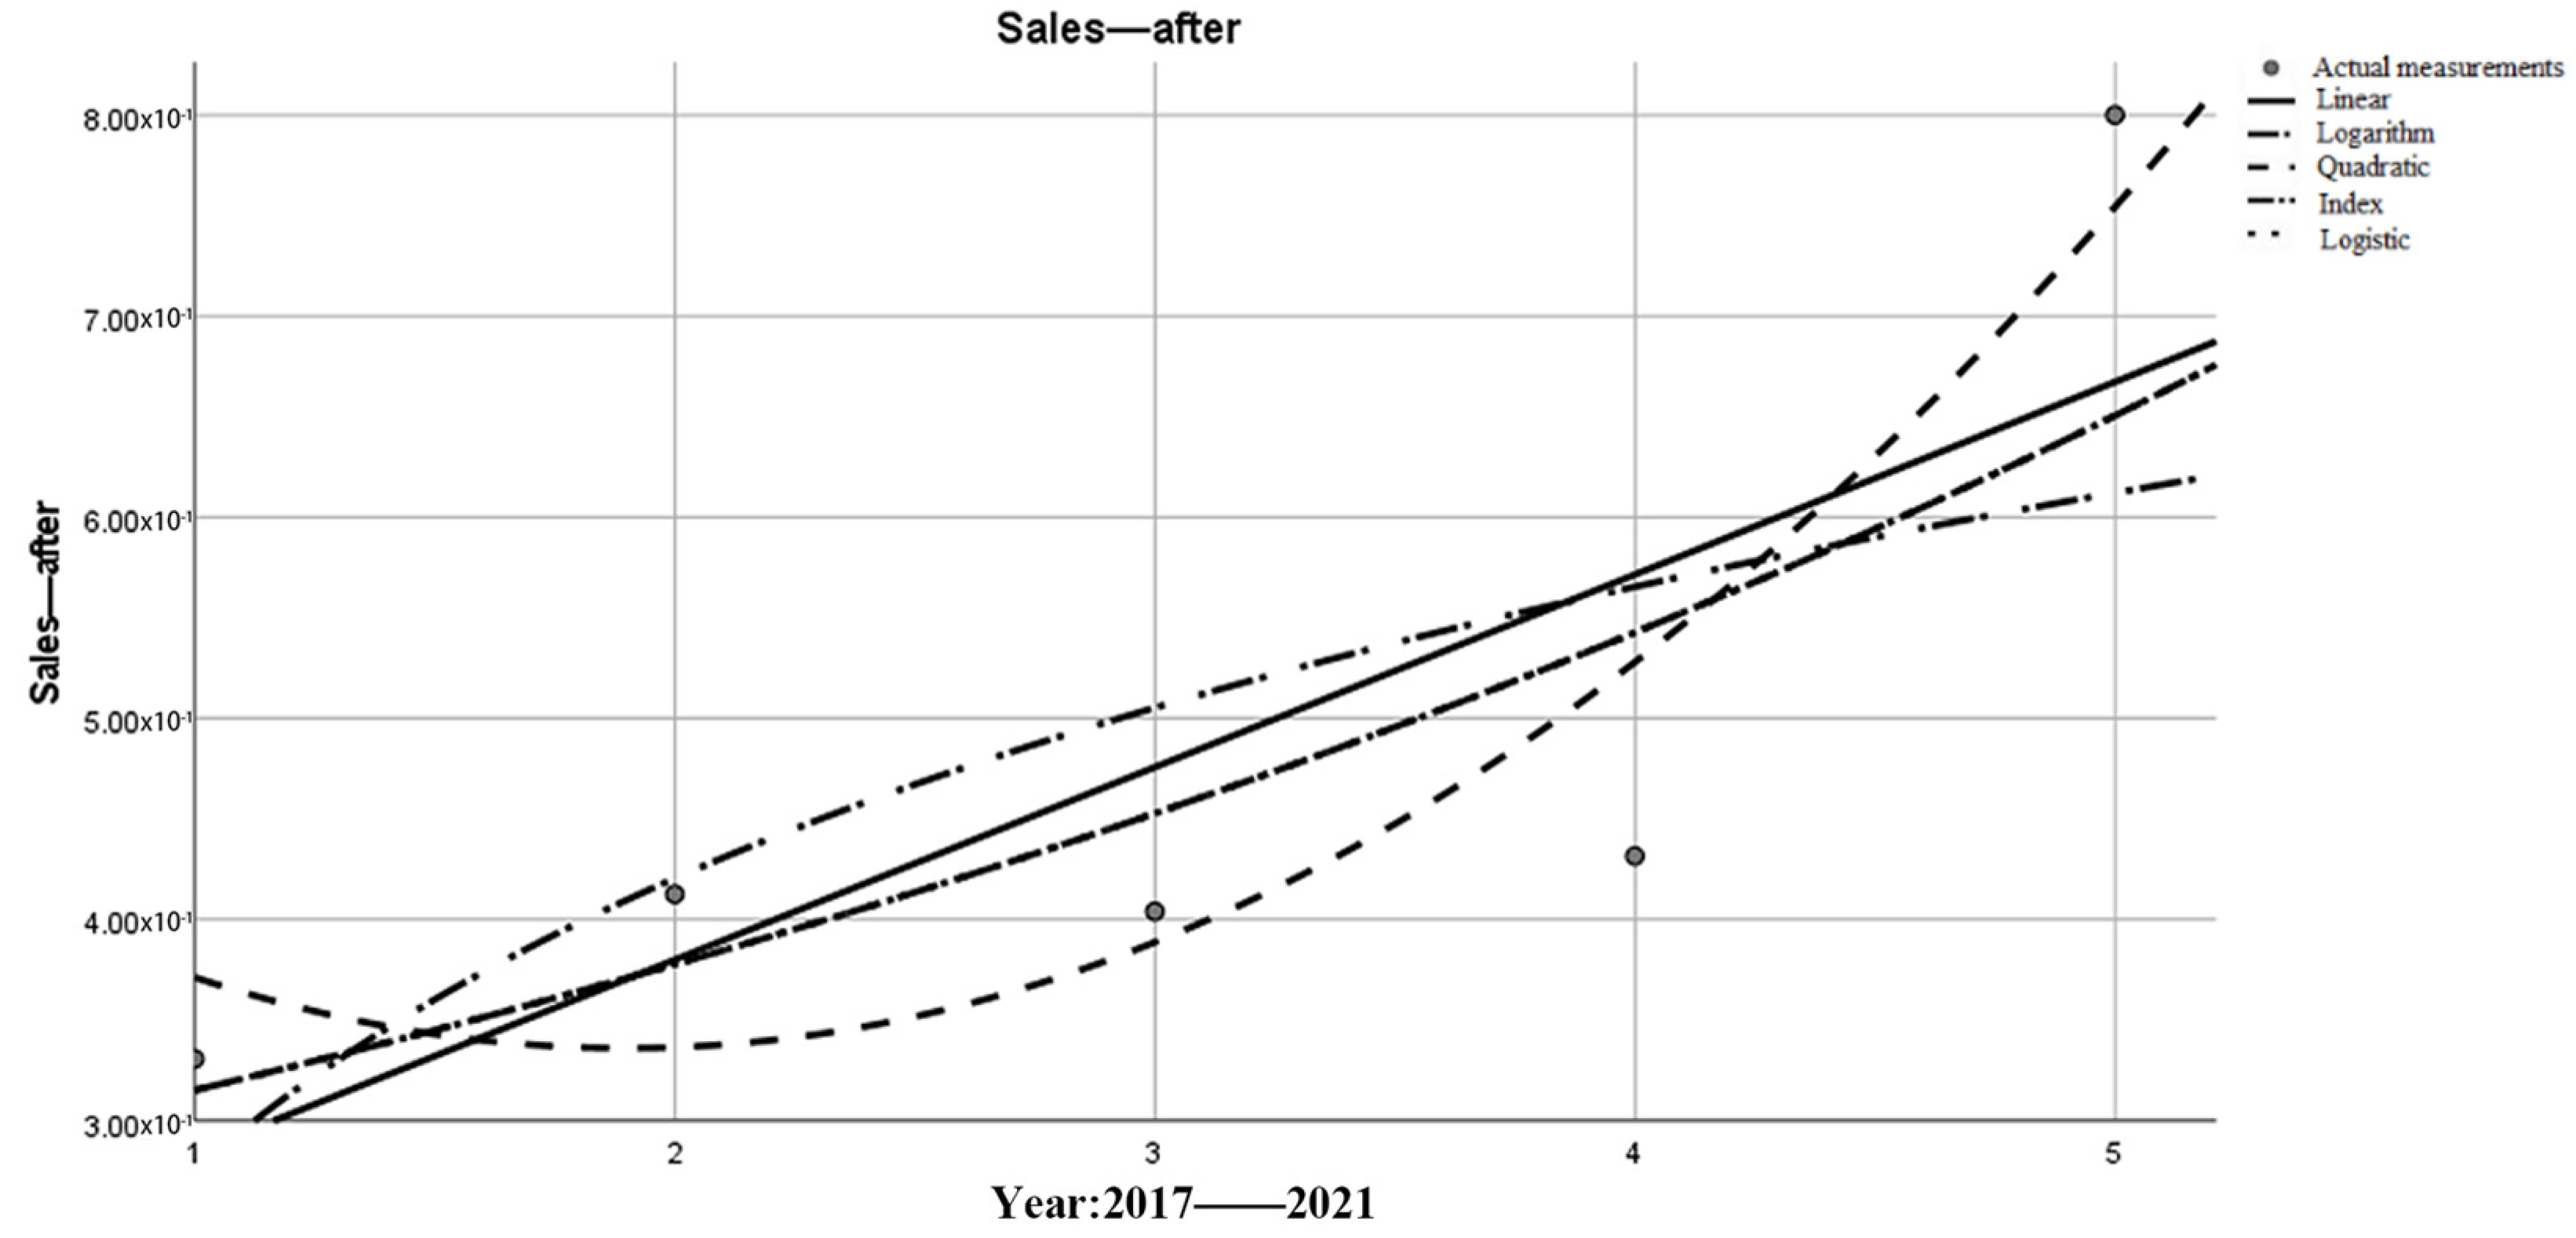
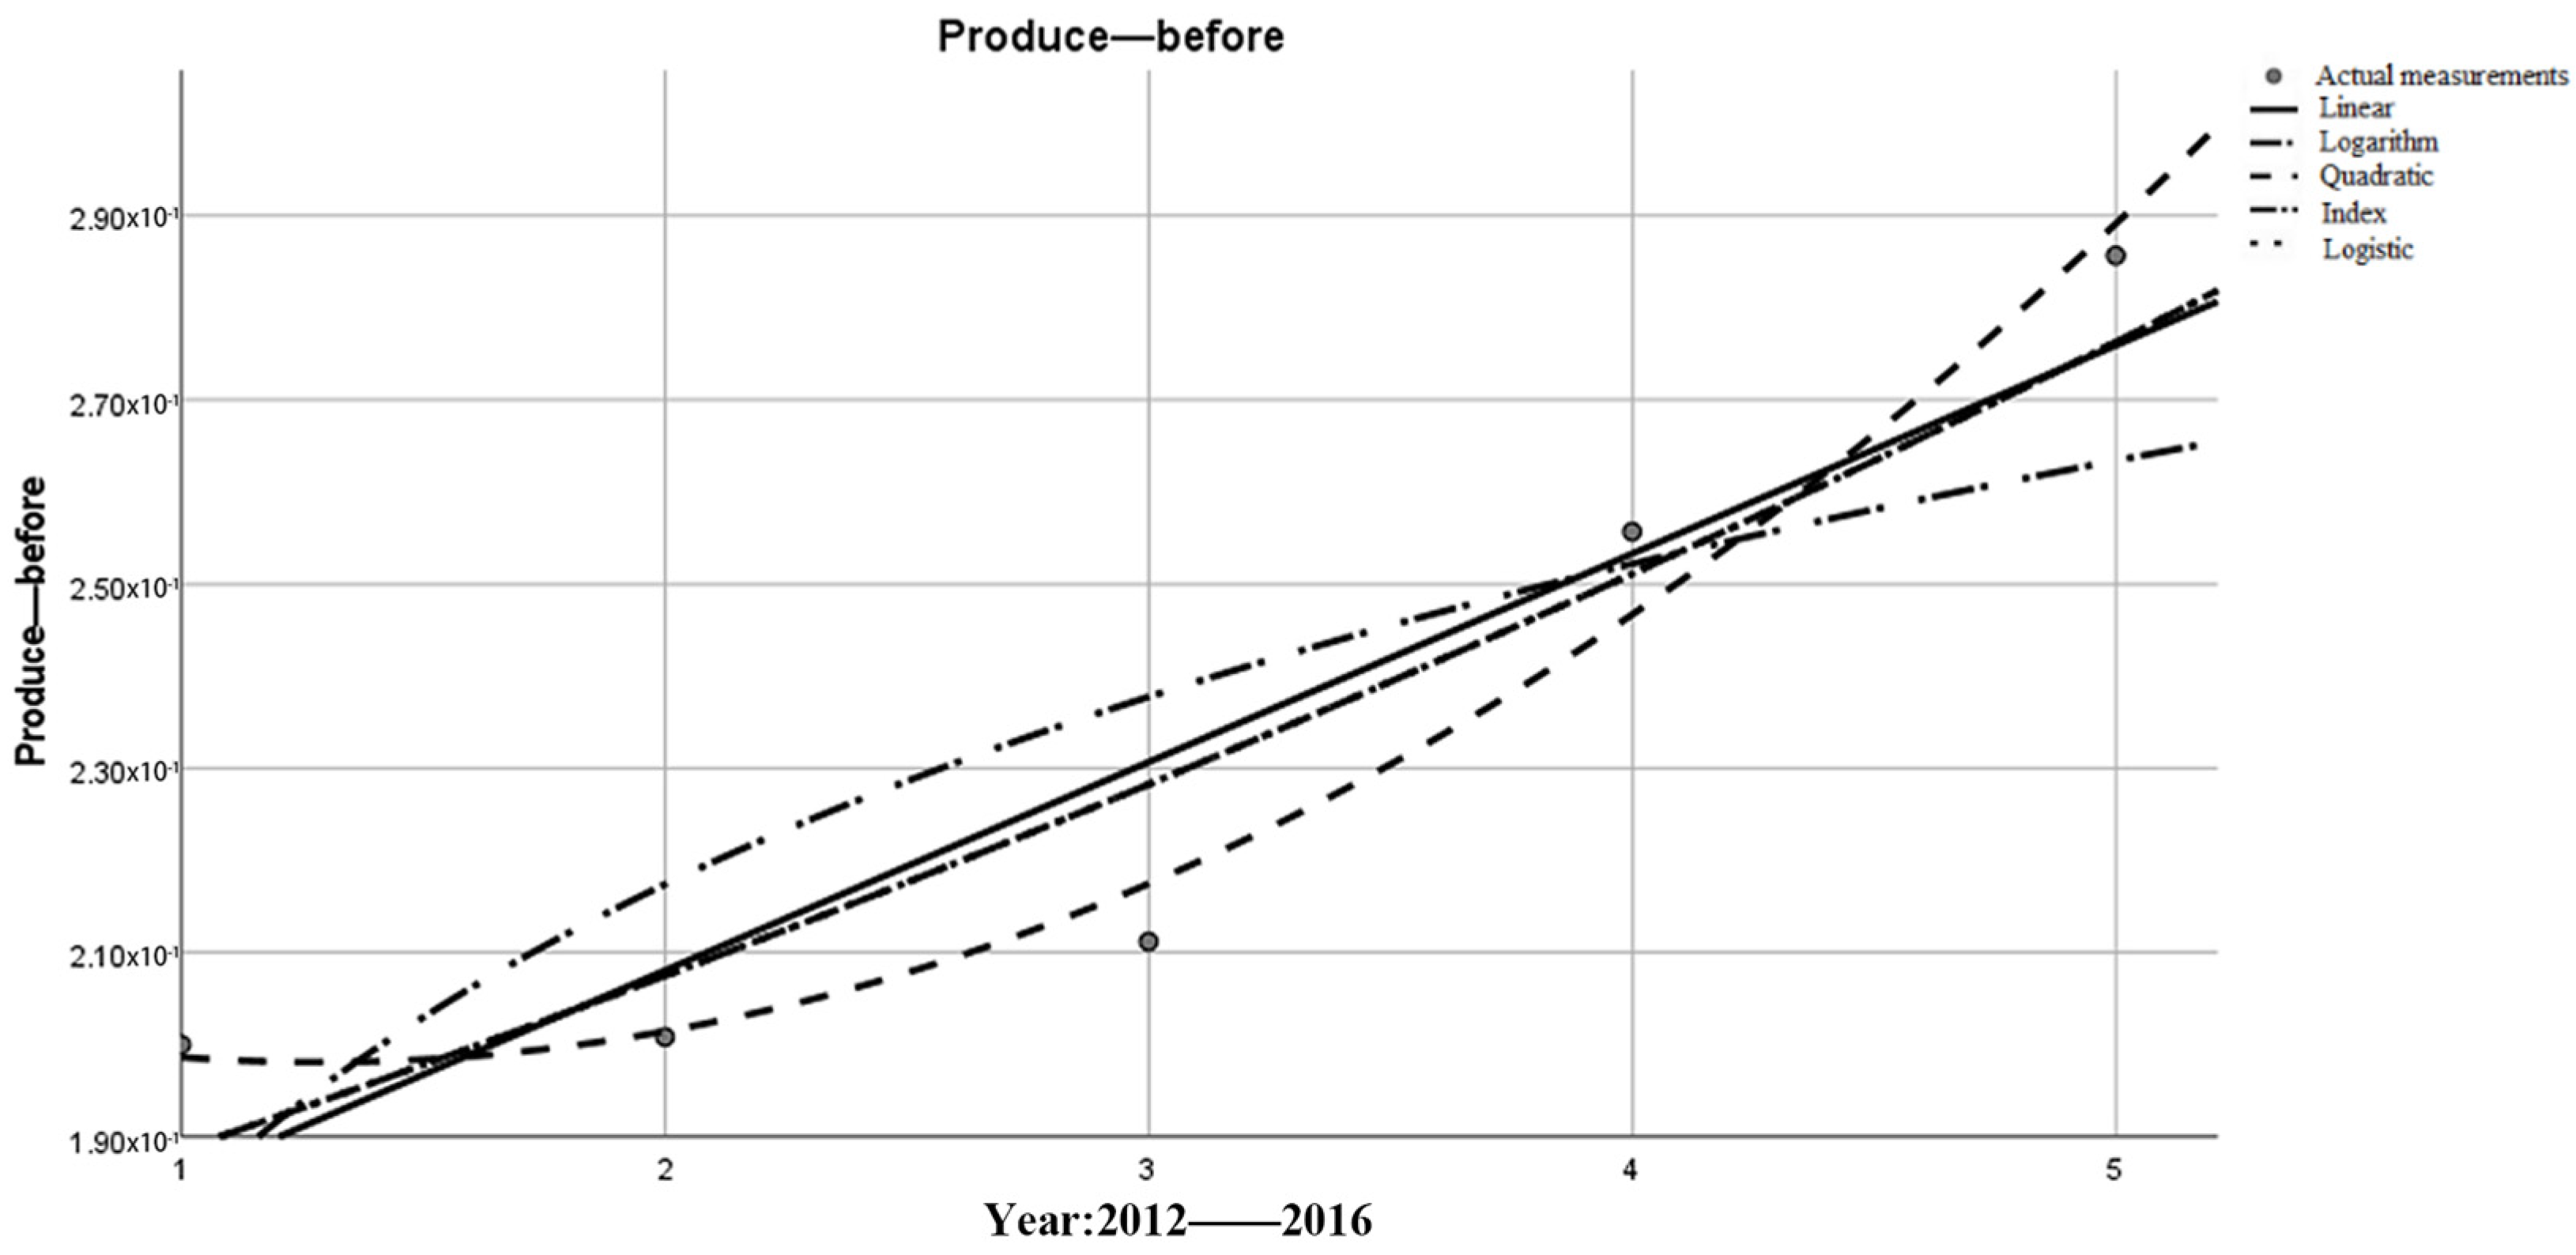
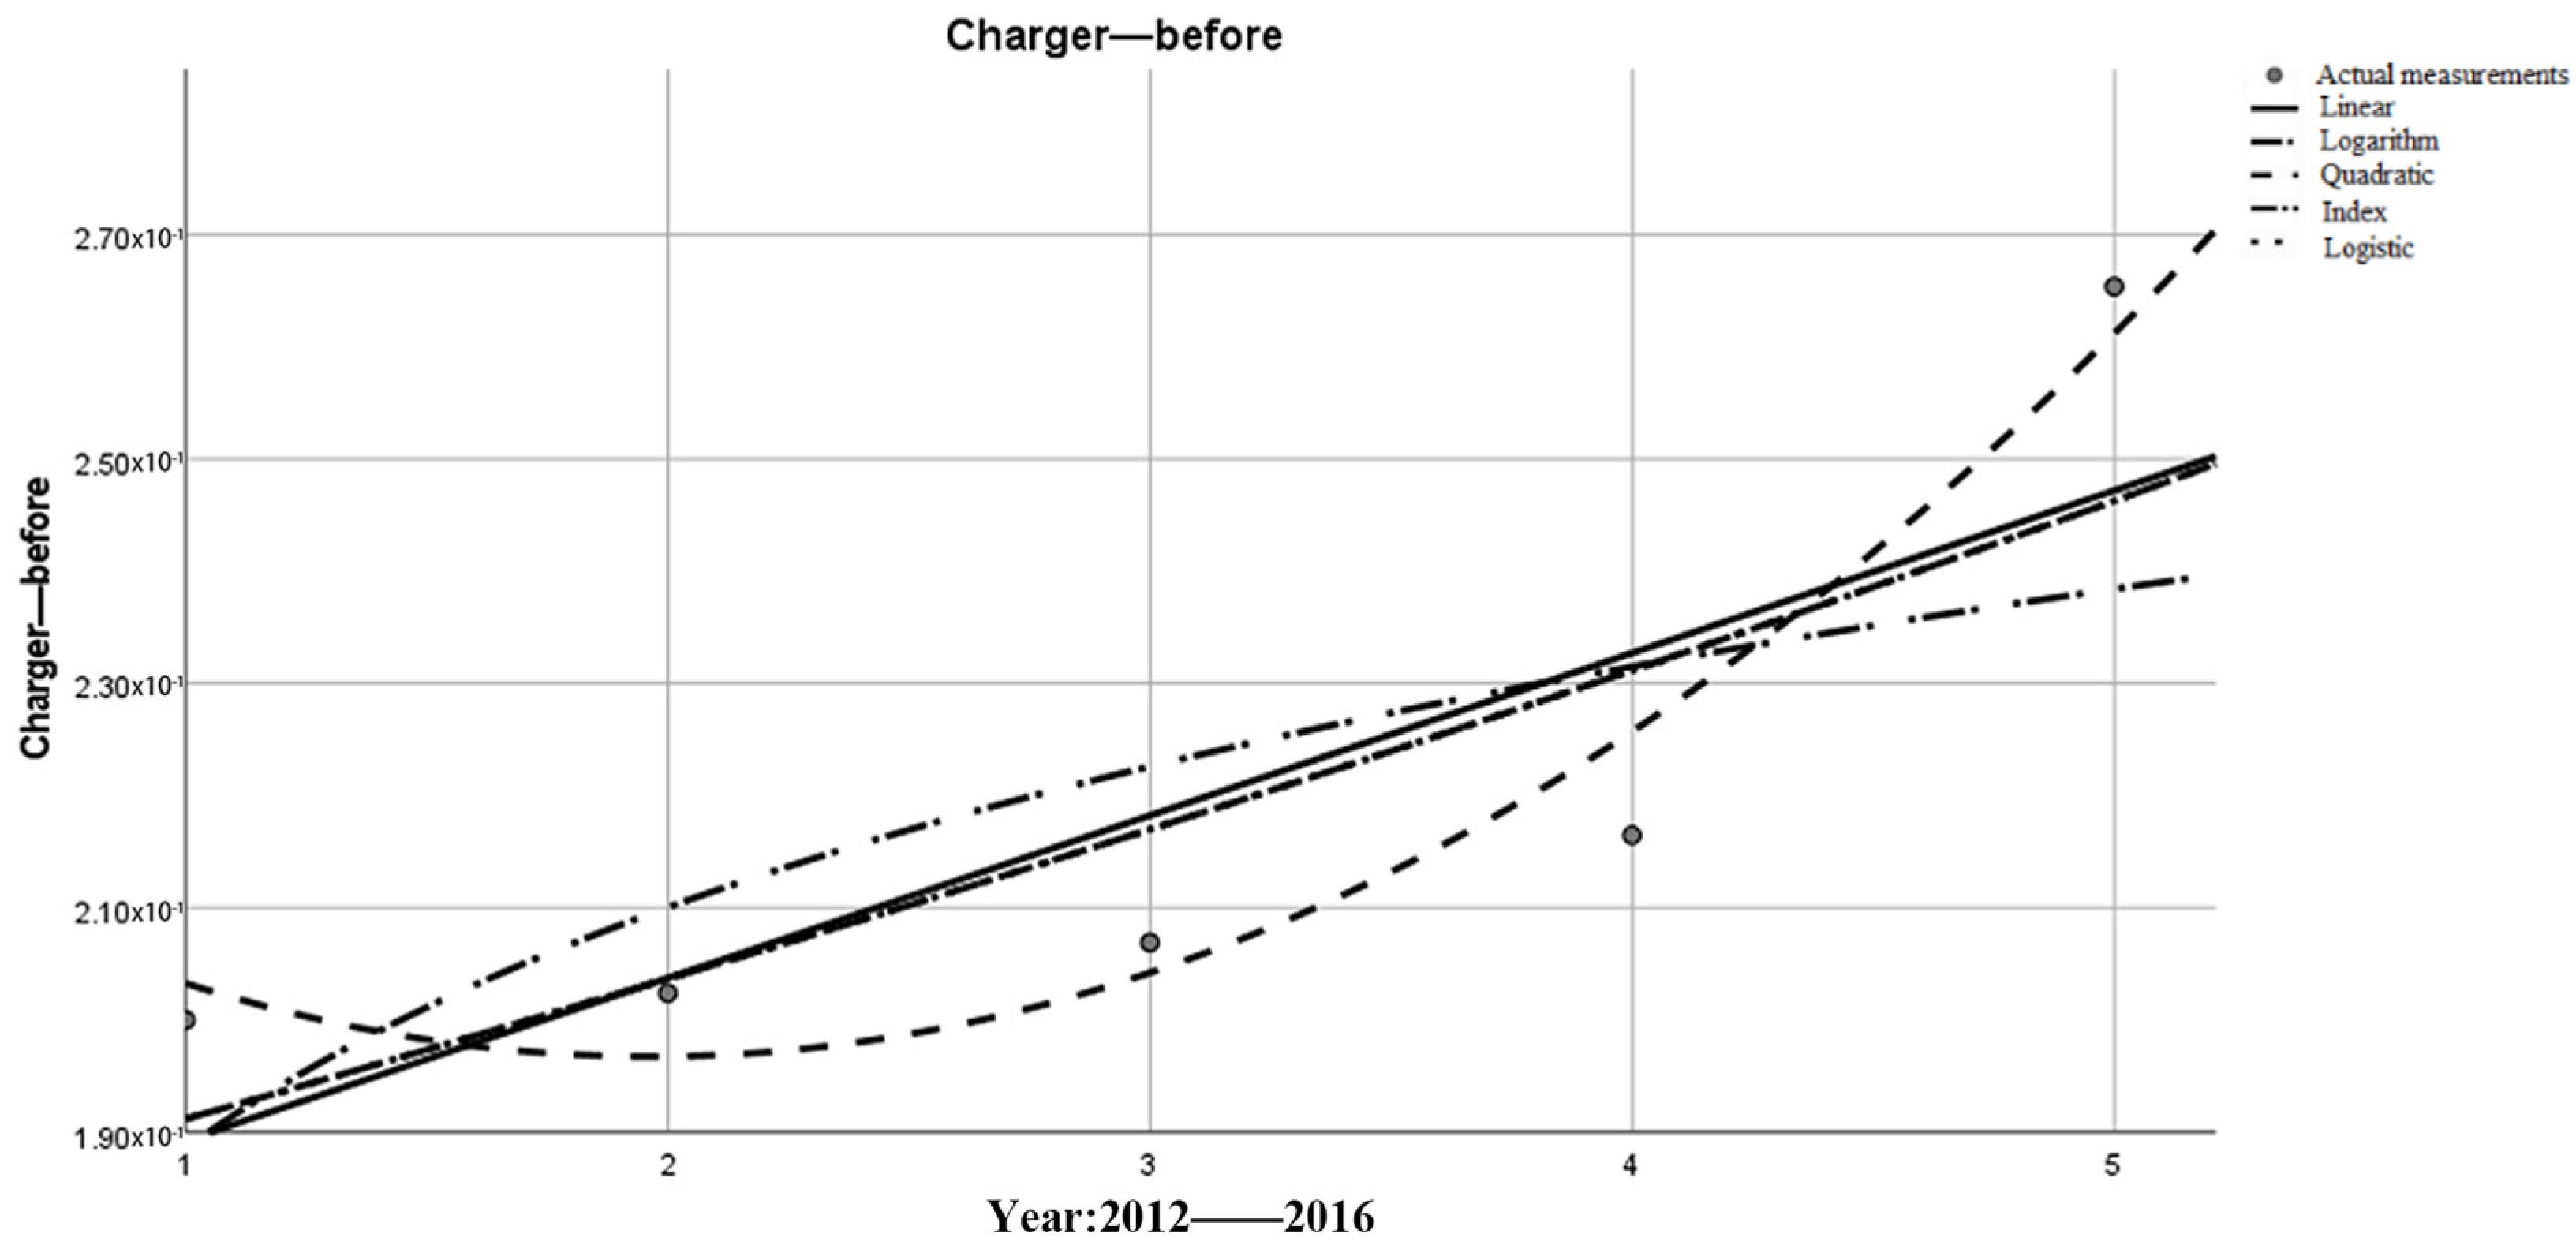
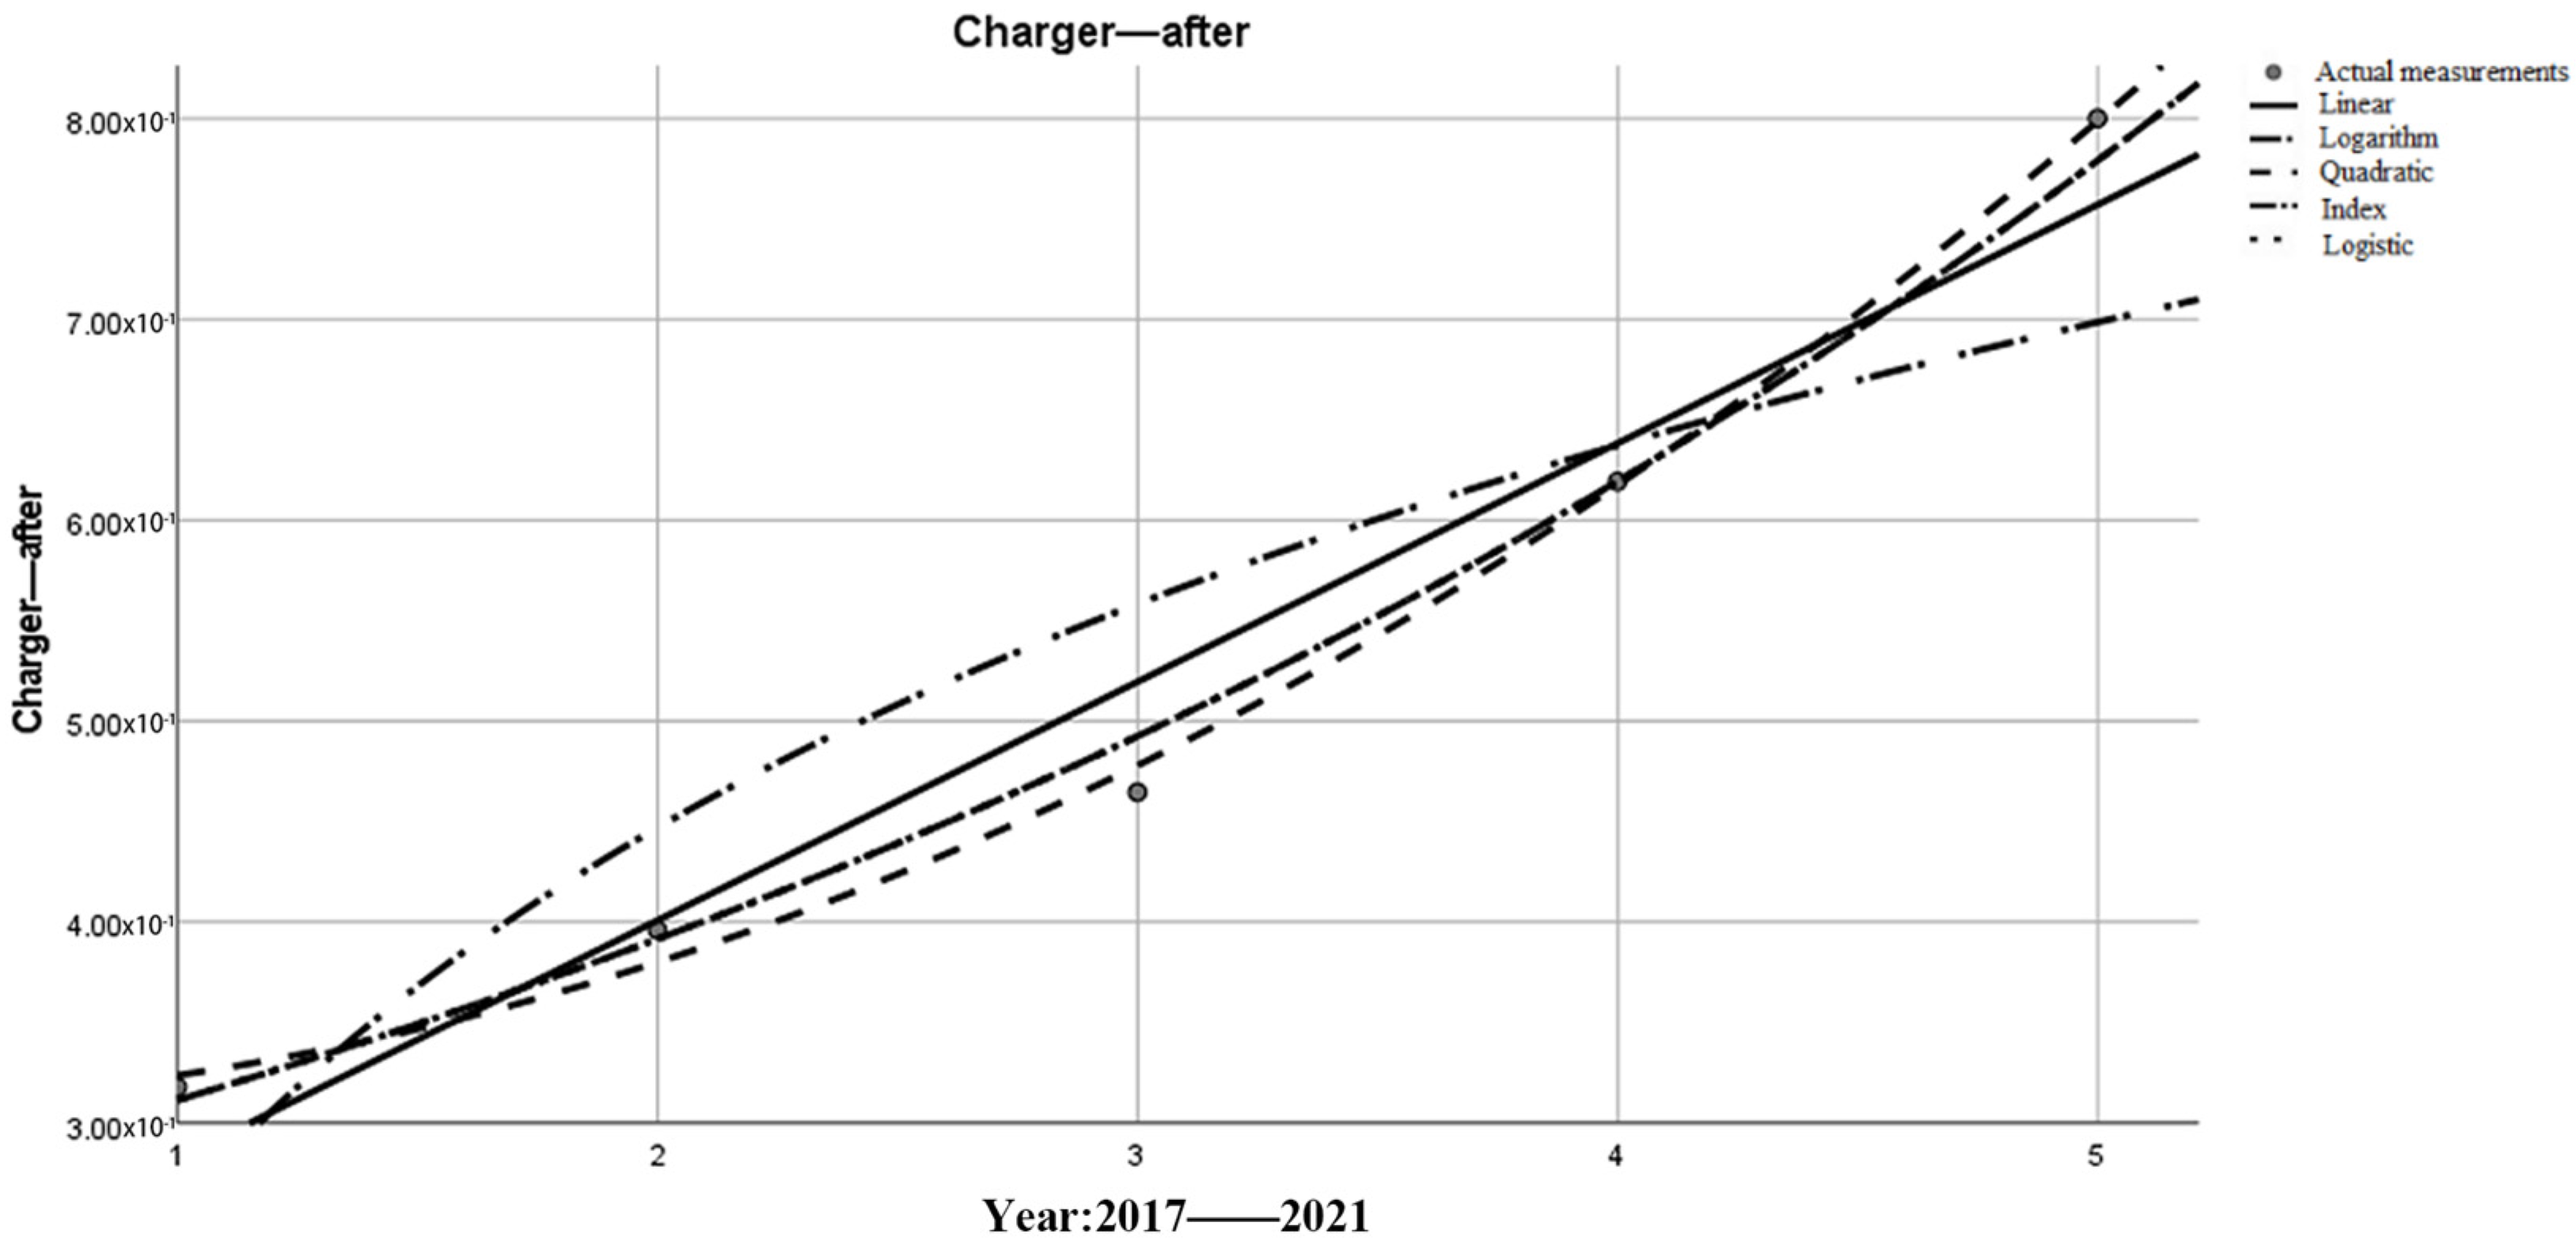
Based on the same research approach and the way the expressions are chosen, the growth in the number of new energy vehicles sold, the growth in the number of productions, the growth in the number of newly registered enterprises, and the growth in infrastructure construction (taking the growth in the number of charging piles as an example) before and after the implementation of the policy are analyzed as follows.
The data were processed to obtain the model summary and parameter estimates, respectively, to obtain the following Table 6, Table 7, Table 8, Table 9, Table 10, Table 11, Table 12 and Table 13. Figure 3, Figure 4, Figure 5, Figure 6, Figure 7, Figure 8, Figure 9 and Figure 10 show the exponential fitting functions of sales volume, production, the number of newly registered enterprises in the field, and the number of charging stations in the five years before and after the policy.
Table 6.
Pre-policy sales volume increase.
Table 7.
Increase in sales after the policy.
Table 8.
Pre-policy production growths.
Table 9.
Production growth after the policy.
Table 10.
Growth in new registrations before the policy.
Table 11.
Growth of newly registered businesses after the policy.
Table 12.
Pre-policy charging post growth.
Table 13.
Charger growth after the policy.
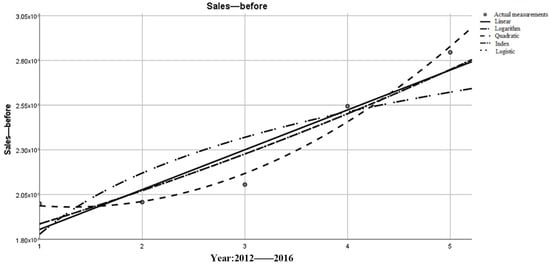
Figure 3.
Changes in sales volume in the 5 years prior to policy implementation.

Figure 4.
Changes in sales volume within 5 years after policy implementation.
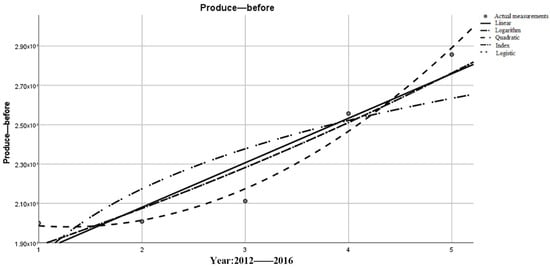
Figure 5.
Changes in production in the 5 years prior to policy implementation.
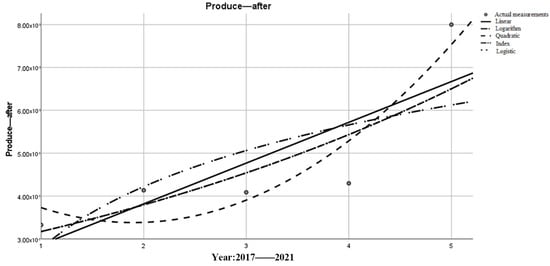
Figure 6.
Changes in production over the past 5 years after policy implementation.
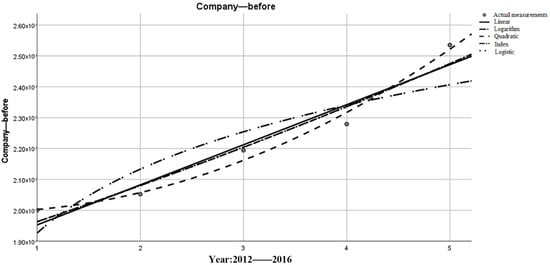
Figure 7.
Changes in the number of newly registered enterprises in relevant fields in the 5 years before policy implementation.
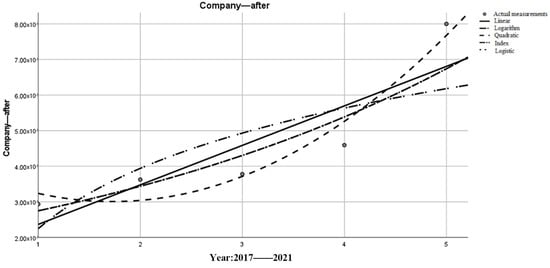
Figure 8.
Changes in the number of newly registered enterprises in relevant fields within 5 years of the implementation of policies.
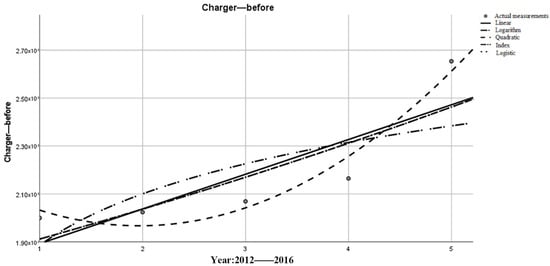
Figure 9.
Changes in the number of charging power stations in the 5 years before the implementation of the policy.

Figure 10.
Changes in the number of charging power stations in the next 5 years after the implementation of the policy.
The above data are plotted against the corresponding images and the expressions are derived in the same manner as above, and the expressions and images are shown below.
The Taylor expansions of the above ten functions were studied and calculated, the parameters of the first five orders were listed, and the following table was obtained.
Through Table 14, it can be seen that the fourth- and fifth-order coefficients are close to zero, which is also consistent with the mathematical mechanism of the Taylor expansion. The higher the order of expansion, the smaller the overall impact on the function, that is, the higher order infinitesimal in higher mathematics. In order to facilitate the calculation and to consider the different degrees of influence of different orders on the overall expression of the function, this study selects the coefficients of the first three orders of the Taylor expansion and performs the summation of the complex weights to finally obtain the relative growth indices describing the different types of influencing factors before and after the policy. The first-order compound weight is the original value, the second-order compound weight is 1/2, and the third-order compound weight is 1/3. From this data, Table 15 is obtained.
Table 14.
Taylor’s Expanded Form.
Table 15.
Empowering Taylor Unfolds.
It should be noted that the positive, negative, and magnitude of the relative growth index do not represent the actual growth because the above data are obtained through independent normalization and standardization of different factors under the influence of policies, and it can only be compared with the relative growth index of similar factors to illustrate the changes in different indicators before and after the policy change.
The relative growth indices of similar factors are compared to obtain the policy impact coefficient for a single factor, as shown in Table 16.
Table 16.
Policy Impact Factor.
Cross-Entropy is using the same set of events to measure the information about the variability between two probability distributions. In information theory, Cross-Entropy is denoted as two probability distributions, P and Q, where P denotes the true distribution and Q denotes the untrue distribution in the same set of events, where the untrue distribution Q is used to denote the average number of bits required for an event to occur. Let the two probability distributions of different indicators before and after the policy study in this study be P and Q, where P is the pre-policy distribution and Q is the post-policy distribution.
In this study, the variability of the pre-policy indicator P is expressed in terms of the post-policy indicator Q, which can be given by the following equation.
The base of the logarithmic function is chosen to be e, which is in line with the general convention of Cross-Entropy calculation, and the value reflects only the relative influence without strict requirements of taking values, as shown in Table 17.
Table 17.
Data comparison before and after the policy.
By summing the above data according to the indicator categories, the Cross-Entropy index of the impact of the Dual Credit Policy for a particular indicator is obtained, and the results are shown in Table 18.
Table 18.
Policy Impact Cross-Entropy Index.
4. Data Analysis and Interpretation
According to the formula of the policy impact Taylor index, when the value is less than 1, it means that the growth rate of the indicator has slowed down after the policy, and when the value is greater than 1, it means that the growth rate of the indicator has significantly increased after the policy implementation, and the larger the value, the faster the growth rate, which means the higher the sensitivity of the policy introduction to the indicator. According to the formula and definition of the Cross-Entropy index of policy impact, the larger the value, the more obvious the change of the indicator before and after the policy.
Observing the table, it is obvious that the Taylor index of policy influence on the sales, production, and the number of charging piles of new energy vehicles is greater than one, which indicates that the introduction of the policy has a greater incentive effect on the production of enterprises, the purchase intention of consumers, and the construction of infrastructure. According to Qiao Jiantong et al. [18], it is the above three factors that play a dominant role in industry evaluation. Therefore, this study concludes that China’s Dual Credit Policy has a greater driving effect on the development of the new energy vehicle industry.
Among the three indicators greater than one, the policy impact coefficients of sales volume and production volume are close, indicating that the policy introduction has a relatively similar driving effect on these two indicators. The number of charging piles, however, is much lower than the incentive effect on production and sales, although it also shows a significant incentive effect after the policy is introduced. With the accumulation of time, the number of new energy vehicles grows year by year, while the growth of the number of charging piles has difficulty matching the considerable number of new energy vehicles. As a result, China has experienced a significant shortage of charging piles in recent years during peak travel periods such as holidays. Further, the data results of this study are in line with what is really happening in the current usage scenario.
The results of the study also show that there was a slowdown in the growth of patents and the number of new companies formed after the policy was introduced. This does not mean that the policy has had a negative impact on industry development. First, according to Qiao Jiantong et al. [16], the weight of IPR and willingness to capital in the industry development index is small in measuring the current industry development. These two can be screened in terms of intuitive factors such as the number of patents granted and the number of new companies formed. Of course, this study does not suggest that these two are not important for the industry. According to Li Xueqing [19], intellectual property rights and willingness to invest are the basis for the development of the industry, and both are prerequisites for the formation of good products and market feedback. Therefore, there has been a lot of technology research and investment in this study even before the national Dual Credit Policy was introduced.
Comparing the difference between the two above, the policy impact coefficient of IP is closer to 1, indicating that the growth rate of patent applications has slowed down since the policy came out, but basically followed its original development trajectory. This also indicates that technology research is relatively less sensitive to policy. Scientific research is something that requires technology accumulation over a long time, meaning that generations of scientists and engineers keep innovating a little bit at a time, until its properties are stable and its development law is inherent. The number of newly established companies, on the other hand, has slowed down more significantly, with a numerical decrease of nearly 20%.
Through the comparison of the Cross-Entropy index, we can see that all indicators continue to grow after the policy, and the Cross-Entropy index of sales and production is basically the same, with sales slightly larger than production. Among them, new start-ups have, relatively, the most growth in terms of number. This data indicates that there are more entrepreneurs joining the new energy track in an attempt to gain a foothold in the market.
5. Conclusions
Overall, the Dual Credit Policy has strongly promoted the development of China’s new energy vehicle industry and can be a policy widely studied and referred to around the world. Synthesizing the results of the above research and data analysis, the following specific conclusions and recommendations can be obtained from this study.
China’s Dual Credit Policy has played an important role in promoting the development of the new energy vehicle industry, which is mainly reflected in the production capacity of enterprises, consumers’ willingness to purchase, and infrastructure construction. The output of scientific research is hardly affected by the policy in the short term. The policy offers far less incentive for infrastructure than the market needs and expects, and there will continue to be a large gap in the coming years.
The incentive of the Dual Credit Policy makes investors more willing to invest in original enterprises rather than in new enterprises, which also reduces the possibility of cheating the national policy preferences and rubbing the hot spot to rub the wind from the dimension of the capital market. The willingness of capital to invest in new energy companies is decreasing, and they are more willing to allocate resources to companies with accumulated technology and long production experience. The number of newly established companies exceeds the market needs. Further, a large part of the new energy enterprises cannot meet the market requirements, and this lack of technical production capacity will be shut down. At present, market supply and demand have basically reached equilibrium, and consumers’ purchasing power will continue to be maintained for a period of time. With the replacement of traditional fuel and vehicles, the market dividend will continue for some time.
We believe that, with the passage of time, especially after 2030, pure electric models will occupy the absolute market dominance and become the mainstream of the automotive market.
Author Contributions
Conceptualization, J.Q. and S.Y.; methodology, J.Q. and S.Y.; software, J.Q.; validation, S.Y., J.Z., H.L. and Y.F.; formal analysis, J.Q.; investigation, S.Y.; resources, S.Y.; data curation, H.L. and Y.F.; writing—original draft preparation, J.Q. and J.Z.; writing—review and editing, J.Q.; visualization, S.Y.; supervision, J.Z., H.L. and Y.F.; project administration, J.Q., H.L. and Y.F. All authors have read and agreed to the published version of the manuscript.
Funding
This research received no external funding.
Data Availability Statement
The data can be found here: https://kdocs.cn/l/ccapF7e9wtfF (accessed on: 7 July 2023).
Conflicts of Interest
The authors declare no conflict of interest.
References
- Zheng, J.; Zhao, H.; Li, Z. Research on R&D subsidies for new energy vehicle industry under Dual Credit Policy. Sci. Res. Manag. 2019, 40, 126–133. [Google Scholar] [CrossRef]
- Ou, S.; Lin, Z.; Qi, L.; Przesmitzki, S. The dual-credit policy: Quantifying the policy impact on plug-in electric vehicle sales and industry profits in China. Energy Policy 2018, 121, 597–610. [Google Scholar] [CrossRef]
- Zhu, Y. Optimization of Subsidy Strategies for the New Energy Vehicle Supply Chain under the Dual Credit Policy. Master’s Thesis, Qingdao University, Qingdao, China, 2020. Available online: https://kns.cnki.net/KCMS/detail/detail.aspx?dbname=CMFD202101&filename=1020384579.nh (accessed on 16 June 2020).
- Li, W.; Dai, L.; Guo, B.; Wu, S. Cooperative Innovation Game Analysis of Upstream and Downstream Enterprises in the New Energy Vehicle Industry under the Composite Traction Mechanism in the Post-Subsidy Era. Soft Sci. 2021, 35, 81–88. [Google Scholar] [CrossRef]
- Li, Y.; Zhang, L.; Liu, J.; Qiao, X. Can the Dual-Credit Policy Help China’s New Energy Vehicle Industry Achieve Corner Overtaking? Sustainability 2023, 15, 2406. [Google Scholar] [CrossRef]
- Liu, C.-L.; Zhao, L.; Li, J.; Gao, M.-Y.; Deng, X.-D. Analysis of New Energy Vehicle Production Decision Based on Optimal Control in the Context of Considering Cumulative Points and Carbon Trading. Comput. Integr. Manuf. Syst. 1–18. Available online: http://kns.cnki.net/kcms/detail/11.5946.TP.20220317.2003.005.html (accessed on 8 April 2022).
- Lu, C.; Wang, Q.; Chen, Q. Supply chain coordination of vehicles considering price, emission reduction, and range under the Dual Credit Policy. Syst. Eng. Theory Pract. 2021, 41, 2595–2608. [Google Scholar]
- Yu, X.H.; Ye, Z.X.; Li, M. Optimization analysis of two-level supply chain production decision under subsidy withdrawal-Dual Credit Policy. Oper. Res. Manag. 2021, 30, 42–49. [Google Scholar]
- Zhao, D. A Comparison and Implications of Development Policies for the New Energy Vehicle Industry in China and the United States. Knowl. Action 2021, 1, 45–48. [Google Scholar] [CrossRef]
- Rao, Y.; Shu, T. Analysis of Technological Innovation Behavior of New Energy Vehicle Enterprises Based on China’s Dual-Credit Policy. Manag. Rev. 2023, 35, 74–85+111. [Google Scholar] [CrossRef]
- Li, X.; Xiong, Y.Q. Analysis of the Impact of Dual Credit Policy on R&D investment of new energy vehicle enterprises. Sci. Res. 2021, 39, 1770–1780. [Google Scholar] [CrossRef]
- Cheng, Y.W.; Mu, D. Production decision optimization of automobile manufacturers under cumulative points system. Syst. Eng. Theory Pract. 2018, 38, 2817–2830. [Google Scholar]
- Li, X.; Xiong, Y.Q. Stages of the impact of the Dual Credit Policy on new energy vehicles from the perspective of both operational and environmental performance. Resour. Sci. 2021, 43, 1–11. [Google Scholar]
- Lu, Y.; Chen, H.; Liu, J. Analysis of the economic impact of the Dual Credit Policy on the development of China’s new energy vehicle industry. Chin. Foreign Entrep. 2019, 9, 121–122. [Google Scholar]
- Zang, W.; Zhang, Y.; Xu, L. A quantitative study of China’s artificial intelligence policy text--the current state of policy and frontier trends. Sci. Technol. Prog. Countermeas. 2021, 38, 125–134. [Google Scholar]
- Abotah, R.; Daim, T.U. Towards building a multi-perspective policy development framework for transition into renewable energy. Sustain. Energy Technol. Assess. 2017, 21, 67–88. [Google Scholar] [CrossRef]
- Blaszczyk, M.; Jantos, D.R.; Junker, P. Application of Taylor series combined with the weighted least square method to thermodynamic topology optimization. Comput. Methods Appl. Mech. Eng. 2022, 393, 114698. [Google Scholar] [CrossRef]
- Qiao, J.; Yang, S.; Chen, Z.; Zhuang, Z.; Chen, L. A quantitative study of policy-driven changes and forecasts in the development of the hydrogen transportation industry. Energy Rep. 2022, 8 (Suppl. 4), 1218–1225. [Google Scholar] [CrossRef]
- Li, X. Scientific and Technological Progress, Economic Growth and Hilbert Space; People’s Publishing House: Beijing, China, 2014. [Google Scholar]


Disclaimer/Publisher’s Note: The statements, opinions and data contained in all publications are solely those of the individual author(s) and contributor(s) and not of MDPI and/or the editor(s). MDPI and/or the editor(s) disclaim responsibility for any injury to people or property resulting from any ideas, methods, instructions or products referred to in the content. |
© 2023 by the authors. Licensee MDPI, Basel, Switzerland. This article is an open access article distributed under the terms and conditions of the Creative Commons Attribution (CC BY) license (https://creativecommons.org/licenses/by/4.0/).