Article

Realistic Approach to Safety Verification of Electric Tricycle in Thailand

by
Songwut Mongkonlerdmanee
1,
Sthaphorn Wannapor
1,
Pichest Boonyalai
1,
Saharat Chanthanumataporn
2,
Manus Dangchat
2 and
Saiprasit Koetniyom
2,*
1
Faculty of Engineering, Rajamangala University of Technology Phra Nakhon, Bangkok 10800, Thailand
2
Automotive Safety and Assessment Research Centre, The Sirindhorn International Thai-German Graduate School of Engineering, King Mongkut’s University of Technology North Bangkok, Bangkok 10800, Thailand
*
Author to whom correspondence should be addressed.
World Electr. Veh. J. 2023, 14(7), 164; https://doi.org/10.3390/wevj14070164
Submission received: 29 April 2023 / Revised: 7 June 2023 / Accepted: 21 June 2023 / Published: 23 June 2023
(This article belongs to the Special Issue Development towards Vehicle Safety in Future Smart Traffic Systems)

Abstract

:
A Tuk-tuk, also known as a motorized tricycle, is a three-wheeled vehicle with wheels symmetrically arranged in the longitudinal driving direction. Compared to four-wheeled vehicles, tuk-tuks have less stability. Classical Tuk-tuks typically have a metal occupant compartment without doors, resulting in direct contact between occupants and the metal structure. In tropical countries with heavy rainfall, flooded roads are common. This study proposes technical requirements specific to electric Tuk-tuks, which are gaining popularity in Thailand. Experimental tests focused on braking performance, rollover stability, and electric safety prevention. The tests addressed four aspects: brake performance, parking capability, rollover stability, and electric isolation resistance during floods. These tests help manufacturers meet Thai safety standards. Results emphasize the importance of adhering to Tuk-tuk standards for vehicle performance and electric safety.

1. Introduction

The auto rickshaw, or simply rickshaw, is a popular mode of transportation in many countries, particularly in Asia. It is a motorized three-wheeled vehicle that typically features a motorcycle or scooter-like engine and a passenger compartment or a small open cabin at the rear. Auto rickshaws are widely utilized for short-distance travel within cities and towns. However, the name of this vehicle varies across countries, such as auto rickshaw or Auto in India, Bajaj or Becak in Indonesia, Qingqi or Chingchi in Pakistan, Toktok in Egypt, and Tuk-tuk in Thailand. In Thailand, Tuk-tuks have become cultural icons and symbolic representations of the country. While Tuk-tuks offer convenience and affordability, they also encounter certain challenges. Safety concerns arise due to their relatively low stability compared to four-wheeled vehicles, particularly at high speeds [1]. Additionally, older models that utilize two-stroke engines contribute to air pollution and noise pollution.
In terms of pollution, the transportation sector is considered the second-largest contributor to greenhouse gas emissions, which contribute to global climate change [2]. Therefore, one solution to mitigate this problem is the electrification of fossil fuel vehicles [3]. Electrified Tuk-tuks offer several benefits, including improved performance [1] and the elimination of noise pollution. However, safety concerns still persist due to the lack of structural changes. The Global Plan for the Decade of Action for Road Safety 2021–2030 recommends that Tuk-tuks should adhere to safety standards to ensure consistent and acceptable requirements [4]. The number of injuries and fatalities involving motorized tricycles in Thailand from 1 January 2015 to 9 November 2021 was 6139 cases [5], highlighting the significant safety concerns associated with these vehicles. However, currently, there are no specific standards to evaluate the safety of electric Tuk-tuks, particularly regarding the risk of electrocution.
The goal of vehicle safety is to minimize the likelihood of accidents and ensure the protection of drivers, passengers, and other road users [6]. Vehicle safety requirements are typically established through valid regulatory acts, taking into account customer needs. The concept of vehicle safety can be categorized into two main areas: active safety and passive safety. Active safety aims to prevent accidents from occurring, while passive safety focuses on minimizing the consequences of an accident. Despite the numerous studies on the safety of three-wheeled vehicles [1,7,8,9], only certain safety components are required to meet the technical requirements specified by regulatory acts [6]. These technical requirements encompass active safety, passive safety, environmental considerations, and other specific technical requirements.
This paper presents safety evaluation procedures for electric Tuk-tuks, encompassing both common and specific technical requirements. The evaluation procedures are divided into three components: braking performance, rollover stability, and electric safety prevention, as illustrated in Figure 1. The proposed evaluation procedures can serve as valuable guidelines for the development of safety evaluation standards for electric Tuk-tuks.
This paper is structured as follows: Section 2 outlines the methodology employed to assess the technical requirements for electric Tuk-tuks, encompassing test setups, procedures, equipment, and specifications of the electric Tuk-tuk candidates. Section 3 presents the test results and provides accompanying discussions. Finally, Section 4 summarizes the findings derived from this study.

2. Materials and Methods

2.1. Technical Requirements for Electric Tuk-Tuks

2.1.1. Braking Performance

The braking performance is a standard technical requirement for all vehicle categories, as stipulated by United Nations Economic Commission for Europe (UNECE) Regulation No. 78. According to UNECE, Tuk-tuks are classified under the L5 category, which means they must adhere to braking requirements involving stopping within a specified distance and parking on a designated road gradient [10].
For the dry stop test, the regulation specifies the criterion for stopping distance outlined in Equation (1), which is obtained when all service brake controls are actuated. Although Tuk-tuks have only a rear brake installation, they are still required to achieve the specified stopping distance, similarly to other vehicle categories that have both front and rear brake systems.
According to the regulation, the test conditions involve actuating all service brake controls with a hand control force not exceeding 250 Newtons (N) and a foot control force not exceeding 500 N, at a test speed of either 100 km per hour (km/h) or 90% of the maximum speed. However, the Department of Land Transport in Thailand mandates that the maximum speed for electric Tuk-tuks eligible for registration must be equal to or greater than 45 km/h [11]. Therefore, if 90% of the maximum speed falls below 45 km/h, the test speed must be set at 45 km/h instead, resulting in a stopping distance criterion of 12.15 m (m) according to Equation (1). The actual stopping distance can be calculated using Equation (2). The braking performance test will be conducted six times for each Tuk-tuk candidate.
S   0.1 V 1 + 0.006 V 1 2
S c o r r e c t e d = 0.1 V 1 + ( S a -   0.1 V a ) V 1 2 / V a 2
where S = required stopping distance (m); Scorrected = corrected stopping distance (m) at test speed; Sa = actual stopping distance (m) from measurement; V 1 = test speed (km/h); V a = actual vehicle speed (km/h) when a driver actuates the control
To park an L5 vehicle on a road gradient, as stated in UNECE Regulation No. 78, the vehicle must remain stationary on a road gradient of 18% for 5 min using parking brakes. The hand control force should not exceed 400 N, while the foot control force should not exceed 500 N.

2.1.2. Rollover Stability

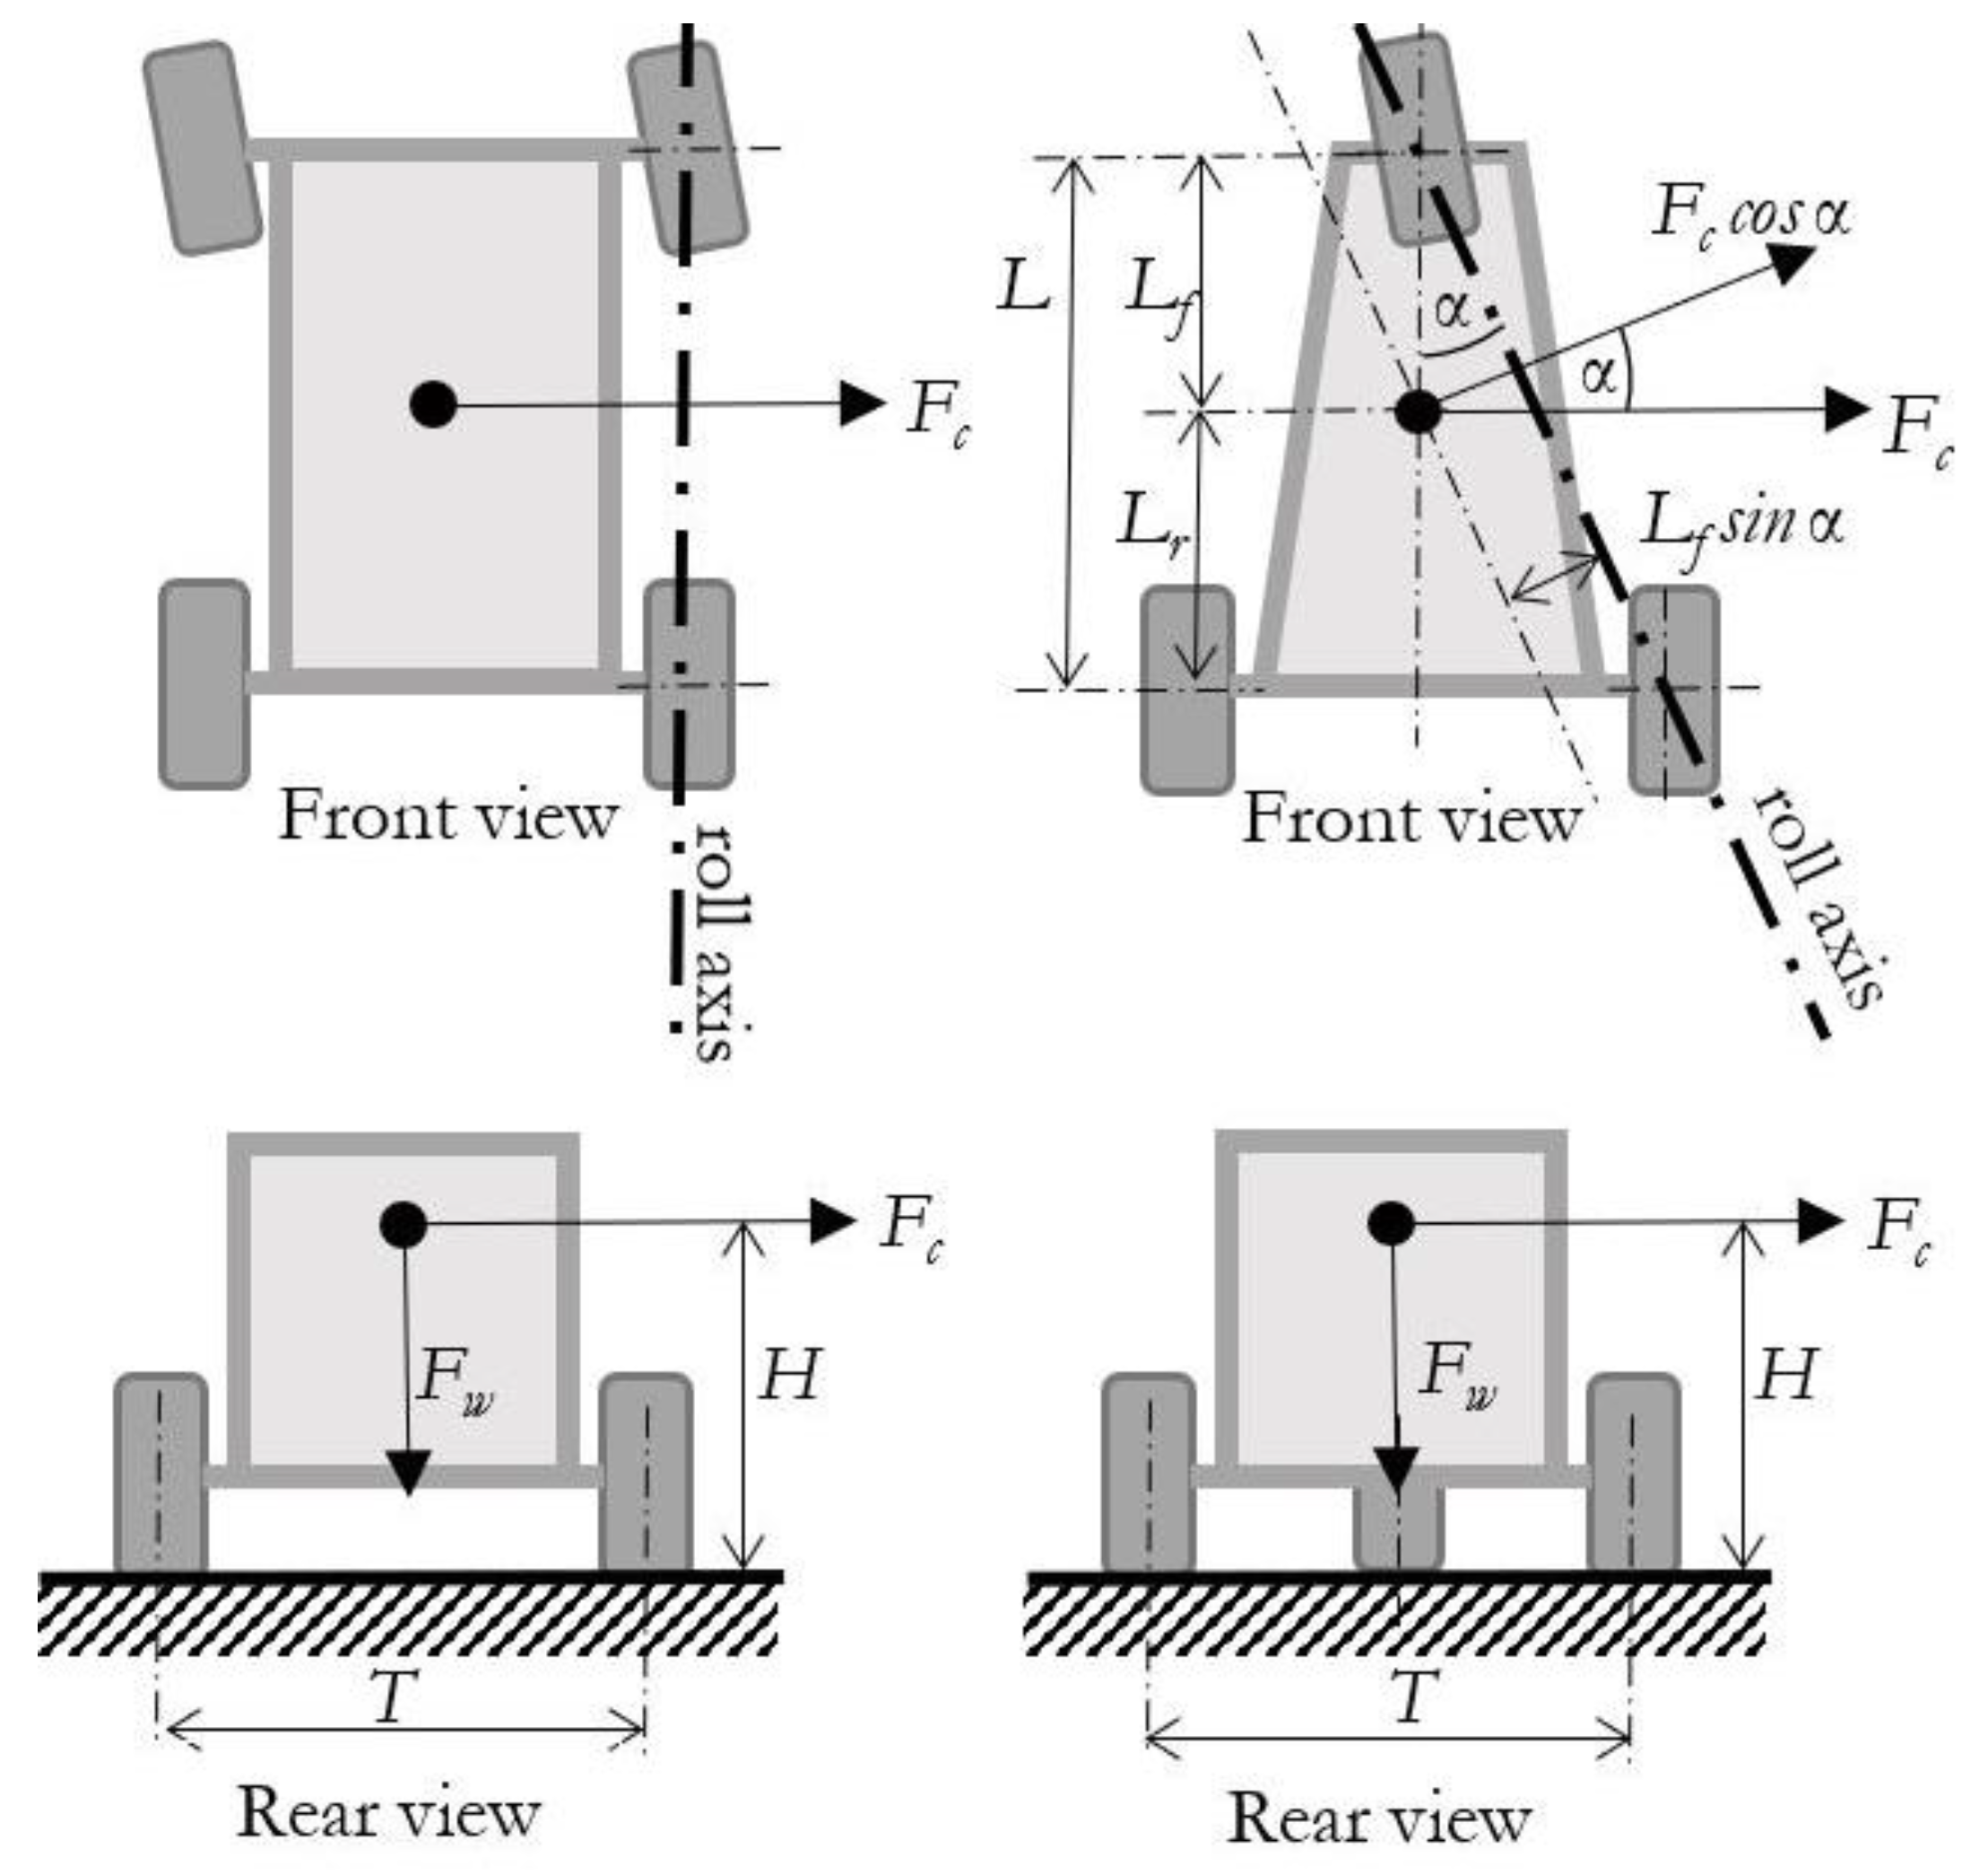
As mentioned in [1,8], motorized tricycles are susceptible to rollovers, particularly during turns at critical speeds. An analytical method can be employed to assess the stability of the vehicle in relation to rollover risk using Equations (3) and (4) [12]. In the case of a four-wheel vehicle, rollover can occur when the moment of centrifugal force (Fc) surpasses the moment of vehicle weight (Fw) based on the geometric properties of the vehicle. Based on this relationship, the critical speed (Vcri) at which rollover may occur can be determined under static equilibrium, as illustrated in Figure 2 on the left. However, motorized tricycles have a different roll axis, as depicted in Figure 2 on the right. Therefore, the critical speed of a motorized tricycle can be calculated using Equation (5) instead.
a y g = T 2 H
a y = V 2 R
V c r i = 3.6   · R L f g · t a n ( α ) H
where Vcri = critical speed (km/h); H = height of the center of gravity (m); T = vehicle track (meter, m); g = gravity acceleration, 9.81 m/s2; R = radius of a curve (m); L f = distance of center of gravity from the front wheel (meter); α = angle given by vehicle geometry between the front and rear wheel (degree).
The maximum speed at which a vehicle can safely make a turn with a given radius (R) and a specific road friction coefficient (μ) can be determined based on Equation (6). Therefore, the rollover stability test can be conducted by performing a J-turn with a predefined radius [13]. The vehicle speed starts at a low speed (e.g., 5 km/h) and gradually increases to the maximum speed at the specified radius and a road friction coefficient of 1, calculated by Equation (7) for each test. The test will be terminated when the onset of rollover occurs, indicated by the lifting of the inboard rear wheel of the tricycle.
V 2 R = μ g
V m a x = 3.6 · μ R g
where Vmax = maximum speed in a curve (km/h); μ = Road friction coefficient.

2.1.3. Electric Safety Prevention

The various forms of water affect the performance and reliability of electronics of the electric vehicles in unique ways [14]. Electrical safety is categorized as another technical requirement. In many areas of Thailand, vehicles occasionally face sudden flooding, especially in urban areas, caused by heavy rainfall. Urban flooding is a phenomenon that commonly occurs in large cities due to geographical factors and the presence of small and medium-sized enterprises with insufficient disaster prevention strategies. Consequently, there is a significant risk of electrocution when an electric vehicle travels through a flooded road at varying water depths [15]. This risk is particularly concerning for electric Tuk-tuks, as their occupant compartments are predominantly made of metal and lack doors, exposing occupants to direct contact with the metal structure. Several vehicle components, including lighting terminals, the metal structure, and high- or low-voltage cables, can pose electrical hazards to occupants. These components may come into contact with water drops, splashes, flows, or leaks, leading to electrical short circuits if the waterproof seals are not adequately designed. Vehicle cleaning, rainfall, and wading are conditions in which electric vehicles can be exposed to water. Zhang [16] proposed testing procedures to simulate such conditions. For the vehicle cleaning test, hazardous areas at the lighting system and glass seal are identified, and water is applied at a flow rate of 12.5 L per minute. Similarly, the accessible and open parts of all vehicle surfaces are subjected to artificial rainfall using a standard nozzle at a flow rate of 10 L per minute for 5 min. To simulate a wading condition, the vehicle should travel at 20 km/h on a flooded road with a water depth of 10 cm for a distance of 500 m. However, safety verifications for these tests are not specified to assess the electrical risks associated with higher water levels during flooding.
For occupant protection from high voltages, vehicle regulations stipulate that all surrounding parts of high-voltage components should not be opened, disassembled, or removed during impact testing [17]. If there are any gaps or openings in the physical protection, a special tool representing a human finger is used to assess the electrical risk of high voltages under contact conditions. Additionally, the isolation resistance (Ri) between the high-voltage bus and the electrical chassis is used as a measure of electric safety. This can be determined through measurements or a combination of measurements and calculations. The electric safety requirement mandates a minimum value of 100 Ω/V for DC buses and 500 Ω/V for AC buses, based on the value of Ri over the working voltage. According to UNECE Regulation No. 94, the procedure for obtaining these results involves measuring the negative and positive sides of the high-voltage bus (Vb), the negative side of the high-voltage bus and the electrical chassis (V1), and the positive side of the high-voltage bus and the electrical chassis (V2). If V1 is greater than or equal to V2, or vice versa, it is necessary to insert the standard resistance (Ro), which should have a value equal to the minimum required isolation resistance (Ω/Volt) of the vehicle’s working voltage, with a tolerance of ±20%. Ro is installed between the negative or positive side of the high-voltage bus and the electrical chassis, depending on whether V1 or V2 has the higher value, as shown in Figure 3. Similarly, the voltage across Ro should be measured for V1′ or V2′. Consequently, Ri can be calculated using Equations (8) and (9). Dividing the value of Ri by the working voltage of the high-voltage bus allows for identification of the electric safety verification.
R i = R o   × V b V 1   -   V b V 1   ; if   V 1     V 2
R i = R o   × V b V 2   -   V b V 2   ; if   V 2   >   V 1

2.2. Test Setup

2.2.1. Braking Test

For the vehicle braking performance test, a camera, GPS speed sensor, and pedal force sensors were utilized to determine the position at which the driver applies force to the brake pedal. This was done by analyzing video data, as depicted in Figure 4. Linear interpolation was employed between two consecutive marks to establish the first and final positions during the brake application. Consequently, the stopping distance of the vehicle was calculated based on these positions. The first and final positions, corresponding to the moment when the driver initiated brake control and brought the vehicle to a stop, were obtained through experimental measurements. The stopping distance was also compared with calculated distance by the GPS speed sensor. The test procedure, conditions, and equipment used are summarized in Table 1.

2.2.2. Parking on a Road Gradient Test

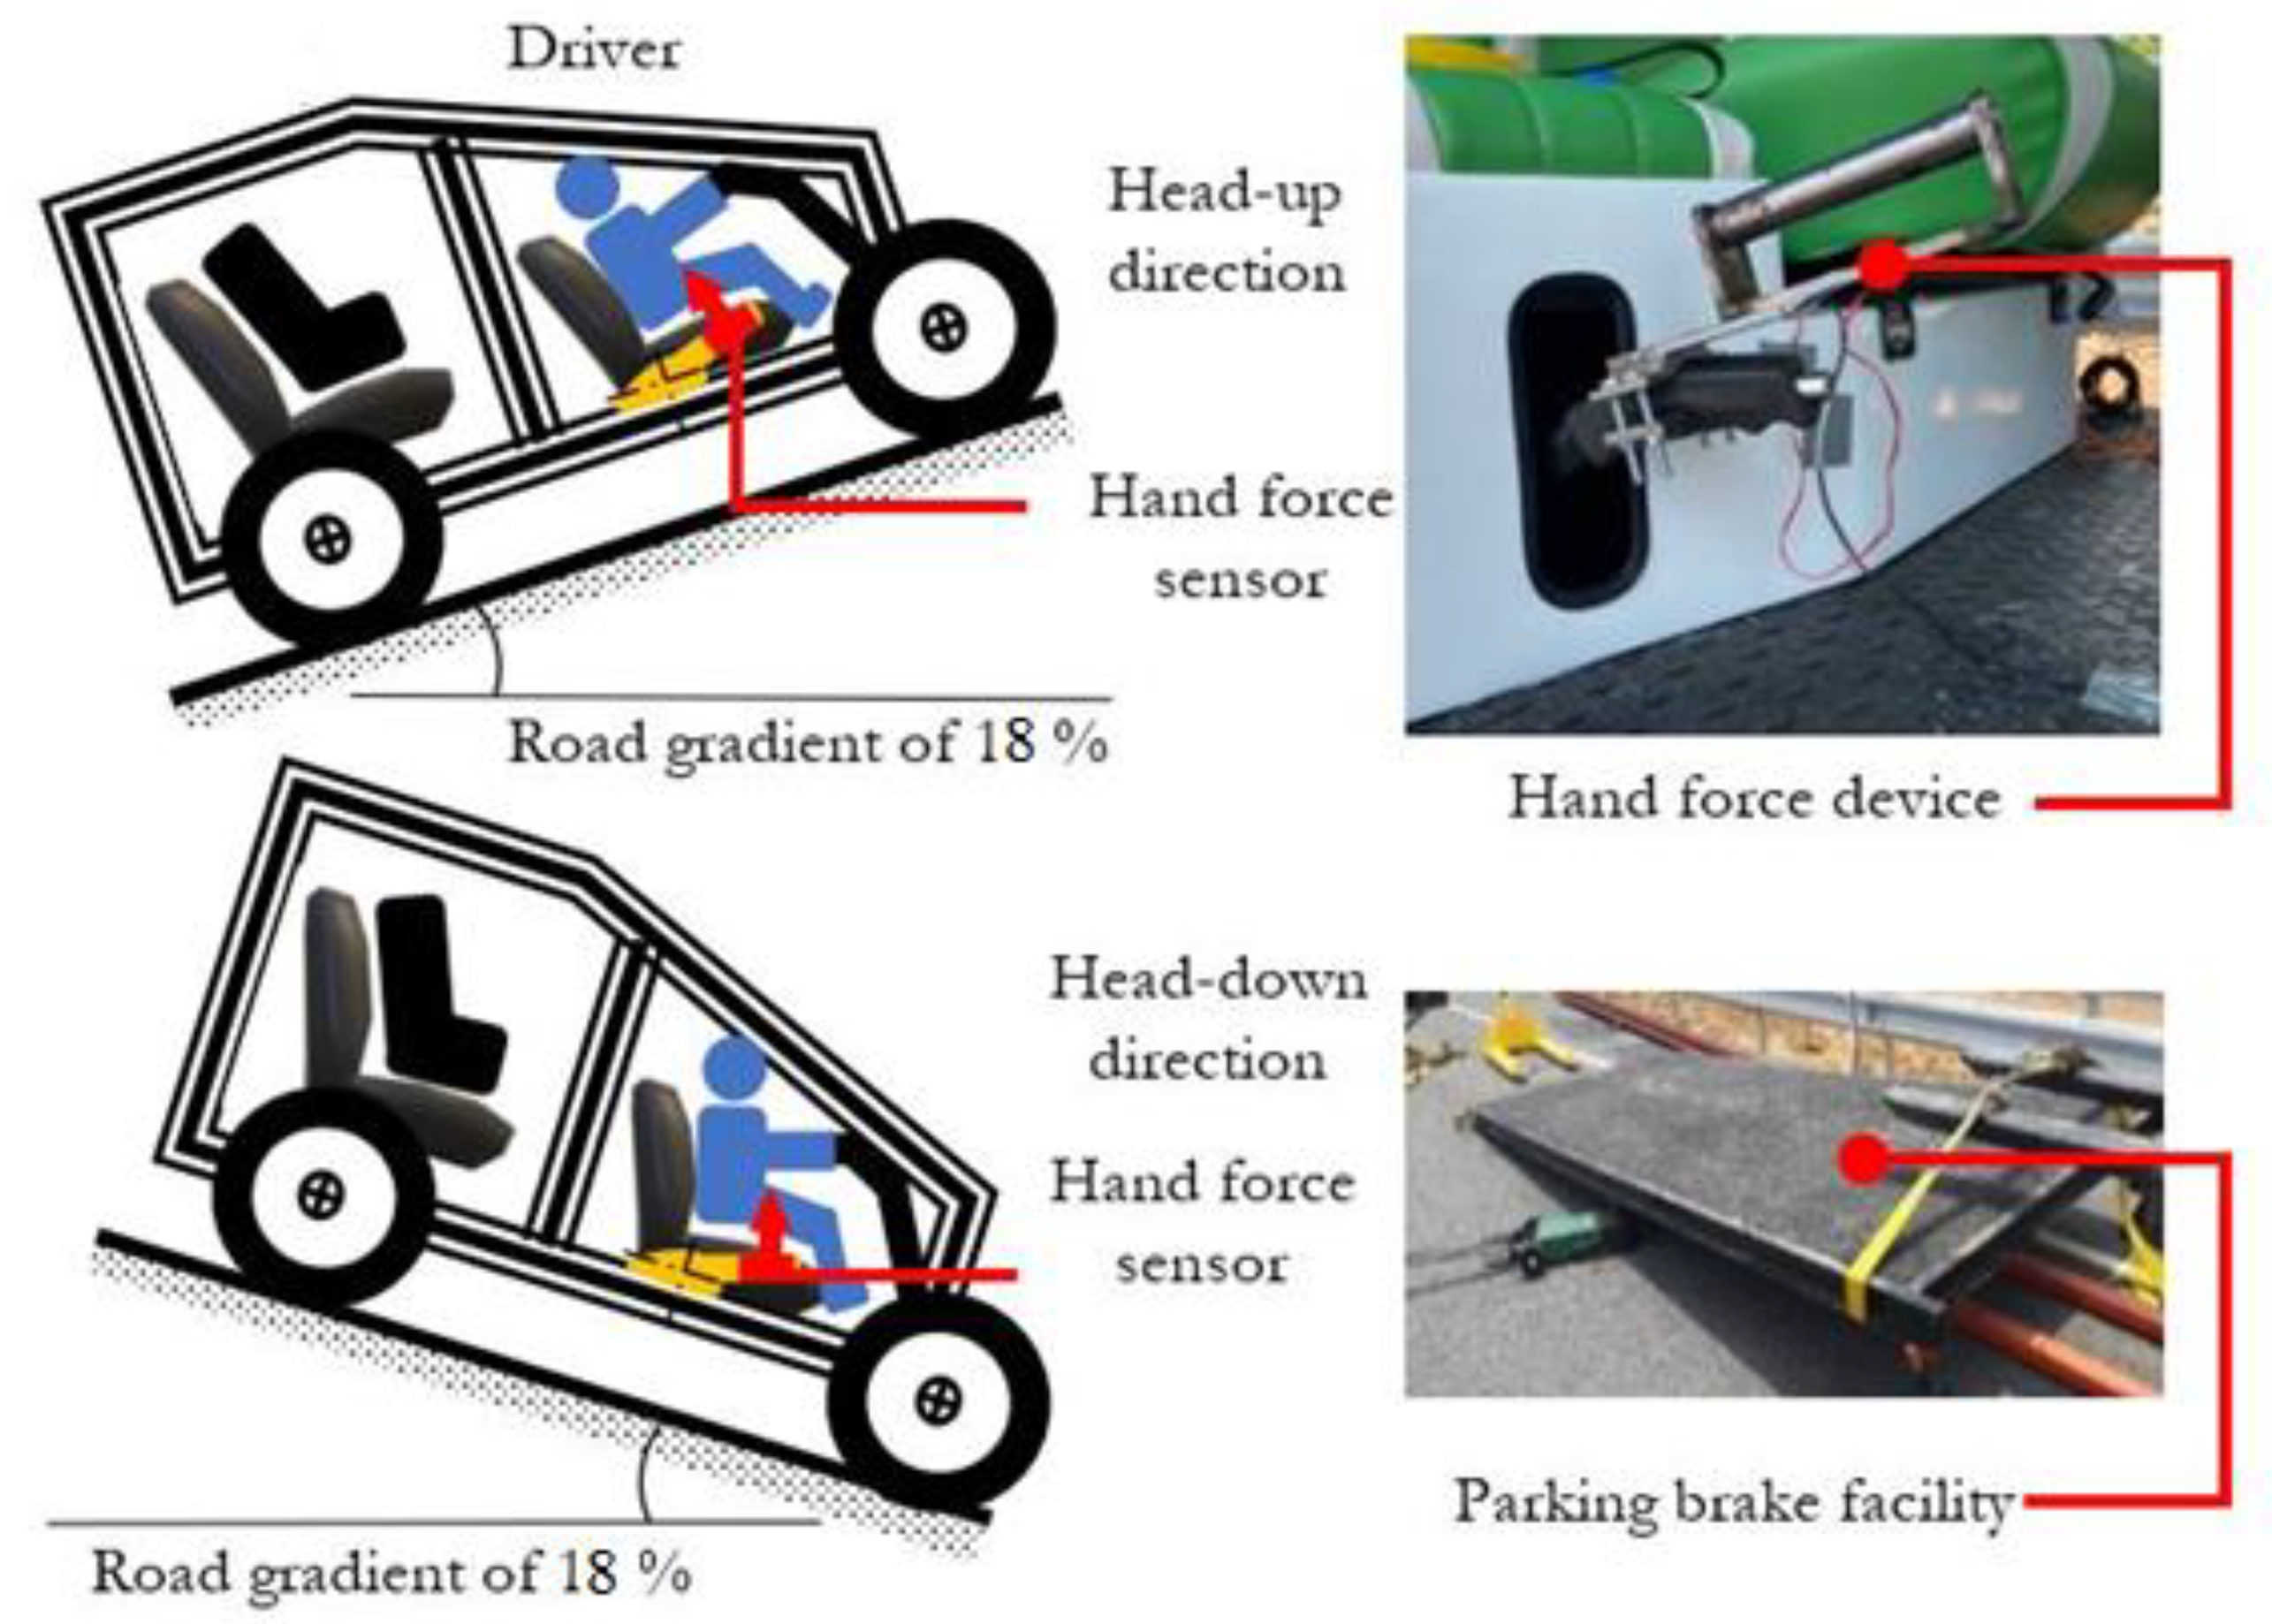
In the parking performance test, the electric Tuk-tuks were equipped with a special device with a force sensor, as illustrated in Figure 5. An inclined panel surface with an 18% gradient was constructed in accordance with the standard requirement outlined by the Thai Industrial Standards Institute (No. 851-2561). Both Tuk-tuk candidates were then brought to a stationary position for a duration of at least 5 min under the specified test conditions. The maximum allowable hand brake force for both candidates was set and monitored to ensure it did not exceed 400 N. The test procedure, conditions, and equipment used are summarized in Table 2.

2.2.3. Rollover Stability Test

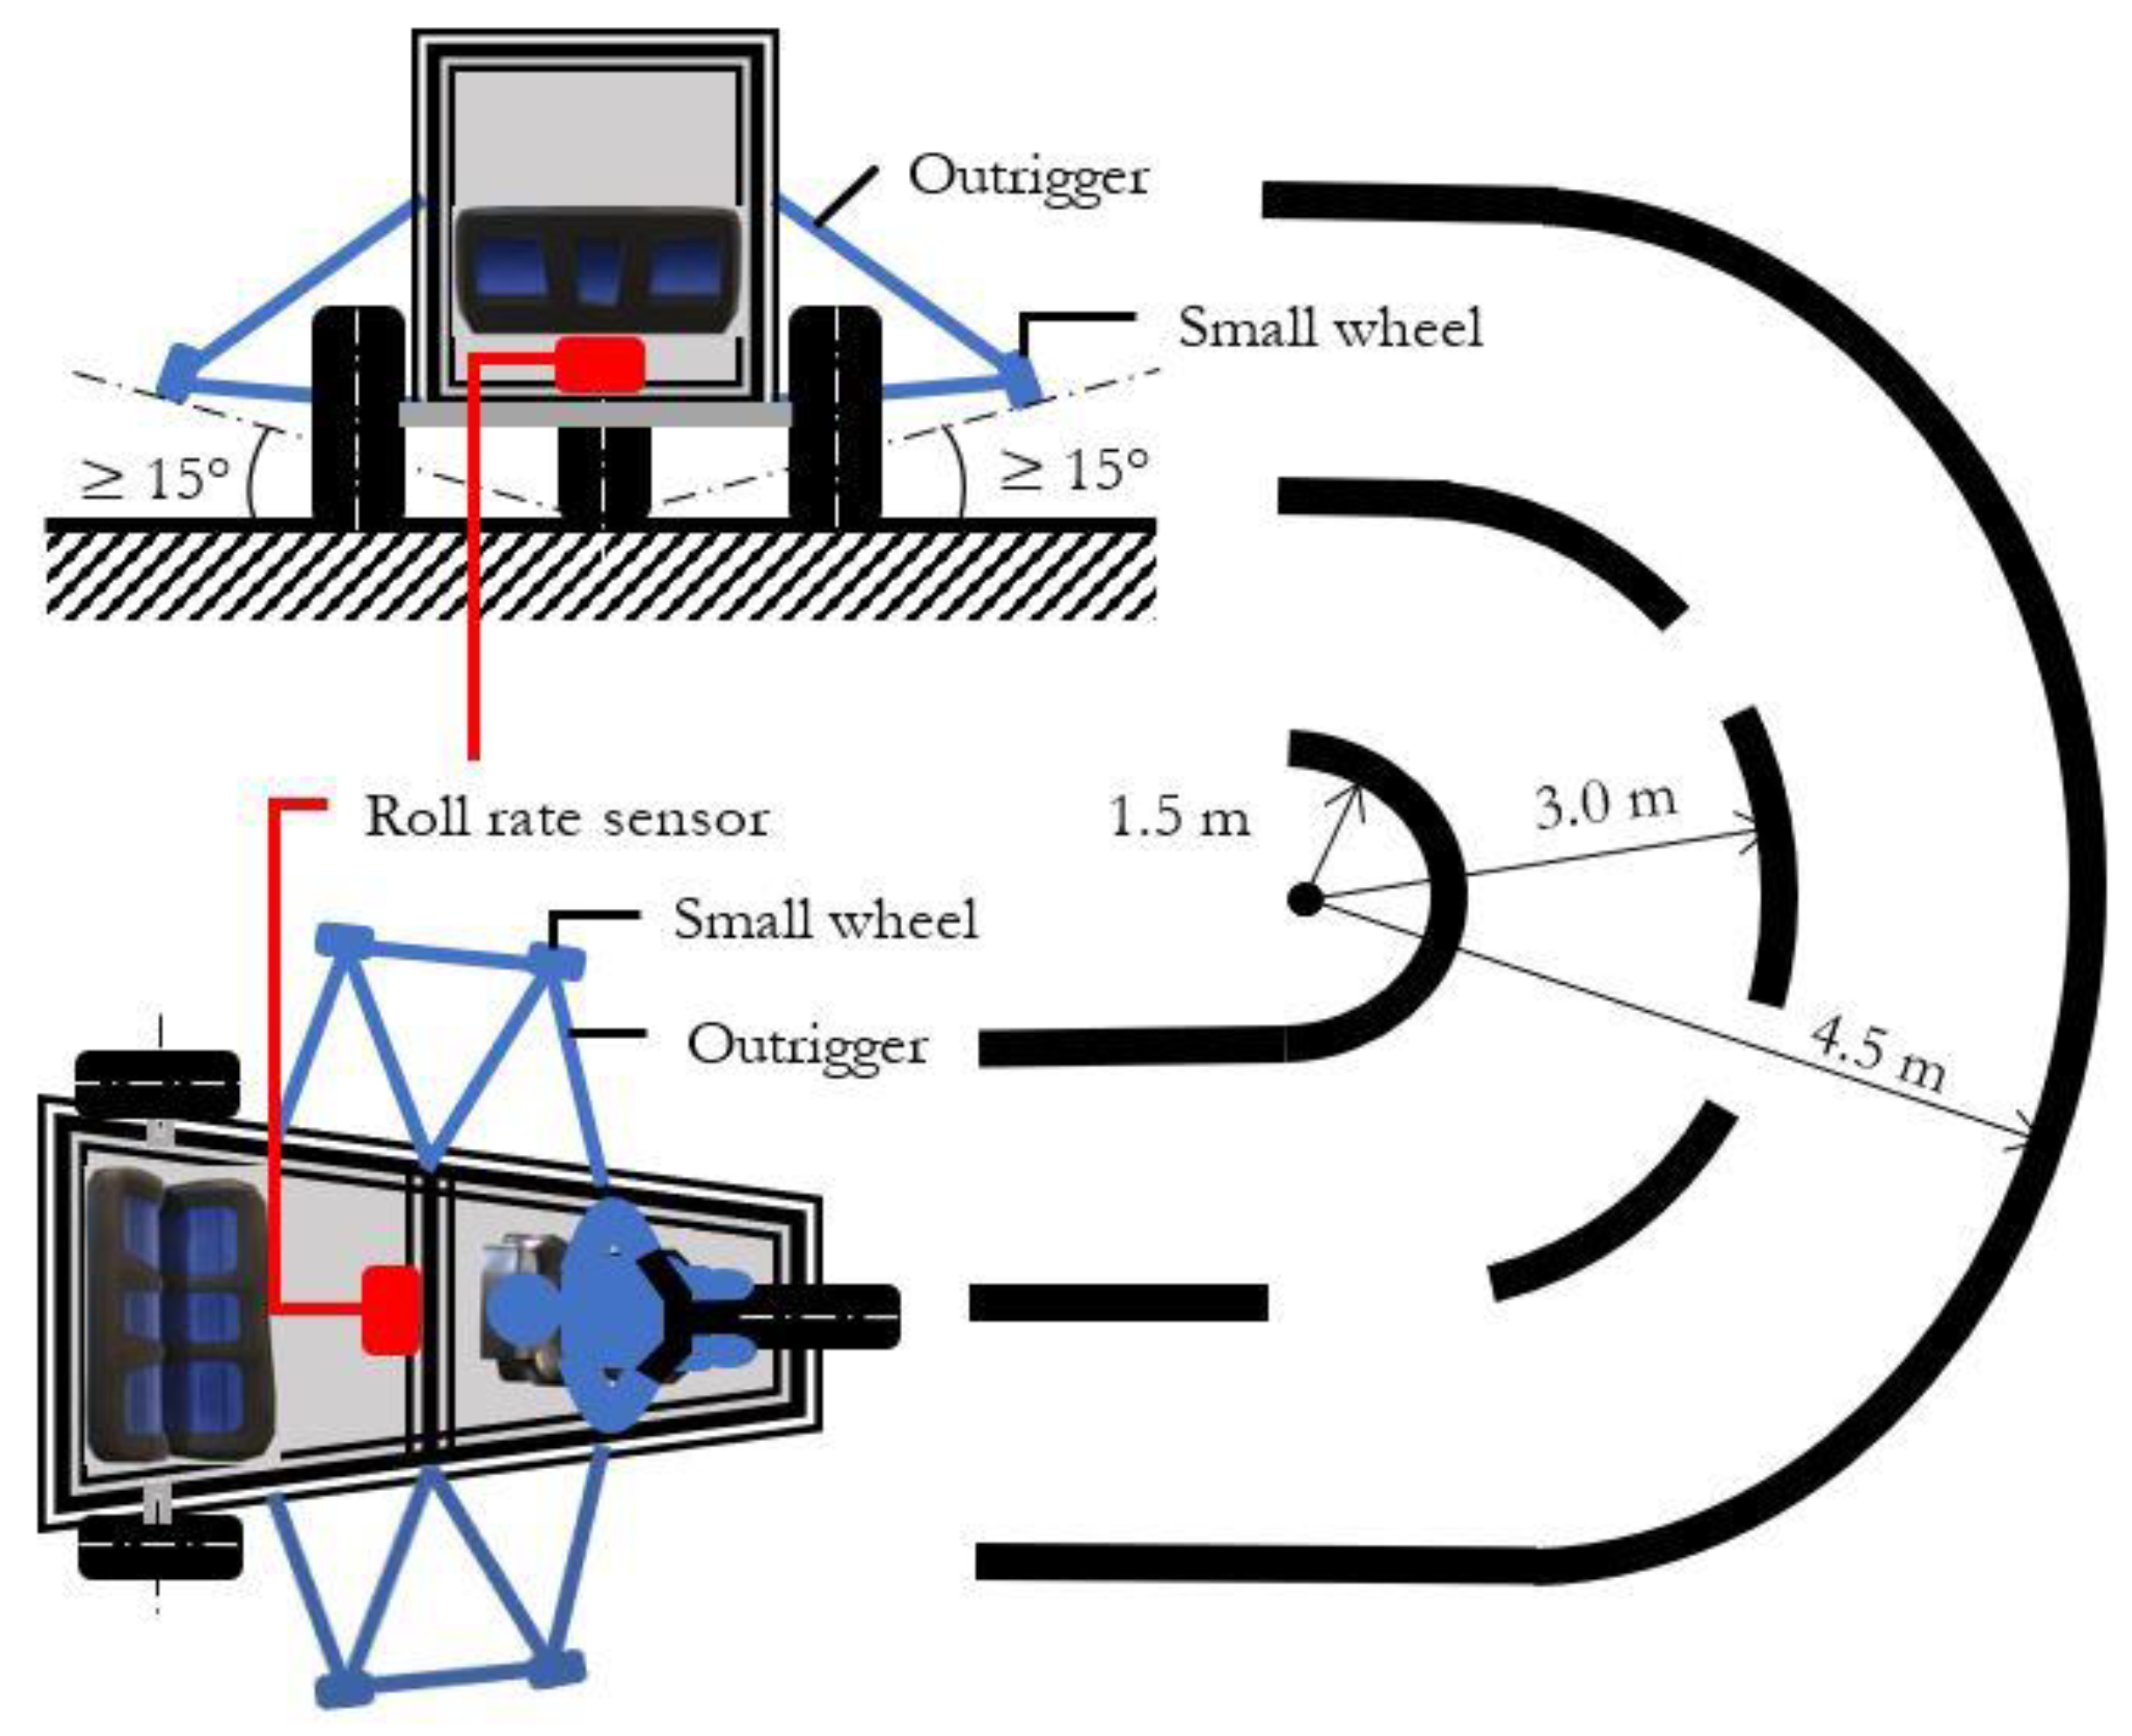
For the J-turn vehicle stability test, both electric Tuk-tuk candidates were equipped with necessary tools and measurement devices, while ensuring the test conditions, as depicted in Figure 6. The maximum test speed for this particular test, with a 3 m radius and μ = 1, was approximately 20 km/h. The test procedure, conditions, and equipment used are summarized in Table 3.

2.2.4. Electrical Safety Test

To simulate urban flooding conditions, a rectangular tank capable of containing an electric Tuk-tuk was used, as depicted in Figure 7. The electric chassis of the Tuk-tuk was supported with stands, allowing the driven wheels to freely rotate at a speed of 20 km/h to simulate a wading condition, for a duration of 3 min. It is important to note that the hydrodynamic load resulting from the wheel rotation can cause water to splash onto the power unit and high voltage cables. The water level above the bottom of all wheels were set at different depths: 20, 25, and 30 cm. In order to meet the electric safety prevention requirement, the minimum values of Ri for DC and AC buses were 100 and 500 Ω/Volt, respectively. The test procedure, conditions, and equipment used are summarized in Table 4.

2.2.5. Sample Tuk-Tuk Candidates

To evaluate the technical requirement of the electric tricycle, two local manufacturers currently in the product development stage were selected. As the specifications are confidential, they cannot be disclosed. The specifications of the electric Tuk-tuk candidates are shown in Table 5.

3. Results

3.1. Braking Performance

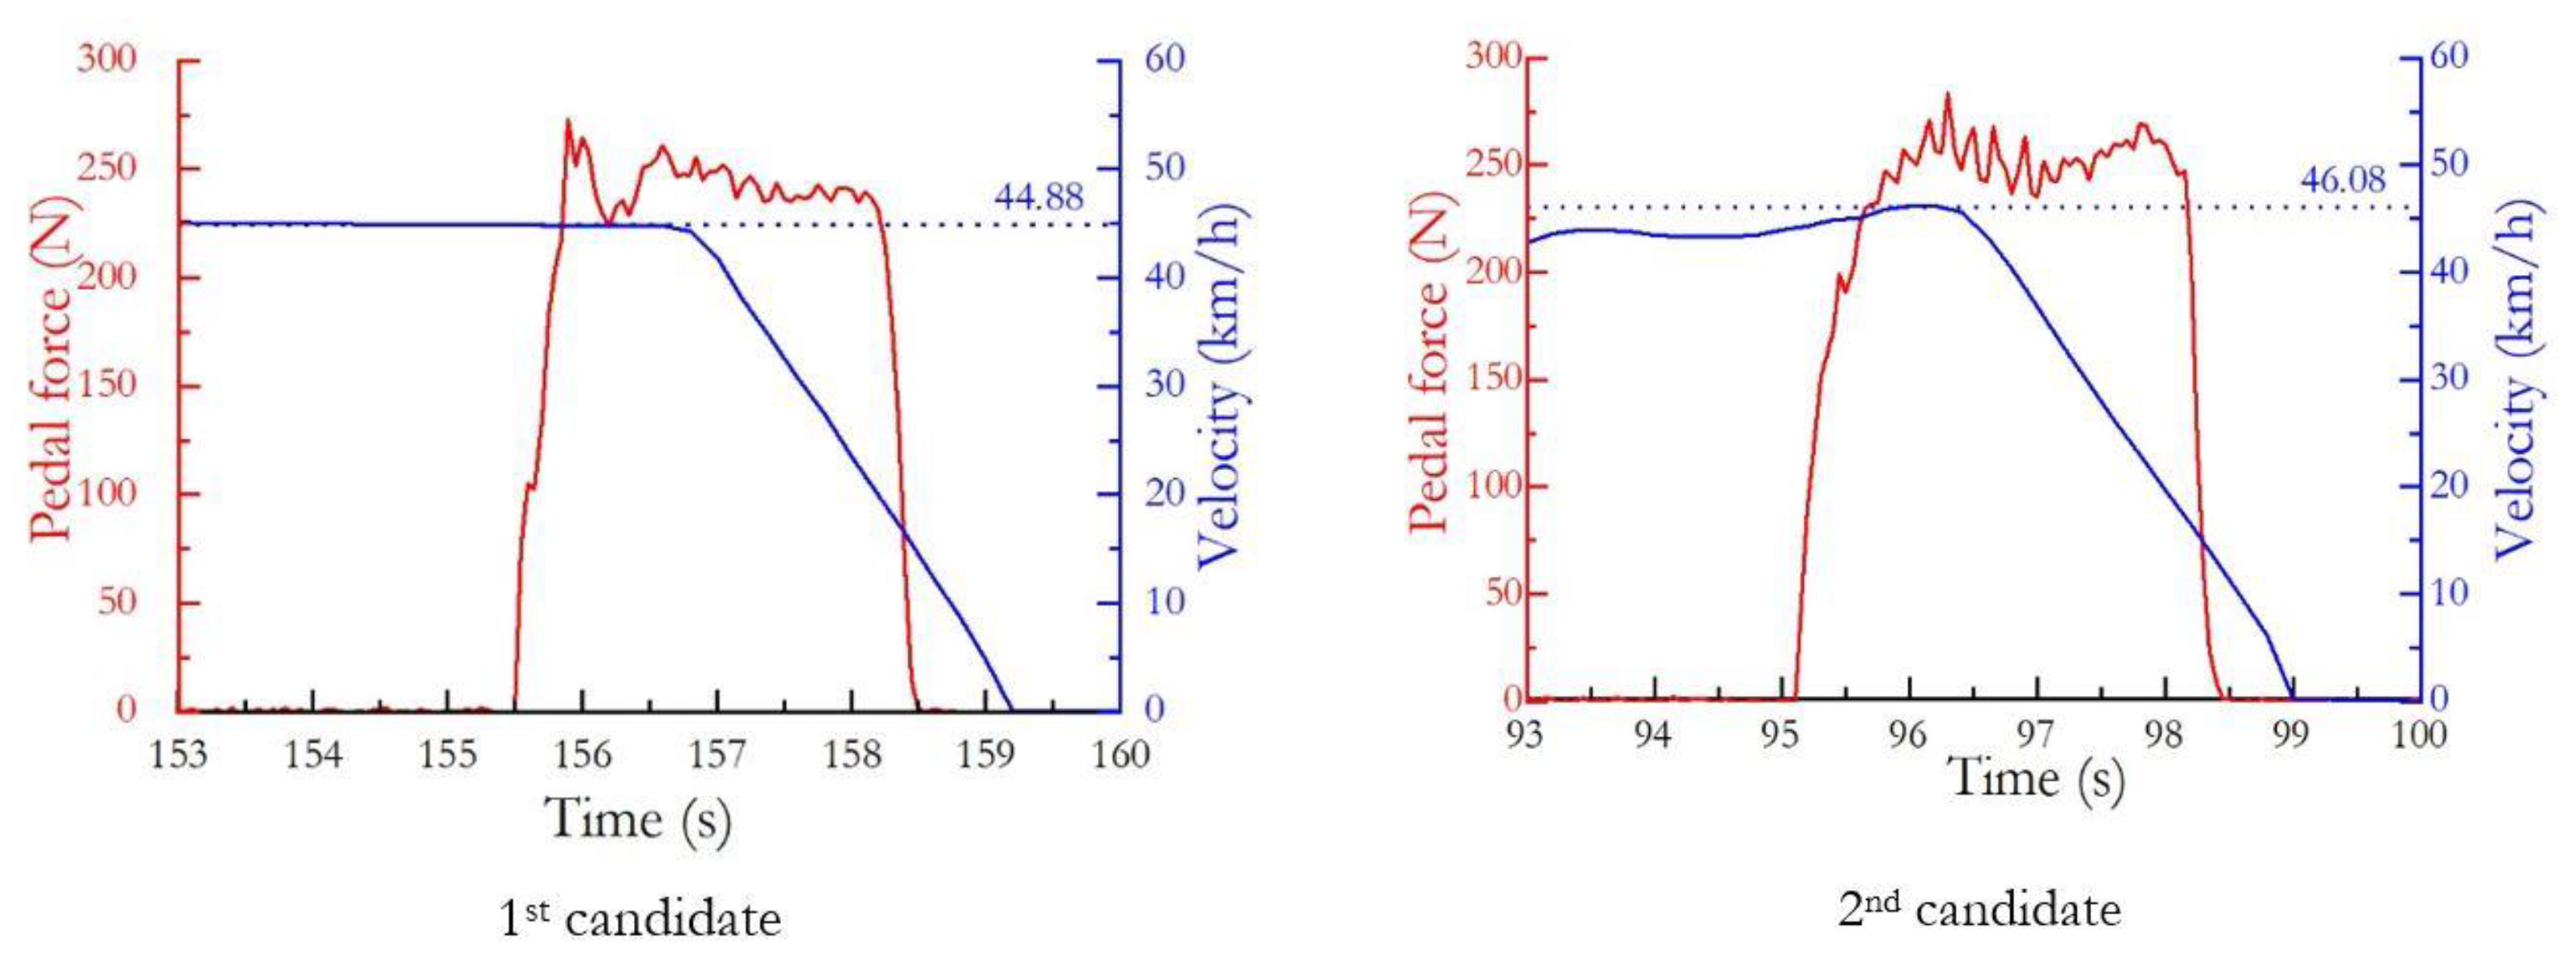
The results of the braking performance test are presented in Table 6 and Figure 8. Both candidates achieved maximum speeds of 47.8 km/h and 49.2 km/h, respectively. However, when calculating the test speeds at 90% of the maximum speeds, both values fell below 45 km/h, failing to meet the conditions specified in [11]. Consequently, the test speeds for both candidates were adjusted to 45 km/h. The actual speeds at which the drivers activated the brakes, as well as the maximum pedal forces, were determined from the speed and force profiles shown in Figure 8. The actual stopping distances calculated from the video camera and the corrected stopping distances are presented in Table 6. As a result, only the first candidate passed the test because at least one stopping distance value from the six tests was below the criterion. These findings indicate that the brake system of the second candidate was inferior to that of the first candidate and requires improvement.
Using Regulation No. 78 is appropriate for the braking performance test. The results confirmed that the electric Tuk-tuk was able to stop within the required distance, even with only the rear brake installation. In fact, Regulation No. 78 separates the test conditions of single brake control actuation on a dry surface. However, the criteria are less stringent compared to the conditions involving all service brake actuation. The minimum test speed of 45 km/h for the electric Tuk-tuk aligns with the condition set by the Department of Land Transport in Thailand. However, it may not be applicable in other countries due to different requirements.
The stopping distances recorded by the GPS sensor were found to be larger than the values presented in Table 6. This can be attributed to the time lag of the GPS receiver, which is a common occurrence in lower-cost models. The average time lag can vary between 1.7 to 5.2 s [18]. Additionally, the accuracy of GPS position reporting is influenced by atmospheric conditions and obstacles [19]. Therefore, it is recommended to use a higher-quality GPS device for dynamic tests, such as the braking performance test conducted in this study.

3.2. Parking on a Road Gradient Test

The results of the parking on a road gradient test are presented in Table 7. Both candidates applied hand brake forces of 167 N and 194 N, respectively, which were below the test condition of 400 N. Additionally, both candidates were able to remain stationary for at least 5 min on an 18% gradient. In accordance with Thai legislation, the Department of Rural Roads permits a maximum gradient of 12% for standard roads [20]. Another regulatory act, the Bangkok Metropolitan Administration Regulation on Car Park Building [21], allows for a maximum slope gradient of 15% between floors for vehicles. Therefore, the parking test conducted on an 18% gradient under Regulation No. 78 satisfies the requirements of both Thai regulations.

3.3. Rollover Stability Test

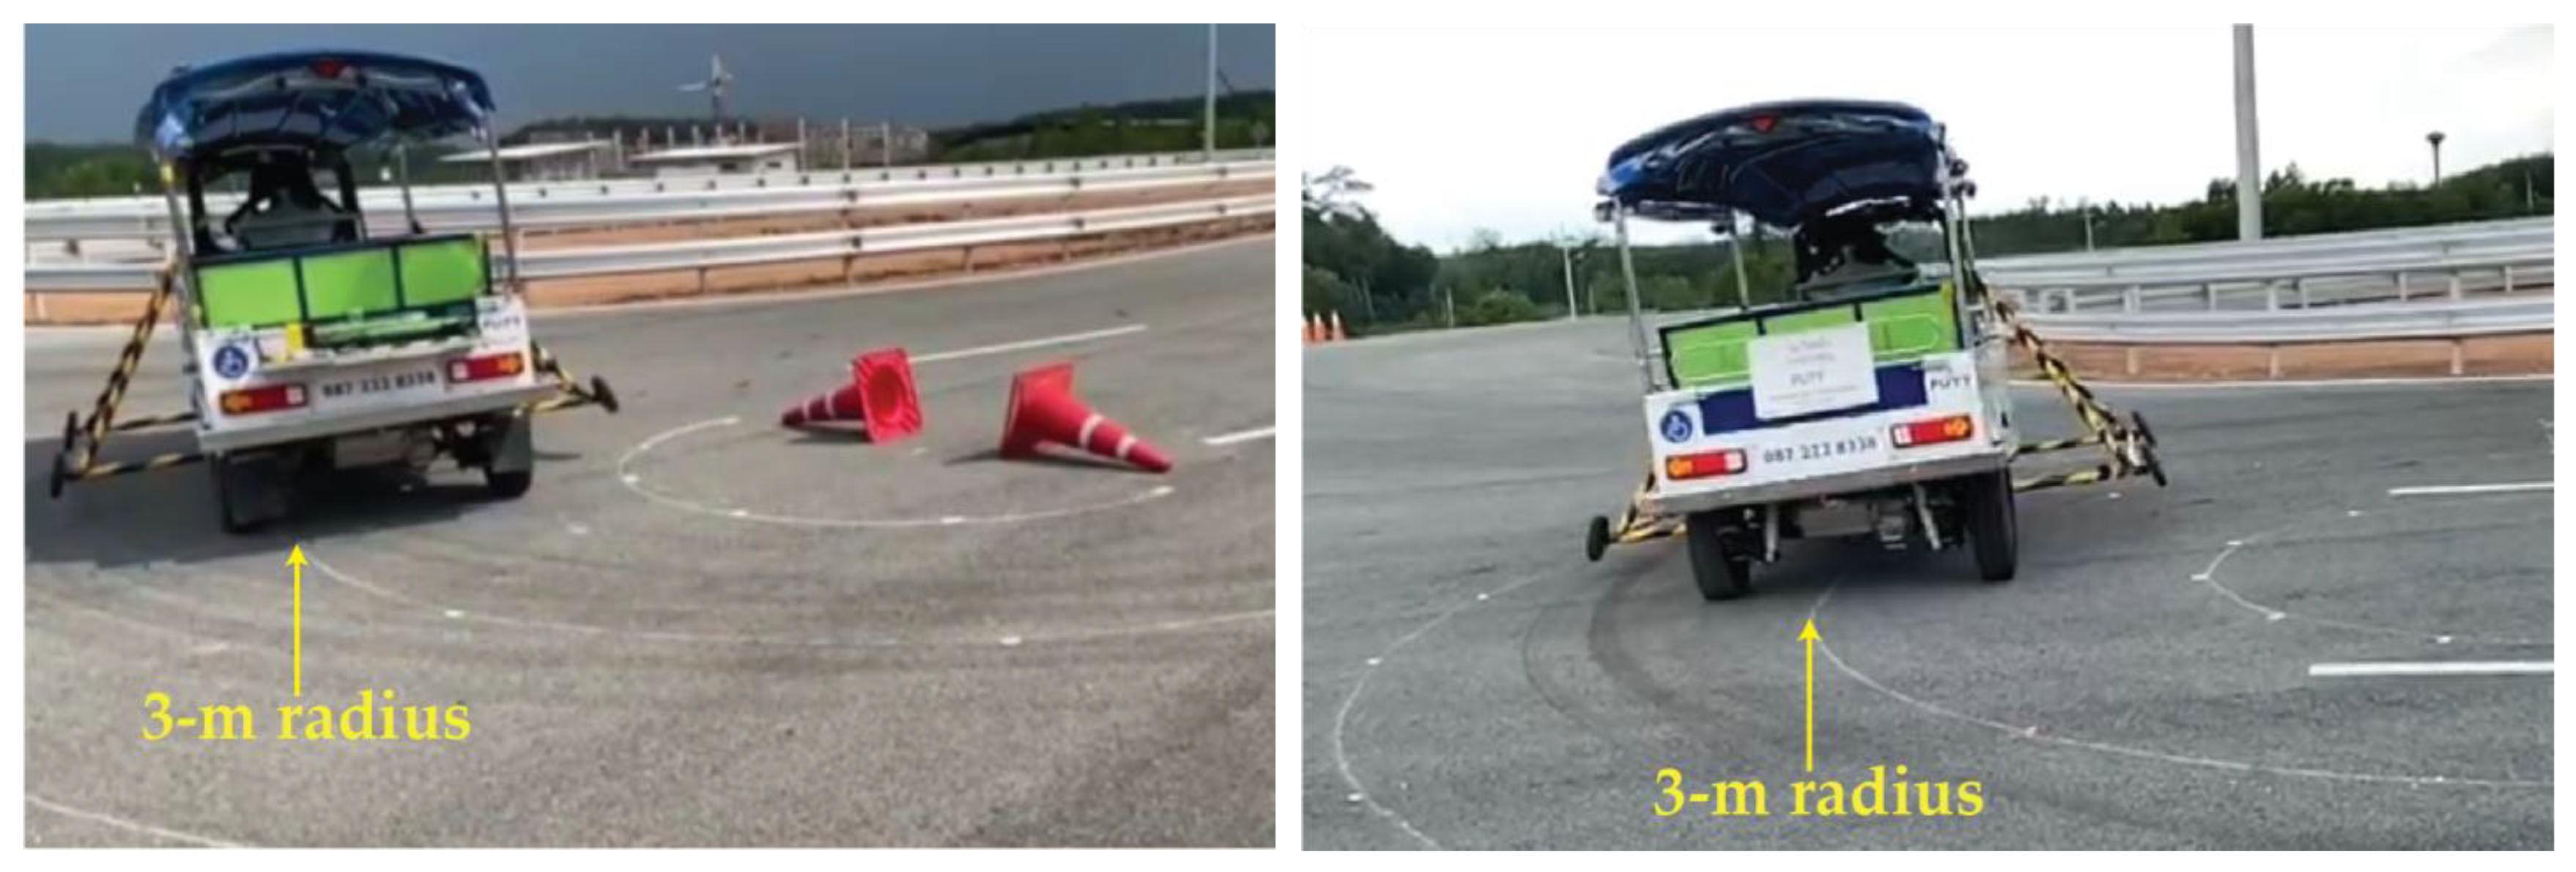
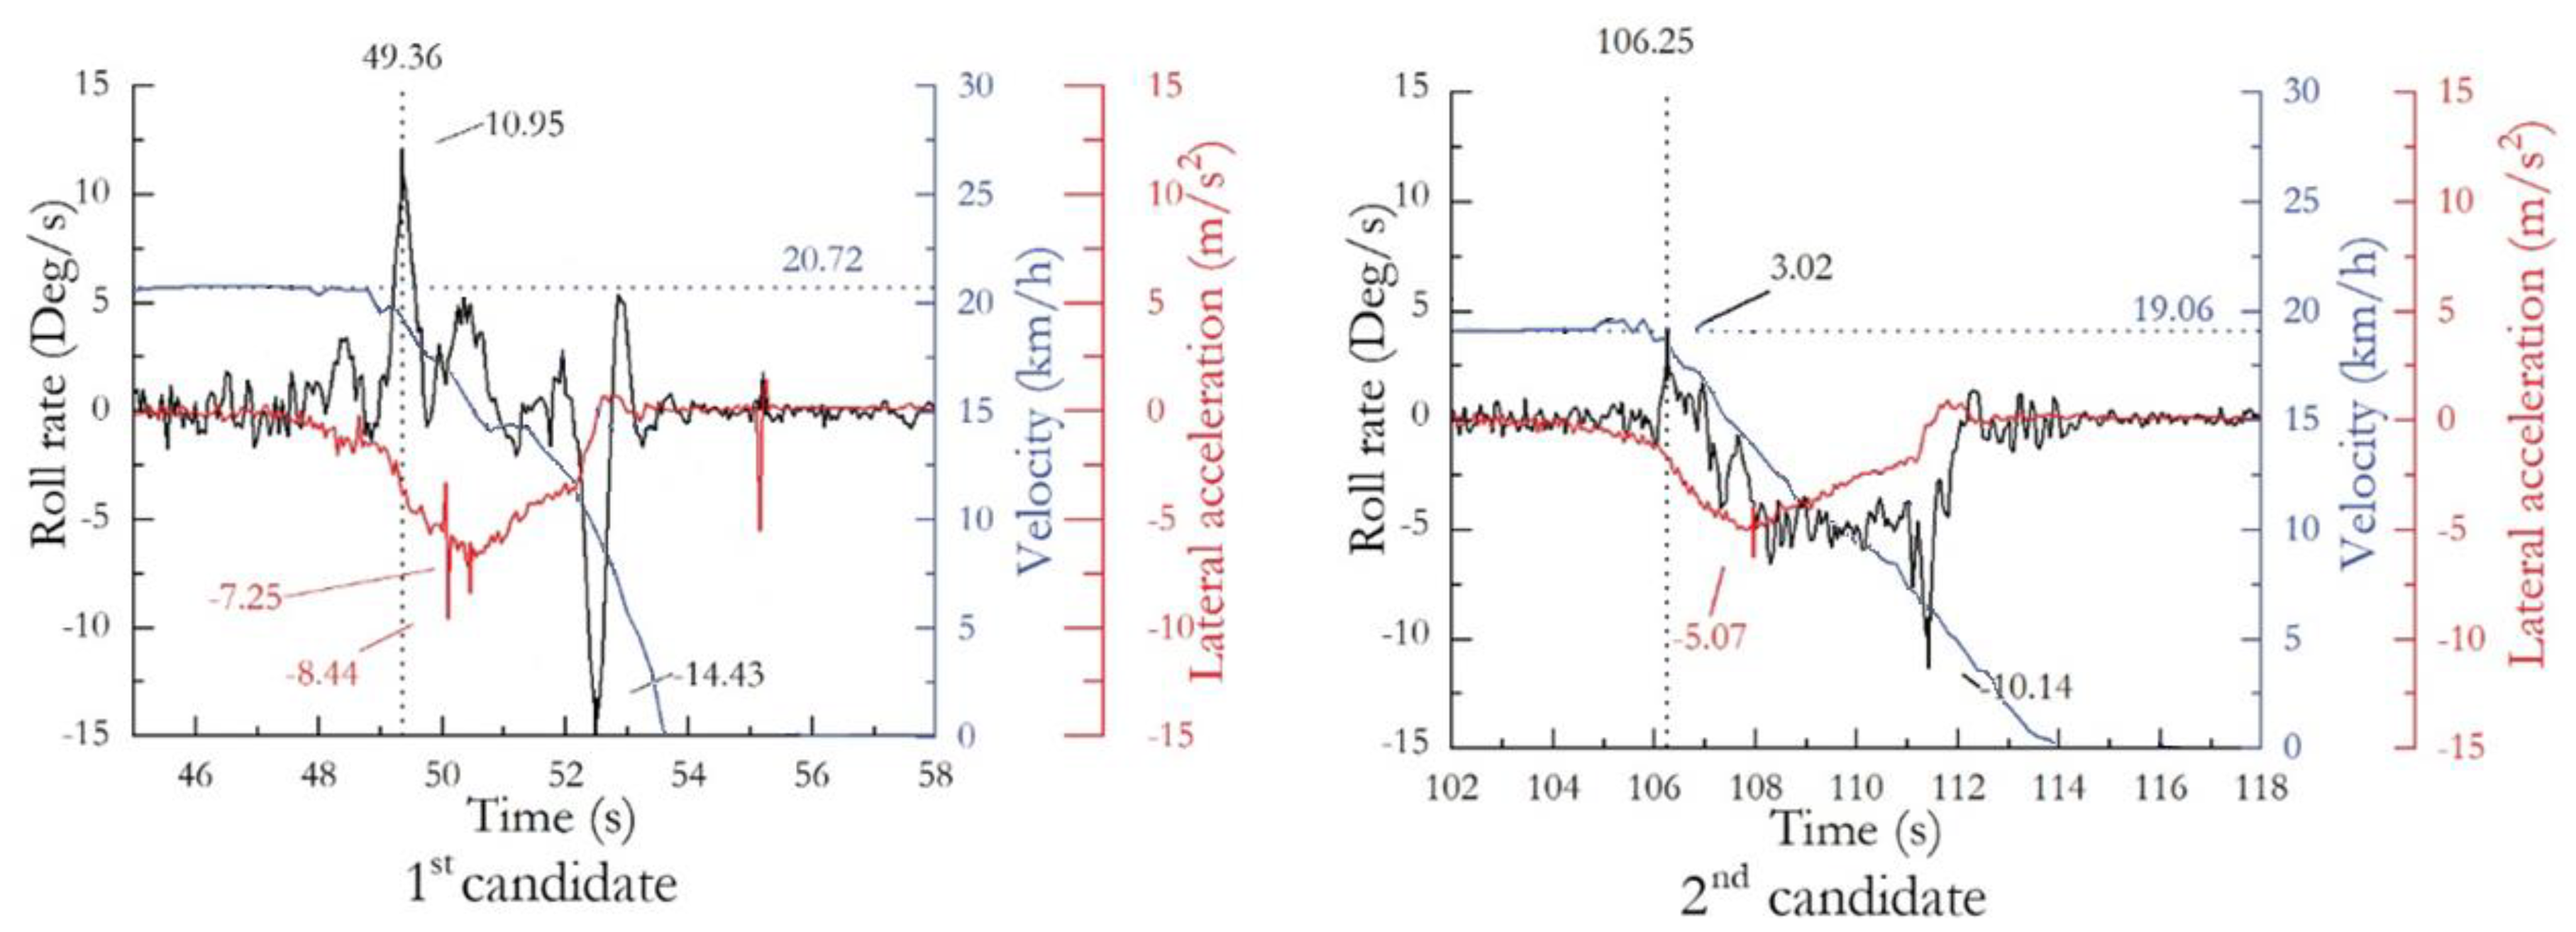
The results of the rollover stability test are presented in Table 8. The calculated critical speeds for both candidates in the given radius were 15.52 km/h and 16.32 km/h, respectively. However, the maximum speeds achieved by both candidates in the curves exceeded the critical speeds. This discrepancy may be attributed to several factors. Firstly, it was challenging for the drivers to accurately follow the 3 m radius line, resulting in turns that were either too wide or too narrow, as depicted in Figure 9. Additionally, during the turning maneuver, the drivers struggled to maintain a consistent speed and may have adjusted the handlebar in response to the dynamics of the vehicle, leading to sudden reductions in the turning radius, as shown in Figure 10. Therefore, using the J-turn method to evaluate rollover stability might not be suitable for this test as proposed by [13]. Implementing a fixed handlebar during the test could potentially yield better results. It would be preferable to conduct the test by starting the vehicle from a standstill and gradually increasing the speed until the inboard wheel lifts. To improve the accuracy of the test, it is recommended to use a high-quality GPS receiver that is capable of providing precise measurements of the turning radius, linear speed, and even direct calculation of lateral acceleration. Additionally, a robust accelerometer is necessary to mitigate the effects of tilting during the turn and enable an accurate comparison of lateral acceleration.

3.4. Electrical Safety Test

In the electric safety evaluation, a standard resistance (Ro) of 8130 Ω was used because the requirement is a minimum value of 100 Ω/Volt for the DC bus and the high-voltage buses (Vb) for the first and second candidates were 78.8 and 79.7 Volts, respectively as shown in Table 9 and Table 10. The measurement results for the first and second candidates are shown in Table 3 and Table 4, respectively. As a result, both candidates met the minimum requirement for electric safety prevention based on the Ri/Vb value. However, the second candidate showed a significant decrease in this parameter, from 451,090 to 2761 Ω/Volt at water levels of 25 and 30 cm, respectively. Under these conditions, the V2 value increased up to 75.6 Volts, indicating a reduction in electric resistance at the negative side of the high-voltage bus and the electric chassis. This may be attributed to the influence of water splash from the driving wheels in the area of the electric motor, as shown in Figure 11. Furthermore, the V1 and V2 values of the first candidate were lower than those of the second candidate. This suggests that the isolation resistance design in the first electric Tuk-tuk candidate provides better water protection.

4. Conclusions

Verifying the technical requirements of electric Tuk-tuks involves assessing their braking performance, rollover stability, and electric safety prevention. Our brake and parking performance tests followed standard vehicle regulations, with some modifications to meet the requirements set by the Department of Land Transport in Thailand. A rollover stability evaluation was conducted using the J-turn method to assess the vehicle’s rollover characteristics at critical turning speeds. The electric safety prevention test simulated an urban flooding scenario, which is common in many urban areas in Thailand. These verifications involved measuring and monitoring various indicators such as stopping distance, stationary parking on a road gradient, wheel elevation during a J-turn, and isolation resistance under flooding conditions.
Case studies involving the evaluation of electric Tuk-tuk candidates revealed that the time lag from a GPS speed sensor in the brake performance test can influence the calculation of the stopping distance. However, an alternative method using a video camera can be employed to accurately determine the stopping distance. Both candidates successfully met the requirements stipulated by both global and Thai regulations in the parking test. In the vehicle stability test, the use of J-turn might not be suitable due to the presence of uncontrollable factors. Additionally, the isolation resistance under flooding conditions can indicate the potential impact of water splashing from the driving wheel at varying water levels. Although both candidates fulfilled the requirements of electric safety validations, the measured indicators from the high-voltage bus and the electrical chassis can be utilized to monitor the design quality of isolation resistance for water protection.

Author Contributions

Conceptualization, methodology, writing—review and editing, S.M.; software, data curation M.D.; validation, S.M. and S.C.; formal analysis, writing—original draft preparation, S.C.; investigation, resources, S.W. and P.B.; visualization, M.D. and S.W.; supervision, funding acquisition, project administration, S.K. All authors have read and agreed to the published version of the manuscript.

Funding

This research was funded by Thailand Automotive Institute grant number: TAI0030/63.

Data Availability Statement

The test data is unavailable due to proprietary information of Thailand Automotive Institute.

Acknowledgments

The authors would like to thank The Sirindhorn International Thai-German Graduate School of Engineering, King Mongkut’s University Technology North Bangkok and Rajamangala University of Technology Phra Na Khon for all resource supports.

Conflicts of Interest

The authors declare no conflict of interest.

References

  1. Licea, M.A.R. Robust lateral and longitudinal stability control for delta three-wheeled vehicles with suspension system. Int. J. Veh. Des. 2021, 87, 49–72. [Google Scholar] [CrossRef]
  2. Chakraborty, S.; Kumar, N.M.A.; Jayakumar, S.; Dash, K.; Elangovan, D. Selected Aspects of Sustainable Mobility Reveals Implementable Approaches and Conceivable Actions. Sustainability 2021, 13, 12918. [Google Scholar] [CrossRef]
  3. Karmaker, A.K.; Hossain, M.A.; Manoj Kumar, N.; Jagadeesan, V.; Jayakumar, A.; Ray, B. Analysis of using biogas resources for electric vehicle charging in Bangladesh: A techno-economic-environmental perspective. Sustainability 2020, 12, 2579. [Google Scholar] [CrossRef] [Green Version]
  4. World Health Organization. Global Plan for the Decade of Action for Road Safety 2021–2030. Available online: https://cdn.who.int/media/docs/default-source/documents/health-topics/road-traffic-injuries/global-plan-for-roadsafety.pdf?sfvrsn=65cf34c8_27&download=true (accessed on 9 November 2021).
  5. Injury Data Collaboration Center; Department of Disease Control; Ministry of Public Health. 43 Files of Accident Data for Injuries and Fatalities from Year 2015 to 2021. Available online: https://dip.ddc.moph.go.th (accessed on 7 November 2021).
  6. Liščák, Š.; Moravčík, Ľ. Safety requirements for road vehicles. Perner’s Contacts 2013, 8, 49–59. [Google Scholar]
  7. Dižo, J.; Blatnický, M. Investigation of ride properties of a three-wheeled electric vehicle in terms of driving safety. Transp. Res. Procedia 2019, 40, 663–670. [Google Scholar] [CrossRef]
  8. Saeedi, M.A.; Kazemi, R. Stability of three-wheeled vehicles with and without control system. Int. J. Automot. Eng. 2013, 3, 343–355. [Google Scholar]
  9. Goodarzi, A.; Soltani, A.; Shojaeefard, M.H.; Khajepour, A. An integrated vehicle dynamic control strategy for three-wheeled vehicles. Proc. Inst. Mech. Eng. Part K J. Multi-Body Dyn. 2015, 229, 225–244. [Google Scholar] [CrossRef]
  10. The United Nations Economic Commission for Europe (UNECE). UN Vehicle Regulations-1958 Agreement: Uniform Provisions Concerning the Approval of Vehicle of Categories L1, L2, L3, L4 and L5 with Regard to Braking R78. 2018. Available online: https://unece.org/fileadmin/DAM/trans/main/wp29/wp29regs/2018/R078r2e.pdf (accessed on 27 November 2021).
  11. Ratchakitcha. Government Gazette to Prescribe Minimal motor Power for Electric Vehicles in Thailand. 2021. Available online: https://ratchakitcha.soc.go.th/documents/17159177.pdf (accessed on 27 July 2022).
  12. Thomas, G. Fundamentals of Vehicle Dynamics; SAE: Warrendale, PA, USA, 2000. [Google Scholar]
  13. Hertz, E.S. The Methodology for Predicting Rollover Risk; National Highway Traffic Safety Administration: Washington, DC, USA, 2010.
  14. İlknur, B.; Aleksandra, F.; San, K.; Rajan, A.; Helene, C.G.; Michael, H.A.; Michael, G.P. The detrimental effects of water on electronic devices. e-Prime-Adv. Electr. Eng. Electron. Energy 2021, 1, 100016. [Google Scholar]
  15. Pathak, S.; Ahmad, M.M. Flood recovery capacities of the manufacturing SMEs from floods: A case study in Pathumthani province, Thailand. Int. J. Disaster Risk Reduct. 2016, 18, 197–205. [Google Scholar] [CrossRef]
  16. Zhang, G. Study on Methods of Electric Vehicle Safety Test. In Proceedings of the 13th International Conference on Man-Machine-Environment System Engineering, Yantai, China, 21–25 October 2013; pp. 133–142. [Google Scholar]
  17. The United Nations Economic Commission for Europe (UNECE). Regulation No. 94 Uniform Provisions Concerning the Approval of Vehicles with Regard to the Protection of the Occupants in the Event of a Frontal Collision. 2017. Available online: https://unece.org/fileadmin/DAM/trans/main/wp29/wp29regs/2017/R094r3e.pdf (accessed on 13 August 2022).
  18. Keskin, M.; Sekerli, Y.E.; Kahraman, S. Performance of two low-cost GPS receivers for ground speed measurement under varying speed conditions. Precis. Agric. 2017, 18, 264–277. [Google Scholar] [CrossRef]
  19. Piriyataravet, J.; Kumwilaisak, W.; Chinrungrueng, J.; Piriyatharawet, T. Determining Bus Stop Locations using Deep Learning and Time Filtering. Eng. J. 2021, 25, 163–172. [Google Scholar] [CrossRef]
  20. Ratchakitcha. Government Gazette for Standard Rural Road in Thailand. Available online: https://www.ratchakitcha.soc.go.th/DATA/PDF/2564/E/025/T_0016.PDF (accessed on 28 September 2022).
  21. Ratchakitcha Government Gazette for Car Park Building in Bangkok. Available online: https://bmc.go.th/wp-content/uploads/2020/05/ (accessed on 20 October 2022).
Figure 1. Safety requirements of electric Tuk-tuks.
Wevj 14 00164 g001
Figure 2. Schematic diagram of a four-wheeled vehicle and a tricycle under static equilibrium.
Wevj 14 00164 g002
Figure 3. Schematic diagram of voltage measurement in an electric tricycle.
Wevj 14 00164 g003
Figure 4. Schematic diagram of a vehicle for brake performance test.
Wevj 14 00164 g004
Figure 5. Schematic diagram of a vehicle and hand force device for the parking performance test.
Wevj 14 00164 g005
Figure 6. Schematic diagram of vehicle and road condition under rollover stability test.
Wevj 14 00164 g006
Figure 7. Schematic diagram of electric Tuk-tuk under urban flooding conditions.
Wevj 14 00164 g007
Figure 8. Speed and force profiles during braking from two electric Tuk-tuk candidates.
Wevj 14 00164 g008
Figure 9. Inconsistent turning under rollover stability test.
Wevj 14 00164 g009
Figure 10. Sample roll rates, linear speed, and lateral acceleration data of the electric Tuk-tuk candidates in the rollover stability test.
Wevj 14 00164 g010
Figure 11. Water splash of the second electric Tuk-tuk candidate at a 30 cm water level.
Wevj 14 00164 g011
Table 1. Procedure of braking performance test.
TopicsEquipment & ToolsTest ConditionsEvaluation
-
Brake performance
-
GPS speed sensor 1
-
Camera recorder for monitoring marks on road 2
-
A set of marks 3
-
Pedal force sensor 4
-
Set driver’s weight of 75 kg
-
Arrange each mark for 1 m long
-
Find the maximum speed
-
Build the test speed at 90% of the maximum speed, if it is lower than 45 km/h, the test speed of 45 km/h is used
-
Apply pedal force of not greater than 500 N
-
Identify the first and final positions of brake application
-
Calculate the stopping distance from both positions
-
Compare the stopping distance with the criterion
Note: Specifications of equipment and sensors. GPS speed sensor 1—records 5 frames per second, speed accuracy of 0.1 knot RMS steady state, position accuracy of less than 15 m at 95% typical. Camera recorder 2—video resolution of 720P (1280 × 720 pixels), records 30 frames per second, camera installation for monitoring marks on road as shown in Figure 5. Marks 3—traffic cone arranged as shown in Figure 5. Pedal force sensor 4—maximum rated capacity of 1 kN with nonlinearity of 0.13%.
Table 2. Procedure of parking performance test.
TopicsEquipment & ToolsTest ConditionsEvaluation
-
Parking performance
-
Road gradient (18%) 5
-
Hand force sensor 6
-
Set driver’s weight of 75 kg
-
Load the passenger compartment until reaching the technically permissible mass
-
Drive the vehicle on inclined panel
-
Apply handbrake force of not greater than 400 N
-
Check whether vehicle has been stationary at least 5 min
Note: Specifications of equipment and sensors. Road 5—surface condition based on Thai Industrial Standards Institute (No. 851-2561). Hand force sensor 6—maximum rated capacity of 1 kN with nonlinearity of 0.13%.
Table 3. Procedure of rollover stability test.
TopicsEquipment & ToolsTest ConditionsEvaluation
-
Vehicle stability at
-
J-turn
-
Outrigger 7
-
GPS speed sensor 1
-
Accelerometer 8
-
Roll rate sensor 9
-
Set driver’s weight of 75 kg
-
Calculate the critical speed
-
Build up speed, starting from 5 km/h, with 2 km/h increments from the previous test, the maximum speed is 20 km/h
-
Maintain vehicle speed on the 3 m wide lane and make J-turn under radial curve of 3 m
-
Terminate when lifting of the inboard rear wheel is detected
-
Monitor whether all wheels of vehicle on the test track and no wheel lifting
Note: Specifications of equipment and sensors. GPS speed sensor 1—records 5 frames per second, speed accuracy of 0.1 knot RMS steady state, position accuracy of less than 15 m at 95% typical. Outrigger 7—geometry and dimensions shown in Figure 6. Accelerometer 8—maximum rated capacity of 49.03 m/s2 with nonlinearity of 0.6%. Roll rate sensor 9—maximum rated capacity of 900 degree/s.
Table 4. Procedure of electrical safety test.
TopicsEquipment & ToolsTest ConditionsEvaluation
-
Isolation resistance under flooding conditions
-
Vehicle speedometer
-
Rectangular tank with water
-
Chassis supporters
-
Voltmeter 10
-
Load vehicle into the rectangular tank on the chassis supports
-
Measure V b , V 1 , and V 2
-
Install R o in vehicle
-
Fill water in the tank up to 20 cm above the lowest part of wheel
-
Maintain vehicle speed of 20 km/h for 3 min
-
Measure V 1 or V 2 over R o
-
Calculate R i
-
Repeat the process of calculation of R i at different water level of 25 and 30 cm
-
Calculate whether val-ues of R i over DC and AC buses are more than 100 Ω/ V and 500 Ω/ V
Note: Specifications of equipment and sensors. Voltmeter 10—accuracy is about ±1% for a 3-digit digital voltmeter.
Table 5. Specifications of the electric Tuk-tuk candidates.
ItemsSpecification
1st Candidate2nd Candidate
Vehicle type 3-wheel symmetrical vehicles
Total weight (kerb mass) 655 kg614 kg
Total weight (driver mass + passengers mass) 950 kg799 kg
Front axle weight 344 kg308 kg
Rear axle weight 606 kg491 kg
Overall length 3950 mm3430 mm
Overall width 1500 mm1470 mm
Overall height 1980 mm1870 mm
Vehicle wheel base between the front and the rear axles 2480 mm2195 mm
Track distance between both rear wheels 1294 mm1340 mm
Distance of the centre of gravity from the front wheel 1582 mm1349 mm
Height of the centre of gravity 653 mm589 mm
Transmission manualmanual
Tire 155/70R12155/70R12
Tire pressure (front/rear) 30/30 psi30/30 psi
Brake (rear brake only) drum brakedrum brake
Suspension
Front: shock absorber with coil spring hydraulichydraulic
Rear: leaf spring and shock absorber hydraulichydraulic
Absorber stroke for front/rear 178 mm/152 mm154 mm/140 mm
Cylinder diameter of shock absorber for front/rear 25 mm/49 mm20 mm/38 mm
Absorption/Damping action Compression/
Extension
Compression/
Extension
Shock absorber 4200 Ns/m3800 Ns/m
Leaf spring stiffness 123.06 kN/m123.06 kN/m
Front caster angle (ϕ) 32.8°32.6°
Distance between centre to the leaf spring 362 mm345 mm
Tilt angle of the rear absorber to vertical (γ) 15.8°15.4°
Battery hi-voltage 79.8 Vhi-voltage 79 V
Battery type lithium ionlithium ion
Battery capacity 400 Wh400 Wh
Input AC Adapter
14 V–40 V
AC Adapter
14 V–40 V
Output AC 220 V–50 Hz
DC 12 V/2 × 3 A
AC 220 V–50 Hz
DC 12 V/2 × 3 A
Wevj 14 00164 i001
Table 6. Results from braking performance test.
VehiclesMax Speed
(km/h)
Test Speed
(km/h)
Actual Speed When Actuate Brake (km/h)Max Pedal Force (N),
<500 N
Actual Stopping Distance (m), Calculated from Video CameraCorrected Stopping Distance (m)Pass Criterion for Stopping Distance (m)Judgement
1st candidate47.845 ≤12.15Pass
#1 41.352749.6010.97
#2 44.6227316.6016.85
#3 53.0326013.0410.07
#4 45.0927011.7011.66
#5 47.2826515.5014.26
#6 45.7326315.0014.60
2nd candidate49.245 ≤12.15Not pass
#1 45.6022517.8017.39
#2 45.0023014.9714.97
#3 44.8024913.7013.80
#4 44.3024514.3214.71
#5 44.4025012.8013.09
#6 44.8224014.7214.82
Table 7. Results from parking on a road gradient test.
VehiclesHand Brake Force (N),
<400 N
Parking Duration (min)Judgement
1st candidate1675Pass
2nd candidate1945Pass
Table 8. Results from parking on a road gradient test.
VehiclesCritical Speed (km/h)Maximum Speed in Curve (km/h)Notes
1st candidate15.5216.53Wheel lift
2nd candidate16.3220.97No wheel lifting
Table 9. Experimental results of first candidate under urban flooding test conditions for isolation resistance.
Water Level (cm) V b
(Volt)
V 1
(Volt)
V 2
(Volt)
V 1
(Volt)
R o
(Ω)
R i
(Ω)
R i / V b
(Ω/Volt)
2078.81.51.00.030813020,927,704265,580
2578.81.51.00.030813020,927,704265,580
3078.81.61.20.028813022,497,740285,504
Table 10. Experimental results of second candidate under urban flooding test conditions for isolation resistance.
Water Level (cm) V b
(Volt)
V 1
(Volt)
V 2
(Volt)
V 1 , 2
(Volt)
R o
(Ω)
R i
(Ω)
R i / V b
(Ω/Volt)
2079.715.0810.410.018813035,954,865451,127
2579.714.1012.860.018813035,951,878451,090
3079.78.1975.602.8348130220,0672761
Disclaimer/Publisher’s Note: The statements, opinions and data contained in all publications are solely those of the individual author(s) and contributor(s) and not of MDPI and/or the editor(s). MDPI and/or the editor(s) disclaim responsibility for any injury to people or property resulting from any ideas, methods, instructions or products referred to in the content.