Article

Optimized Integration of Medium-Voltage Multimegawatt DC Charging Stations: Concepts, Guidelines and Analysis

1
Power and Renewable Gas Systems, AIT Austrian Institute of Technology, 1210 Vienna, Austria
2
Montanuniversität Leoben, Department of Electrical Engineering, 8700 Leoben, Austria
*
Authors to whom correspondence should be addressed.
World Electr. Veh. J. 2024, 15(10), 450; https://doi.org/10.3390/wevj15100450
Submission received: 30 August 2024 / Revised: 24 September 2024 / Accepted: 27 September 2024 / Published: 3 October 2024
(This article belongs to the Special Issue Data Exchange between Vehicle and Power System for Optimal Charging)

Abstract

:
The integration of multimegawatt fast chargers into local distribution grids is becoming increasingly relevant due to recent initiatives to push for higher charging power, especially for applications like heavy-duty vehicles. However, the high-power capacity of these chargers, especially when multiple units operate simultaneously at specific locations, raises several important considerations for the optimal design and integration of multimegawatt fast chargers. These include, for example, power electronics architectures and dedicated designs, grid stability, and the incorporation of renewable energy systems. Thus, this paper provides a comprehensive analysis of the key factors influencing the optimal integration of these ultra-high-power chargers, looking into impacts on medium-voltage (MV) networks, the design considerations for medium-voltage power electronics in DC chargers, and the potential of renewable energy systems to offset grid demand. Additionally, this paper explores the potential high-level communication requirements necessary for efficient and reliable charger operation, including a proposal for a robust communication interface layer stack. This investigation aims to provide a holistic understanding of the challenges and opportunities associated with integrating multimegawatt fast chargers into existing power systems, offering insights into the enhancement of both performance and sustainability.

1. Introduction

The transition towards clean and efficient transportation through electric mobility introduces significant technical challenges for modern electricity grids. As electric vehicles (EVs) become more prevalent, one of the major obstacles to their broader adoption is range anxiety, which the availability of fast charging stations can mitigate. Fast charging is the charging of EVs with charging power greater than 50 kW [1]. It is typically implemented in medium-voltage (MV) networks and offers a more efficient solution than slower charging stations connected to low-voltage distribution networks. By requiring a reduced number of new network connections and occupying less surface area, fast charging stations not only reduce the burden on low-voltage grids but also provide a more predictable aggregate demand [2]. This predictability facilitates the integration of renewable energy sources such as photovoltaic (PV) systems and battery storage, thereby contributing to the overall goal of reducing CO2 emissions.
Despite the need for fast charging, current technologies only offer power capabilities ranging from 50 kW to 350 kW [3]. This is because a crucial element in the successful deployment of fast charging infrastructure is the design of power electronics, which becomes even more critical in the case of multimegawatt DC chargers. These chargers are essential for enabling efficient and rapid EV charging of heavy-duty battery electric vehicles (HDBEVs) such as trucks. The design of power electronics for such high-power chargers demands careful consideration of several factors, including the selection of components capable of handling high power levels, the design of converters to ensure efficient energy transfer, and the implementation of control strategies to manage voltage and current levels effectively. Additionally, addressing thermal management, electromagnetic compatibility, and adherence to safety standards is crucial for ensuring these charging stations’ reliable and durable operation. By following these design principles, multimegawatt medium-voltage DC chargers can significantly enhance the efficiency and reliability of the EV charging infrastructure, further supporting the transition to electric mobility.
Austria offers a relevant case study of the shift towards electric mobility. With a notable increase in the number of registered plug-in hybrid electric vehicles (PHEVs) and battery electric vehicles (BEVs), the country is making significant progress toward an electric transportation future. By the end of 2023, approximately 155,500 BEVs and 251,000 PHEVs were registered in Austria [4]. Additionally, as of August 2023, the Austrian charging network comprised 18,386 regular charging points (charging power ≤ 22 kW), 2794 fast charging points (charging power: 22–150 kW), and 869 ultra-fast charging points (charging power > 150 kW), totaling 22,049 publicly accessible charging points [5]. However, the rapid growth in EV adoption raises critical concerns regarding the readiness of power grids to accommodate the additional load. Uncontrolled and random charging patterns could lead to various grid issues, including voltage deviations, increased distribution losses, peak power demand spikes, and overall degradation in power quality. These challenges highlight the importance of ensuring that electrical infrastructure can support the growing demand for EV charging without compromising grid stability or reliability.
This paper presents an approach to the design of multimegawatt DC chargers and investigates the grid-side requirements. It explores the development of communication protocols between charging stations and EVs and assesses the impact of charging stations on network stability. Furthermore, this paper examines the potential of integrating battery energy storage systems (BESSs) and PV systems to enable zero-emission charging solutions. The findings aim to provide a comprehensive understanding of the challenges and opportunities associated with the widespread adoption of electric mobility, particularly in the areas of power electronics design, grid infrastructure readiness, and sustainability.

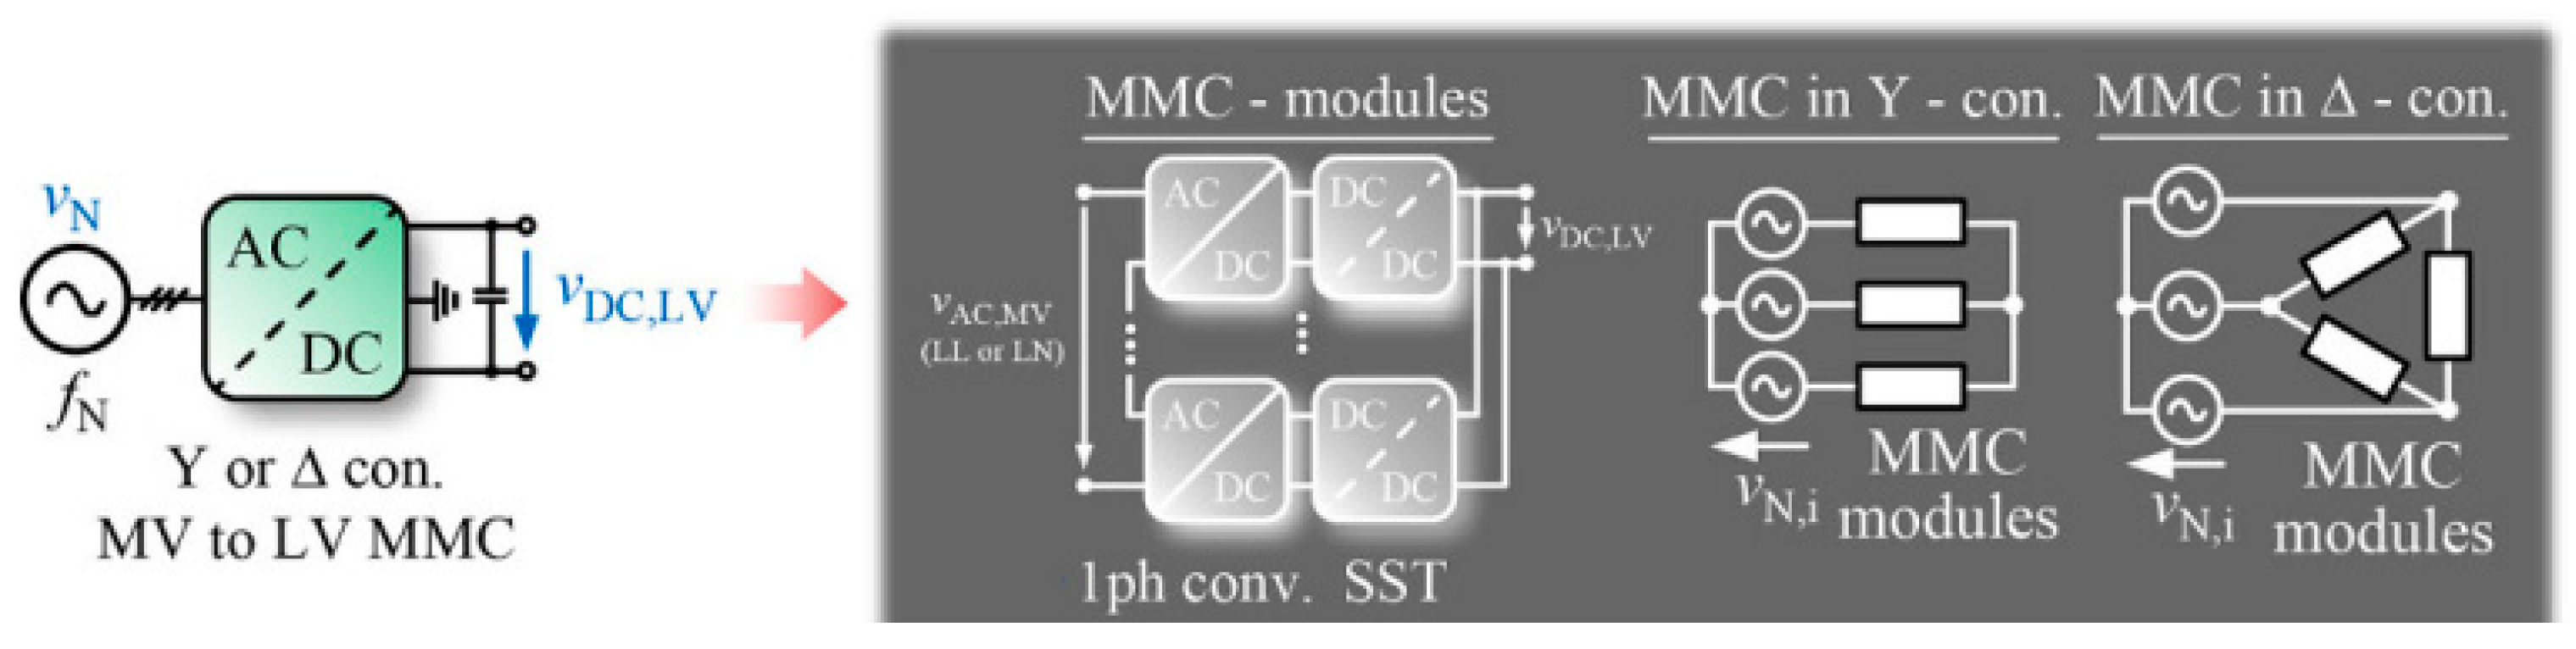
2. Power Electronics Design Guidelines and Aspects for a Medium-Voltage, Medium-Frequency Based Multimegawatt DC Charger

2.1. Key Aspects

In [6,7], Makoschitz outlined vital aspects of multimegawatt fast charging concepts. This scientific work offers design guidelines for power electronics and highlights critical factors for medium-voltage, medium-frequency-based multimegawatt DC chargers. In [6], three primary architectures for integrating a power electronics circuit within a medium-voltage grid were discussed.
The most common and popular approach is shown in Figure 1. A medium-voltage transformer is connected to the grid, followed by a low-voltage converter stage. A medium voltage-to-low voltage transformer reduces the input voltage to levels where commercially available active or passive semiconductors can be used with blocking voltages up to 1200 V. The key advantage of this method is that it comes with low complexity, as standard control concepts can be applied, and converters can be paralleled if the available semiconductor modules do not meet system requirements. However, the downside is that this approach relies on a low-frequency transformer (with the potential additional of medium-frequency or high-frequency isolation if more than one car or truck needs to be charged from the same DC link), which must handle the total power at the mains frequency (50 Hz for European grids). This results in a bulky transformer, making it unsuitable for applications or locations with space constraints or infrastructure limitations.
Figure 2 illustrates a second version of a medium-voltage rectifier based on a medium-frequency transformer within the converter, a solution commonly referred to as solid-state transformer (SST) technology. This architecture employs several low-voltage or medium-voltage converter modules in a serial input–parallel output (SIPO) configuration. Due to its modular nature, this system is called a modular multi-level converter (MMC). MMCs can be connected at the input either in a star (Y, generating their own artificial star point) or delta (Δ, with each MMC branch linked between two main phases) configuration. The modular design allows for easy extension and stacking of modules for higher voltage levels, provided that the integrated SST can maintain the necessary isolation between the primary and secondary sides of the medium/high-frequency transformer.
Figure 3 depicts a medium-voltage rectifier, which creates a medium-voltage DC link (VDC, MV). The voltage level of this DC link depends on the topology and modulation strategy. Further details are discussed in the following section. Initial values for different solutions and grid voltage levels are provided in Figure 3. In all cases, the DC-link voltage exceeds the grid’s line-to-line voltage, necessitating an additional DC/DC stage to step down the medium-voltage DC link to a level at or below 1.5 kV. Moreover, isolation requirements must be met using a solid-state transformer (SST). The DC/DC converter comprises two distinct power stages. Like the previously discussed LLC or DAB solution, the SST utilizes a DC/AC circuit to convert the DC input into an AC signal with high switching frequency, followed by a medium- or high-frequency transformer and a dedicated AC/DC power stage.
To handle the total voltage of VDC,MV, multiple SSTs are connected in series on the transformer’s primary side. To achieve a low-voltage, high-current output, the secondary sides of all converters are connected in parallel, a configuration known as SIPO. Figure 4 depicts a megawatt charger, which is based on a medium-voltage rectifier and an actively controlled isolated SST to charge the vehicle or an alternative based on the SST stage, which merely provides a predefined, fixed, low-voltage bus level using an optional DC/DC converter, to charge a truck. In this specific case, all three stages must be able to deliver the full requested power. As shown in Figure 4, the vital advantage of this approach is the availability of two separate DC-link connections—one on the medium-voltage side (primary) and the other on the low-voltage side (secondary). This design allows for the integration of renewable energy systems (RESs) on either side of the equipment (indicated in green). As a result, the system can continue to operate, even during an AC grid outage, if, for example, PV power plants are integrated into a medium-voltage DC bus. Additionally, the medium-voltage rectifier can be placed near an MV AC bus.
At the same time, the SST can be located near a vehicle or charging station/building, utilizing long cables from the MV rectifier to the SST with minimal copper mass. Furthermore, additional isolated DC chargers can be easily incorporated due to the medium-voltage DC link being shared.
Experts explored various charging concepts in [7,8] and studied several power flow topologies, such as LLC, DAB, etc., in detail. Among these, DAB stands out for its simple design, high power density, wide voltage conversion range, and soft switching capabilities. It features a high-frequency transformer between two full-bridge circuits that ensure galvanic isolation. The growing use of DAB in electric vehicle (EV) charging infrastructure is driven by its ability to support bidirectional adjustable power flow. Despite the complexity of its topology, which includes eight power switches, its inherent advantages make it an ideal choice for high-power DC fast charging applications. DAB is crucial in regulating the DC voltage supplied to vehicles from a three-phase rectifier in such applications. The primary objective of this scientific paper is to develop an appropriate topology specifically a DAB-based SST for the creation of a multimegawatt fast charging station. Figure 5 illustrates the primary concept of a DAB-based medium-voltage SST. Each cell of the SST branch only needs to deliver a fraction of the total power, which is limited by the required voltage level on the primary side, the semiconductor blocking capability plus an additional safety margin (km) considering voltage imbalances and ringing, and an operating redundancy (kr) that the power stage should provide. Thus, the nominal power per SST cell results in
P S S T = P n o m N ( V D C · V m a x , s e m i · k m · k r ) .
The following chapters delve into the specifics of the DAB topology and its SIPO configuration. First, maximum power transfer in a dual active bridge must be understood. Next, the essential guidelines for transformer selection are explored. Finally, the reference power electronics design of a medium-voltage SIPO module is examined.
The most straightforward way to describe power flow in a DAB is by comparing it to the power flow between two voltage sources in power system engineering. Figure 6 shows two voltage sources connected through a line reactance (L). When voltage source VSA leads voltage source VSB, power naturally flows from VSA to VSB, as illustrated in (2).
P = V S A · V S B · s i n 2 · π · f · L
In a DAB converter, power transfer between two DC sources is achieved by generating high-frequency square waves using semiconductor switches. These square waves are phase-shifted relative to each other, enabling power to flow from the leading bridge to the lagging bridge.
This fixed-frequency, square-wave operation leverages the leakage inductance of the high-frequency transformer as the primary energy transfer element. Furthermore, the direction of power flow can be easily reversed by adjusting the phase shift between the two bridges for vehicle-to-grid application. This flexibility allows for efficient and straightforward bidirectional power transfer in a DAB, as illustrated in Figure 7. The following sections provide an in-depth explanation of the implementation of a single-phase DAB converter.

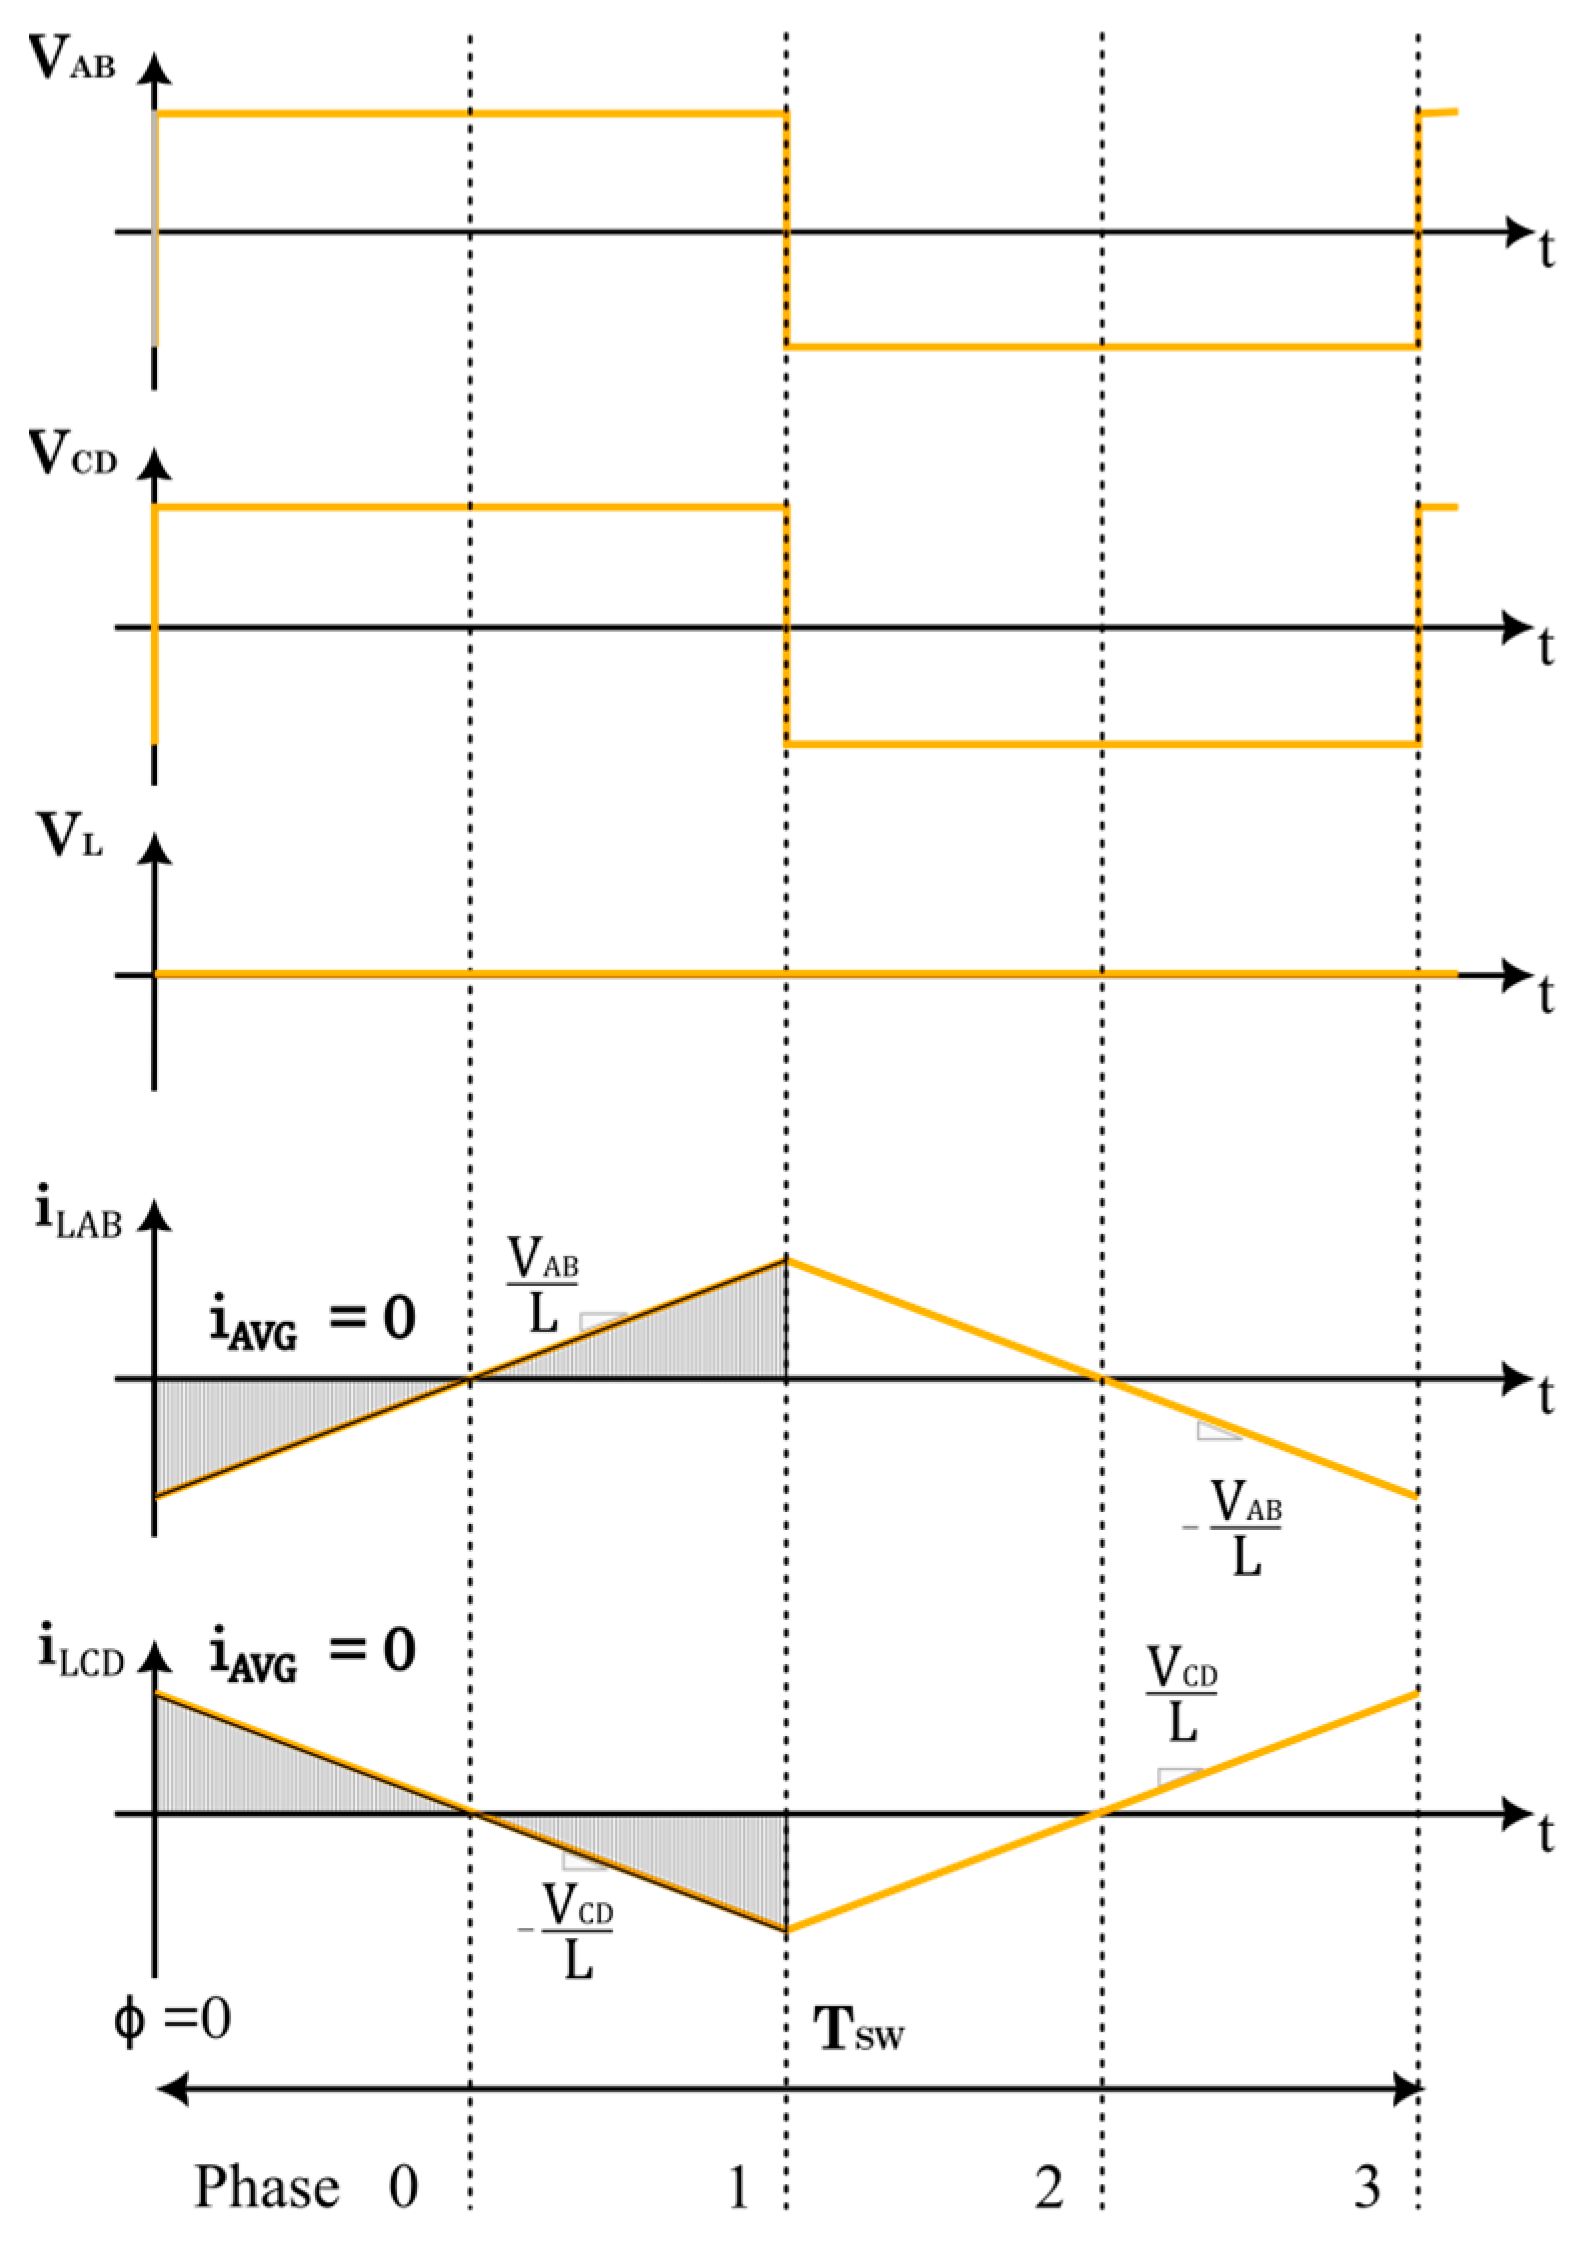
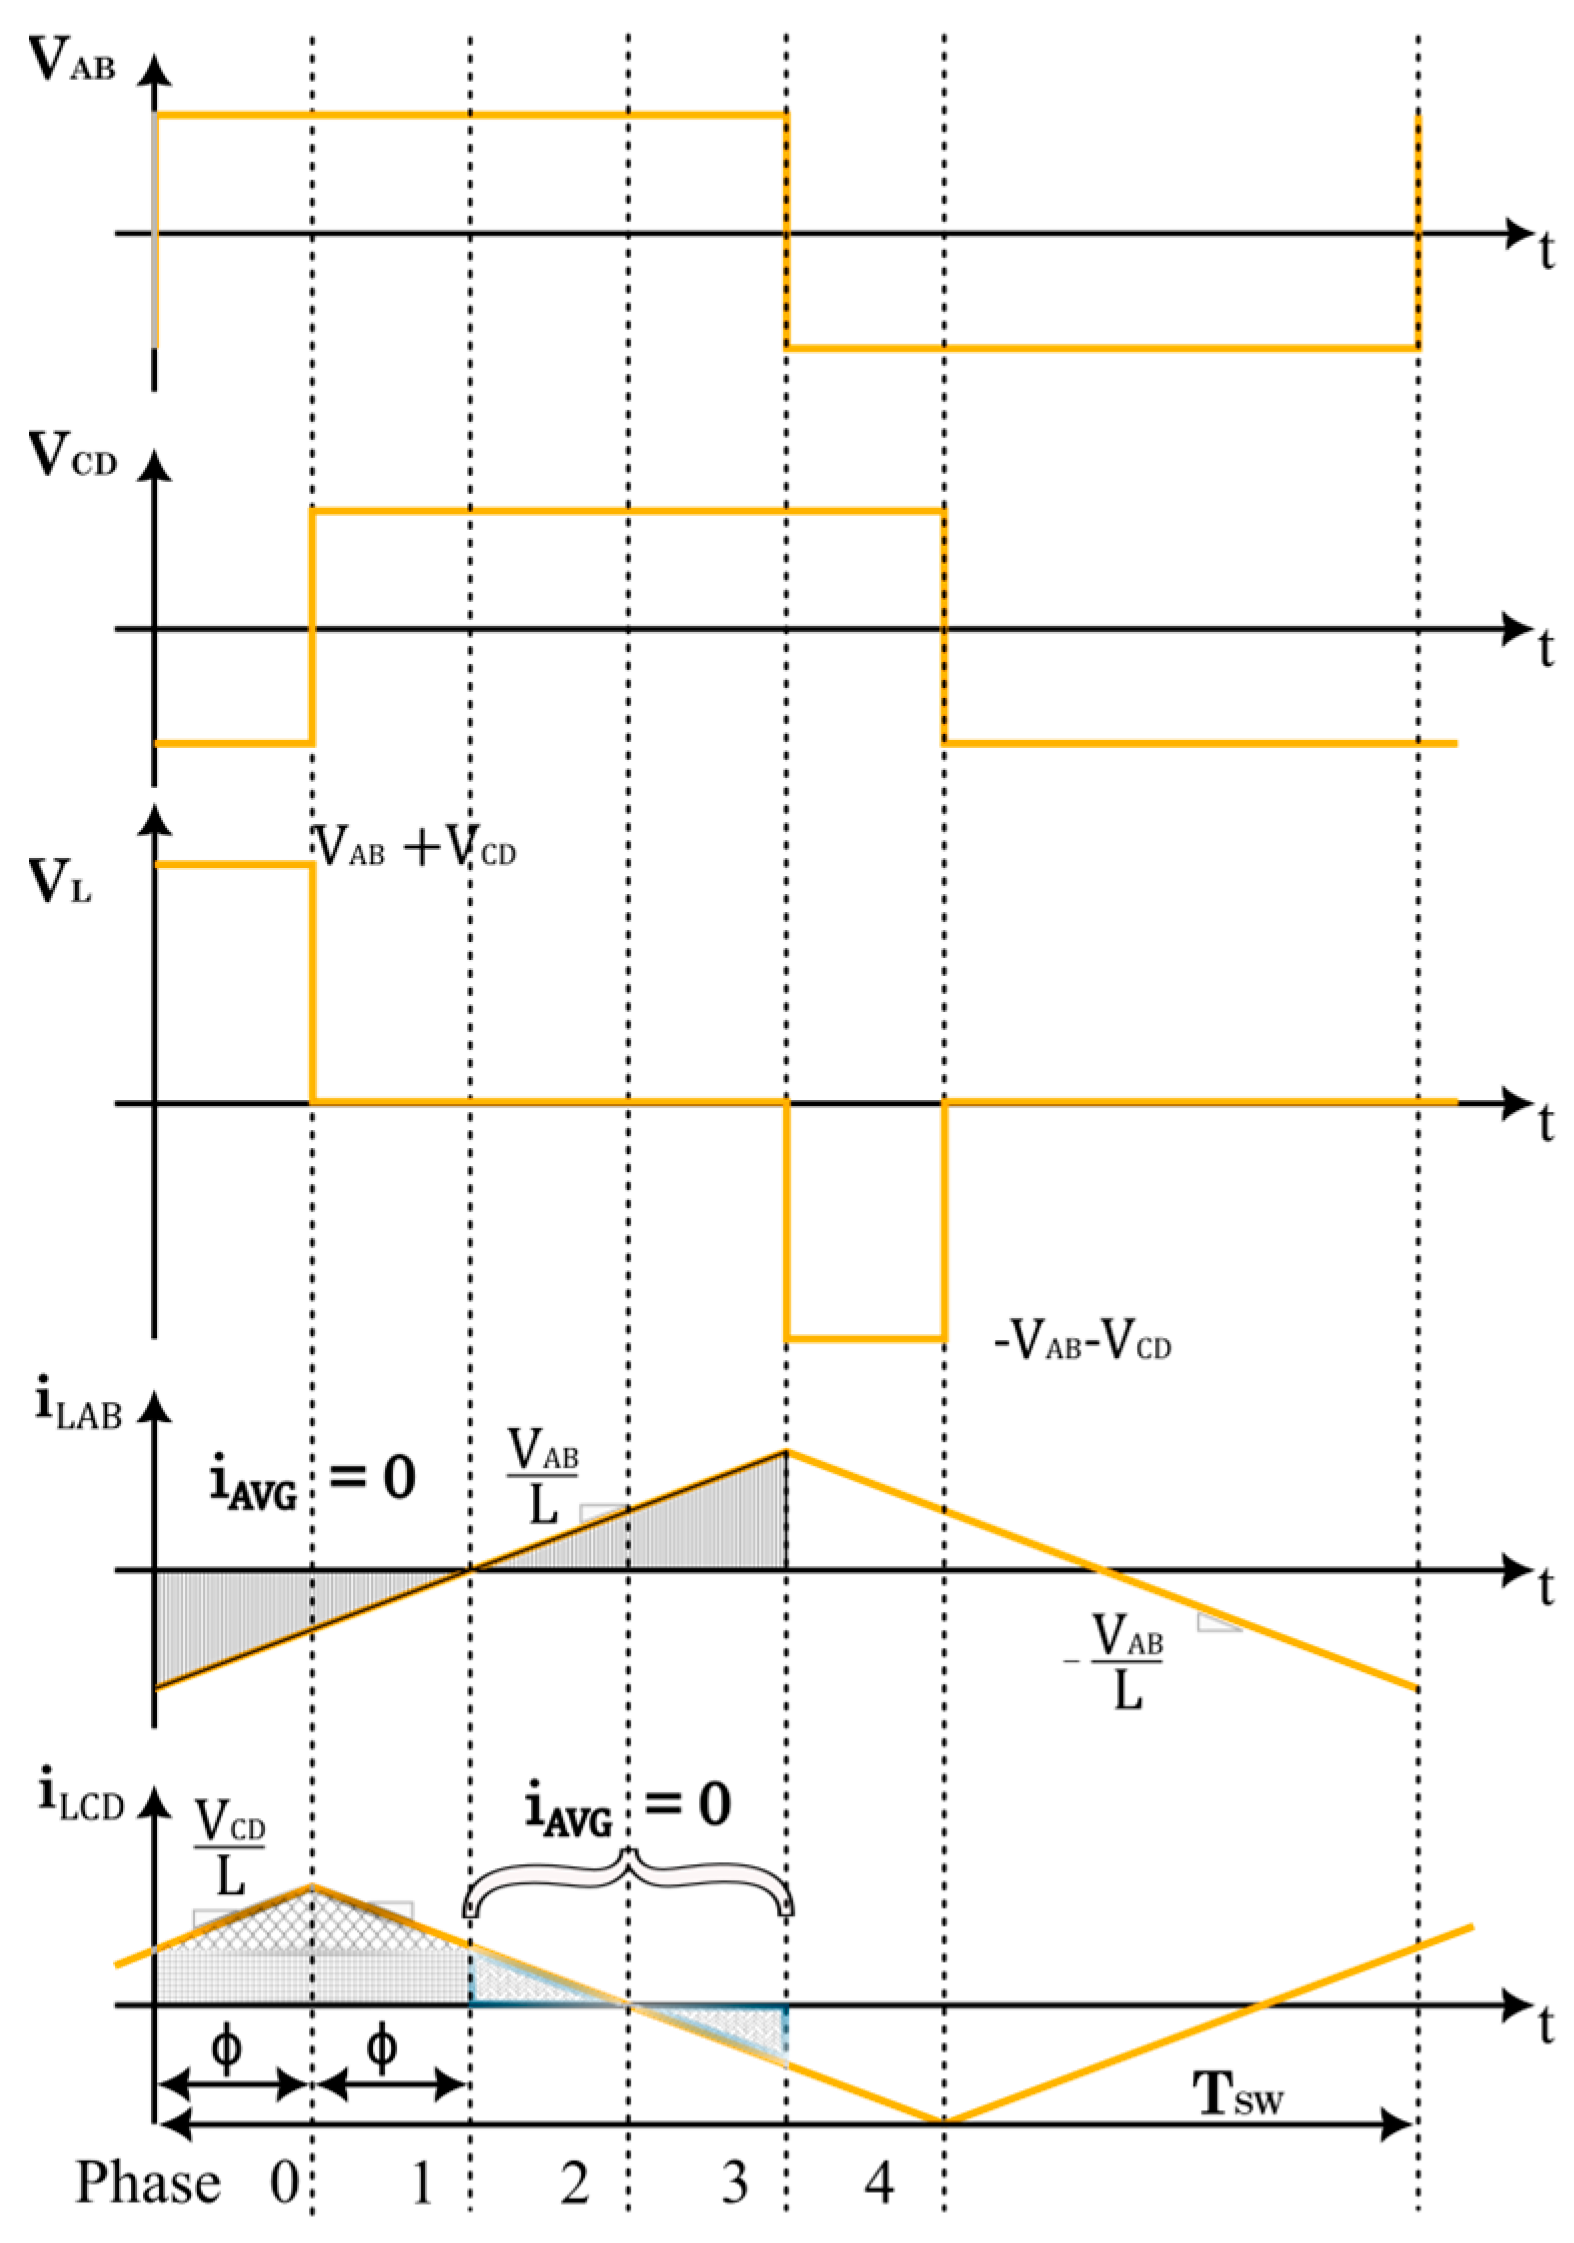
2.2. Power Transfer Mechanism in a Dual Active Bridge Converter

To provide an intuitive explanation of power transfer in a dual active bridge, it is helpful to first consider two full-bridge circuits (H bridges) connected through an inductor (L), as shown in Figure 8. Additionally, the converter’s output is assumed to be short-circuited. The primary side of the system should be operated to generate a square-wave voltage with a 50% duty cycle on VAB. On the secondary side, the semiconductor switch pairs (Q5, Q8 and Q6, Q7) should switch in phase with the switch pairs on the primary side (Q1, Q4 and Q2, Q3) to establish the square-wave voltage across VCD. The average current through the inductor (L) can be expressed by applying superposition theory [8]. The total average current flow through the physical inductor is the sum of the current ILAB and ILCD. Voltage sources VAB and VCD voltage contribute to the average inductor current, cancelling each other out (see Figure 9).
As shown in Figure 10, by phase shifting the secondary switching by an interval of ϕ, VCD begins to contribute an average current through the inductor. Although VCD’s contribution to its own average current is zero, it still affects the overall current through the inductor.
The average current through the inductor during the phase shift (ϕ) can now be calculated by using arithmetical operators. Therefore, the average inductor current (IL) can be expressed as follows:
I L = ϕ · 1 ϕ T s w L · V C D
Equation (3) and Figure 10 clearly demonstrate that this converter’s input current is a function of the output voltage (VCD), where ϕ represents the phase-shift angle between primary and secondary square waves and TSW denotes the switching period.

2.2.1. Impact of Leakage Inductance on Power Transfer

In a galvanically isolated DAB converter, the leakage inductance of the high-frequency transformer is essential in facilitating energy storage and transfer from the primary full bridge to the secondary full bridge of the converter. The power transfer in the DAB converter depends on both the phase shift (ϕ) and the leakage inductance of the transformer. The average power transfer (Pavg) can be expressed as follows:
P a v g = n · V P R I · V S E C · s i n ϕ 2 · π · f s w · L σ
where VPRI and VSEC are the amplitude of the square-wave voltages on the primary and secondary side, respectively; n is the turns ratio of the high-frequency transformer; Lσ is the leakage inductance of the transformer; fSW is the switching frequency of the converter; and ϕ is the phase shift between the primary and secondary voltage waveform. For a given phase shift (ϕ), the power transfer capability is inversely proportional to the leakage inductance (Lσ). A higher leakage inductance reduces power transfer at the same phase shift, as it limits the current for a given voltage difference. Additionally, the energy accumulated in the leakage inductance during a given phase-shift interval results from the current flowing through it. This stored energy impacts both the efficiency and the amount of current in the circuit, directly influencing power transfer.
Figure 11 illustrates the MOSFET gate signals for the switches on both the primary and secondary sides. The variable ϕ represents the phase shift between the PWM pulses of the primary and secondary sides. VPRI and VSEC denote the voltages on the primary and secondary windings of the transformer, respectively, while IL represents the transformer current.

2.2.2. Impact of Output Capacitance on Power Transfer

The output capacitor (C2), as depicted in Figure 7, is responsible for managing the output ripple. The value of the output capacitance directly influences the output voltage. The current through the capacitor (IC2) can be expressed as follows:
I C 2 = I o u t S e n s 2 I b a t t S e n s
Hence, the output capacitance can be calculated as follows:
C = V 1 ϕ 2 · π · f · L σ · 1 ϕ T S W V B A T T R B A T T · T S W V 2
Equation (6) demonstrates the leakage inductor’s impact on the selection of output capacitance. As system requirements specify, the capacitance required to control voltage ripple increases with rising leakage inductance for a given phase shift (ϕ). This occurs because the phase shift varies in response to changes in leakage inductance.

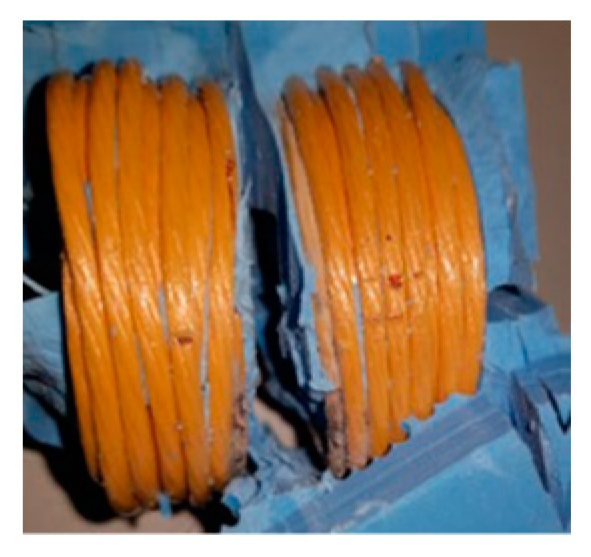
2.3. Design Guideline for Medium-Voltage, Medium-Frequency Transformers

In this converter design, transformers and inductors are crucial in managing power flow and contribute significantly to the system’s overall size. Increasing the operating frequency can reduce the size of the passive components; however, pushing the switching frequency beyond a certain threshold negatively impacts the power module’s efficiency due to the pronounced skin effect, whereby current flows primarily along the outer surface of the conductor. Similarly, the proximity effect causes current to concentrate on conductor surfaces nearest to each other. Therefore, optimizing conductor size and the number of layers is critical in high-frequency designs. However, the task is not without its challenges. Ensuring compliance with IEC 60676-3 [9] isolation standards, given the connection of the primary side of the dual active bridge to the 20 kVrms medium-voltage feeder through the input AC/DC stage presents a significant and complex challenge.
Typically, a 50 Hz, 3 MW power transformer occupies a volume of 8 m3. If this volume is divided into fifteen DAB cells and six branches, the volume of each cell would be approximately 88 dm3 at a 50 Hz line frequency. According to transformer law, increasing the line frequency by a factor of ten reduces transformer volume by a factor of four. As a result, the target volume for each transformer should be kept below ~7 dm3 (see Table 1 and Figure 12).
As illustrated in Figure 13, the blue putty was engineered to meet the insulation requirements. During the first revision (see Figure 14), the insulation material was cast under atmospheric pressure, resulting in numerous air pockets throughout the insulation.
This led to partial discharges during testing at 16 kV, with complete insulation breakdown occurring at 35 kV. During the second revision, the putty was poured under a vacuum, significantly reducing air pockets. The insulation test was successfully passed at 56 kV for one minute (see Figure 15). In this instance, insulation breakdowns occurred between the primary and secondary coils of the transformer (see Figure 16).

2.4. Design Guideline for Medium-Voltage DAB and Its SIPO Configuration

The preceding chapters have outlined the power transfer mechanism between the primary and secondary sides of a DAB converter and design guidelines for a medium-frequency, high-power transformer. This chapter focuses on developing a suitable DAB module and connecting two modules in an SIPO configuration. The reference design presented in Figure 17 offers a detailed overview of the implementation of a single-phase DAB converter.
Table 2 describes key design specifications, including the requirement for a full-load efficiency of at least 97% at an output power of 40 kW.
Figure 7 illustrates the system layout of the single-phase DAB converter. The system is divided into the following four main parts: the power stage, the control stage, the auxiliary power supply, and the connection in the SIPO configuration to reach an overall power rating of 100 kW. The following sections highlight the operating principles of the essential components used in this system.

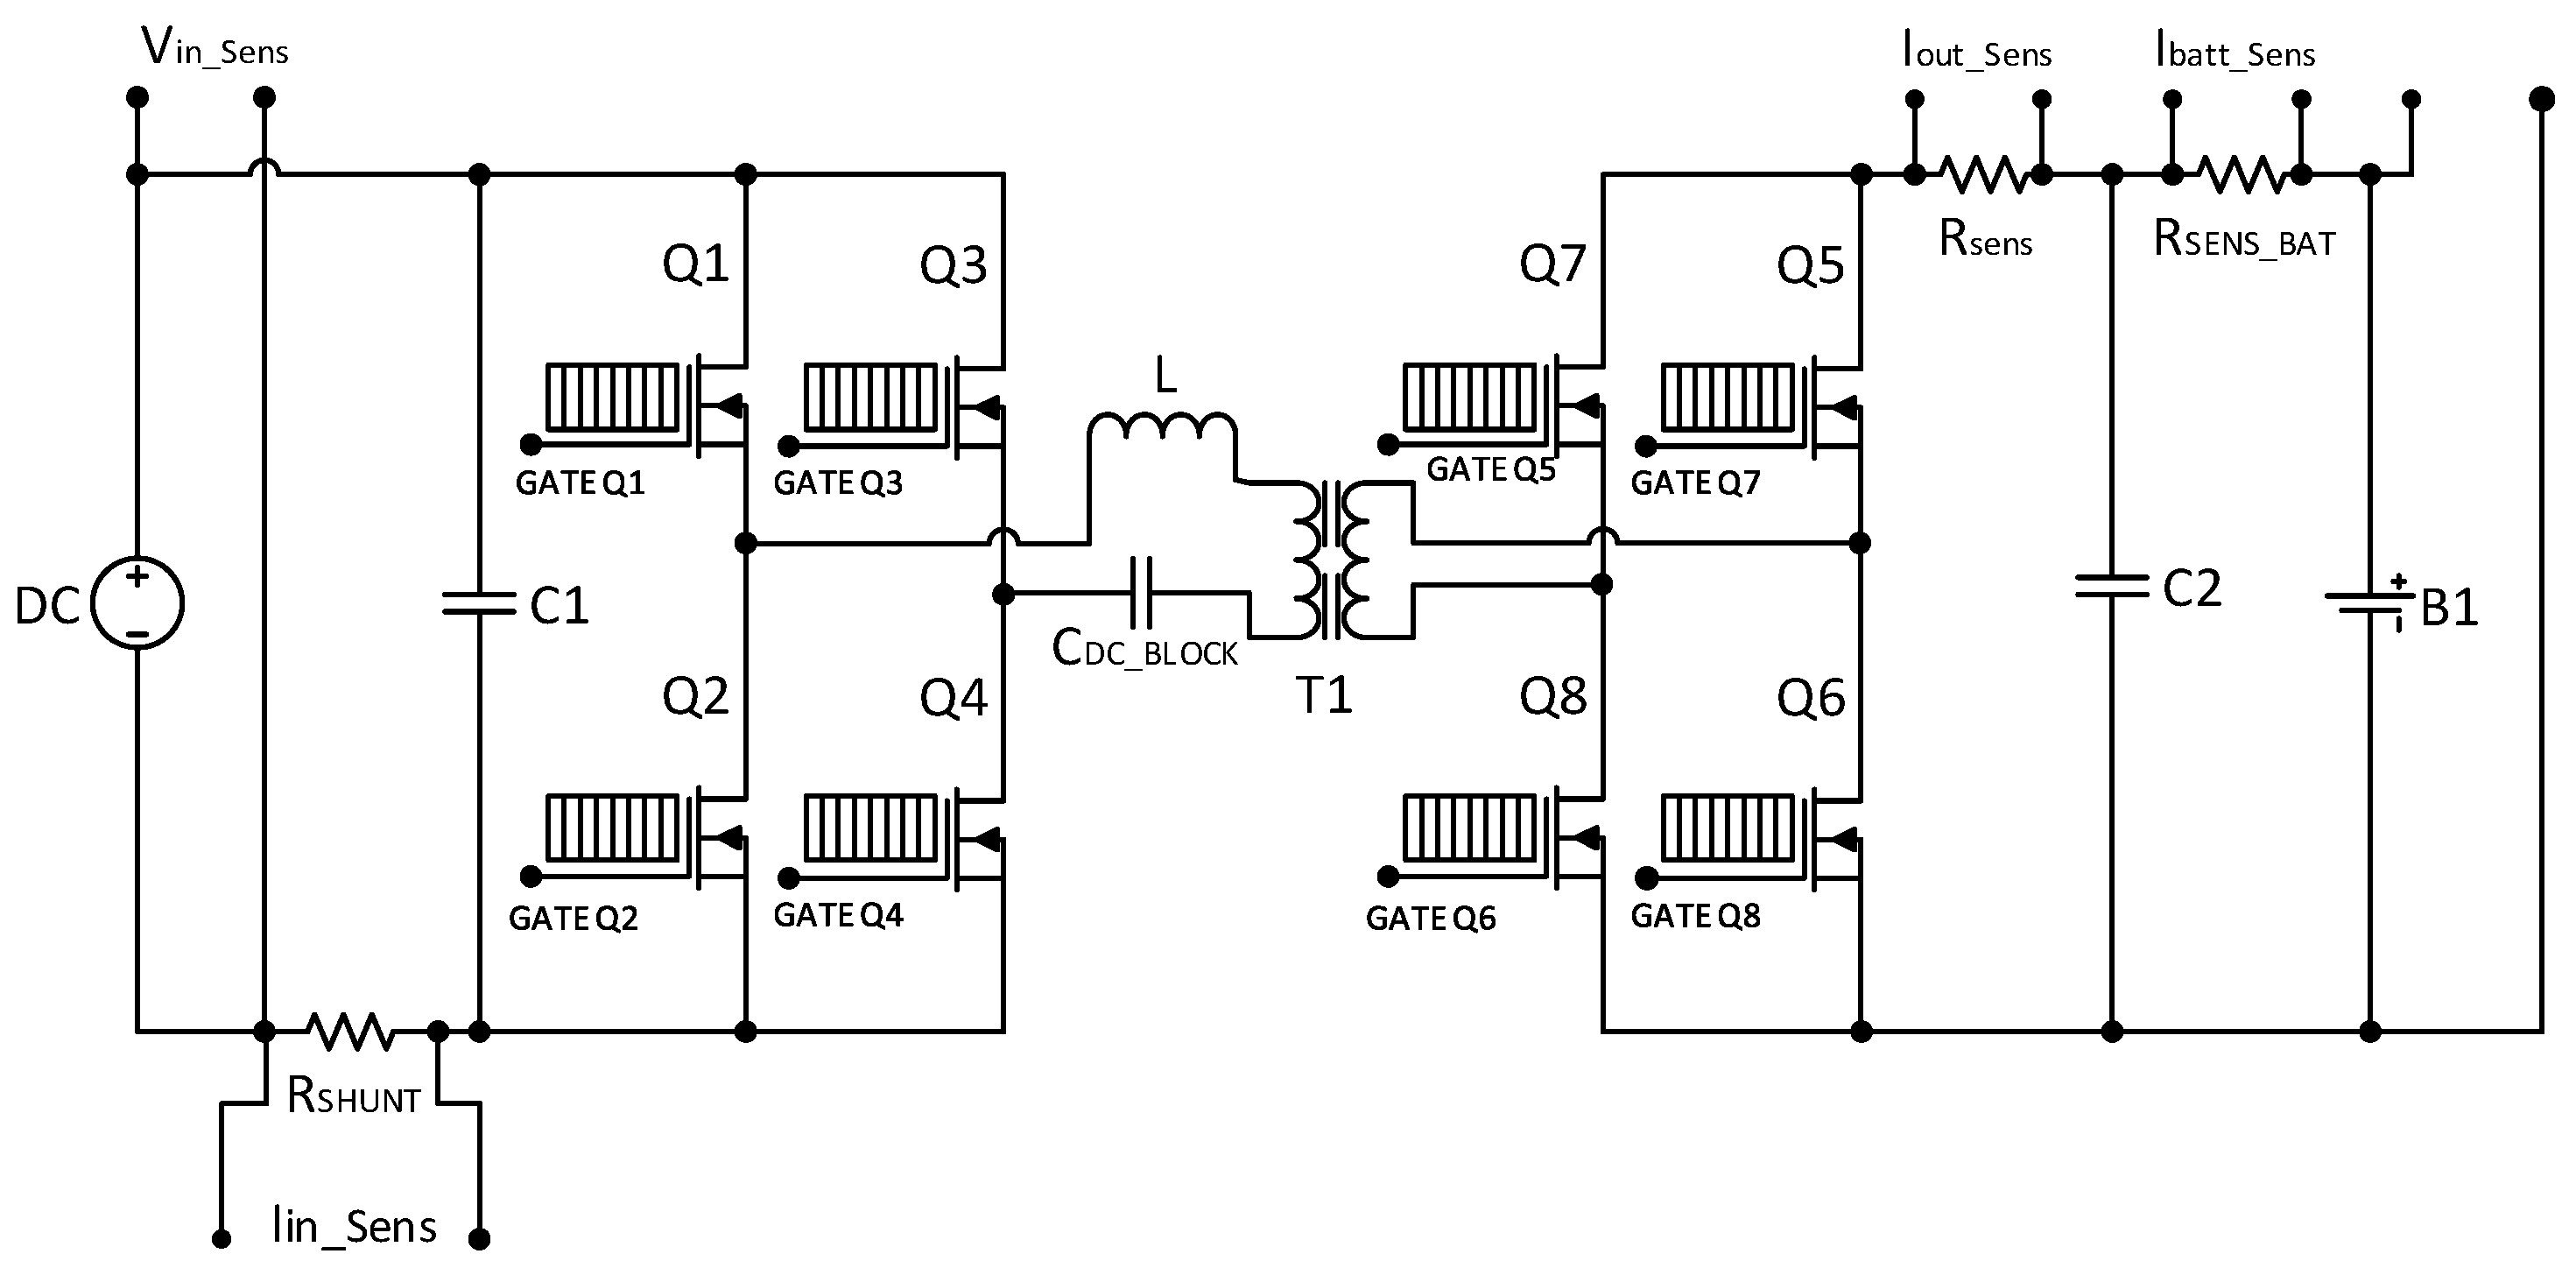
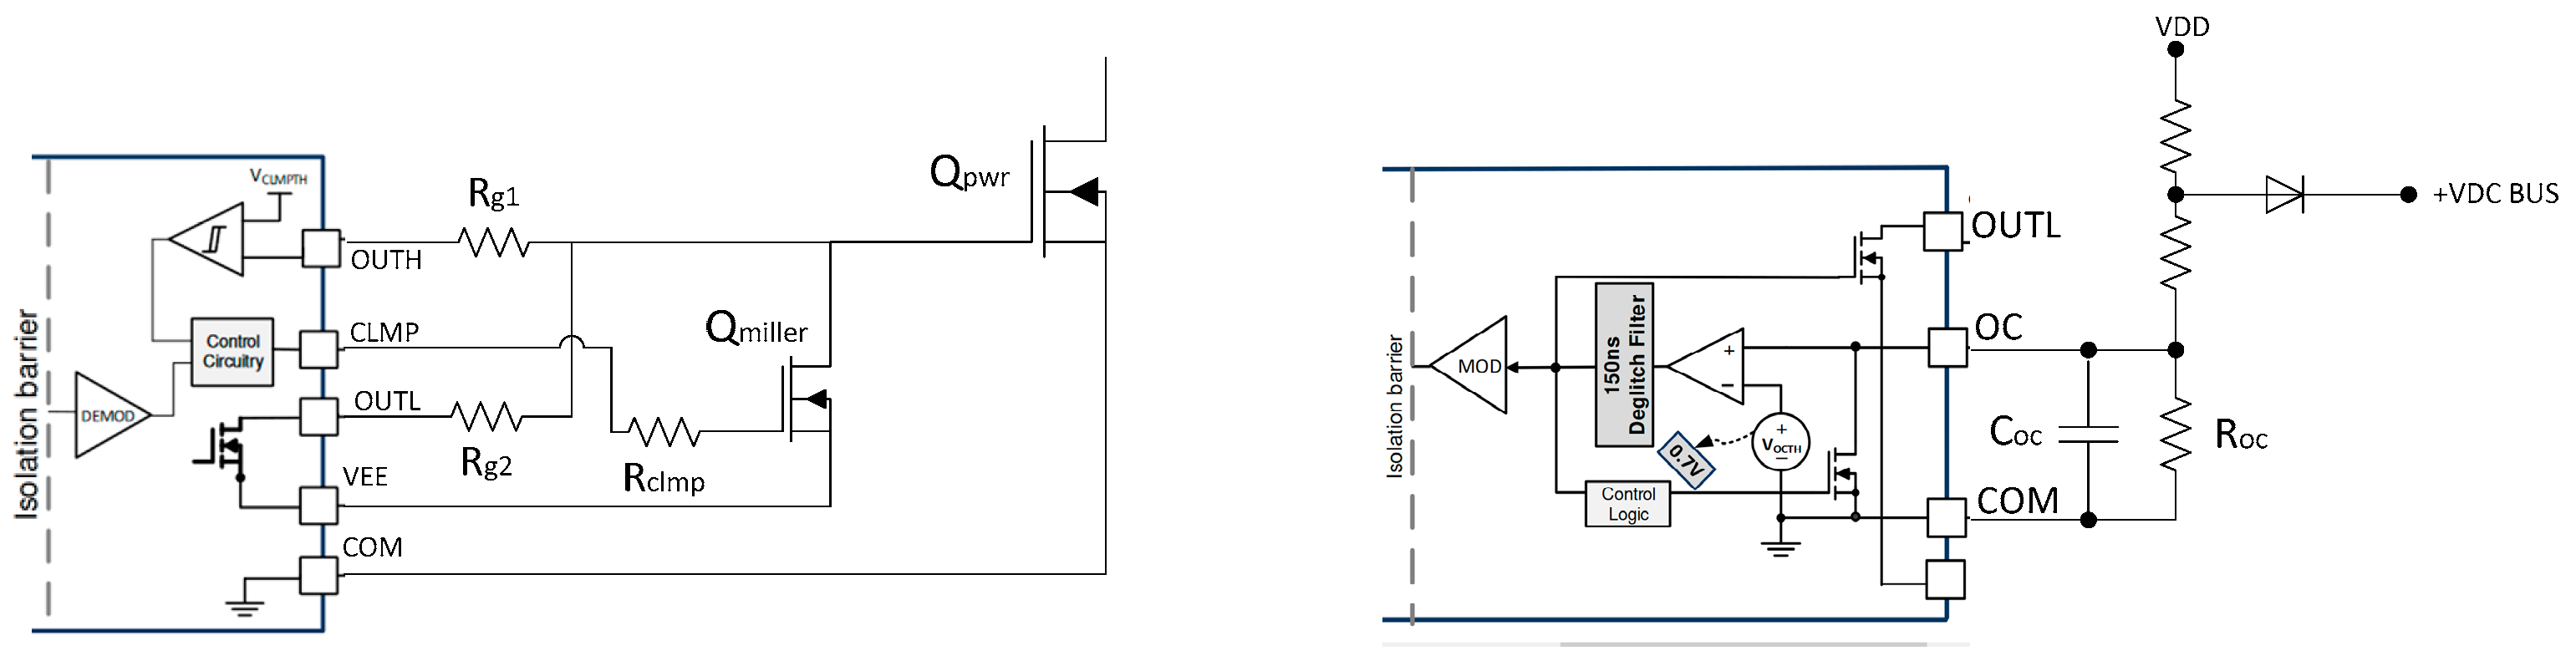
2.4.1. The Power Stage

Figure 7 illustrates the power stage of a single-phase dual active bridge. The power stage includes the power MOSFETs, both on the primary and secondary side; the gate drivers; and medium-frequency, medium-voltage, high-power transformers.
The discrete SiC MOSFETs are designated for both the primary and secondary sides of the dual active bridge (DAB). G2R50MT33K 3.3 kV MOSFETs are selected for power transfer on the primary side, while G3R45MT17K 1.7 kV SiC MOSFETs are used on the secondary side. Both MOSFETs come in TO247-4 packages with Kelvin connections to enhance switching performance.
UCC21732 10A source/sink isolated signal-channel gate drivers are employed as MOSFET gate drivers. The UCC21732 is a galvanically isolated single-channel gate driver, offering 5.7 kVRMS reinforced isolation and a minimum of 150 V/ns CMTI. It is designed explicitly for SiC MOSFETs and IGBTs operating up to 2121 VDC. Additionally, the UCC21732 includes an external active Miller clamp, fast overcurrent detection, and UVLO on both input and output sides to optimize SiC switching performance and robustness. Figure 18 shows the connection diagram of this system’s active Miller clamping and overcurrent protection circuit.

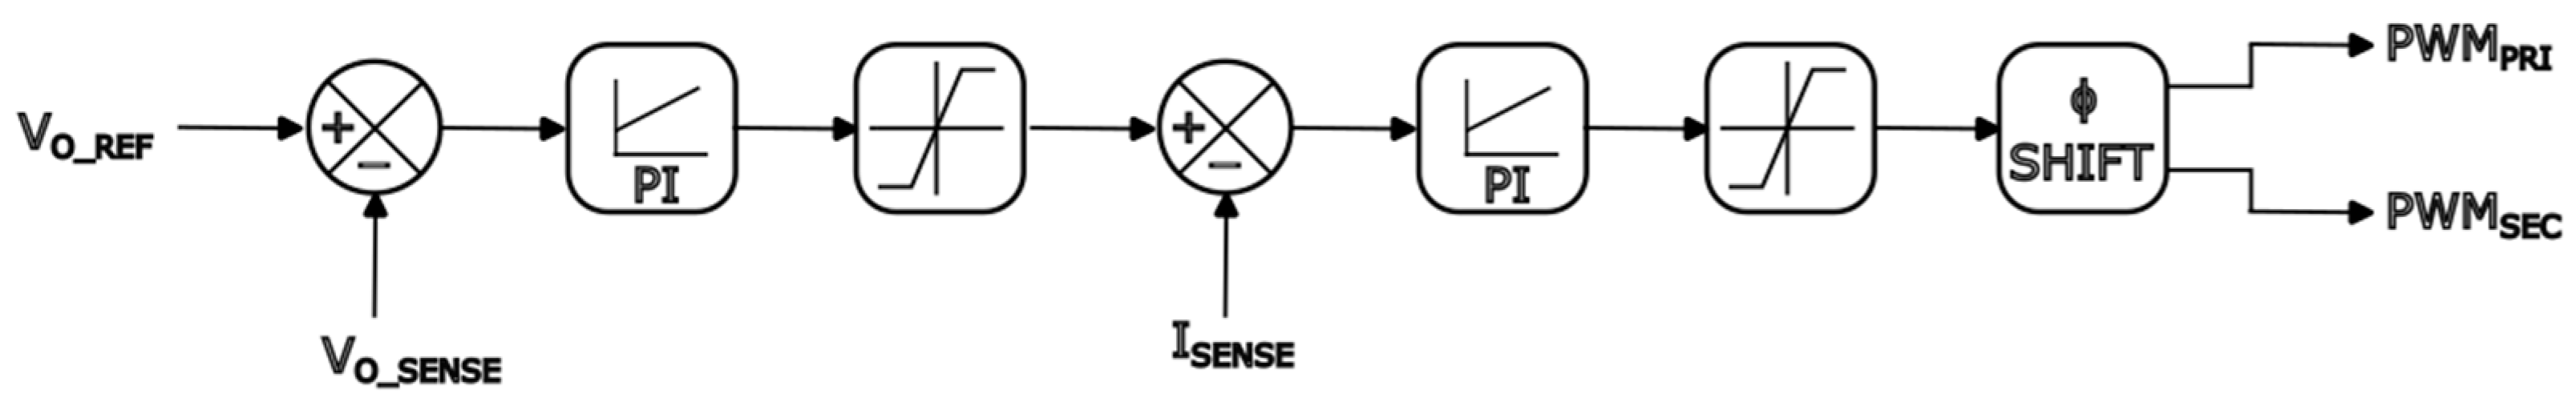
2.4.2. The Control Stage

The primary goal of controlling a DAB converter is to manage the power transfer between the two sides of the converter by adjusting the phase shift between the primary and secondary bridges. The control strategy can be divided into the following key components:
  • Phase-Shift Control: The core of DAB control is phase-shift modulation. The voltage waveforms generated by the primary and secondary H-bridge inverters are shifted relative to each other. The amount of power transferred depends on the phase shift (ϕ) between these waveforms.
  • Voltage and Current Regulation: Feedback loops are implemented to regulate the output voltage and control the current. Based on the difference between the measured and desired values (i.e., error), the controller adjusts the phase shift to maintain proper power transfer.
  • Bidirectional Operation: The DAB converter can transfer power in both directions, making it suitable for applications like energy storage systems. The phase-shift direction determines whether power flows from the primary to the secondary side or vice-versa.
  • Current Protection: Overcurrent protection ensures the system shuts down or reduces power transfer when the current exceeds safe operating limits.
Figure 19 shows the basic signal flow diagram of the control algorithm of DAB single-phase shift control. The entire control system can be divided into the following parameters:
  • Inputs:
    • Reference output voltage (Voref): desired user/system-set output voltage;
    • Reference power (Pref): desired power transfer level;
    • Measured input and output voltage (Vin and Vosense): voltage sensor feedback;
    • Measured current (Isense): current sensor feedback.
  • Control blocks:
    • Error calculation: The reference values (Vref, Pref) are compared to the measured output values (Vout, Iout), and the difference (error) is calculated;
    • PI controller (Voltage Control): A proportional–integral (PI) controller processes the voltage error to generate a corrective signal for the phase-shift controller;
    • PI controller (current/power Control): The power or current error is processed to determine the appropriate phase-shift adjustment;
    • Phase-shift controller: This block receives signals from the voltage and power controllers and adjusts the phase-shift angle (ϕ) between the primary and secondary voltage waveforms. The phase shift determines the power flow.
  • PWM Modulation:
    • PWM generator: Based on the controller’s phase-shift signal, this block generates pulse-width-modulated signals to drive the MOSFET switches in the primary and secondary H bridges. The PWM signal controls the switches’ timing to generate the required square waveforms with the desired phase shift;
    • Gate driver signals: The PWM signals are sent to gate drivers that provide the necessary voltage and current to control the switching of the MOSFETs in the primary and secondary H-bridge inverters.
  • Power stage (h-bridges and transformer):
    • Primary H bridge: Converts the input DC voltage into a high-frequency AC waveform;
    • Transformer: Transfers power between the primary and secondary sides and provides galvanic isolation;
    • Secondary H bridge: Converts the AC signal back into DC on the secondary side.
  • Filtered output voltage: The control system regulates the output voltage to match the reference voltage.

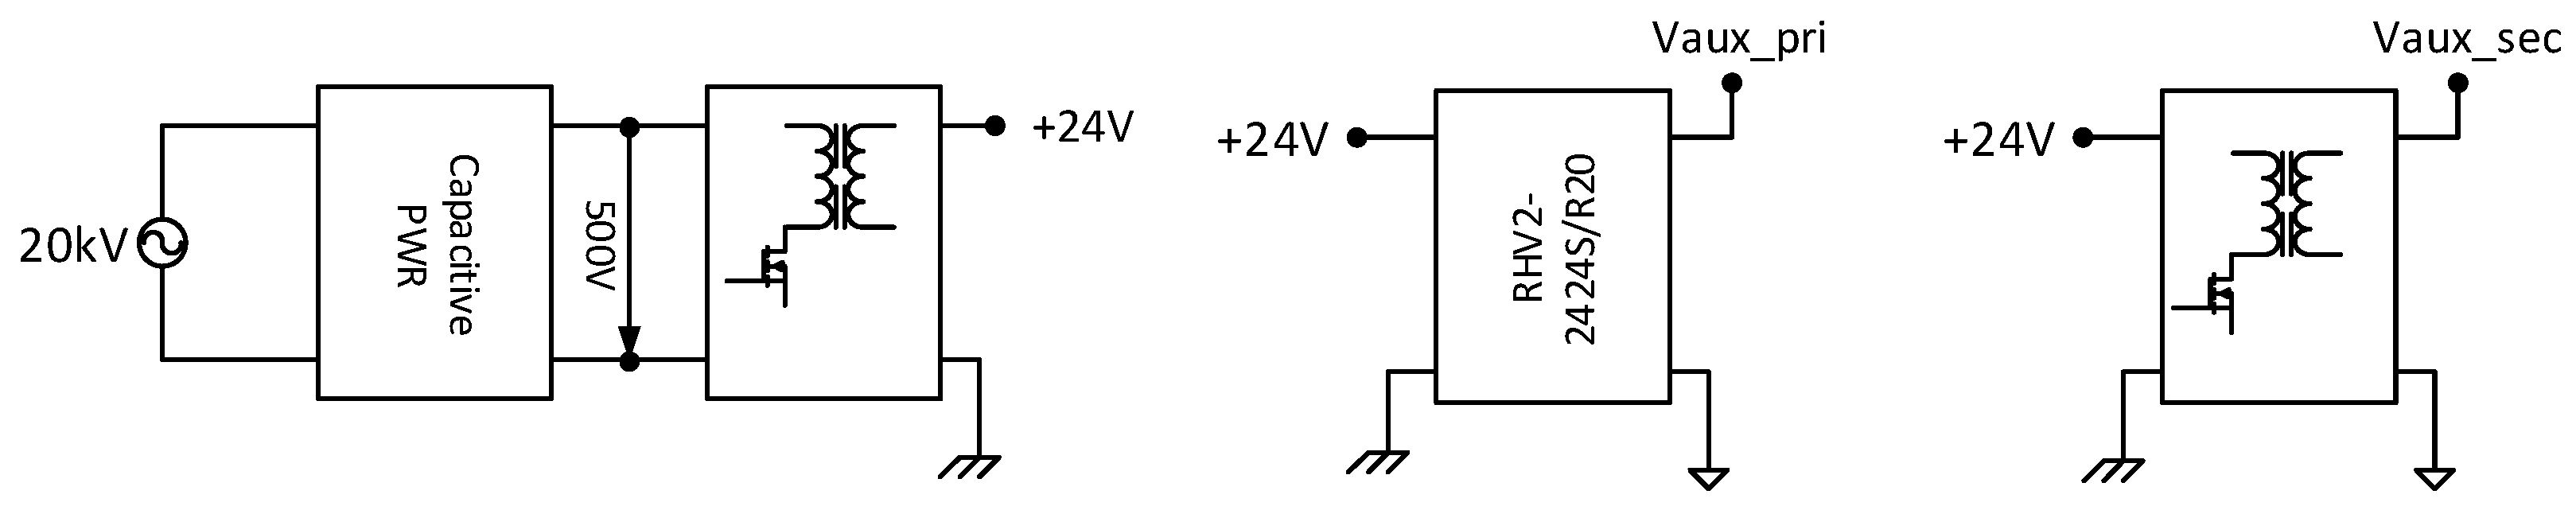
2.4.3. Auxiliary Power Supply

Figure 20 shows the operation principle of the auxiliary power supply, which includes a capacitive power supply, two custom-made fly-back converters, and a ready-made 24 V 2 W DCDC converter. It is essential to introduce appropriate galvanic isolation in the auxiliary power supply for safety and security reasons, since this system is directly connected to the 20 kV medium-voltage grid. Because the range of the biasing supply remains under 24 V, it is very challenging to find a ready-made aux power supply solution from the market. Therefore, capacitive power is employed in the input stage, which uses the capacitive reactance of a capacitor to reduce the AC feeder voltage to a lower DC voltage. As a gate drive’s isolated power supply, a 24 V RHV2 DC–DC converter is employed. It has an exceptionally high 20 kVDC (12.5 kVAC) isolation in a compact SIP16 case.

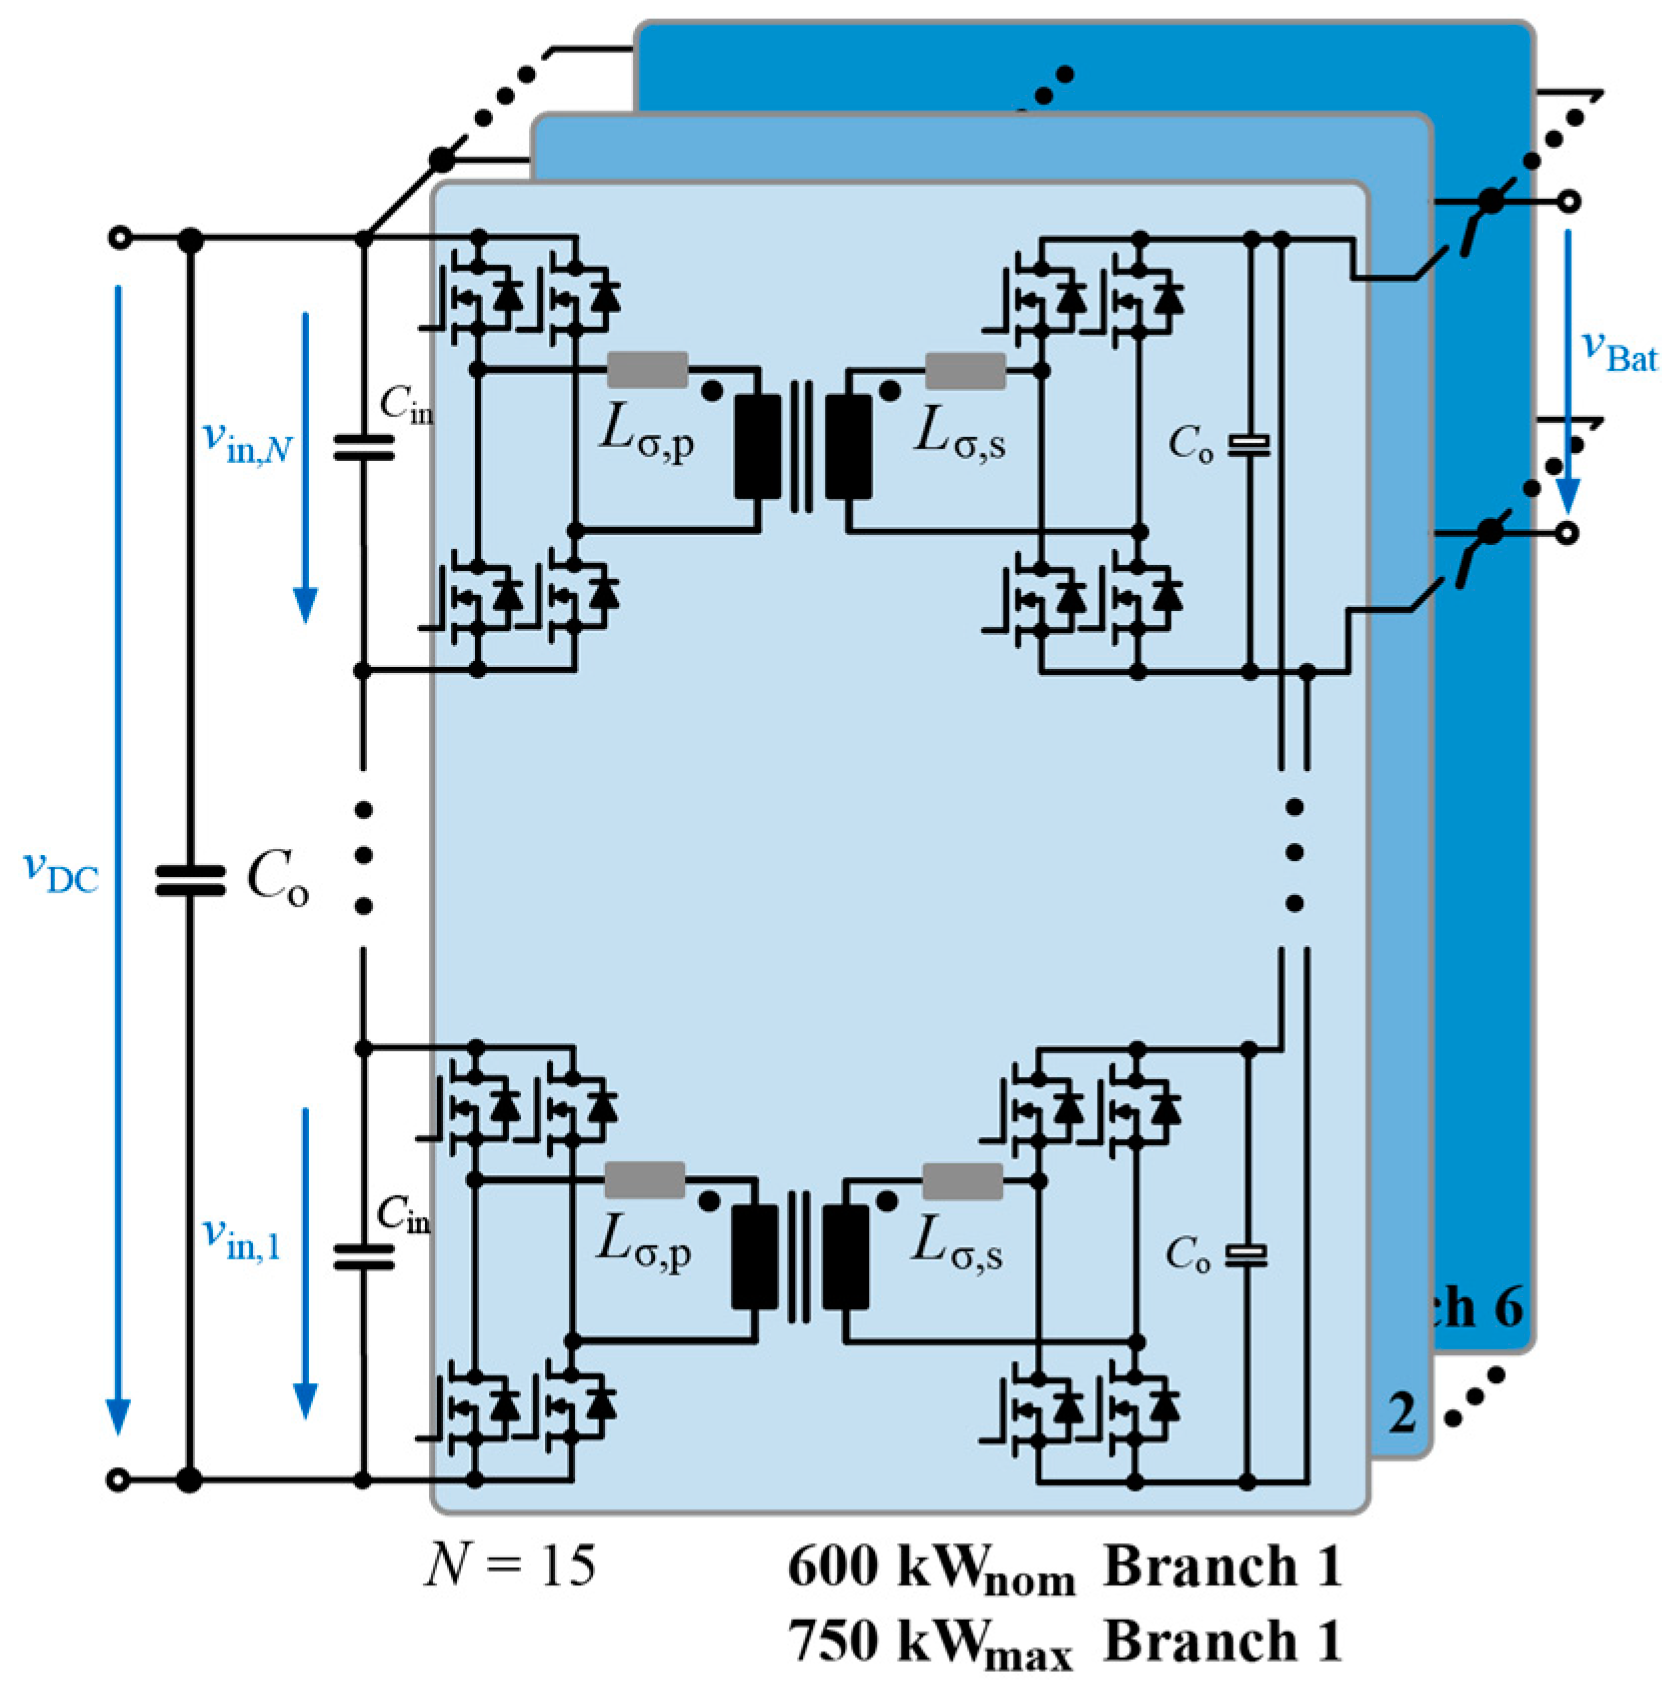
2.4.4. Dual Active Bridge in SIPO Configuration
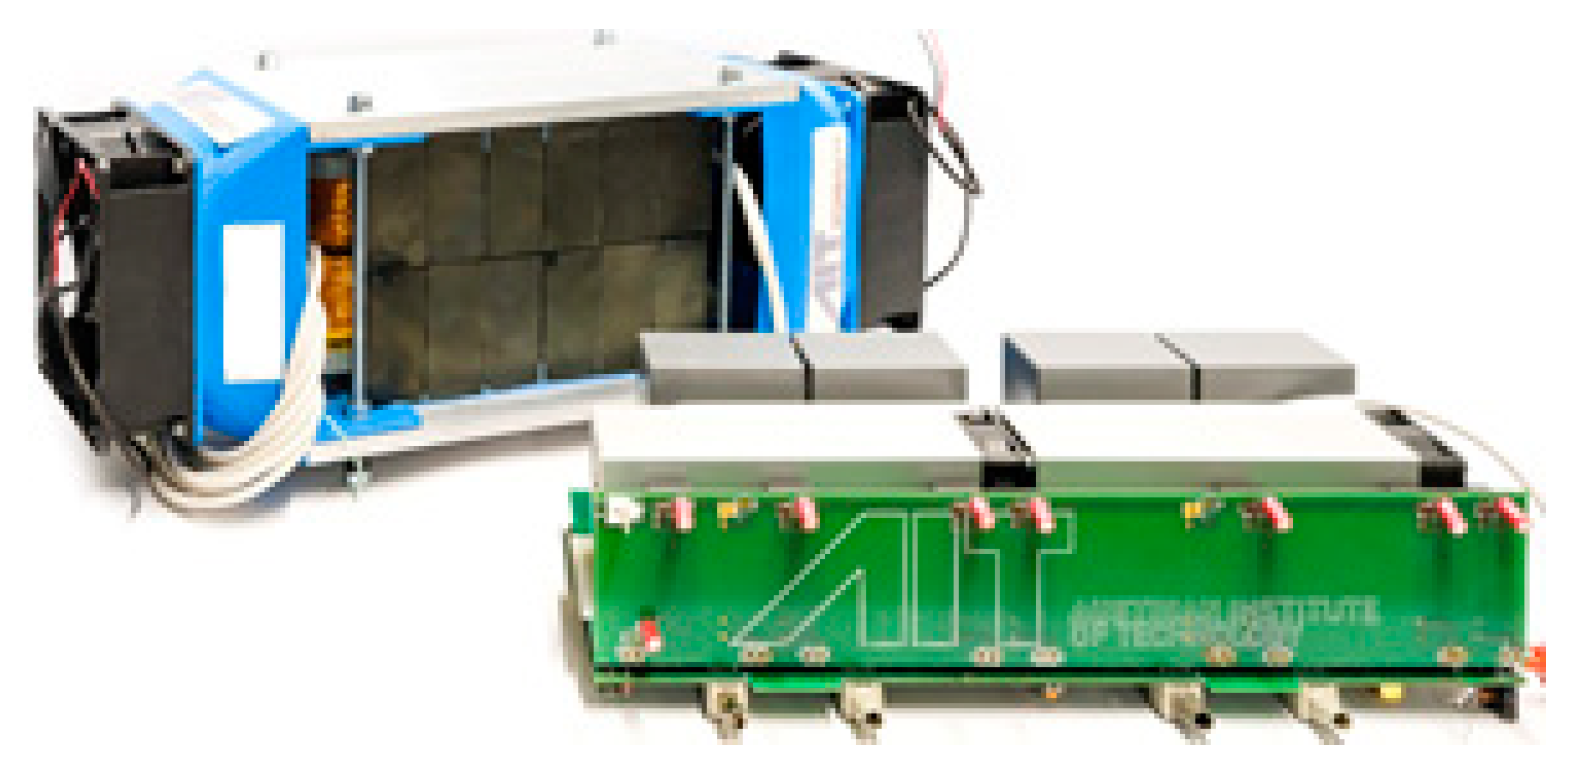
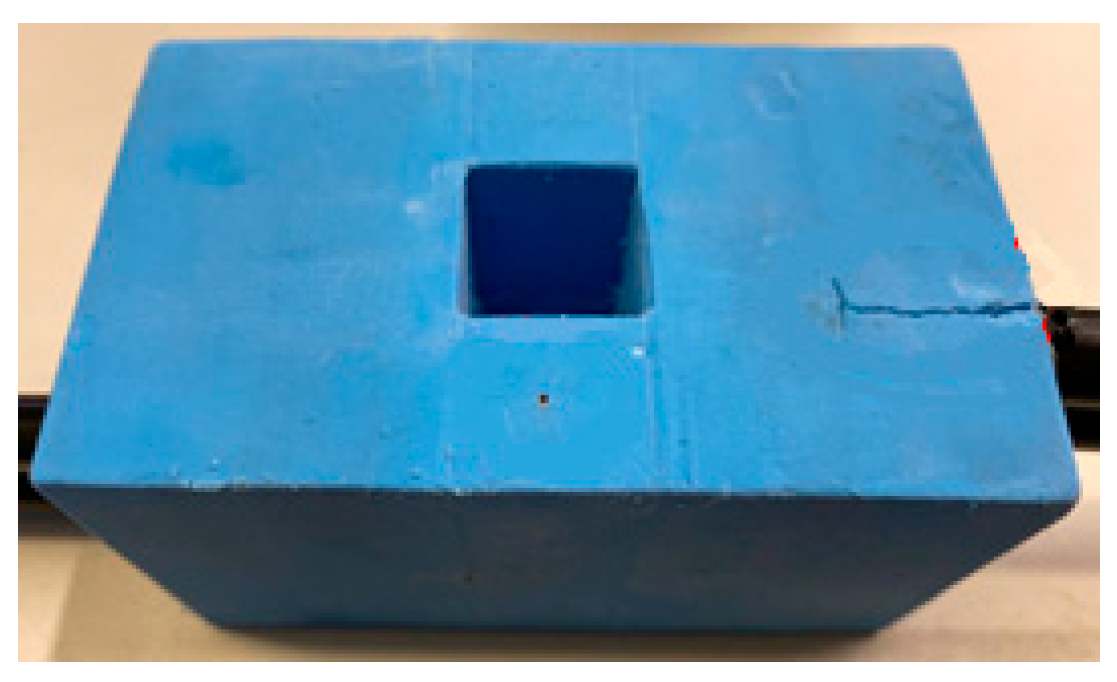
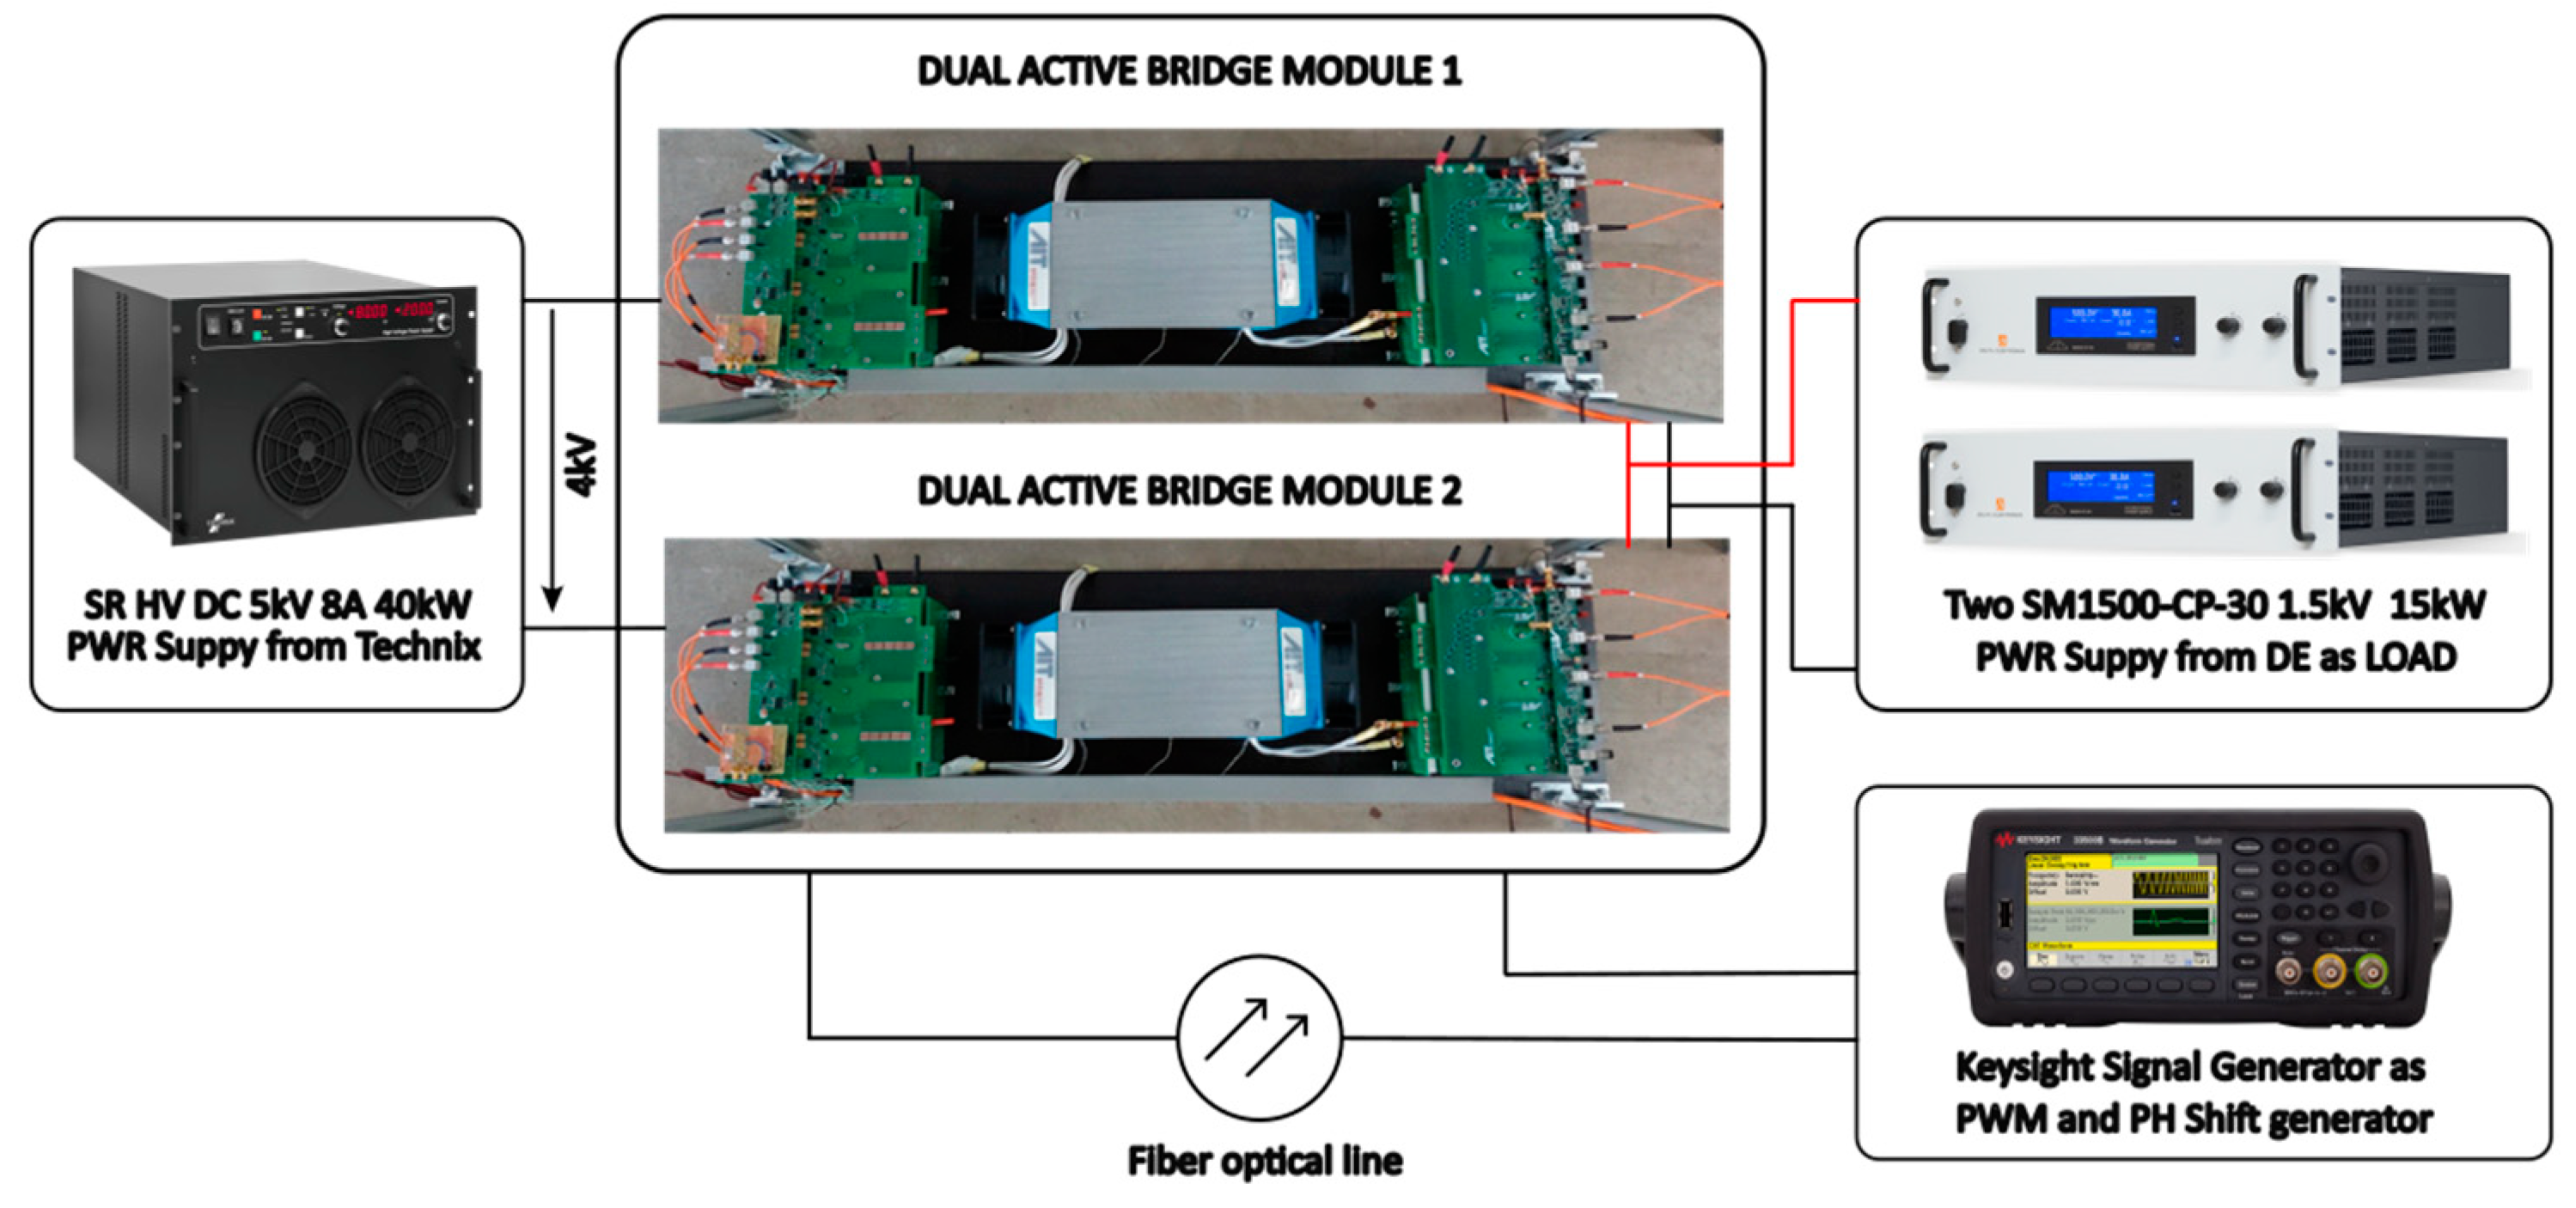
Figure 21 illustrates the SIPO configuration of two DAB modules. In this setup, each DAB’s DC link acts as a capacitive voltage divider on the input side, distributing the entire input DC bus voltage across the divider capacitors. Consequently, the DC-link voltage is proportionally split across the capacitors. The DAB modules are connected on the output side in parallel, maintaining a consistent output voltage while increasing the total output current.

2.5. Test Setup

In the previous chapters, we briefly described the selection and validation of the main component for the DAB topology. This chapter elaborates on the test setup of a complete DAB topology and SIPO configuration to prove the concept of a modular setup of a multimegawatt charging system. Figure 22 illustrates the employed test setup. A medium-voltage S3M power supply from Technix is used as an input feed. This power supply can feed 4 kV at 32 kW. Additionally, two Delta Elektronika SM1500-CP-30 units are utilized as an electronics load. The phase-shift PWM is generated by a Keysight 33512B signal generator.
Figure 22 illustrates the laboratory setup of the single- and double-module DAB systems.
The test setup for a single DAB, as well as an SIPO configuration using open-loop control with a signal generator, involves the following components and steps:
  • Device under test (DUT): DAB is the primary device under test, comprising two full-bridge converters connected via a high-frequency transformer. For the SIPO configuration, two DAB modules should be connected in series on the primary side and in parallel on the secondary side.
  • Signal generator: The signal generator creates the gate-drive signals for the switches in the DAB. It produces two sets of PWM (Pulse Width Modulation) signals with a precise phase shift between them, which controls the power transfer between the input and output sides of the DAB. For the SIPO configuration, these signals must be paralleled and provided to the modules simultaneously.
  • Power supply: A DC power supply provides the input voltage to the DAB’s primary side, ensuring that it is within the converter’s design range. For dual modules, the primary side of two DABs has to be connected in series.
  • Load: To simulate various load conditions, a programmable electronic load is connected to the DAB’s output side, and an appropriate load value is selected to test the converter under different load conditions. For dual modules, the converter output current increases to twice its value; hence, it has to be ensured that the programmable load is able to sink the increased output current.
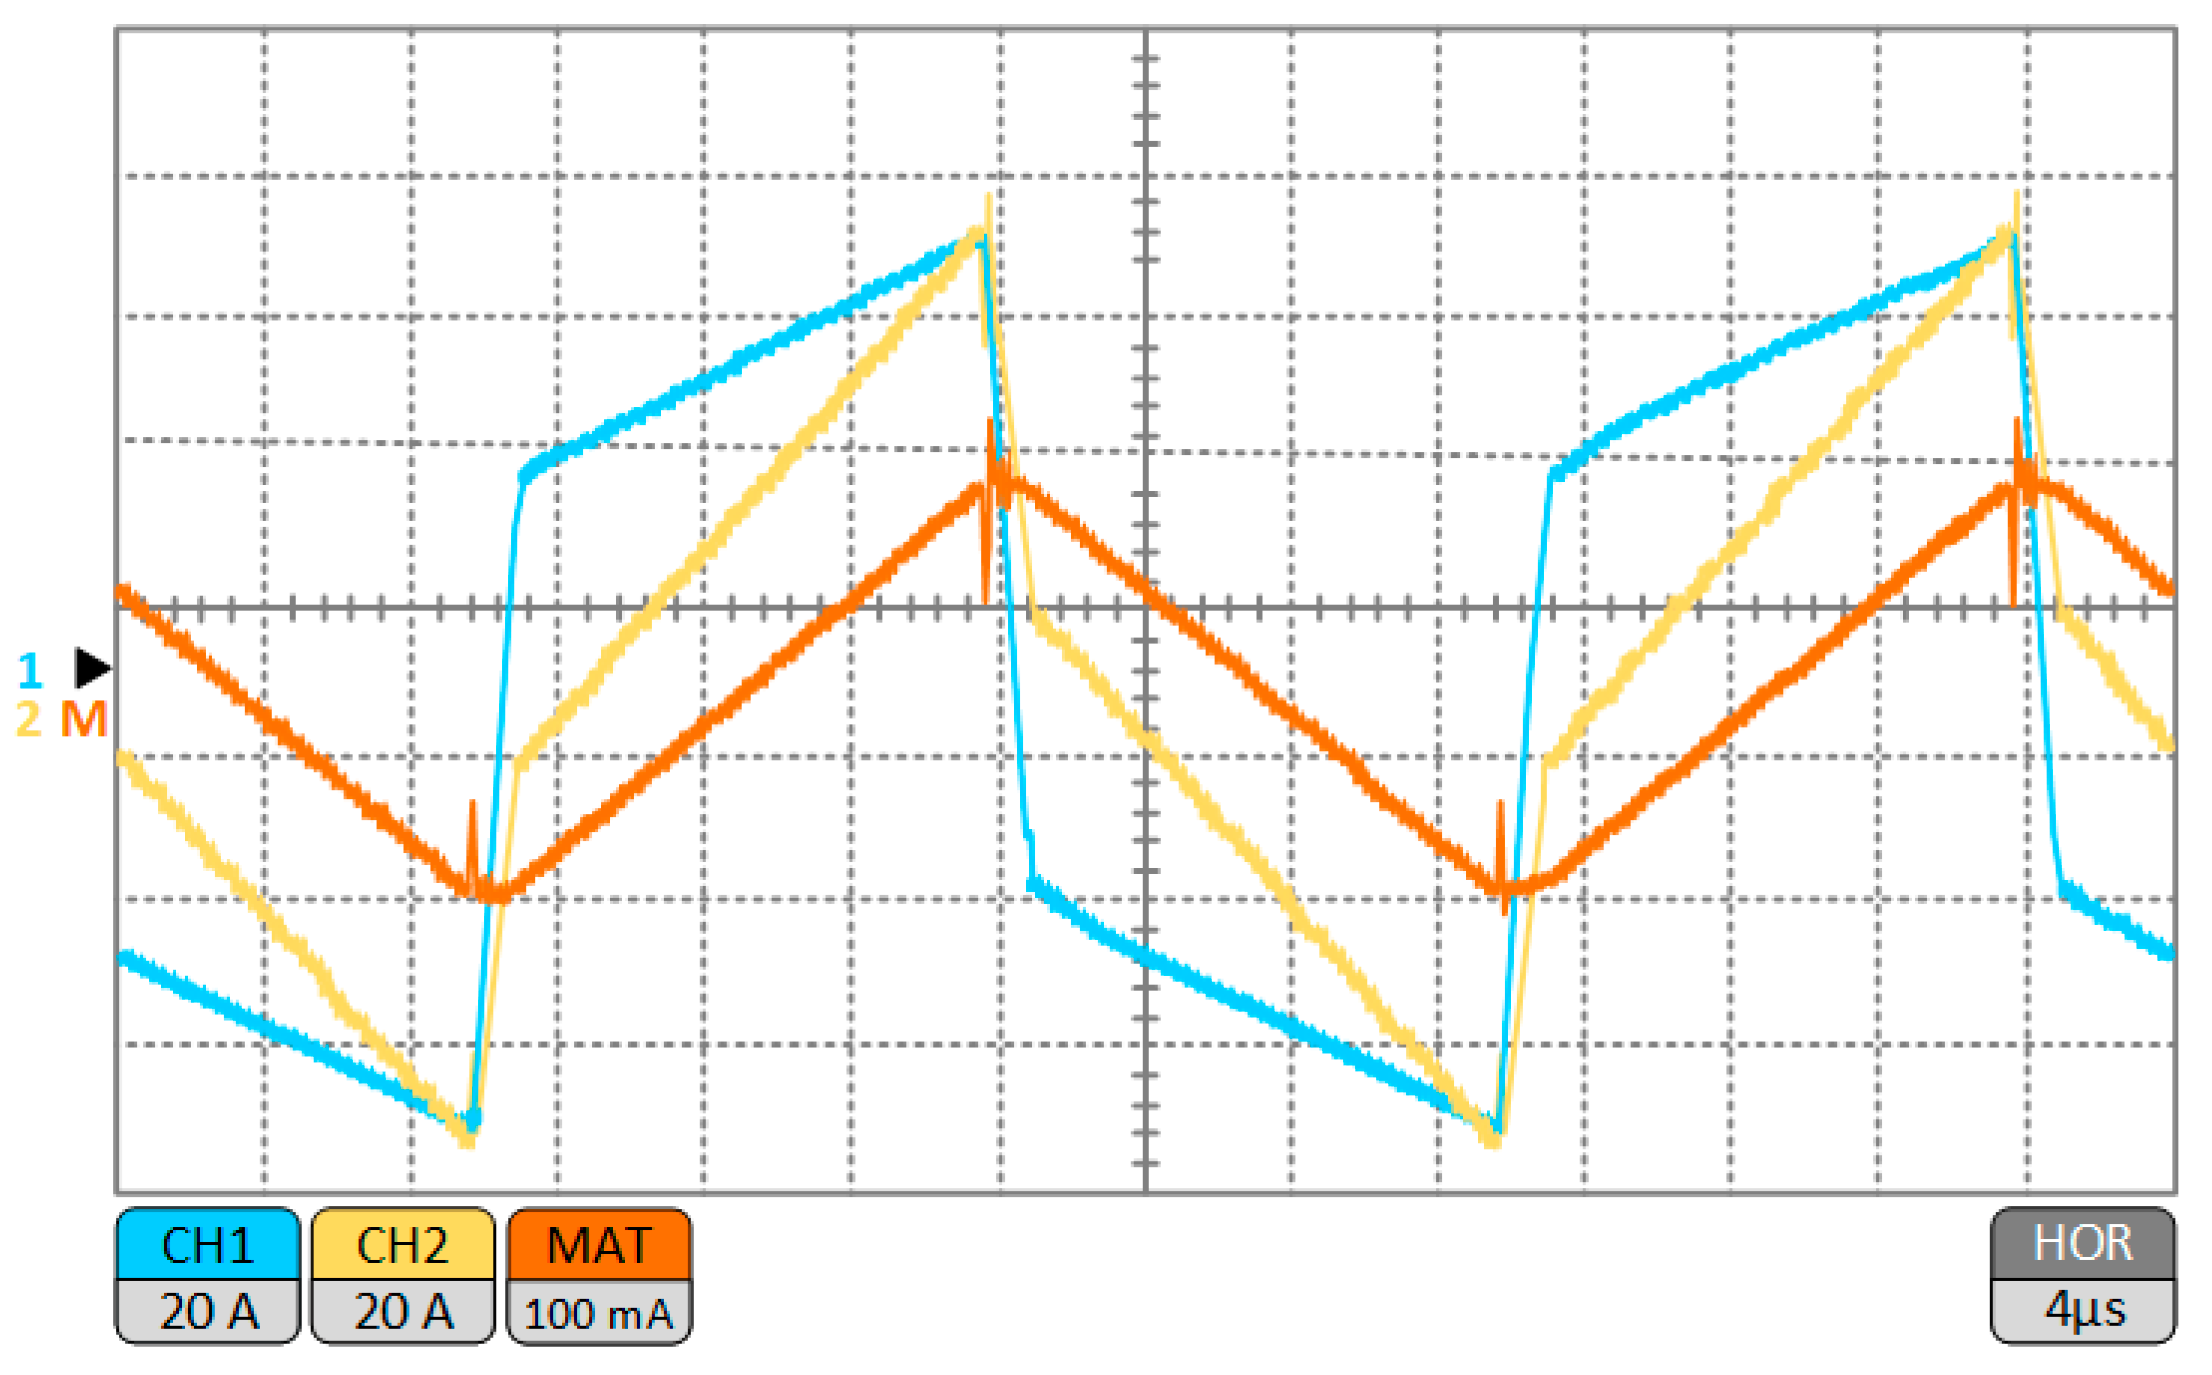
  • Voltage and current sensors: These sensors measure the DAB’s input voltage, input current, output voltage, and output current during operation, as well as the primary and secondary current of the transformers. The measured values help monitor and analyze the DAB’s performance.
  • Temperature sensors: Temperature sensors monitor the temperature profiles of the heat sink and DC-link capacitors, providing early warnings if any component exhibits abnormal overheating.
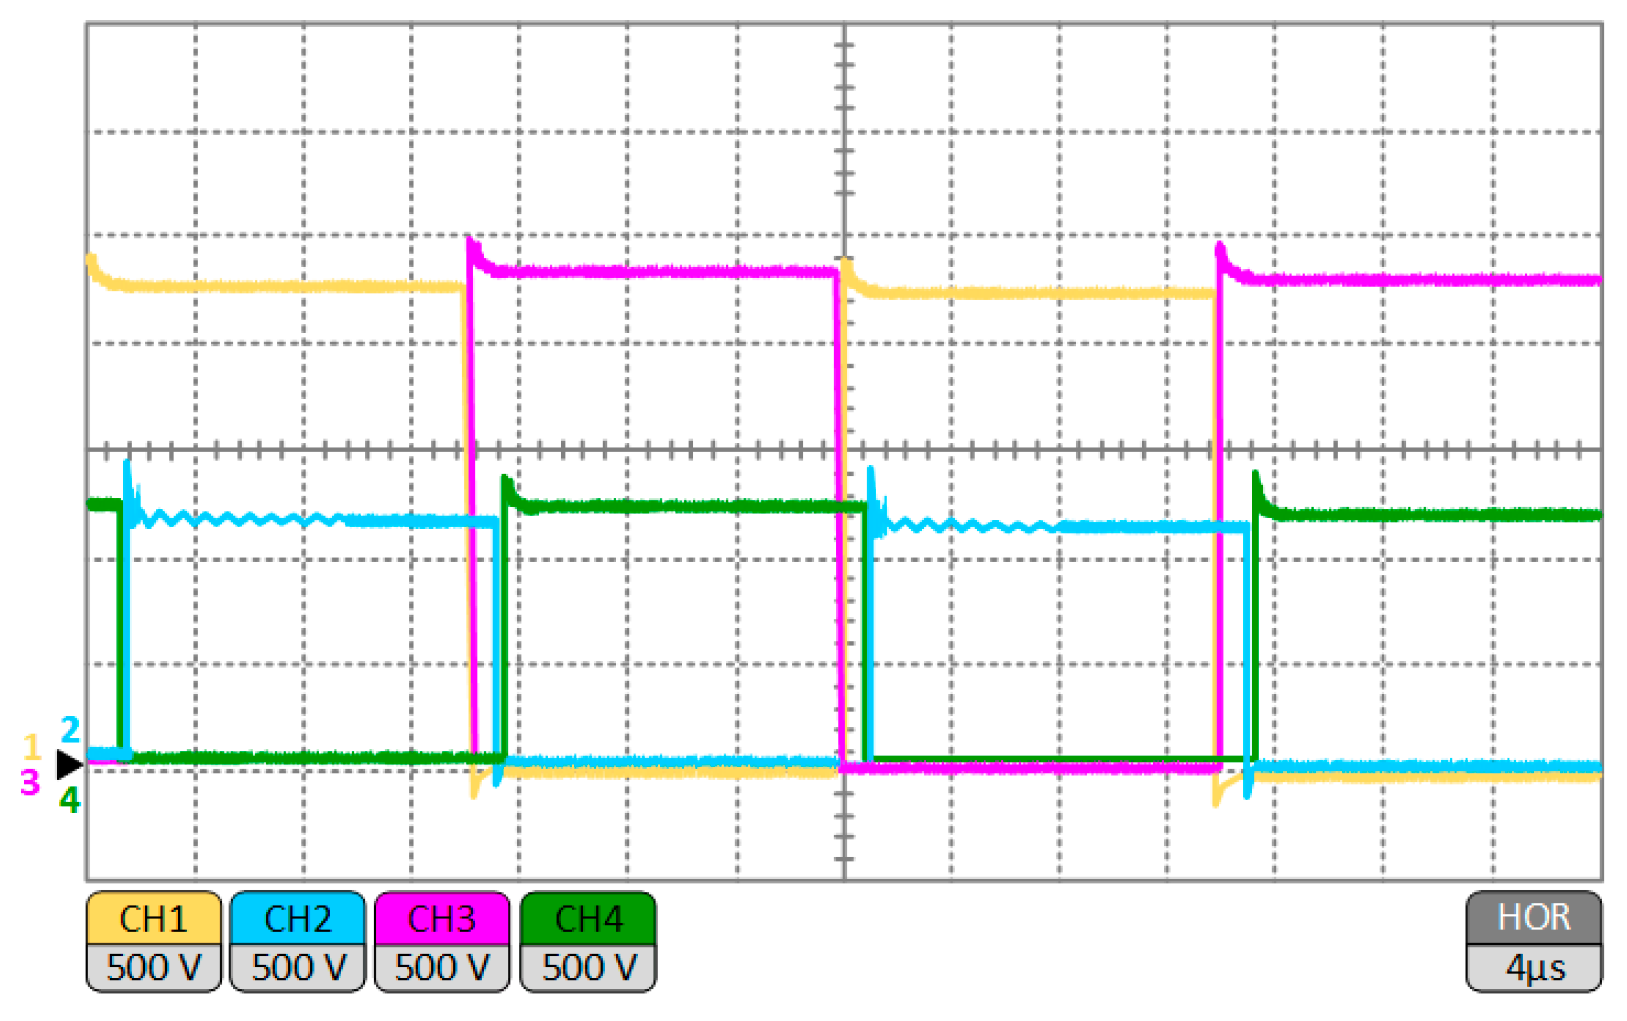
  • Oscilloscope: An oscilloscope monitors the gate signals, input/output voltages, and currents in real time, providing a visual representation of the waveforms and the timing relationships between signals.
This setup allows for assessment of the DAB’s open-loop response, power transfer efficiency, and behavior under different phase shifts and load conditions.

2.6. Test Results

As shown in Figure 23, a 50 kHz PWM signal with a 50% duty cycle is applied to the gates of the primary- and secondary-side SiC MOSFETs. The purple and yellow curves represent the gate signals of the primary bridge, and the blue and green signals depict the secondary-side gate signals. In this case, a phase shift of 600 ns is clearly visible between the primary and secondary gates.
Figure 24 depicts the drain-source voltage across the MOSFETs’ primary and secondary sides. Depending on the modulation strategy, the drain-source voltage waveforms exhibit some ringing caused by parasitic inductance during switching transitions. The yellow and the purple curves represent the drain-source voltage of the primary-side MOSFETs. The voltage amplitude reaches 2500 V. The blue and green signals illustrate the drain-source voltage of the secondary-side MOSFETs. The amplitude of the drain source is 1250 V, as expected. The phase shift between the primary and secondary sides is also visible here.
Figure 25 shows a trapezoidal waveform with alternating positive and negative pulses corresponding to the bidirectional power flow in the DAB. The input voltage, phase shift between the bridges, and transformer impedance determine the magnitude of the primary current pulses. The waveform transitions between positive and negative reflect the power flow direction from primary to secondary. The secondary current has a waveform similar to that of the primary current and varies in amplitude depending on the transformer turns ratio.

3. Integration of Multimegawatt Charging Stations in the MV Network

From a technical perspective, integrating a megawatt charging station involves conducting a feasibility study to assess load demand and network capacity, followed by the installation and connection of the necessary hardware if the integration is deemed feasible. The integration of multimegawatt charging stations (MCSs) into a medium-voltage (MV) network presents both technical and operational challenges due to the substantial power demands and energy requirements. As electric vehicles (EVs) transition towards high-power charging capabilities, the need for robust, scalable, and reliable connections to the MV grid becomes critical. This section explores the technical considerations necessary for the integration of MCSs into the MV network.

3.1. Methodology for the Development of Heavy-Duty Electric Vehicle Charging Profiles

The impact of integrating MCS into the MV network was analyzed by implementing charging points at a motorway and three other network locations based on the following settlement types: urban, suburban, and rural. To create realistic charging profiles for each location, the following parameters were considered: vehicle type, battery model, arrival time, duration of stay, and the impact of seasons/weekdays on mobility behavior. The Electric Vehicle Peak Power (EVPP) simulation tool [10], developed at AIT, incorporates these parameters in its model and was used to generate EV charging profiles for the following two scenarios: (1) charging a single Heavy-Duty Electric Vehicle (HDEV) along a motorway with a maximum charging power of 1 MW and a 1 MWh battery pack and (2) simultaneous charging of five EVs at a business premises, also with a total maximum charging power of 1 MW and a 1 MWh battery capacity. In both cases, an average energy consumption of 135 kWh/100 km was assumed. Mobility statistics from several locations in Austria were used to create representative arrival times, and mileage characteristics for the EVs at business premises [11] and arrival times at a rest area in Guntramsdorf, Austria, were obtained from Google Maps for the motorway use case. Figure 26 presents a schematic illustration of the profile generation process, and a summary of characteristics of the charging profiles for the use cases is presented in Table 3.

3.2. Network Simulation Methodology

The integration of multimegawatt charging stations into medium-voltage (MV) networks introduces new challenges for grid stability and performance. Understanding the potential impacts on voltage levels, line loading, and transformer stress is crucial as the demand for EV charging infrastructure increases, as these parameters must be maintained within their operational limits to ensure network stability and reliability. Therefore, simulations were conducted using 11 representative Austrian medium-voltage (MV) networks at 10 kV, 20 kV, and 30 kV voltage levels to assess the impact of MCS on the MV grid for each use case. EV profiles generated using the EVPP tool were used for the EVs as described previously, while synthetic load and generation profiles with a 15 min resolution for one year obtained from the APCS (Power Clearing and Settlement) [12] database were used for the respective load and generator types.
An assessment of each of the networks was conducted to identify the strongest and weakest node based on the calculation of spare load hosting capacity. Table 4 is a summary of the spare load hosting capacity of the networks. These nodes were then used as the points of connection of the MCS for each of the use cases, and subsequently, quasi-dynamic load flow simulations were performed using DIgSILENT Power Factory [13]. The weakest node was selected as the initial point of connection based on the assumption that if an MCS can operate at the weakest node without any network violations, all other nodes in the network are also able to support the MCS without issues. In the event of a violation at the strongest node, it is assumed that an MCS cannot be integrated at any connection point in the network. In addition, scalability analyses were performed to assess possible future scenarios where a large-scale deployment of MCSs is expected. An impact assessment was conducted in which voltage, line, and transformer loadings were considered as metrics and compared to the baseline scenario, where no MCS was connected. Figure 27 provides an overview of the simulation methodology.

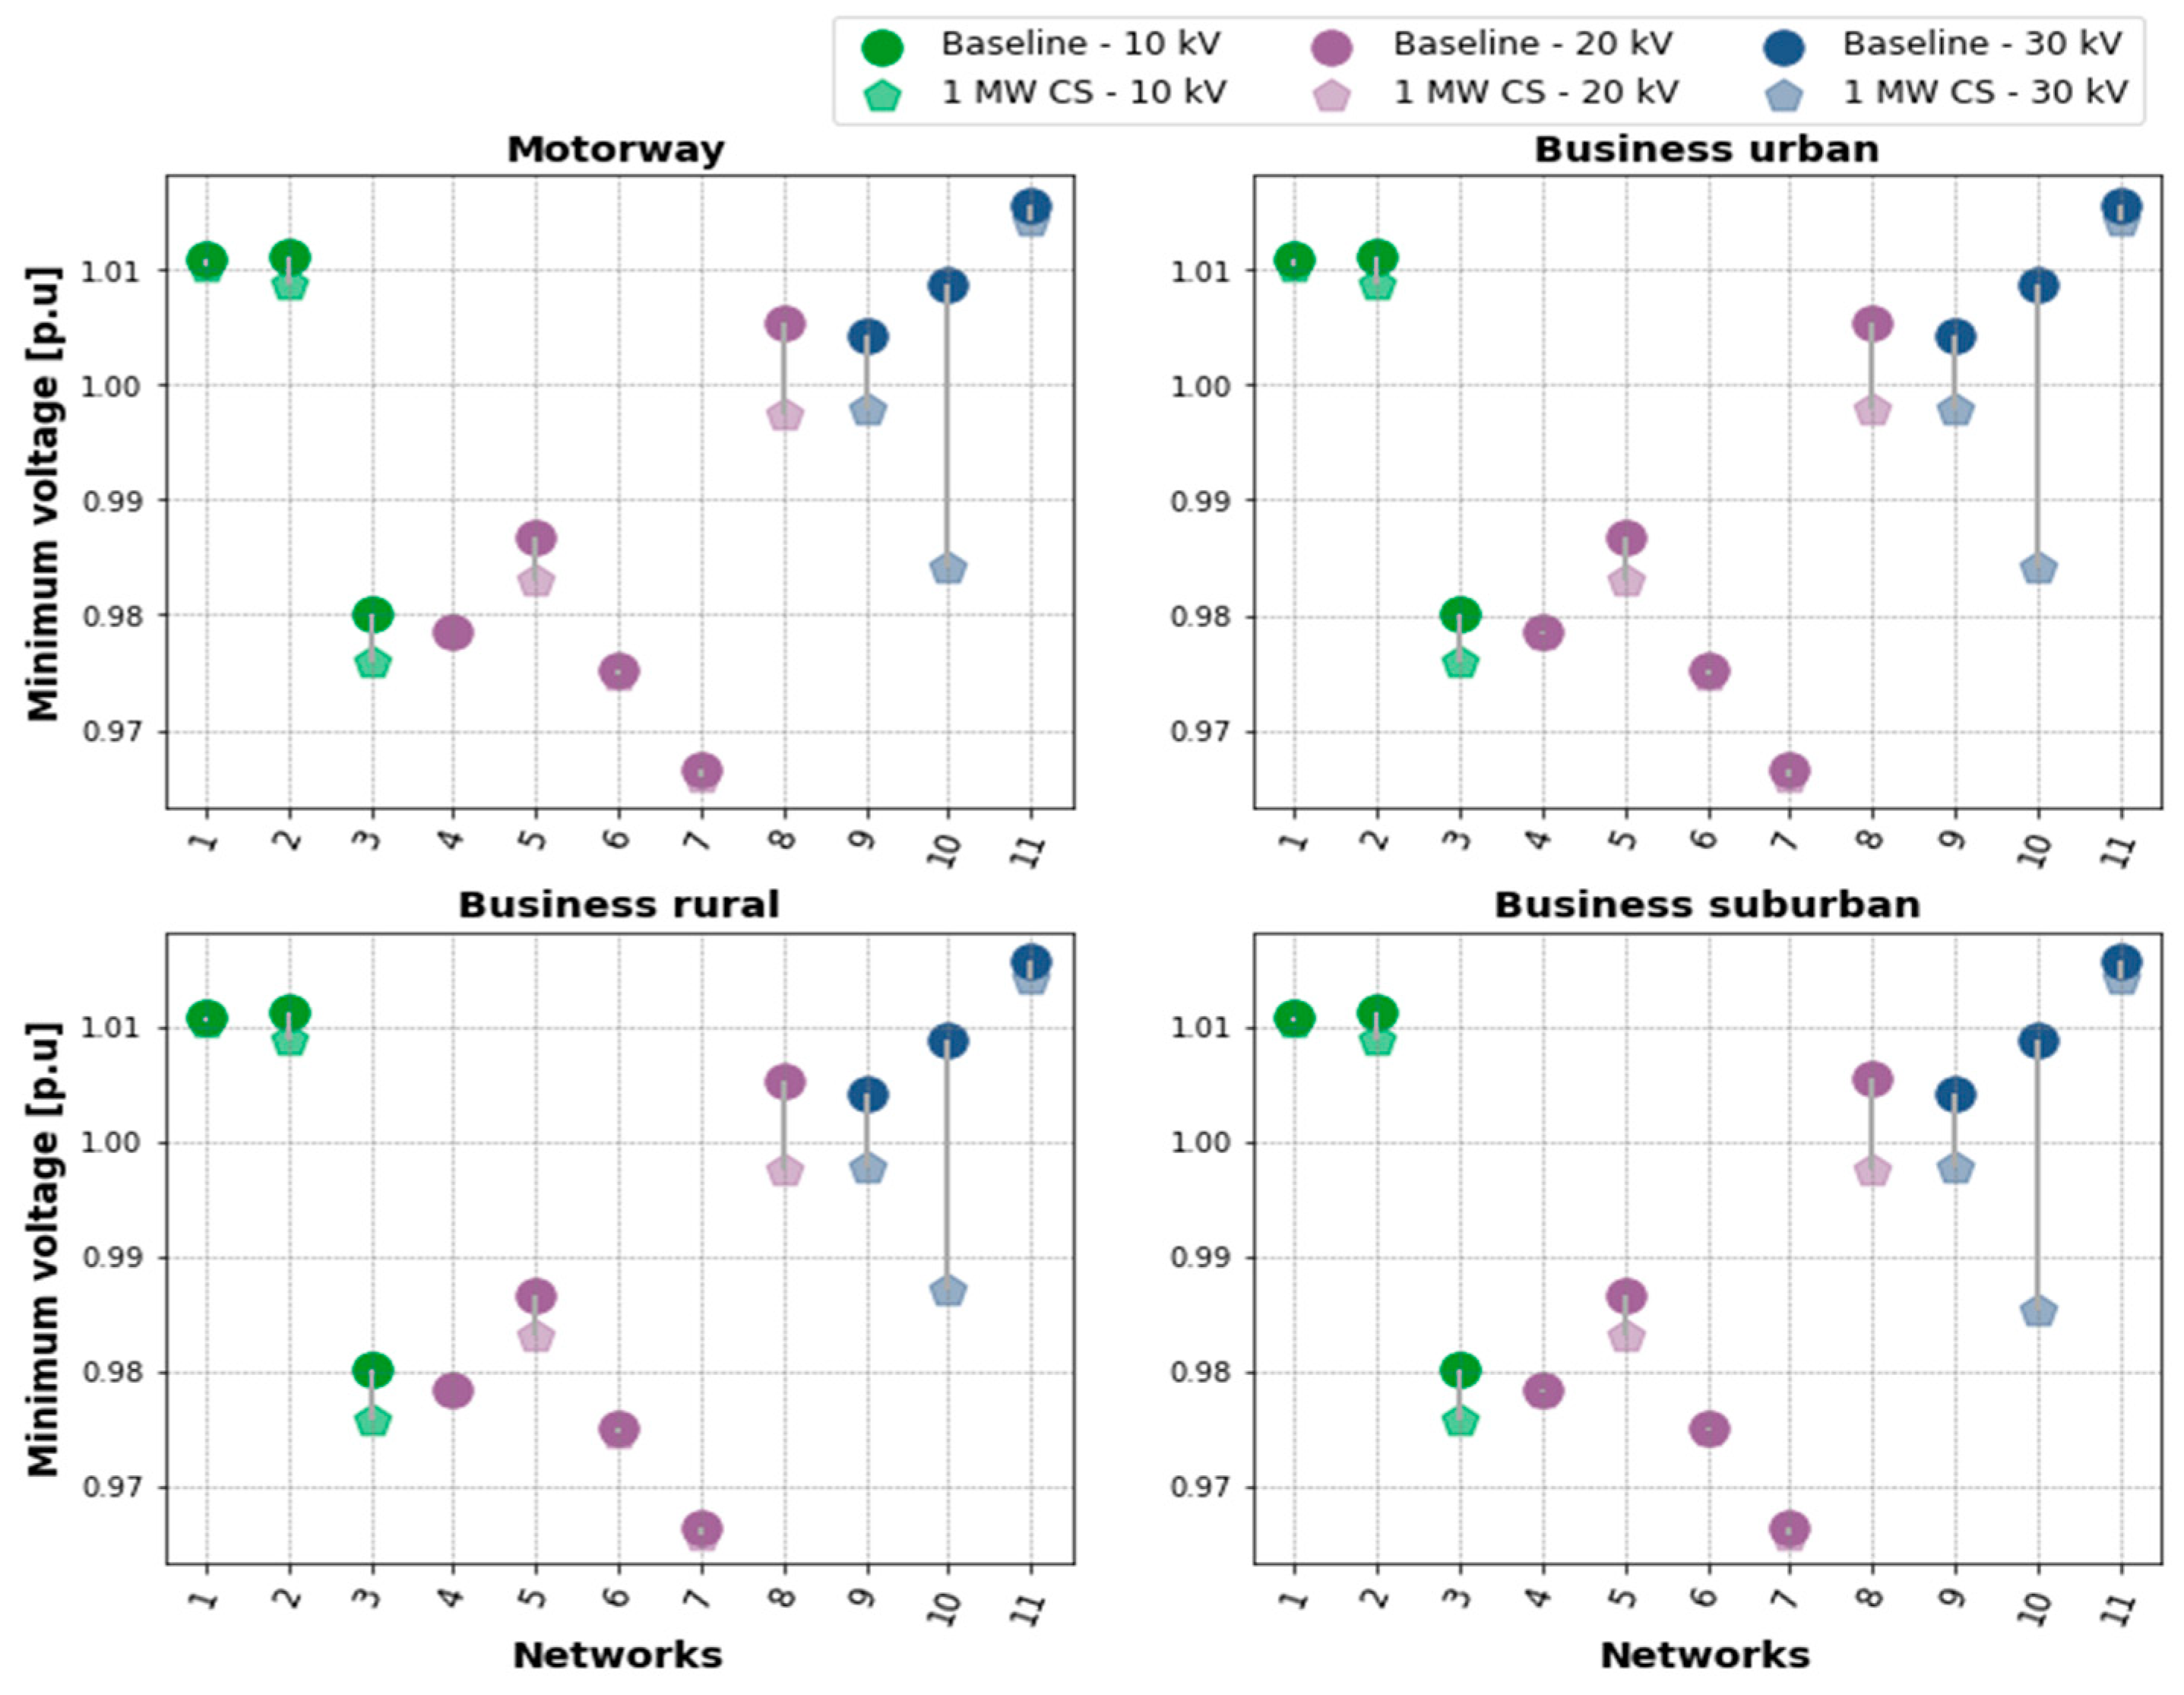
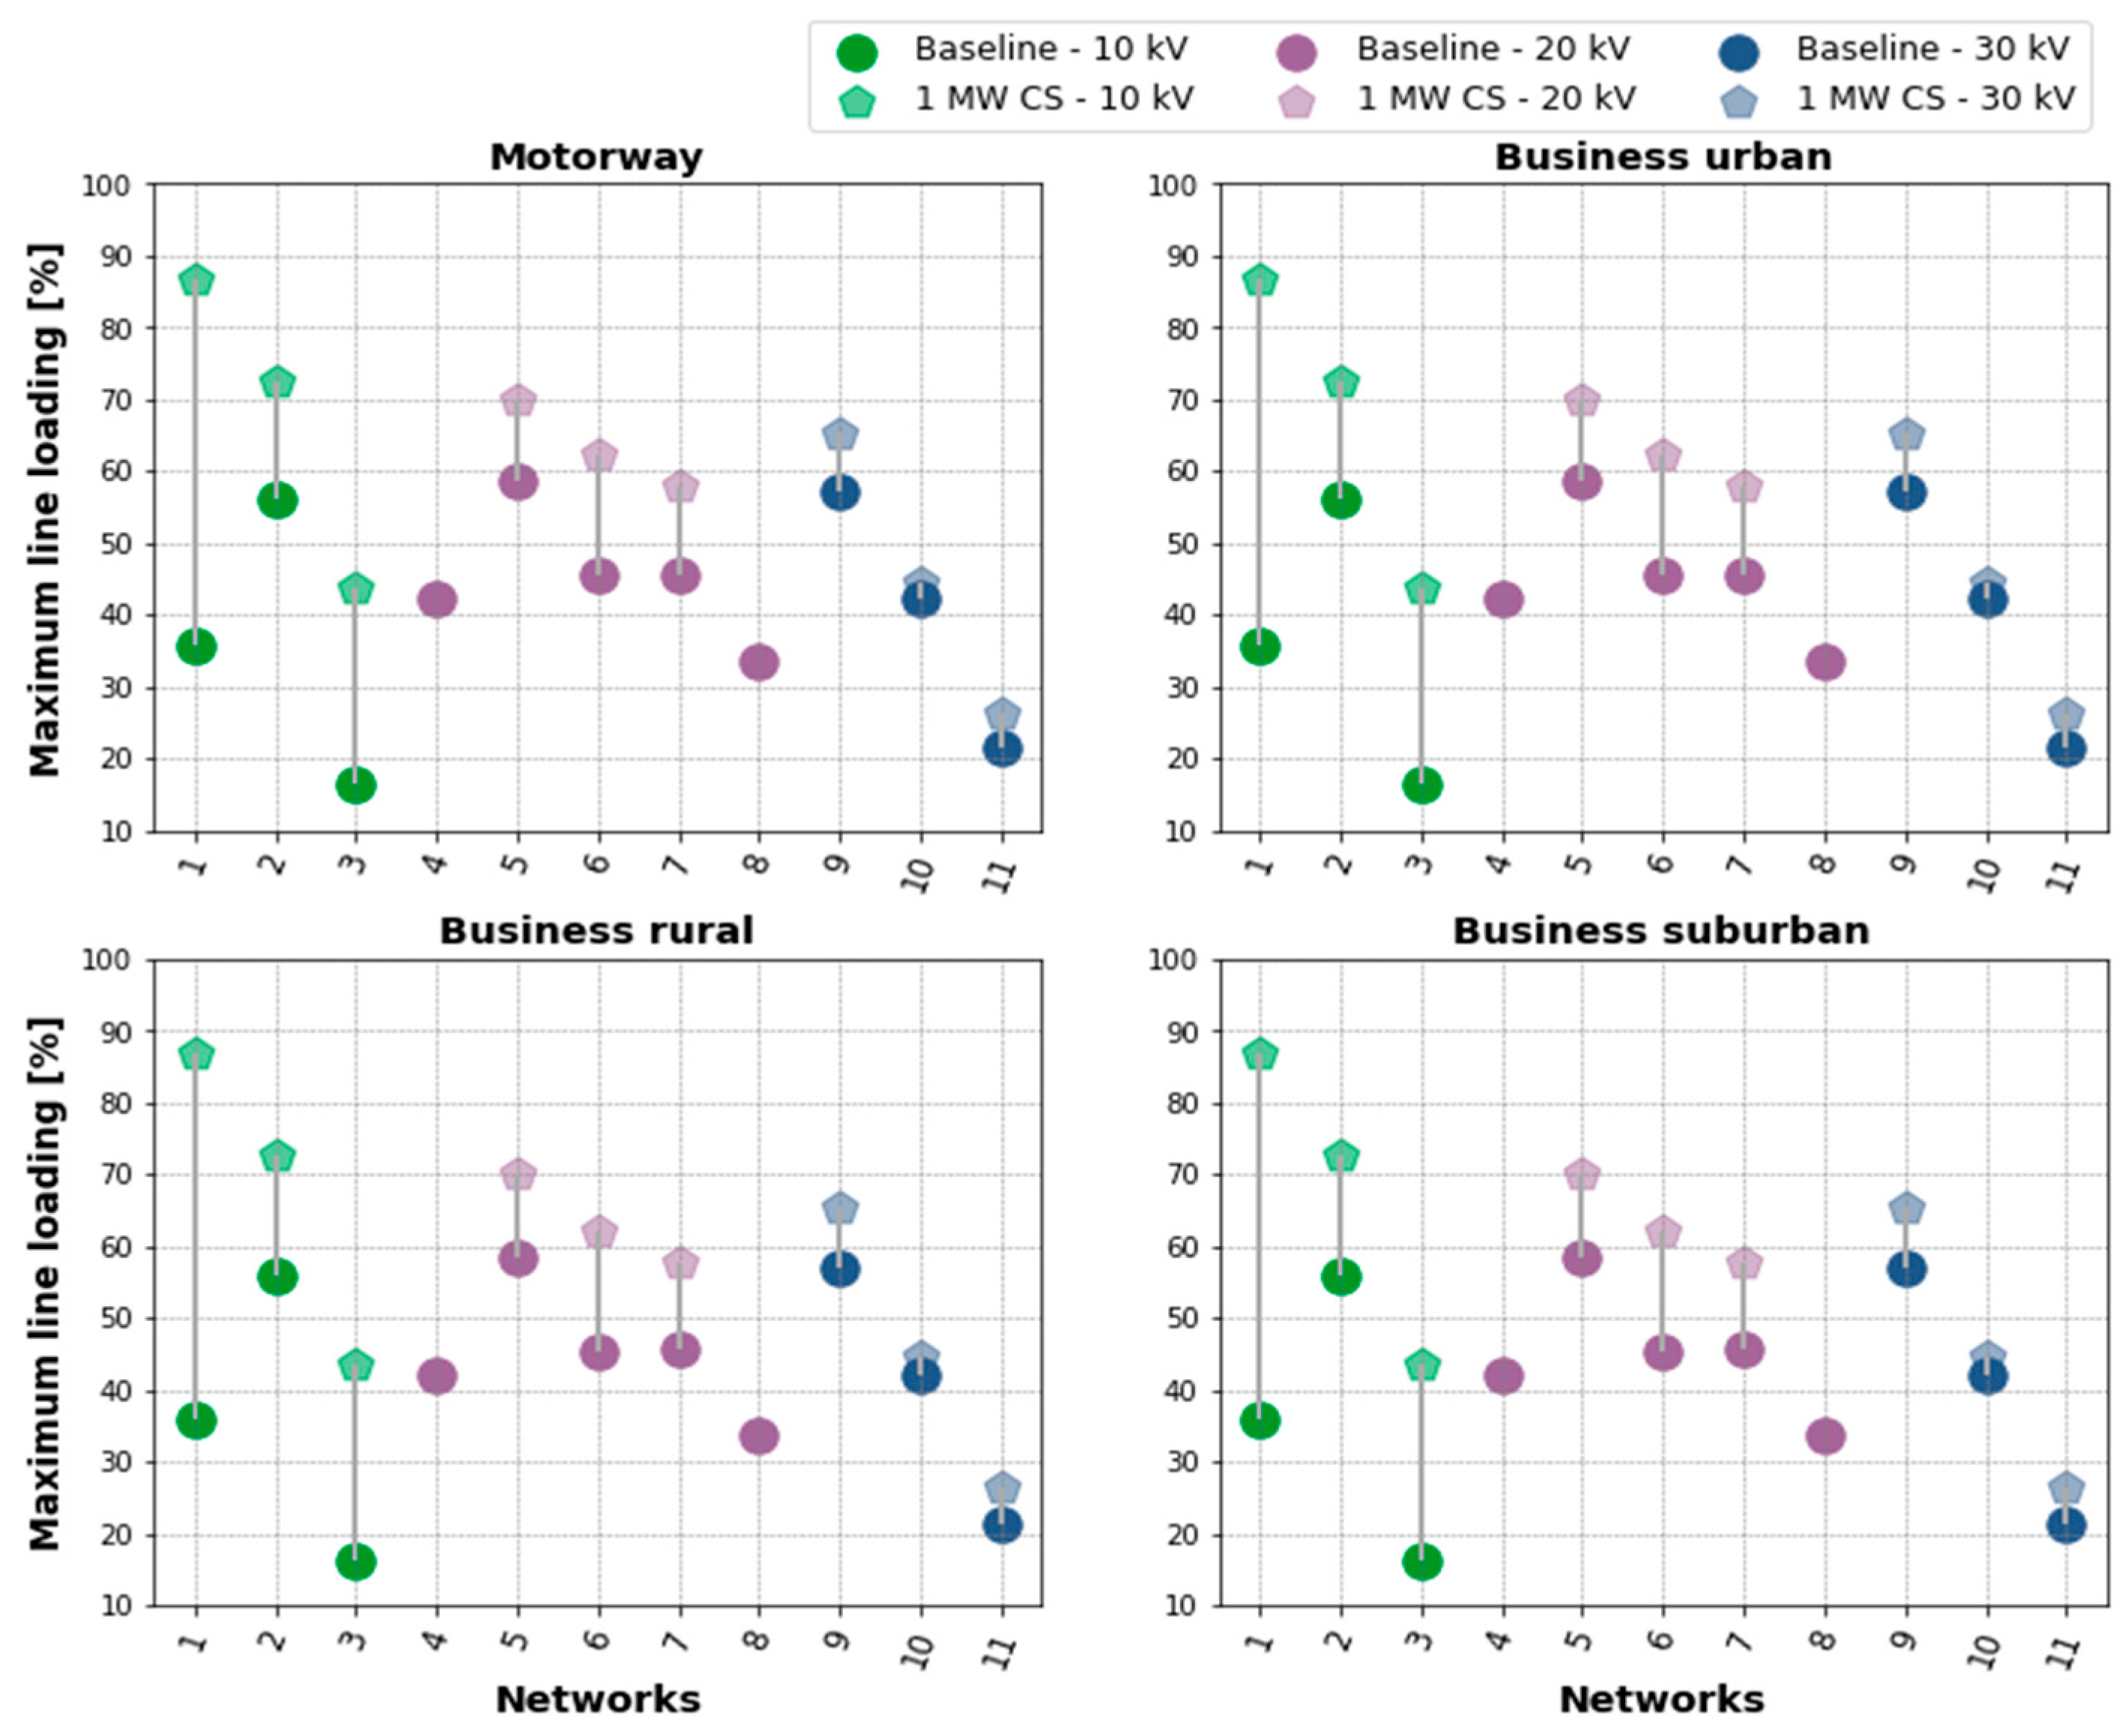
3.3. Network Simulation Results

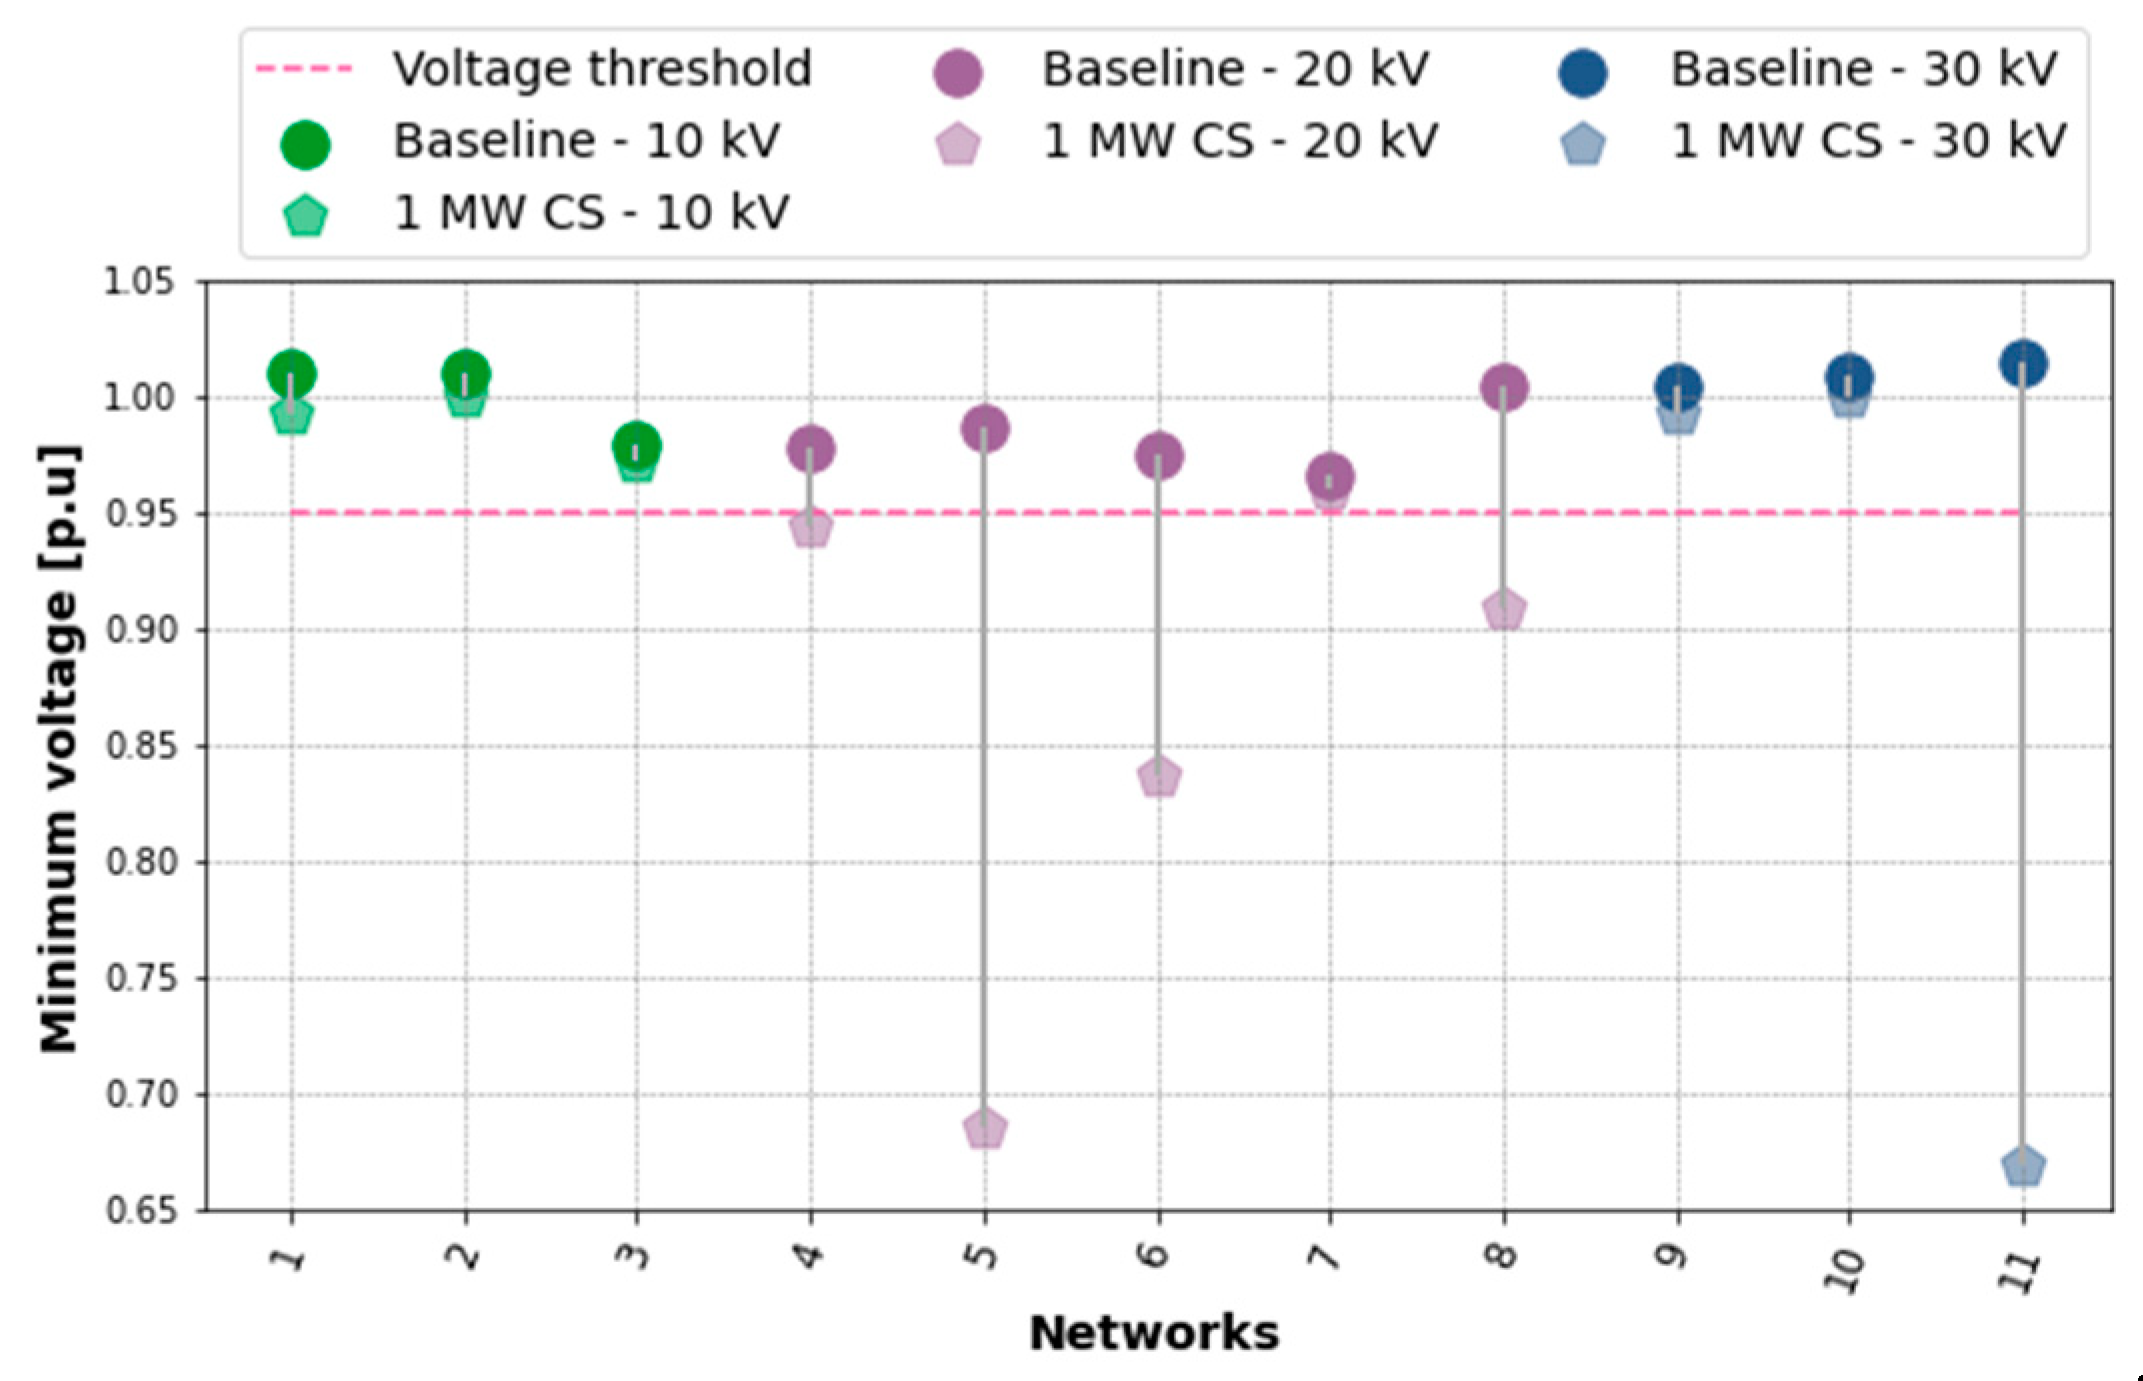
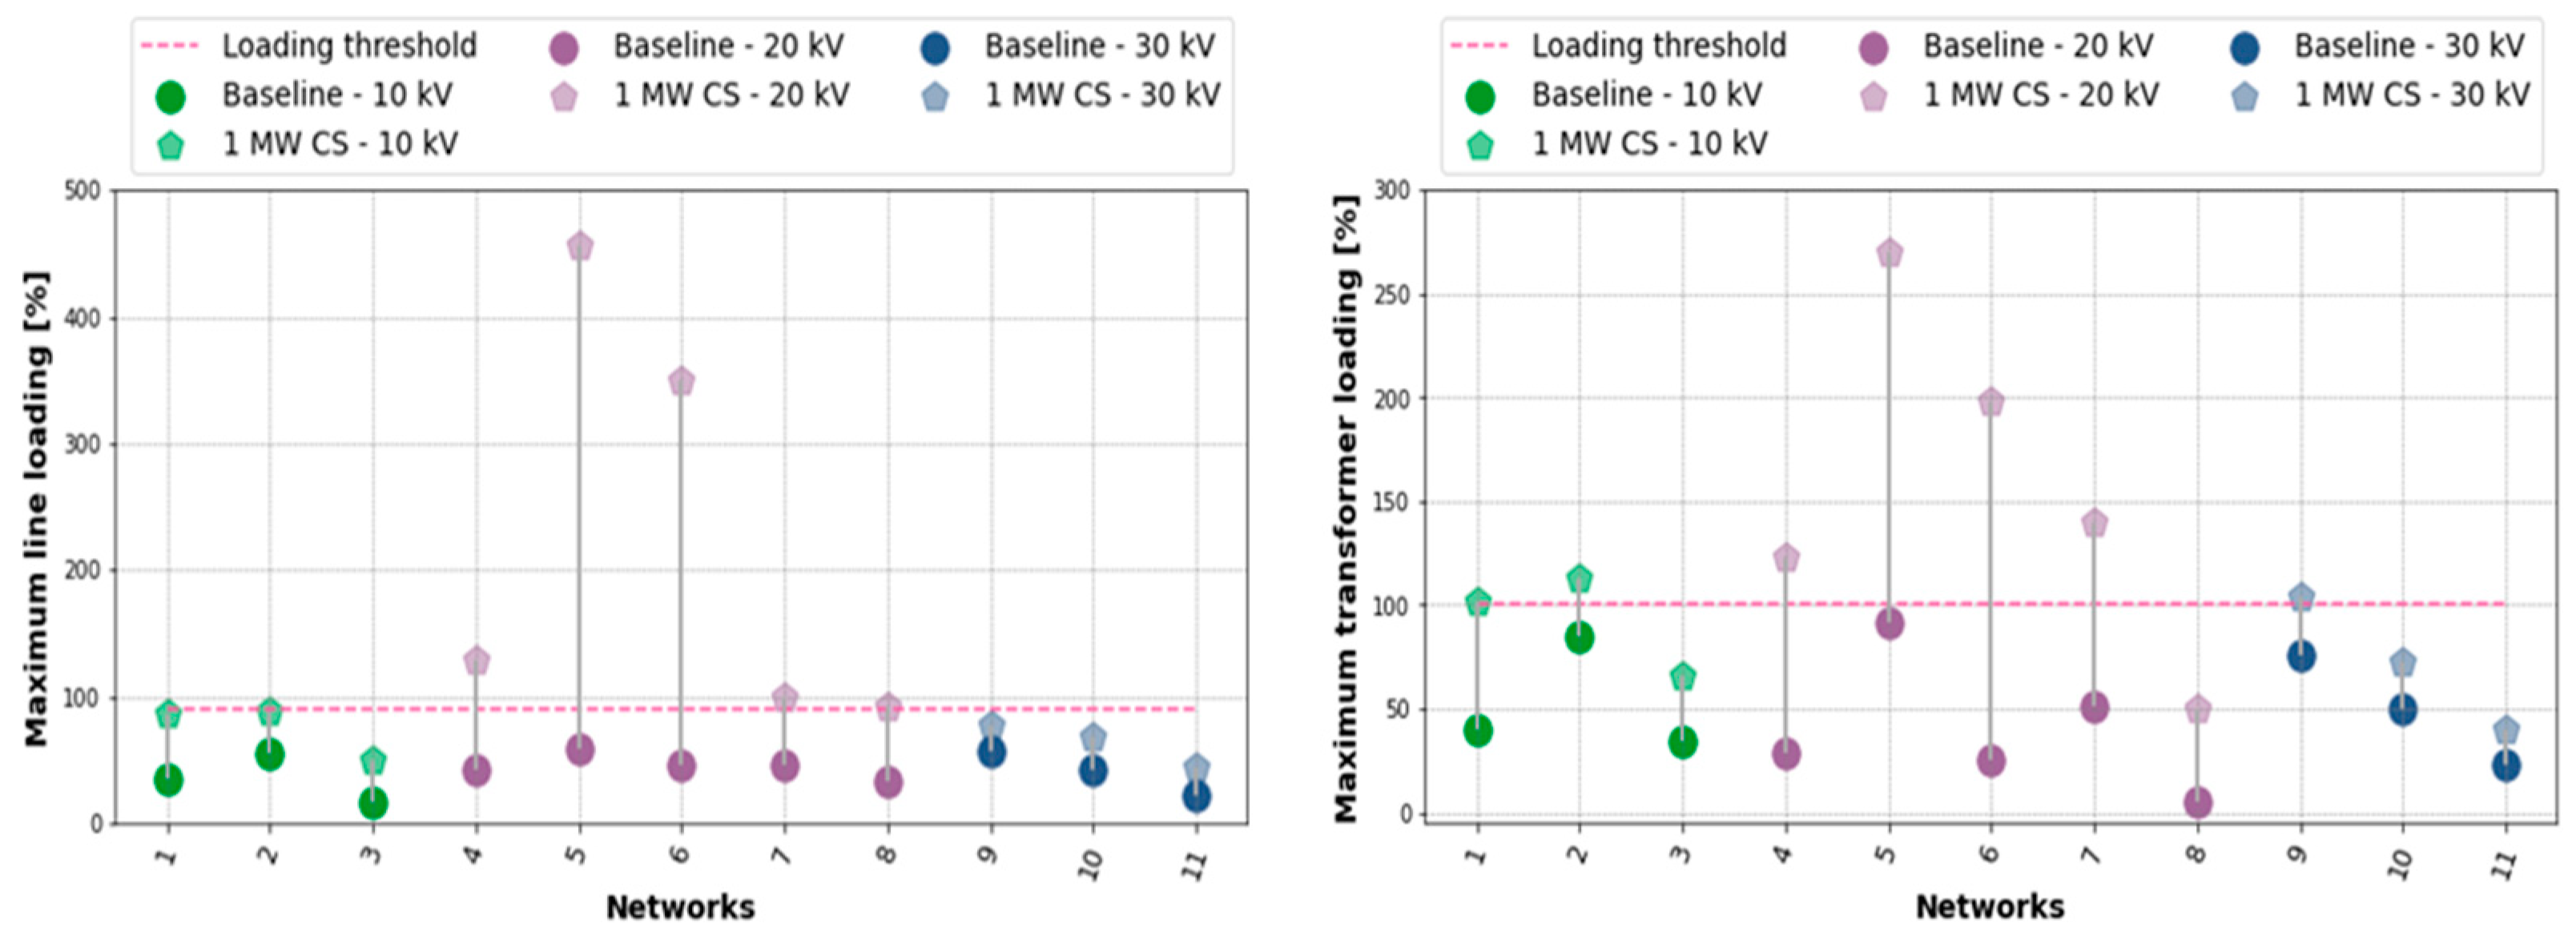
3.3.1. Megawatt Charging Station Connected to Weakest MV Node

Figure 28 shows the impact on the network voltage with reference to the baseline scenario. Despite the drop in voltage, there are no undervoltage violations for any of the use cases, as the voltage remained within the expected operating range (1.0 pu ± 0.05) in all networks.
Similarly, there were no line or transformer loading violations, as shown in Figure 29 and Figure 30, respectively. Therefore, the networks under investigation can support the integration of a 1 MW charging station at the weakest nodes without compromising network stability. It is also worth noting that the results are similar for all four use cases of the charging station. Hence, subsequent results are presented using the motorway use case only.

3.3.2. Scalability Analysis: Increase in Nominal Power of the Megawatt Charging Station at the Weakest Node

As previously stated, scalability scenarios were simulated to assess the impact of the large scale-roll out of MCSs within the network. In this scalability scenario, the nominal power of an MCS was scaled to 2 MW and 3 MW. As shown in Figure 31, all networks can support the integration of a 2 MW charging station without experiencing an undervoltage violation. However, in the case of a 3 MW charging station, network 8 exhibited an undervoltage violation of 0.91 pu.
Furthermore, a total of five networks (networks 1, 2, 3, 5, and 6) experienced line and/or transformer loading violations with an increase in the nominal power, as shown in Figure 32. However, there was no transformer overloading in any of the networks in the case of a 2 MW charging station, while networks 1, 2, and 5 experienced transformer overloading with a 3 MW charging station connected. Regardless of the point of connection, transformer loading problems persist because the total load in the network does not change. Therefore, it was necessary to investigate whether there are other nodes in network 8 (which exhibited undervoltage at the point of connection) and in networks 1, 2, 3, 5, and 6 (which exhibited line overloading) that do not experience voltage or line loading violations when charging stations with a nominal power of 2 MW or 3 MW are connected to them. This was done by connecting the MCS to the strongest node, as described in the following section.

3.3.3. Scalability Analysis: Increase in Nominal Power of the Charging Station at the Strongest Node

This section investigates if there are any nodes in these networks that can support a 2 MW or 3 MW charging station without experiencing voltage/loading violations. Figure 33 shows the minimum network voltage and maximum line loading with the charging station connected at the strongest node. In this scenario, network 8 does not experience a voltage violation (in contrast to when the MCS is connected to the weakest node). Hence, it may be possible to integrate a multimegawatt charging station within the network; however, cognizance must be taken to identify the optimal location in order to reduce or mitigate the need for network reinforcement.

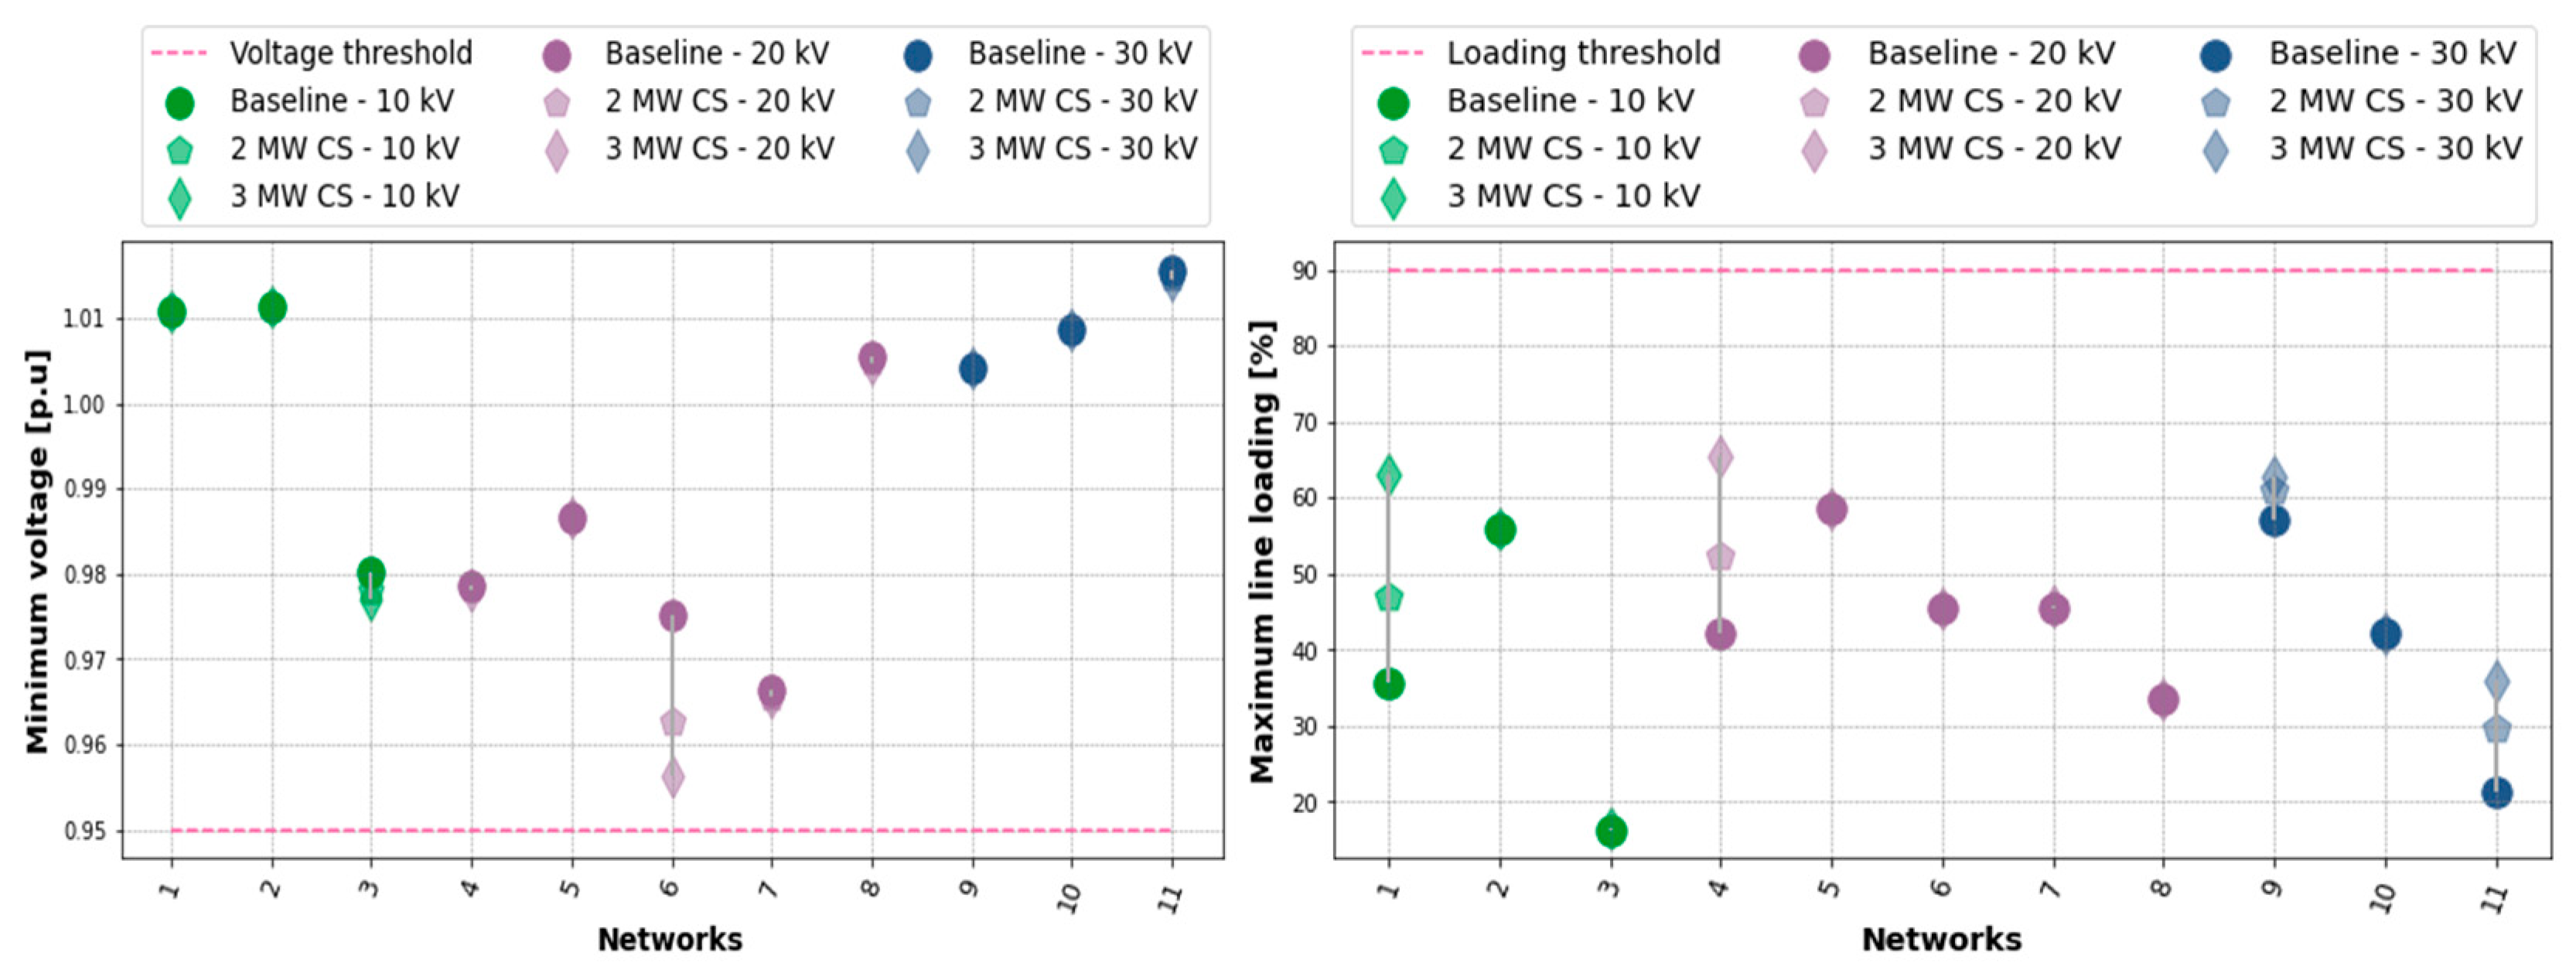
3.3.4. Scalability Analysis: Increase in the Number of Charging Stations Connected within the Network

In this scalability scenario, the number of 1 MW charging stations connected within each network was increased to achieve a charging station penetration of 10% in terms of the number of nodes in each network. The charging stations were randomly allocated to the nodes within each network. Additionally, EV charging profiles were randomly selected from the four use cases (motorway and business premises: urban, rural, and suburban) and randomly assigned to each charging station. This was done to reflect the stochastic nature of charging behavior within the grid. Figure 34 shows the results of the minimum network voltage, with five of the networks experiencing an undervoltage violation, none of which was a 10 kV network. Similarly, the results of the maximum line and transformer loading are shown in Figure 35, where network violations occur due to the increased load.
Therefore, it can be concluded that increasing the penetration of charging stations in the networks up to 10% of the total number of nodes is not possible in most cases due to line and/or transformer overloading, as well as voltage violations beyond the minimum threshold. Therefore, the representative MV networks are unable to support the large-scale penetration of multimegawatt charging in their current state. Network reinforcements and other network support mechanisms such as the integration of distributed generation at the points of connection of the charging station will have to be considered to facilitate the integration of multimegawatt charging stations within MV networks.

4. Photovoltaic and Battery Storage System Sizing

To foster zero emissions and provide grid support, simulations were conducted to assess the optimal sizing of photovoltaic (PV) and battery energy storage systems (BESSs) to support multimegawatt EV charging. The PV and battery storage profiles were optimized for the following two use cases: (1) self-sufficiency and (2) peak shaving using an automated component sizing tool developed at AIT [14]. The grid-connected PV/BESS system operates by using solar power to charge EVs when needed, with any excess energy stored in the batteries. Once the batteries are fully charged, the surplus energy is fed into the grid. The batteries were used for peak shaving to reduce the maximum grid power consumption. The component sizing tool utilized PV generation profiles, which were based on irradiation data from PV-GIS [15] based on the location of the Guntramsdorf motorway rest area. The simulation incorporated models for storage, converters, and PV modules and considered operational strategies with and without peak shaving. Yearly profiles with quarter-hourly resolution were used to provide detailed insights into the time dependencies of the system’s performance.

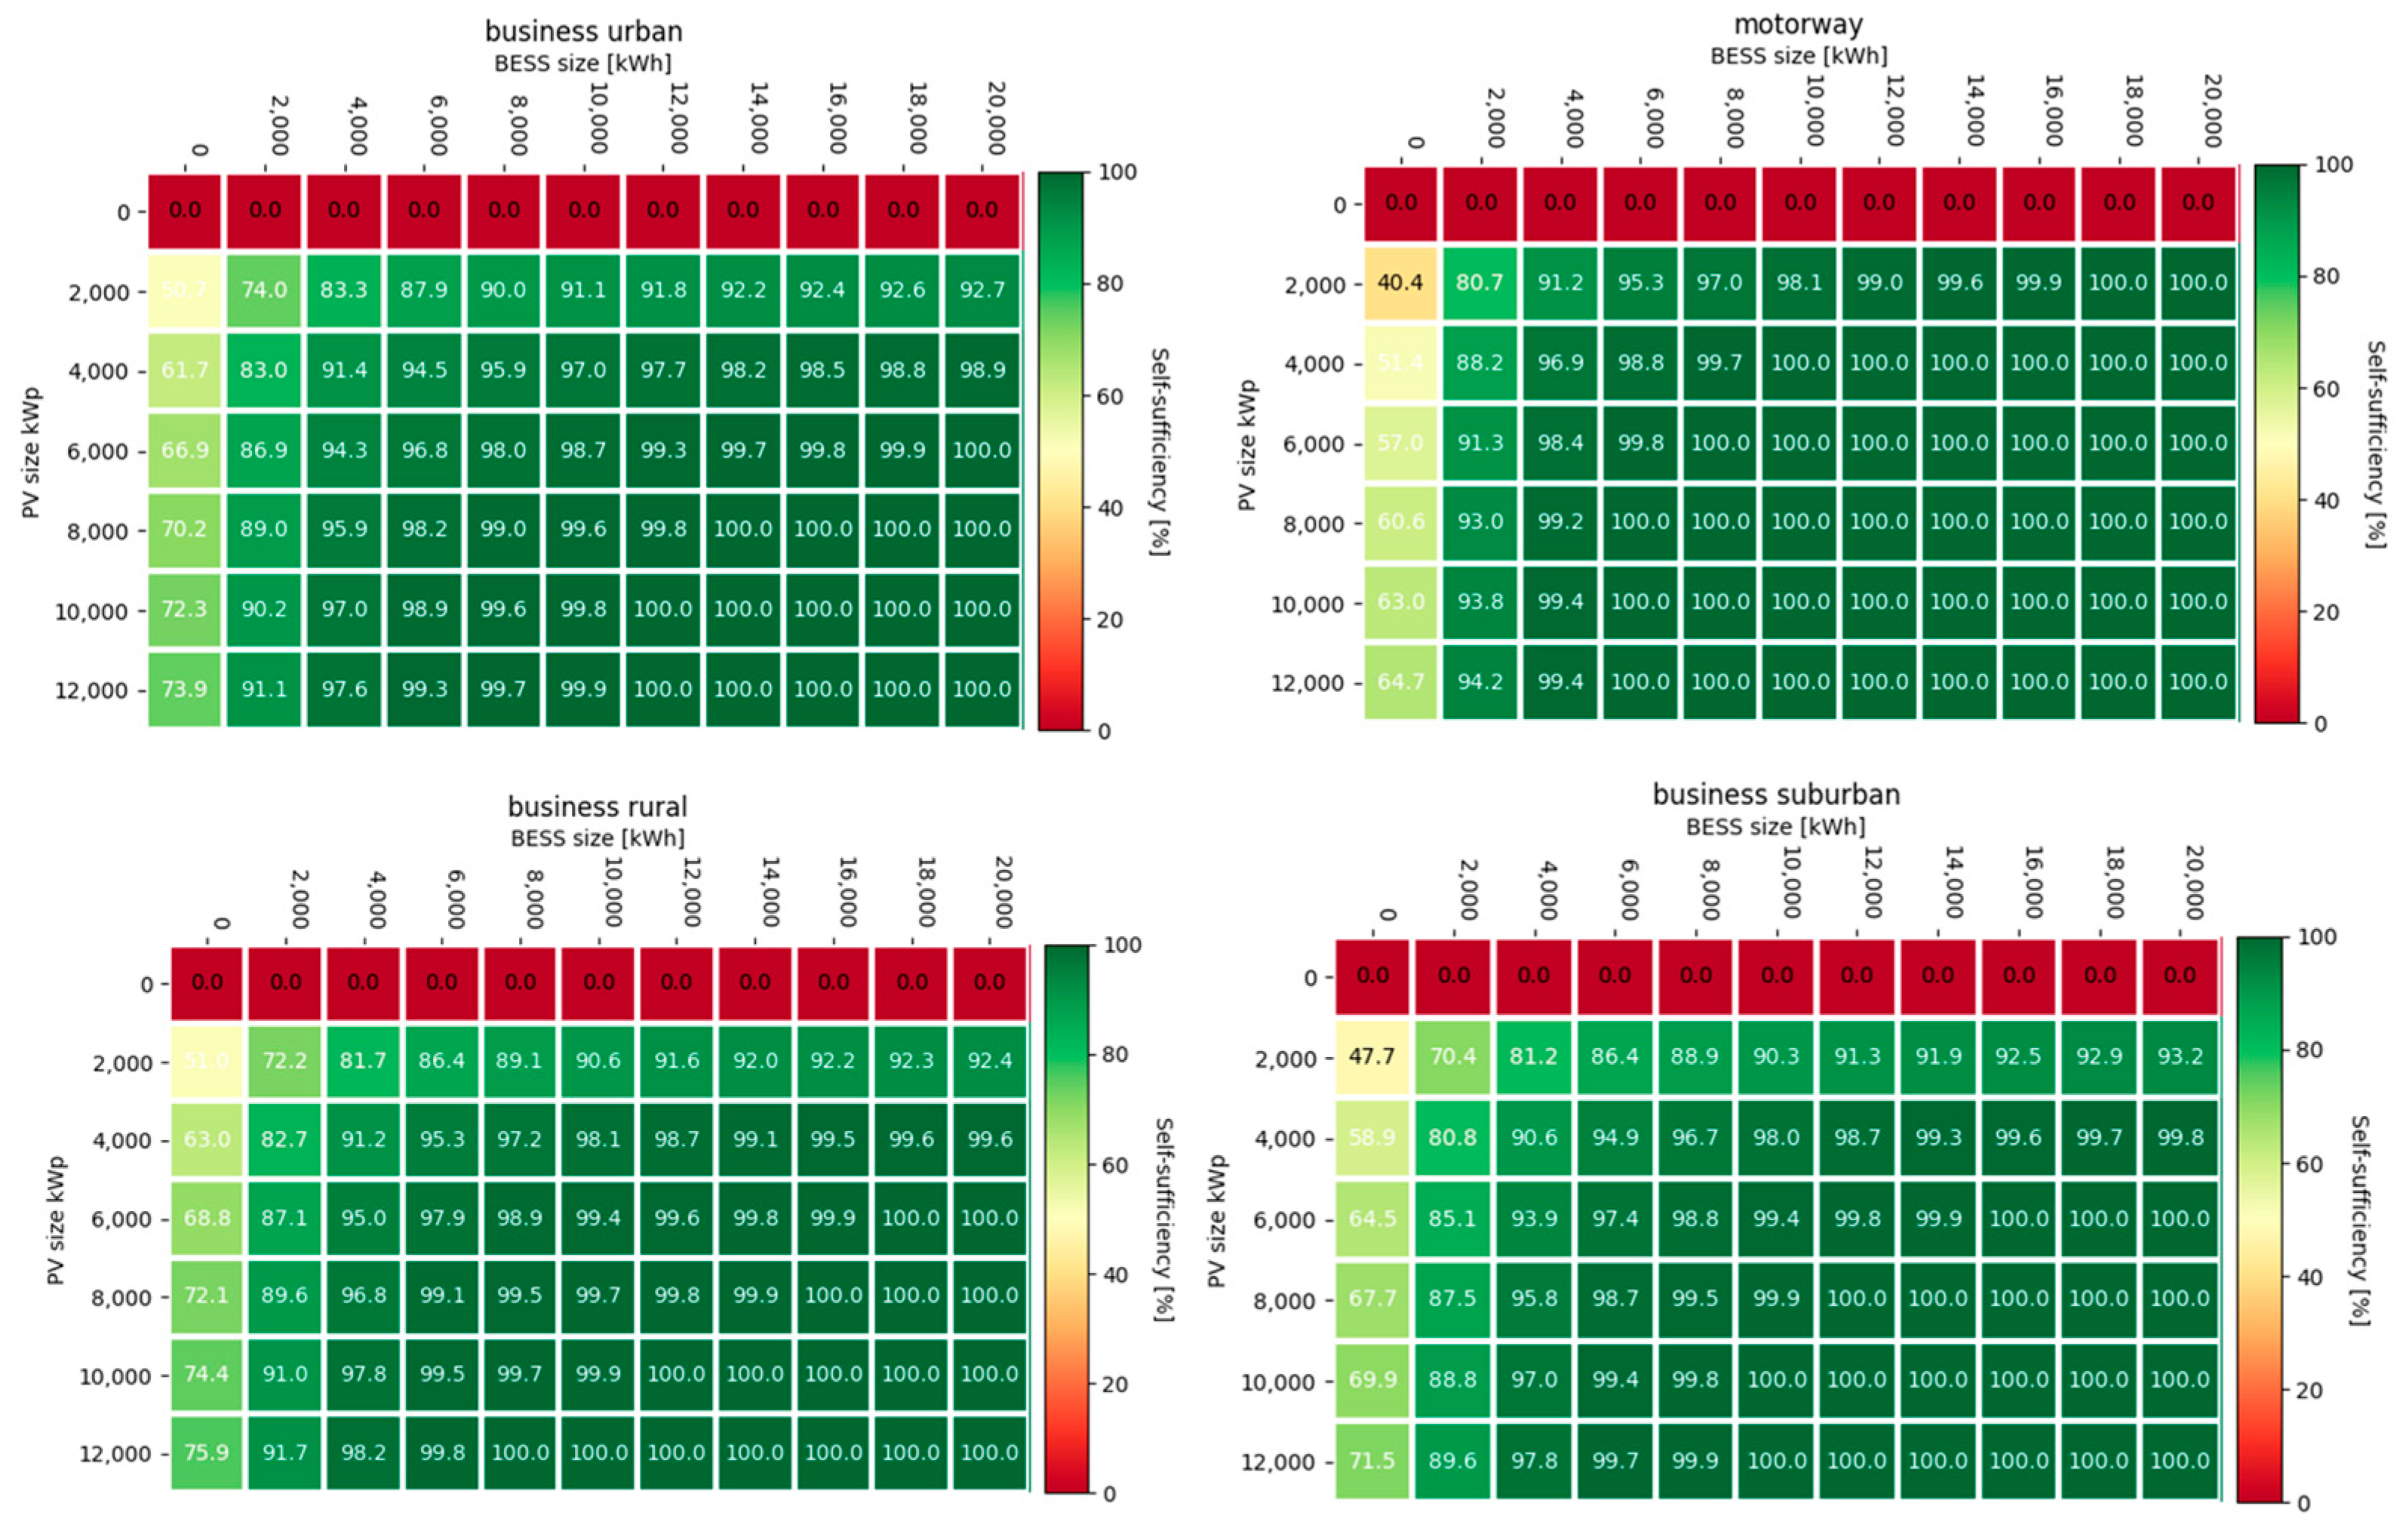
4.1. Self-Sufficiency
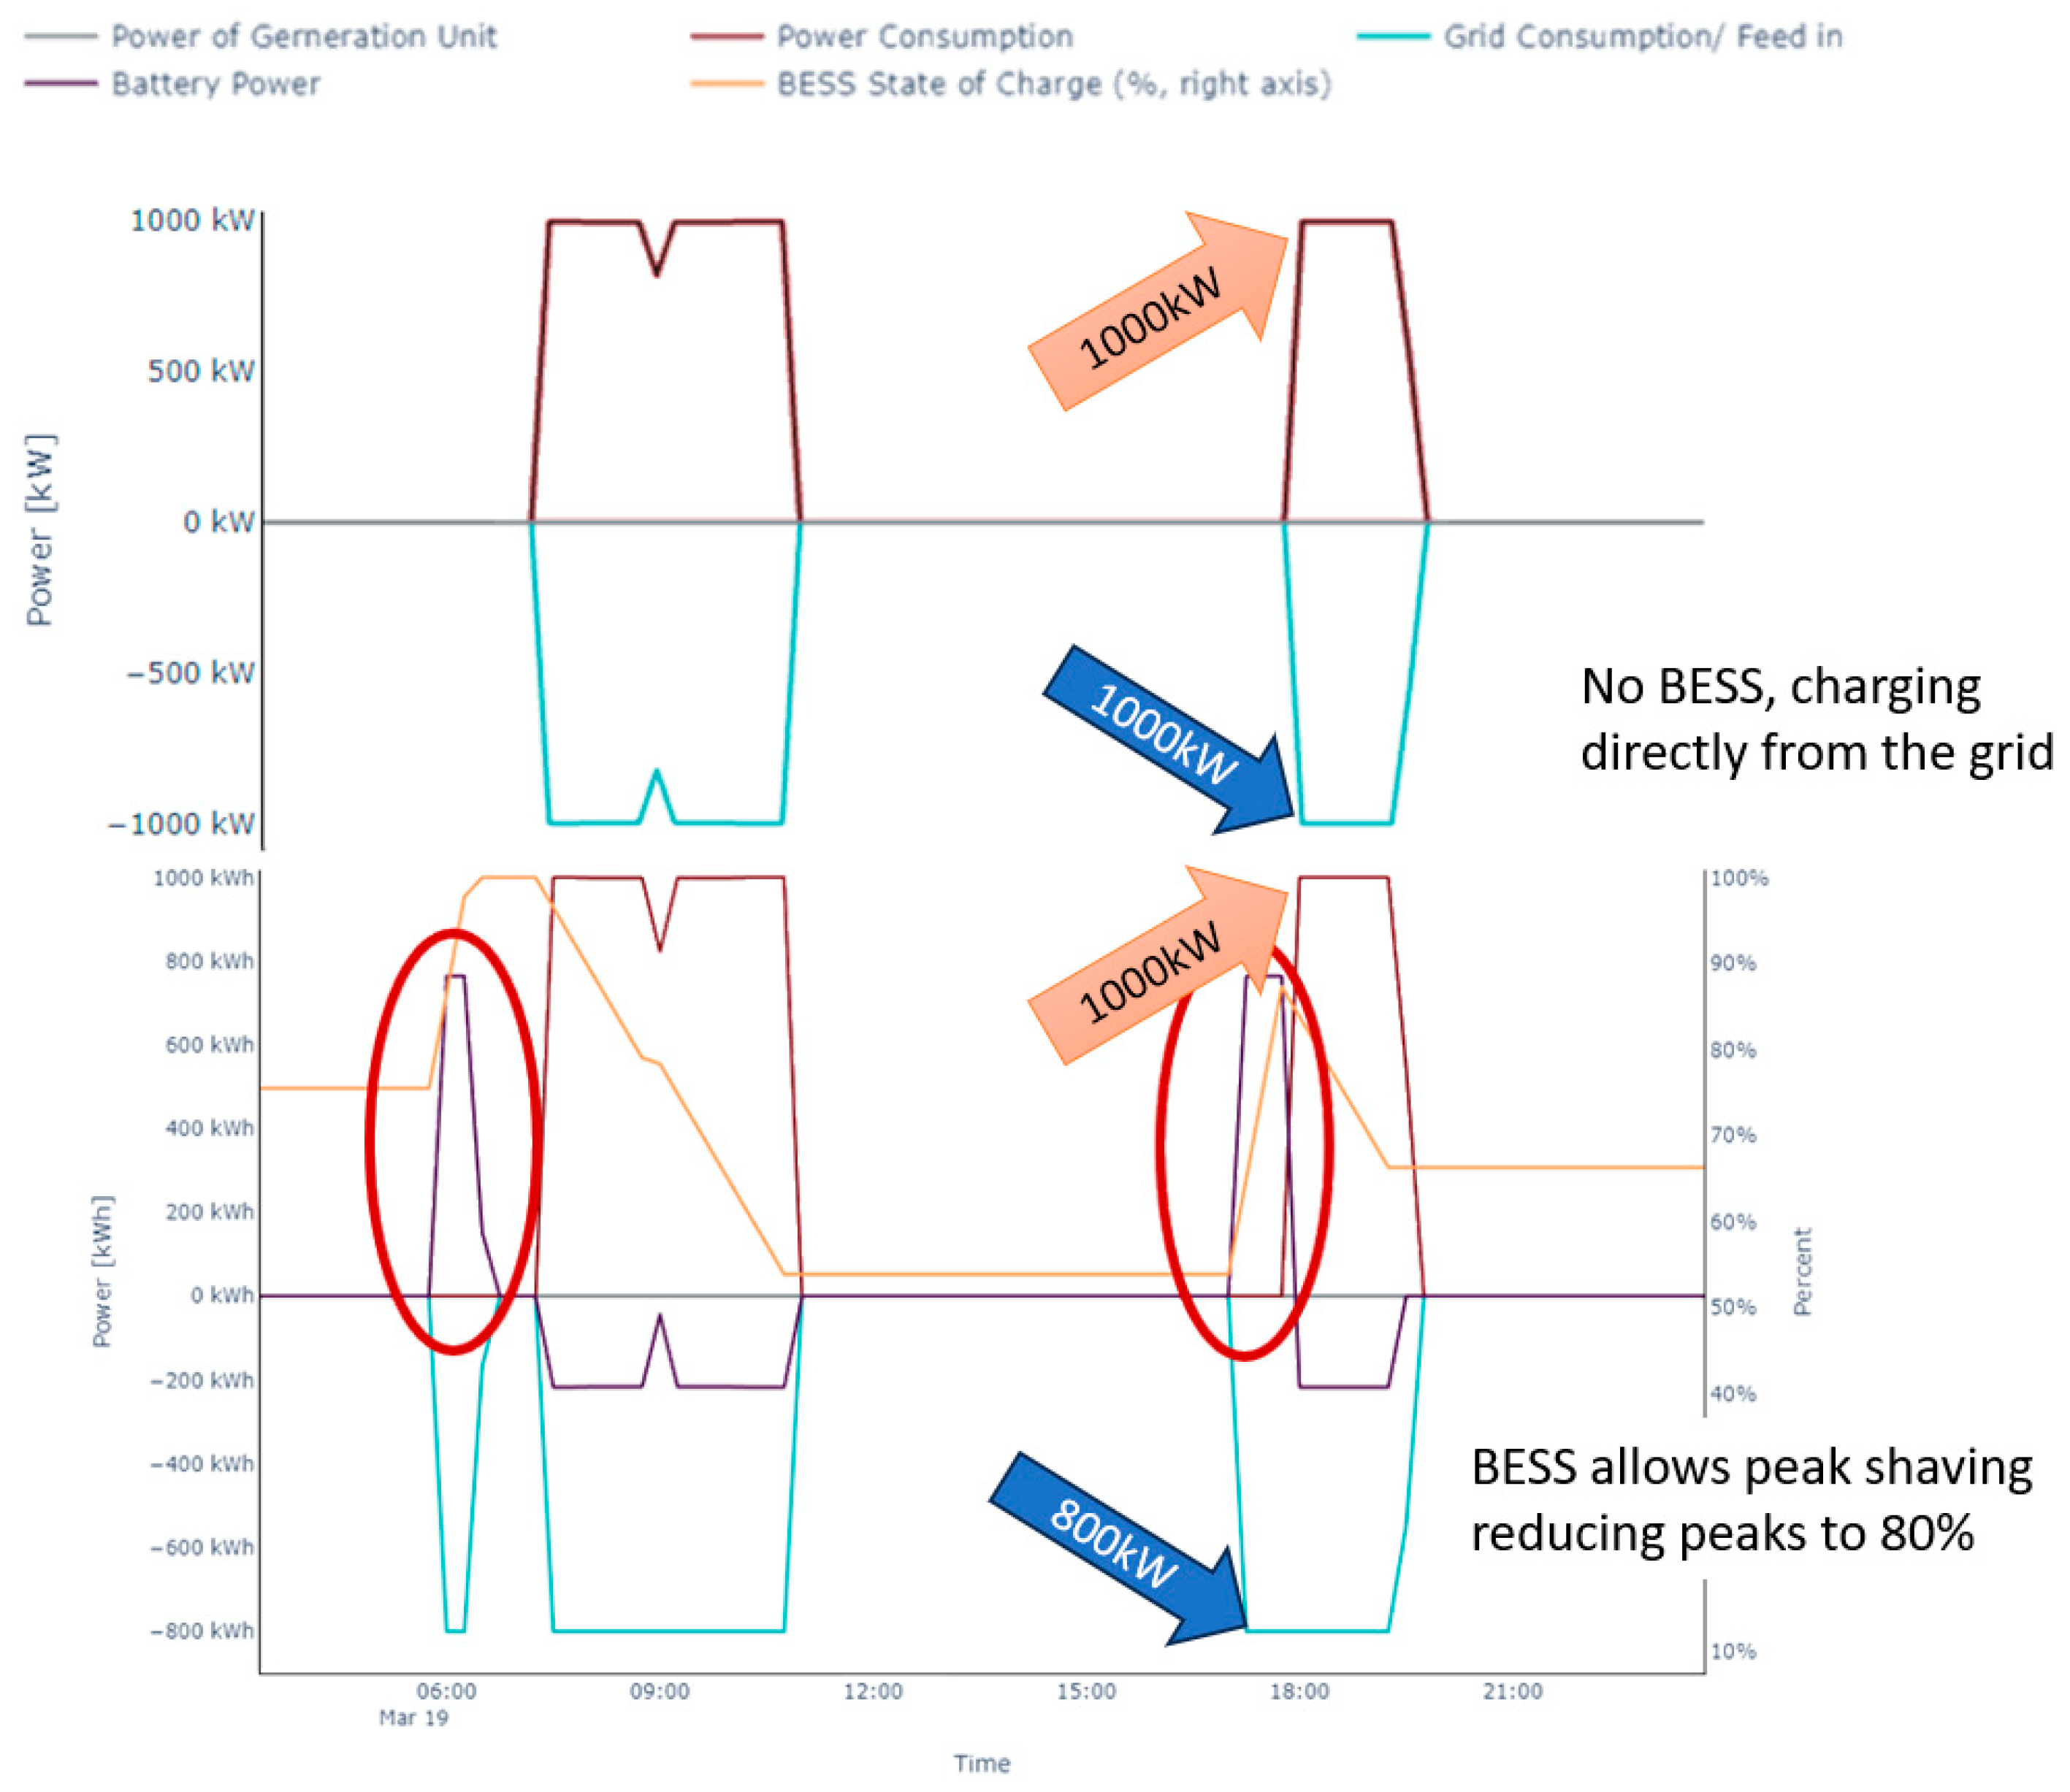
For the system to be considered self-sufficient, the PV/BESS system must operate without grid consumption. To determine the percentage of self-sufficiency, the system was simulated with varying sizes and combinations of PV, BESSs, and grid converters. Results indicate that different converter sizes had minimal impact and thus a 4 MW converter was used for all scenarios in the subsequent discussion. The results of the various system components for each of the scenarios are shown in Figure 36. As can be seen, self-sufficiency can be achieved with adequate PV and BESS capacities, although the corresponding system sizes are considerably large. To achieve 100% self-sufficiency, a PV system of 10–12 MWp is required. However, more than 80% self-sufficiency can be achieved with smaller PV/BESS systems of less than 4000 kWp/4000 kWh, respectively. Full self-sufficiency is not recommended due to high investment costs, as a combined PV and BESS system with grid connection is more economical, allowing surplus generation to be fed into the grid.
It can be further noted that a PV system of 2 MW without a BESS can reduce grid consumption by over 40%, especially for daytime charging profiles. The results obtained for the motorway use case demonstrate noteworthy characteristics. Due to the more evenly distributed charging processes over the entire timespan, self-sufficiency is easily achievable. However, this still necessitates significant PV/BESS system capacities—approximately 8000 kWp for PV and 6000 MWh for BESSs. In conclusion, full self-sufficiency for multimegawatt fast charging stations is not desirable due to the requirement of large, underutilized PV and BESS sizes. A grid-coupled system with smaller PV and BESS sizes is more feasible. For daytime charging profiles, a combination of a fast-charging station, PV, and grid connection (without BESS) could be the most suitable if surplus generation can be easily fed into the grid.

4.2. Peak Shaving

Based on the use case, which requires that charging processes be supported by on-site energy storage and renewable energy systems while providing grid support services, this section investigates whether a BESS can reduce maximum grid power consumption during charging or feed-in from PV surplus generation using peak shaving. This is crucial both technically and economically, as reducing peak grid power consumption can significantly lower energy costs. The charging profiles used in this study are unconventional for peak shaving, which typically reduces a few high load spikes on a base load. In this case, numerous charging processes create consistent peak conditions (e.g., 1 MW peaks), which results in complications for typical peak-shaving approaches. The simulation assumes “perfect forecasting”, meaning the entire charging profile is known in advance, a luxury not available in real systems but useful for proof of concept. An example of the peak-shaving approach with the aim of reducing the maximum grid consumption to 80% and 66% is shown in Figure 37.
Peak-shaving optimization for these profiles is a linear problem solved over a year using the CBC solver, an efficient open-source MILP solver [16]. The study identified the minimum BESS size needed for peak shaving without PV generation by varying BESS and converter sizes. The study also evaluated CO2 savings (Table 5 for the motorway scenario), assuming a conversion factor of 0.2 t CO2/MWh. Despite considerable grid cost savings, BESS-only peak shaving is economically unfeasible, with investment costs 40–55 times higher than annual savings, except for the “motorway” scenario (Table 6), which still requires a minimum of 17 years for amortization, exceeding the typical BESS system lifespan.
The analysis covered “motorway”, “business suburban”, and “business urban” scenarios. The minimum BESS sizes needed for peak shaving vary by profile and goal. In order for the BESS capacities to remain effective at end of life (80% state of health), installation sizes are actually 125% of the presented capacities.
Adding PV generation increases system complexity, as the optimizer must shift PV generation to match consumption, with surplus potentially fed into the grid. System efficiency tends to decrease with larger converters due to less favorable operation points. A 1000 kW converter size was chosen for further analysis to ensure reliability, even if the BESS fails. Installing PV can reduce grid consumption and, with favorable feed-in rates, might increase electricity cost savings. However, the BESS must be sized for end-of-life capacity. For example, in the “business urban” scenario with 66% peak shaving, the initial BESS size must be 4500 kWh to ensure 3600 kWh at an 80% state of health. Investment costs are more than 30 times the annual savings, making it economically less favorable. The “motorway” scenario performs better but still shows a long amortization period (see Table 7).
Overall, given current BESS prices, no profile generates financial revenue, although significant CO2 emission reductions are possible. Optimal PV and BESS combinations have similar values for PV (kWp) and BESS (kWh). Larger PV sizes provide diminishing returns, so they were not evaluated. The assumption of perfect forecasting highlights that peak shaving is unlikely to be financially beneficial for real charging stations but could relieve network congestion, indicating a need for better financial incentives for peak shaving in fast charging stations.

5. Development of Communication Concepts Required for a Multi Megawatt Charging Station

A multimegawatt charging station (MSC) includes four key interfaces that are addressed within the communication concept, as shown in Figure 38. The first aspect involves defining the communication between the MCS and the vehicle being charged (Interface 1). Thereafter, the concept outlines the communication links between the subsystems within the MCS (interface 2) and how these connect to adjacent interfaces (interfaces 1, 3, and 4). Additionally, the MCS must establish basic communication with the grid operator to meet grid-related requirements (interface 3). Finally, a remote connection is planned, enabling a service technician to access specific subsystems for remote maintenance activities (interface 4). The following sections discuss each of these interfaces in more detail.

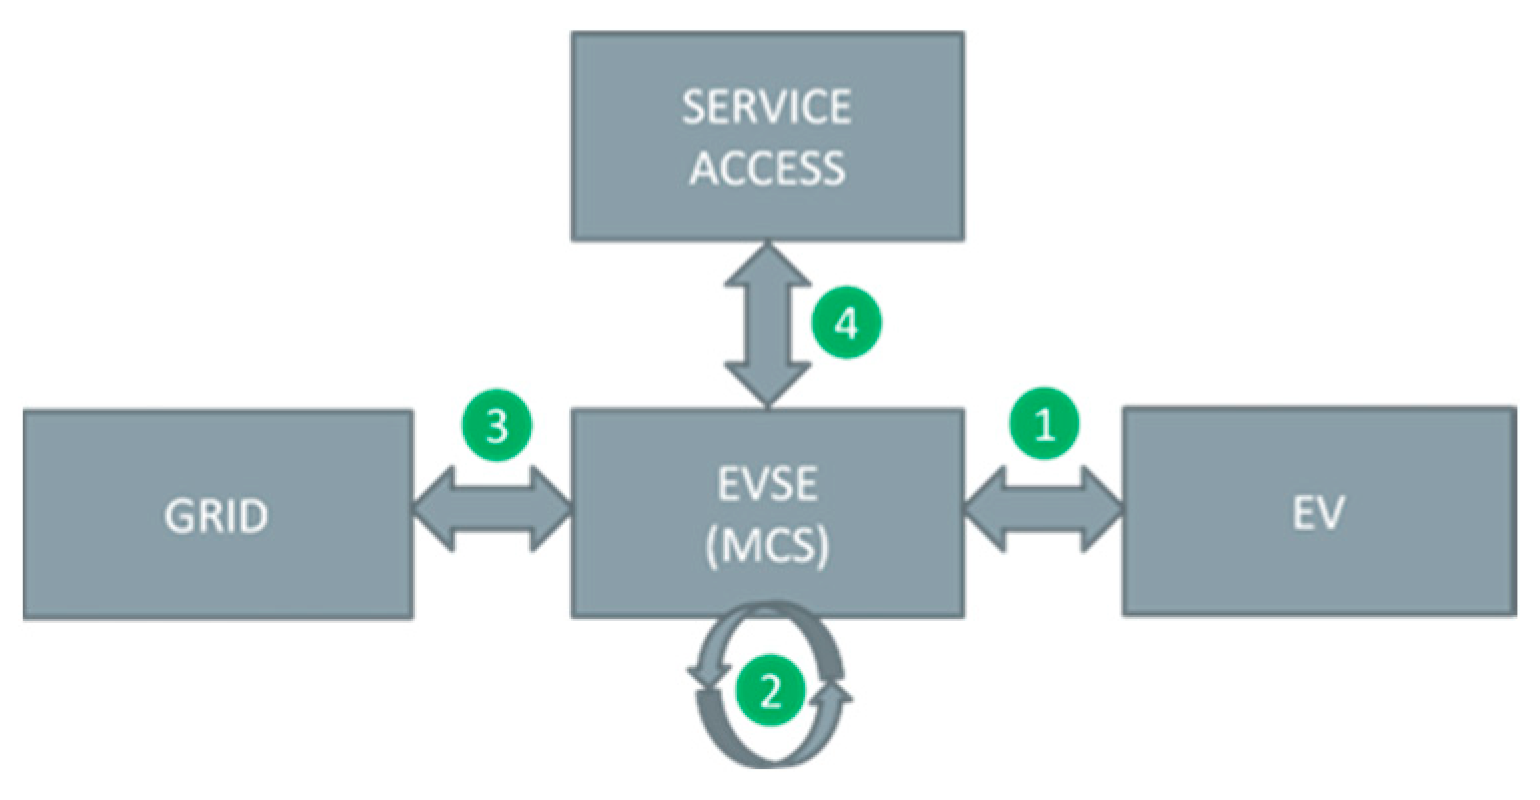
5.1. Communication Concepts between Multimegawatt Charging Station and Electric Vehicle

5.1.1. AC Charging Capabilities

The interconnection between MCSs and an EVs primarily involves the transfer of direct current (DC) power, as alternating current (AC) charging is excluded due to the focus on high-power applications. While AC charging is widely supported by current EVs, it is not relevant in the context of megawatt-level charging for heavy-duty vehicles.
To establish this connection, a coupling device such as a connector cable or plug is essential. The Combined Charging System (CCS) is the standard for European EVSEs, and a dedicated task force within CharIN (Charging Interface Initiative e.V.) is developing a specialized DC connector for megawatt charging. This connector addresses critical requirements for safety, handling, power transfer, and communication. Details on the physical and protocol layers of this connector can be found in CharIN’s recent publications [17,18].
The investigation also explored suitable connector technologies for megawatt charging, providing a detailed assessment that covers regulatory frameworks, industry standards, and communication protocols relevant to this charging application. Furthermore, a compilation and assessment of relevant standards pertaining to megawatt charging was conducted, including standards of the design and communicational layer of a megawatt charging connector.

5.1.2. ISO 15118 and Vehicle-to-Grid (V2G) Considerations

The communication concept between EVs and multimegawatt charging stations must address the direction of energy flow. ISO 15118-20 [19] standardizes vehicle-to-grid (V2G) interactions so that EVs can potentially supply energy back to the grid. Although most use cases involve unidirectional charging, bidirectional V2G capabilities are also considered beneficial for grid support and are anticipated in future developments, even in megawatt charging applications [16]. Large energy storage systems in the form of vehicle batteries have potential for grid-serving functions; however, current business/use cases have not been fully developed. Normative specifications have already been established within the framework of ISO 15118 [20], on which multimegawatt charging infrastructure developments can be based.

5.1.3. Relevant EV Charging Standards

CCS is the predominant standard for DC fast charging in Europe, as supported by CharIN, which includes major automotive and commercial vehicle manufacturers. The CCS standard, alongside ISO 15118, is integral to the design of multimegawatt charging infrastructure. Other standards, such as CHAdeMO, which is evolving into “CHAOJI”, and Tesla’s Supercharger, are also relevant but are less prevalent in Europe compared to CCS. Consequently, CCS and ISO 15118 are identified as the key standards for the development of future European charging infrastructure.

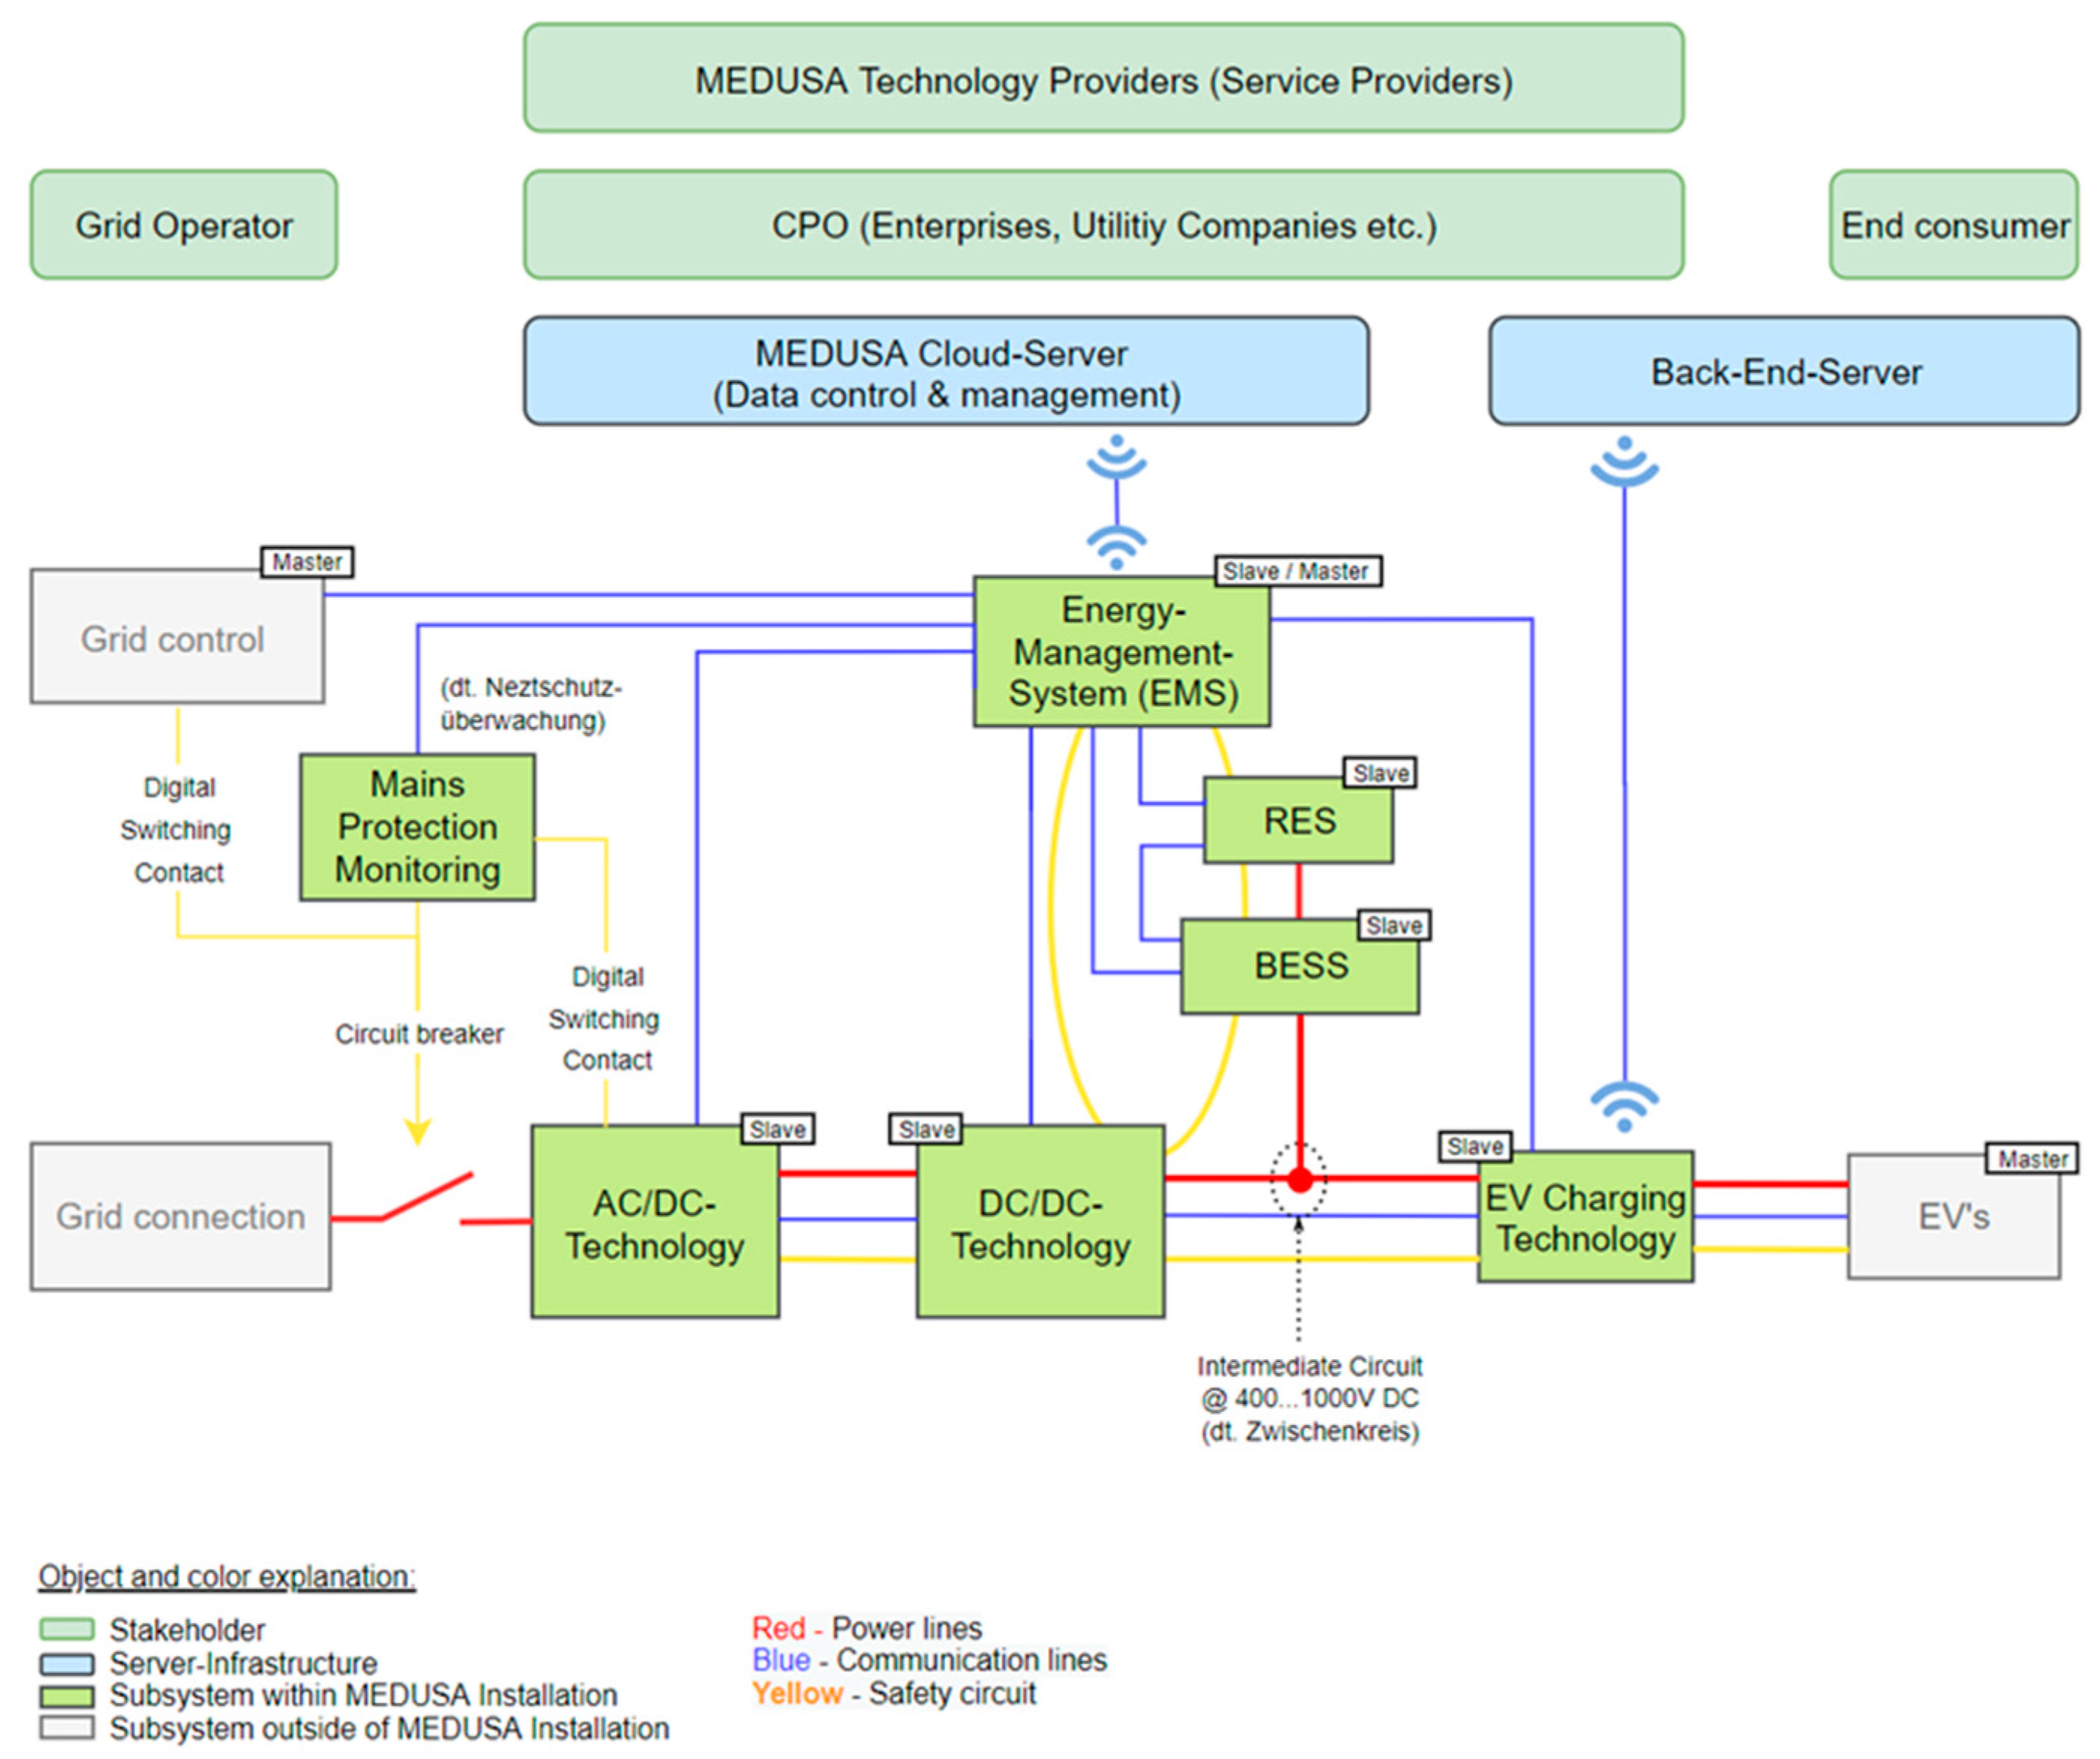
5.2. Communication within Multimegawatt Charging Station Subsystems and Involved Stakeholders

Several key aspects were explored and defined to guide the development of a high-level communication plan for multimegawatt charging infrastructure. These aspects shaped the basic structure and interconnection of relevant subsystems in the context of multimegawatt charging infrastructure. The developed communication concept between subsystems and stakeholders is shown in Figure 39. As can be seen, the communication concept distinguishes between server infrastructure (blue boxes with rounded edges) and plant infrastructure (green boxes), which is wirelessly connected to the server’s infrastructure (icon representing a wireless communication link). Connections between the respective subsystems are distinguished by the nature of their connection, being either for communication purposes (blue lines), power transfer (red lines), or a safety line (yellow).
During the development of the communication concept, it is necessary to clearly define the roles and responsibilities of the subsystems and stakeholders. In this way, the data that need to be exchanged and the impact of control and feedback control actions can be clearly defined.

5.2.1. Energy Management System

A key finding on the monitoring and control of a plant highlights the necessity of a central Energy Management System (EMS). The EMS is responsible for consolidating, evaluating, and controlling essential operations, as well as handling warning and fault conditions across various subsystems within the plant. The EMS’s core responsibilities include (1) central plant monitoring and control, similar to a SCADA system; (2) load management; (3) management of grid support activities; (4) maintenance management; and (5) short-term local data storage. The EMS concept revolves around a central control room where plant operators can monitor key status information and receive critical alerts through push notifications. The EMS must also be capable of undertaking both automated and manual control actions based on predefined operational parameters such as power limitation or interventions in the case of faults. Given the complexity of managing various load and power delivery states with numerous dependencies, SCADA systems play a crucial role. These systems enable the supervision and control of resources, facilitating operational insights, process control, and data-driven decision making. Load management involves identifying power-limiting factors, assessing power availability, and optimizing energy efficiency by regulating and prioritizing power consumption and output. This task is particularly crucial due to the integration of Renewable Energy Systems (RESs) like photovoltaic systems and the use of BESSs as proposed in Section 4. Load management considers environmental factors such as solar intensity, electricity prices, and bidirectional vehicle charging to optimize energy use for both economic and technical benefits. Grid support management encompasses the provision of grid services like reactive power and power factor control. Lastly, maintenance management focuses on collecting data from subsystems to notify operators about upcoming maintenance tasks.

5.2.2. Cloud Application

In addition to the EMS, a management interface called the MEDUSA cloud application is envisioned to serve as a cloud-based platform for plant monitoring and data storage. This cloud server and user interface will allow plant operators to remotely monitor key operational metrics across multiple sites and manually intervene if needed based on real-time status. Critical functions like component status monitoring and manual control (e.g., subsystem shutdowns or limiting bidirectional charging) are central features. The cloud infrastructure also plays a crucial role in securely storing long-term plant data within redundant server systems. Data collected by the EMS will be archived and made available for analysis and reporting. Automated evaluations and trend analyses will support informed decision making, while automated notifications will alert operators to operational abnormalities.
It is to be noted, however, that the development of the MEDUSA cloud application for multi-site plant monitoring and data storage presents significant challenges. It is crucial to comprehensively define the requirements for the EMS, which will then guide the specification of the cloud application for multimegawatt charging stations. Additionally, data security is a key priority, ensuring long-term availability through redundant systems while protecting against unauthorized access. Collaboration with cloud solution providers is needed to establish secure infrastructure. Given the extensive data generated by the system, functions that allow for automated data analysis, evaluation, and presentation are essential considerations. Furthermore, the choice of cloud infrastructure must carefully balance user interface design, security needs, and data analysis capabilities, requiring detailed discussions between stakeholders after the EMS specifications are finalized.

5.2.3. Backend Server

The integration of a backend system is planned as a key component for the management, monitoring, control, and remote maintenance of charging points, as well as for the handling of commercial processes related to charging operations. The primary functions of this backend system include aspects such as customer management and ancillary services, online payment and billing, tariff management, charge point management, roaming, and customer-specific interface integration. Customer management and ancillary services cover tasks such as input, storage, and retrieval of customer relationship management (CRM) data. The backend should also support the activation of additional services, like free charging, based on specific customer agreements.
The connection between the backend system and the charging stations is established through a wireless interface linked to the EV charging infrastructure. Communication between charging stations, electric vehicles, and the central management system relies on the Open Charge-Point Protocol (OCPP), which is a globally recognized and standardized application protocol designed to ensure interoperability and seamless communication within charging networks.

5.2.4. Renewable Energy Systems (RESs) and Battery Energy Storage System (BESSs)

In this context, a renewable energy system primarily consists of a photovoltaic system designed to provide economic benefits and reduce the overall CO2 footprint through self-generation of electrical energy as described in Section 4. An RES has two key responsibilities, namely generating electrical energy via solar power and dynamically supplying electrical energy to the battery energy storage system (BESS). The dynamic management of energy flow to the BESS is particularly critical. Due to its high level of energy efficiency, the system is designed to feed solar power exclusively into the BESS, with the energy supply controlled by the EMS’s load management system. The BESS plays a central role in dynamically storing and supplying electrical energy based on factors such as RES generation, medium-voltage grid availability, consumer load demands, and special cases like grid interruptions. Additionally, the BESS is responsible for protecting its battery cells from external damage, such as overloads on the DC link. A significant challenge in integrating the BESS lies in coordinating load management between the EMS, RES, and BESS. Fluctuating environmental conditions can rapidly alter RES generation, while varying loads from electric vehicles and grid feedback from bidirectional charging introduce further complexity. This necessitates detailed discussions and workshops between technology partners to develop a robust operating concept. Given the complexity, continuous refinement of the load management strategy and operational procedures, particularly for medium-voltage grid interruptions, is essential as concept development progresses.

5.2.5. DC–DC Converters and DC Link

The primary role of DC–DC converters is to dynamically manage and distribute the power allocated by the EMS to the electric vehicle, drawing energy from either the medium-voltage grid or the battery storage system. In cases in which bidirectional power flow is required, the converters can also reverse the power flow direction, as directed by the EMS. Continuous communication with the EMS is essential, transmitting key status and monitoring parameters such as the number of active converters, insulation levels, temperature values, and current operating targets. The AC/DC and DC/AC converter systems within the medium-voltage range are responsible for establishing and maintaining the DC link’s voltage and current according to EMS specifications. These converters support bidirectional power flow, enabling both AC-to-DC and DC-to-AC conversions for power draw and feedback into the medium-voltage grid. Additionally, grid-supporting features such as reactive power control and power factor control are included, all managed and monitored through the EMS.
Challenges associated with these converters include the need for intensive evaluation of application rules and standards to ensure proper feedback of electrical energy into the grid. While the authors anticipate low integration complexity regarding digital communication with adjacent subsystems, meeting the technical and regulatory demands of grid interaction will require thorough analysis and adherence to relevant standards.

5.2.6. EV Charging Technology

The primary function of EV charging technology is to manage communication between the EV and the charging infrastructure. This interaction operates as a “master–slave” system, where the vehicle (master) communicates its charging requirements, and the infrastructure (slave) responds with its ability to meet those needs, including any limitations. Central to this communication is the charge controller, the core component of EV charging technology. The charge controller is responsible for managing the exchange of information with the vehicle, but additional components, such as insulation monitoring instruments, are also required according to standards and must be integrated separately. The charge controller typically interfaces with a backend system using the Open Charge Point Protocol (OCPP) over a wireless connection. Based on the vehicle’s load demands, the charge controller relays key parameters to the EMS, which then determines an available power source, whether from the grid or the battery energy storage system (BESS). All charging data are transmitted to the EMS and subsequently stored in the MEDUSA cloud application for further analysis and optimization. European charging standards, notably CCS and CHAdeMO (with CHAOJI emerging as a future standard), are continuously evolving to address market demands and advance charging technology. Current research on the “multimegawatt plug” indicates that the CCS standard for multimegawatt charging is being further refined and remains rooted in the CCS communication protocol. However, charging at such high-power levels (>1 megawatt) introduces new safety considerations, necessitating the enhancement of the protocol. The integration of the advanced CCS charging standard in the current use case presents significant challenges. While most existing communication standards (such as IEC 61851-24 [21] and ISO 15118) can likely be adapted with incremental updates for multimegawatt charging, the integration effort is expected to be substantial. The development of charging plug technology, communication protocols, and V2G functionality (e.g., bidirectionality) involves overcoming both technological hurdles and early implementation issues. Given the complexity, this integration could take more than 10 months, reflecting the need for continuous refinement and optimization as the technology evolves.

5.2.7. Further Considerations for an MCS Communication Concept

Stakeholder discussions on the communication concept for MCSs have yielded two main frameworks, namely a master–slave hierarchy and a high-level safety concept. The master–slave hierarchy framework organizes subsystems based on their roles in command and response, following a predefined operating concept. In this hierarchy, the following three entities are identified as “masters”, imposing constraints on the system: the EV, which sets operational limits through its Battery Management System (BMS); the grid operator, who can request grid support or mandate derating or disconnection due to grid issues; and the Charge Point Operator (CPO), whose personnel require comprehensive monitoring and control capabilities provided by the EMS. This hierarchical approach ensures structured communication and control within the MCS. Regarding safety, the discussions provided a high-level safety concept that includes a single safe-line connection for all major subsystems, with the system, except for devices operating on Separated Extra Low Voltage (SELV), shutting down when critical conditions trigger the safe-line contactor. The determination of critical conditions is defined by the technology provider for each subsystem.

5.3. Communication between MCSs and the Distribution Grid

Austrian grid regulation TOR Verteilernetzanschluss—Niederspannung V1.2 [22] requires AC and DC chargers to provide a bidirectional digital communication interface based on an open standard (e.g., OCPP [23] or EEBUS [24]), which can be used to remotely control the charging power of a charging station. However, the requirement of a specific communication protocol for DC chargers such as the MEDUSA medium-voltage megawatt charging system remains unclear. Further research and expanded consultations with the relevant industry and government organizations involved in the development of EEBUS and related technologies are needed to address these gaps.
In the proposed communication concept, a main protection monitoring unit is planned to enable both the grid operator and the charging station operator to disconnect the system from the medium-voltage grid in the event of a fault or other necessity. This unit utilizes digital switching contacts or circuit breakers, which can be controlled directly by the grid operator or through the grid monitoring technology integrated within the MCS. To ensure seamless communication between the distribution grid and the MCS, a dedicated communication link between the EMS and the grid-side communication unit is envisioned.

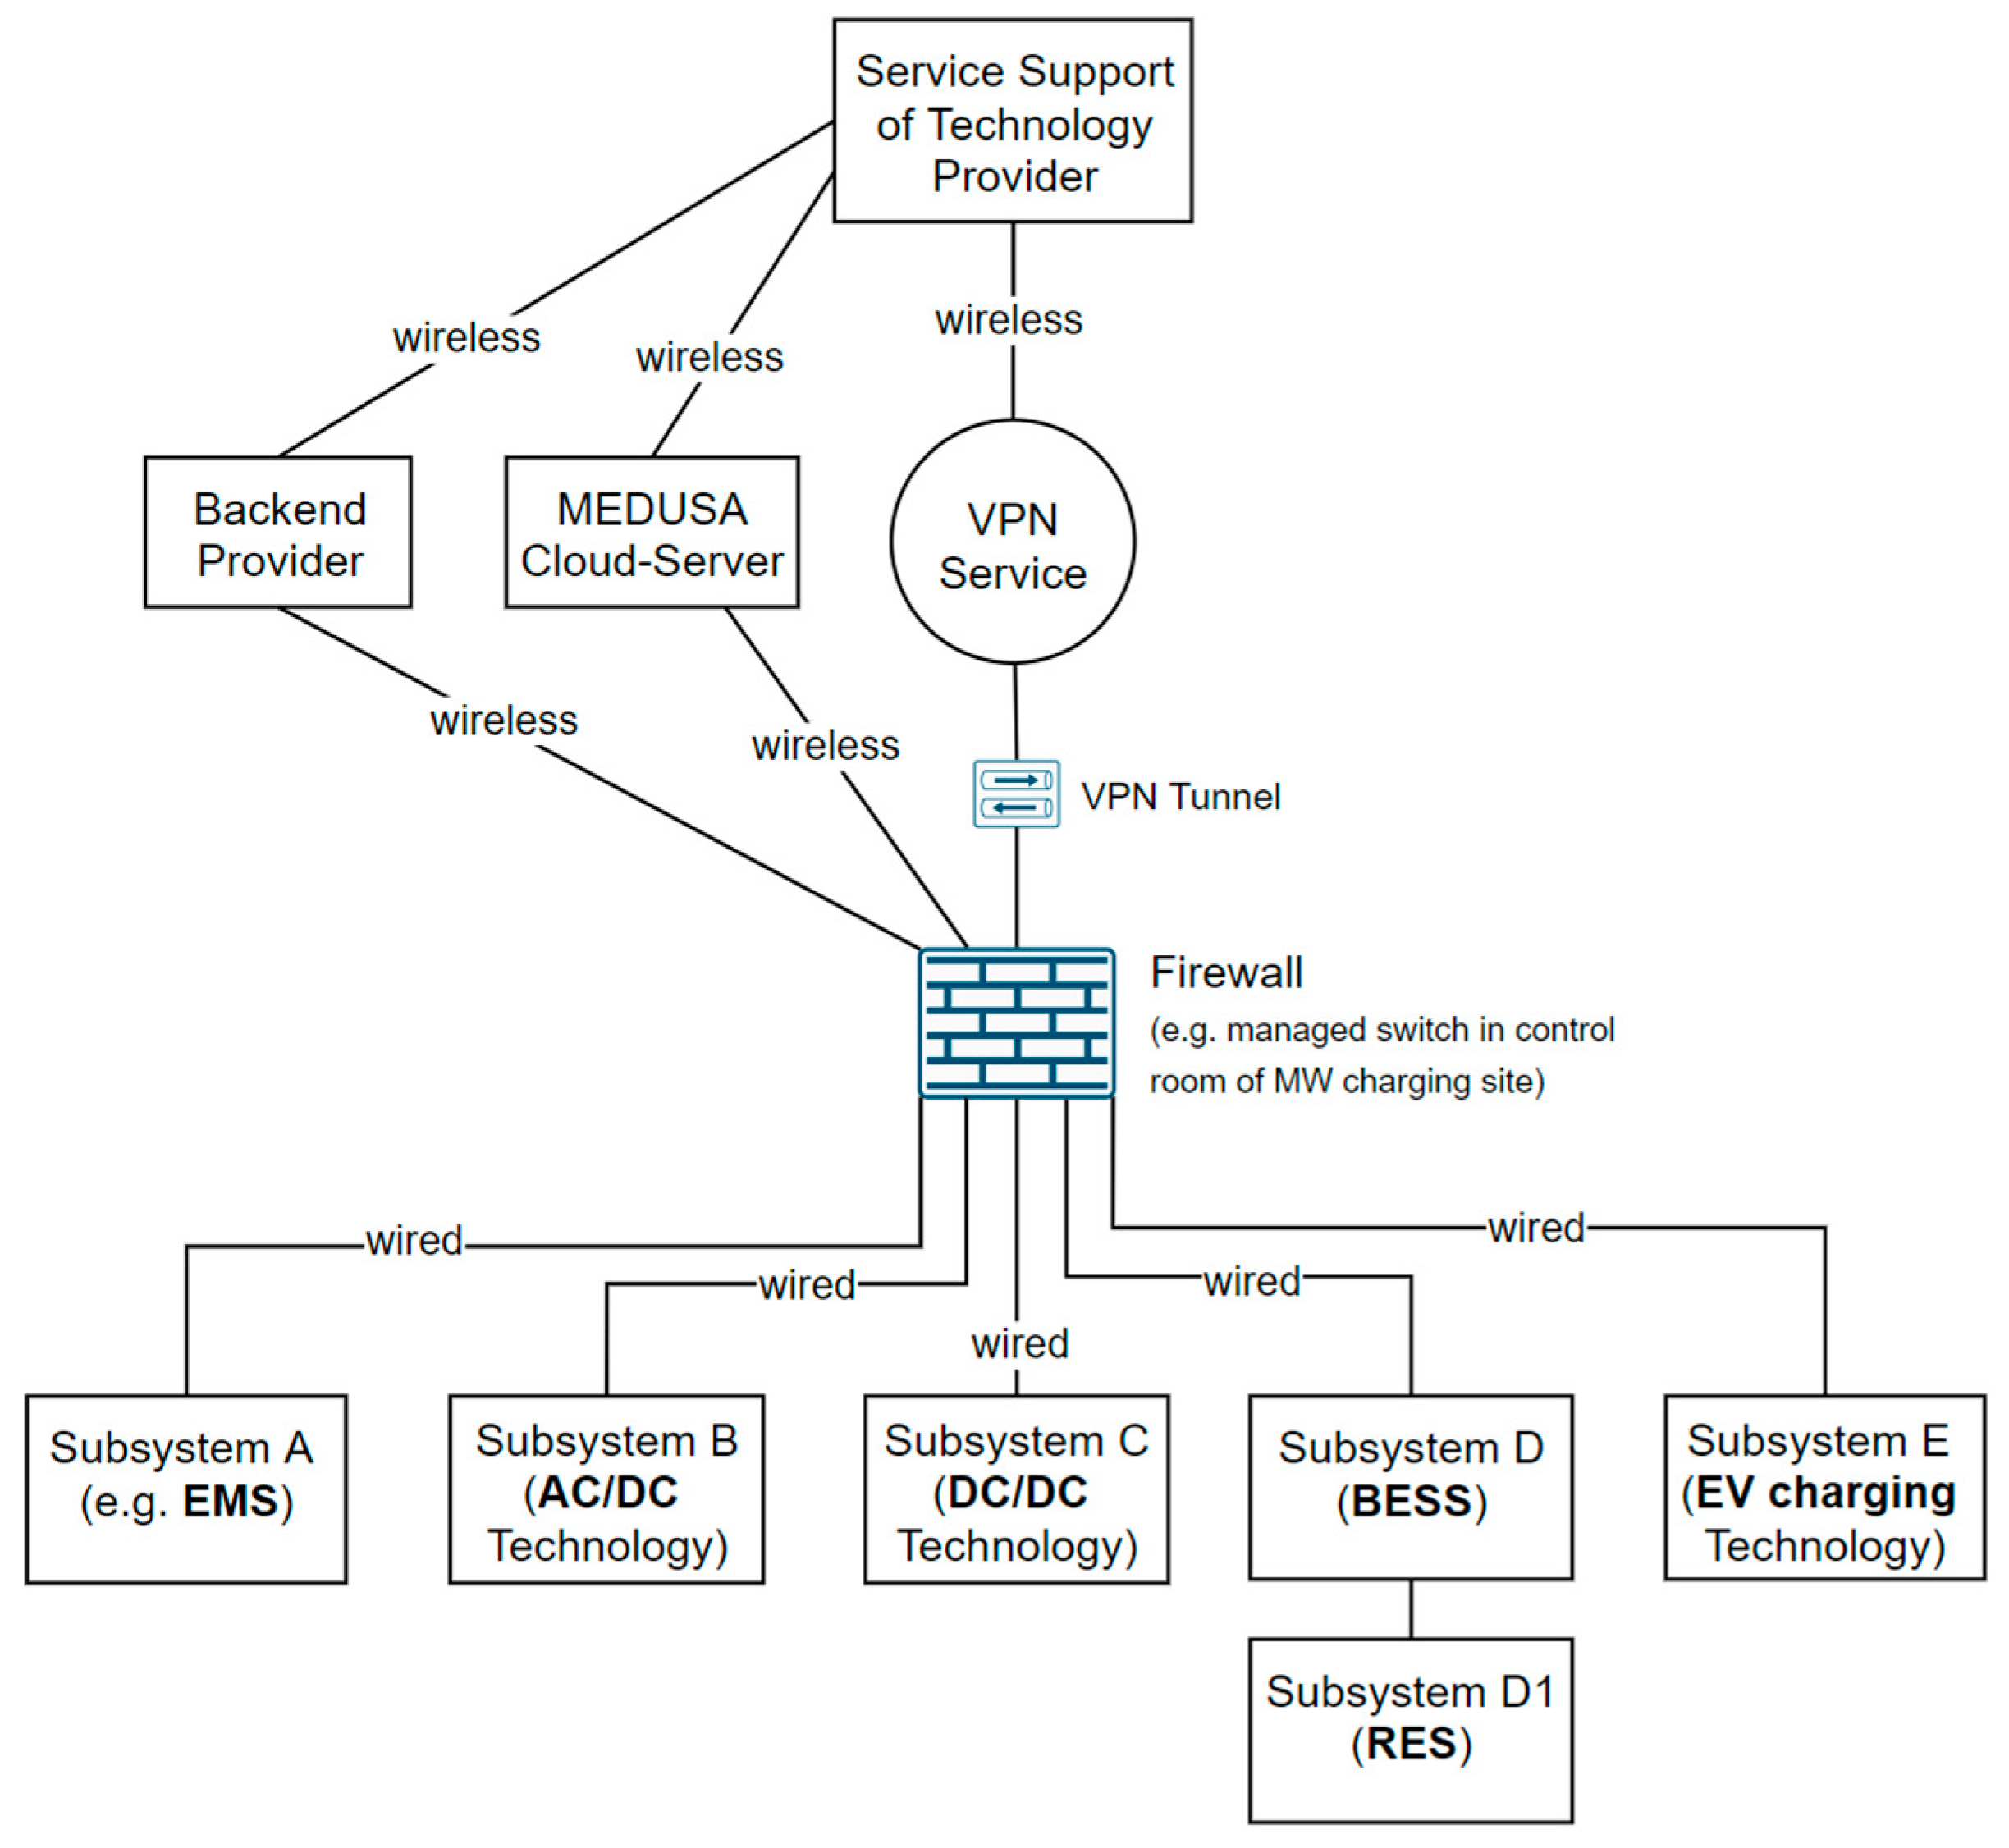
5.4. Cyber-Secure Remote Service Access

An essential component of the communication concept involves enabling secure wireless access for service and technical personnel from outside the plant. This access is crucial for specialists from technology providers responsible for subsystems to perform diagnostics and maintenance as needed. The need for such access is underscored by the operational demands observed in public EV charging stations, where the multitude of technologies increases the likelihood of system failures. While the EMS offers various analyses and intervention options, it is vital for specialists to have reliable and fast wireless connections to specific subsystems for effective fault analysis and correction. Equally important is the cybersecurity of this remote connection. With the increasing focus on electrifying heavy-duty trucks to reduce CO2 emissions, the charging infrastructure is becoming critical and potentially vulnerable to cyber-attacks. Therefore, robust network security measures are essential to protect the wireless interface from external threats. The network design must handle large volumes of data efficiently while ensuring secure, isolated access without compromising the overall plant’s network integrity. To address these needs, the proposed high-level network topology (see Figure 40) outlines a secure access framework for service personnel. This concept differentiates between wireless connections to higher-level information systems, such as the backend or MEDUSA cloud application, and wired connections within the plant. The secure access mechanism involves a hybrid approach using both wireless and wired connections, where only authorized individuals gain time-limited access to specific systems, adhering to network security protocols.
The process for external service access typically includes the following steps:
  • The megawatt charging station reports an anomaly through the SCADA system or requests support.
  • Operations Engineering contacts the relevant technology provider.
  • A time window is scheduled for external access to the subsystem.
  • The service provider connects via a VPN service.
  • The system allows an OpenVPN connection to this VPN service.
  • Each subsystem establishes a unique OpenVPN connection to the VPN service, with network settings configured to prevent connections to other system nodes.
  • The service provider accesses and performs maintenance on the subsystem’s firmware and software.
The network connection is monitored, with the option for Operations Engineering to terminate it if necessary. The feasibility and security of this concept are contingent upon expert evaluation. Extensive penetration testing and the establishment of technical specifications are critical for the assessment and validation of the network’s security.

6. Conclusions

In conclusion, this paper has presented an analysis of the key factors essential for the integration of multimegawatt fast chargers into medium-voltage distribution grids. The study presented the design of power electronics that are able to sustain the substantial power levels required for efficient EV charging, particularly for heavy-duty vehicles. A key focus has been the power electronics design guidelines for medium-voltage, medium-frequency-based chargers, which highlight the benefits of using modular architectures, such as solid-state transformers (SSTs) and dual active bridge (DAB) converters. These designs ensure high efficiency, scalability, and compactness while addressing the challenges of operating at medium voltage and high power. The integration of a single multimegawatt charging station into an MV network can be achieved without causing network violations; however, such an integration is constrained by the characteristics and capacities of the network components and connection points. Scalability scenarios reveal that increasing the number and nominal power of multimegawatt charging stations could lead to network violations. In such cases, network planning must include appropriate reinforcement measures to ensure that future scenarios can be implemented without jeopardizing the network’s safety and reliability. Additionally, the integration of renewable energy sources such as photovoltaic systems and battery energy storage solutions has been explored as a strategy to enhance grid stability and support sustainable charging solutions. While full self-sufficiency in charging stations remains impractical due to the large and often underutilized capacity required, the combination of grid-connected systems with optimized PV and BESS configurations could prove to be a more feasible approach. Furthermore, this paper highlights the challenges and benefits of communication protocols and the impact of these multimegawatt charging stations on grid infrastructure. By providing both technical and strategic guidelines, this paper aims to facilitate the development and deployment of next-generation fast charging stations, facilitating the transition toward electric mobility while ensuring grid reliability and environmental sustainability.

Author Contributions

Conceptualization, M.M., S.B., C.K.G., D.S., Y.W. and B.H.; methodology, M.M., S.B., C.K.G., Y.W. and B.H.; software, C.K.G., D.S., Y.W.; validation, M.M., S.B., D.S., Y.W., and B.H.; formal analysis, M.M., S.B., Y.W., C.K.G. and B.H.; writing—original draft preparation, M.M., S.B., C.K.G., D.S., Y.W. and B.H.; writing—review and editing, S.B., C.K.G., and B.H.; visualization, M.M., S.B., C.K.G., D.S., Y.W. and B.H., project administration, M.M.; funding acquisition, M.M. All authors have read and agreed to the published version of the manuscript.

Funding

This work is part of the MEDUSA-Multimegawatt Medium Voltage Megawatt Fast Charging—Phase 1 and MEDUSA—Multimegawatt Medium Voltage Megawatt Fast Charging—DC Megacharger project and is funded by the Zero Emission Mobility program under FFG grant 885053 and FO999910318 [25].

Data Availability Statement

The original contributions presented in the study are included in the article, further inquiries can be directed to the corresponding author/s.

Acknowledgments

We would like to express our gratitude to EnerCharge GmbH for their valuable contributions to this work. Their expertise and support in developing the communication systems concept within the modular charging system (MCS) and the energy management system (EMS), including the central monitoring and control unit and remote service access, were instrumental to the successful execution of this project. Their collaboration greatly enhanced the technical aspects of our research, and we appreciate their dedication and commitment to innovation.

Conflicts of Interest

The authors declare no conflicts of interest.

References

  1. Wang, L.; Qin, Z.; Slangen, T.; Bauer, P.; van Wijk, T. Grid Impact of Electric Vehicle Fast Charging Stations: Trends, Standards, Issues and Mitigation Measures-An Overview. IEEE Open J. Power Electron. 2021, 2, 56–74. [Google Scholar] [CrossRef]
  2. Fastned. Available online: https://fastnedcharging.com/hq/why-fast-charging-stations-are-good-for-the-grid/ (accessed on 21 August 2024).
  3. Yuan, N.; Yu, Z.; Zhang, Y.; Chang, H.; Kang, H. Review of Electric Vehicle Ultra-Fast DC Charging Station. In Proceedings of the 2022 7th Asia Conference on Power and Electrical Engineering (ACPEE), Hangzhou, China, 15–17 April 2022. [Google Scholar]
  4. Statistics Austria. 22 February 2024. Available online: https://www.statistik.at/fileadmin/announcement/2024/02/20240222KfzBestand2023EN.pdf (accessed on 21 August 2024).
  5. Statistics Austria. July 2023. Available online: https://austriatech.at/assets/Uploads/Publikationen/PDF-Dateien/OLE_ZDF_2023_July_EN.pdf (accessed on 21 August 2023).
  6. Makoschitz, M. Key aspects to enable multi-megawatt fast charging. In e & i Elektrotechnik und Informationstechnik; Springer: Berlin/Heidelberg, Germany, 2022; pp. 435–448. [Google Scholar]
  7. Makoschitz, M. Multi-megawatt charging to foster the mobility transition. In e & i Elektrotechnik und Informationstechnik; Springer: Berlin/Heidelberg, Germany, 2022; pp. 734–736. [Google Scholar]
  8. Evzelman, M.; Zeltser, I.; Ben-Yaakov, S. DSP control of Gyrator-behaved switch mode converter. In Proceedings of the EDERS 2008: European DSP Education & Research Symposium, Tel-Aviv, Israel, 18 June 2008; pp. 249–256. [Google Scholar]
  9. IEC 60076-3:2013; Power Transformers—Part 3: Insulation Levels, Dielectric Tests and External Clearances in Air. International Electrotechnical Commission: Geneva, Switzerland, 2013.
  10. Stahleder, D. EVPP-Electric Vehicle Car Park Peak Power Tool, Austrian Institute of Technology (AIT) GmbH, 2021. Available online: https://evpp.ait.ac.at/ (accessed on 22 February 2022).
  11. Stahleder, D.; Ubermasser, S.; Reihs, D.; Ledinger, S.; Lehfuss, F. Electric Vehicle Car Park Charging Simultaneity and Grid Connection Power Requirement Analysis. In Proceedings of the CIRED 2021—The 26th International Conference and Exhibition on Electricity Distribution, Online Conference, 20–23 September 2021. [Google Scholar]
  12. Synthetic Load Profiles. APCS-Power Clearing & Settlement. Available online: https://www.apcs.at/de/clearing/technisches-clearing/lastprofile (accessed on 2 November 2022).
  13. DIgSilent Power System Solutions. Available online: https://www.digsilent.de/en/powerfactory.html (accessed on 22 May 2023).
  14. Kapeller, J. zenoodo. 20 May 2021. Available online: https://zenodo.org/record/4774837#.YqnvMqHP3-h (accessed on 15 June 2022).
  15. Hub. European Commision-EU Science, PVGIS Photovoltaic Geographical Information System. Available online: https://joint-research-centre.ec.europa.eu/pvgis-photovoltaic-geographical-information-system_en (accessed on 21 September 2023).
  16. Forrest, J.; Vigerske, S.; Hafer, L.; Ralphs, T.; jpfasano; Saltzman, M.; Santos, H.G.; Hunsaker, B.; Willem, J.; tobiasachterberg; et al. Coin-or/cbc: Version 2018. Available online: https://zenodo.org/records/7820231 (accessed on 18 January 2022).
  17. CharIN. Megawatt Charging System. Available online: https://www.charin.global/technology/mcs/ (accessed on 3 June 2023).
  18. CharIN. White Paper Megawatt Charging System Recommendations and Requirements for MCS Related Standards Bodies and Solution Supplies. Available online: https://www.charin.global/media/pages/technology/knowledge-base/c708ba3361-1670238823/whitepaper_megawatt_charging_system_1.0.pdf (accessed on 30 June 2023).
  19. ISO 15118-20:2022; Road Vehicles—Vehicle to Grid Communication Interface—Part 20: 2nd Generation Network Layer and Application Layer Requirements. International Organization for Standardization: Geneva, Switzerland, 2022.
  20. ISO 15118:2019; Road Vehicles—Vehicle to Grid Communication Interface. International Organization for Standardization: Geneva, Switzerland, 2019.
  21. IEC 61851-24:2014; Electric Vehicle Conductive Charging System—Part 24: Digital Communication between a d.c. EV Charging Station and Electric Vehicle for Control of d.c. Charging. International Electrotechnical Commission: Geneva, Switzerland, 2014.
  22. Control. Available online: https://www.e-control.at/documents/1785851/1811582/TOR_Verteilernetzanschluss_-_Niederspannung_V1.2.pdf (accessed on 15 May 2023).
  23. OCPP 2.0.1. Open Charge Point Protocol. Open Charge Alliance. 2020. Available online: https://openchargealliance.org/protocols/open-charge-point-protocol/ (accessed on 15 May 2023).
  24. EEBUS. Communication Standards for Smart Energy Management. Available online: https://www.eebus.org/ (accessed on 22 August 2024).
  25. MEDUSA-Multi-Megawatt Medium Voltage Megawatt Fast Charging-Phase 1. Available online: https://projekte.ffg.at/projekt/4032453 (accessed on 22 August 2024).
Figure 1. A medium-voltage transformer connected to the grid, followed by a low-voltage converter stage.
Wevj 15 00450 g001
Figure 2. MMC-based multimegawatt fast charging topology.
Wevj 15 00450 g002
Figure 3. A multimegawatt charging system based on a medium-voltage rectifier with a dedicated solid-state transformer.
Wevj 15 00450 g003
Figure 4. Medium-voltage fast charging infrastructure based on a medium-voltage rectifier followed by a solid-state transformer [7].
Wevj 15 00450 g004
Figure 5. Primary design concept of a medium-volage SST based on multiple DAB modules.
Wevj 15 00450 g005
Figure 6. Power transfer between two voltage sources.
Wevj 15 00450 g006
Figure 7. Schematic diagram of a single-phase dual active bridge DCDC converter.
Wevj 15 00450 g007
Figure 8. Superposition of non-isolated DAB inductor current.
Wevj 15 00450 g008
Figure 9. Average currents through the inductor at 0° phase shift cancel each other out.
Wevj 15 00450 g009
Figure 10. Average current through the inductor at ϕ > 0°. An average current is built up.
Wevj 15 00450 g010
Figure 11. Waveform of the isolated dual active bridge converter.
Wevj 15 00450 g011
Figure 12. 50 kVA 50 kHz medium-voltage transformer.
Wevj 15 00450 g012
Figure 13. Transformer sample with blue insulating putty.
Wevj 15 00450 g013
Figure 14. Insulation failure at 16 kVrms due to air voids.
Wevj 15 00450 g014
Figure 15. Test of transformer insulating material at 70 kV for 1 min.
Wevj 15 00450 g015
Figure 16. Isolation failure of 2nd test sample.
Wevj 15 00450 g016
Figure 17. Prototype setup of a single-phase dual active bridge.
Wevj 15 00450 g017
Figure 18. Active Miller clamp and overcurrent protection of UCC21732.
Wevj 15 00450 g018
Figure 19. Controller signal flow diagram of the DAB.
Wevj 15 00450 g019
Figure 20. Block diagram of the auxiliary power supply.
Wevj 15 00450 g020
Figure 21. Schematic diagram of a SIPO configuration.
Wevj 15 00450 g021
Figure 22. Possible test setup of the signal-phase DAB configuration and SIPO configuration.
Wevj 15 00450 g022
Figure 23. Gate signals of primary- and secondary-side MOSFETs with phase shift.
Wevj 15 00450 g023
Figure 24. Drain-source voltages of primary- and secondary-side MOSFETs.
Wevj 15 00450 g024
Figure 25. Transformer primary (yellow waveform) and secondary (blue waveform) current.
Wevj 15 00450 g025
Figure 26. Overview of the EVPP fleet simulation process [10].
Wevj 15 00450 g026
Figure 27. Summary of simulation methodology.
Wevj 15 00450 g027
Figure 28. Minimum network voltage for a connected 1 MW charging station.
Wevj 15 00450 g028
Figure 29. Maximum line loading for a connected 1 MW charging station.
Wevj 15 00450 g029
Figure 30. Maximum transformer loading for a connected 1 MW charging station.
Wevj 15 00450 g030
Figure 31. Minimum network voltage with increase in the charging station’s nominal power.
Wevj 15 00450 g031
Figure 32. Maximum line and transformer loading with an increase in nominal power.
Wevj 15 00450 g032
Figure 33. Maximum line and transformer loading with an increase in nominal power of charging stations at the strongest node.
Wevj 15 00450 g033
Figure 34. Minimum network voltage with an increase in the number of connected charging stations.
Wevj 15 00450 g034
Figure 35. Maximum line and transformer loading with an increase in the number of connected charging stations.
Wevj 15 00450 g035
Figure 36. Percentage of self-sufficiency for the different scenarios under investigation.
Wevj 15 00450 g036
Figure 37. Example of a peak-shaving BESS system with no PV charging from the grid over time for the “business urban” scenario. Top: No BESS; bottom: peak shaving using a BESS. The battery is pre-charged from the grid (red circles) to help reduce the peak when EVs are charging.
Wevj 15 00450 g037
Figure 38. High-level communication interfaces of an MCS.
Wevj 15 00450 g038
Figure 39. High-level communication concept.
Wevj 15 00450 g039
Figure 40. High-level network proposal for remote service access related to the communication concept.
Wevj 15 00450 g040
Table 1. Transformer specifications.
SpecificationRating
Total output power50 kVA
Operating frequency50 kHz
Input voltage2500 V
Turns ratio5:3
Primary current37 A
Secondary current61 A
Primary side leakage inductance125 µH
Secondary side leakage inductance45 µH
Isolation coordinate acc IEC60676-370 kV for 1 min
Table 2. Key converter specifications.
ParameterSpecification of Individual DAB ModuleSpecification of the SIPO DAB Module
Total output power50 kW100 kW
PWM switching frequency50 kHz50 kHz
Input voltage range2000 V–2500 V4000 V–5000 V
Secondary output current61 A120 A
Power density--
Ripple voltage<5%<5%
Isolation coordinate IEC60676-370 kV for 1 min70 kV for 1 min
Table 3. Overview of the characteristics of the electric vehicle charging profile.
ParameterBusiness PremisesMotorway
AreaRural, urban, and suburbanHeavily frequented Austrian motorway service area in Guntramsdorf
Average daily mileage1060 km (weekdays)
840 km (Saturdays)
1060 km (weekday)
840 km (Saturdays)
Maximum charging power1 MW1 MW
Parking duration2 h1 h
Battery state-of-charge threshold for plugging30% with a standard deviation of 15%30% with a standard deviation of 15%
Arrival timeStatistical arrival time distribution function based on a large Austrian mobility surveyStatistical arrival time distribution function extracted from publicly available data
Table 4. Spare load capacities of the selected nodes in each network.
Voltage LevelNetworkBusesLowest Spare Load Capacity (MW)Highest Spare Load Capacity (MW)
10 kVNetwork 1401.314.10
Network 21001.699.52
Network 3302.535.98
20 kVNetwork 43003.165.20
Network 55101.7625.15
Network 64903.347.35
Network 72703.2813.44
Network 81602.0430.20
30 kVNetwork 92102.6411.12
Network 101405.2816.38
Network 11707.1317.41
Table 5. Overview of the potential CO2 savings for the motorway scenario.
Motorway
Peak Shaving: 80%
Motorway
Peak Shaving: 66%
PV Size [kWp]Grid Consumption Savings [MWh]Grid Feed in [MWh]CO2 Savings
[t]
Grid Consumption Savings
[MWh]
Grid Feed in [MWh]CO2 Savings [t]
1000392837246474694234
200052621025266011868494
300058134358036533161763
4000Not evaluated70943861019
Battery size [kWh]10001600
Table 6. Approx. savings vs. investment costs for the BESSs without a PV system and assuming a converter size of 1000 kW.
ScenarioPeak Shaving
[%]
Electrical Grid Costs without Peak Shaving
[k€]
Electrical Grid Costs with Peak Shaving
[k€]
Savings
[k€]
BESS Size [kWh]Approx. Investment Cost [k€]
Business urban80−226−200252100−998
66−225−182443600−1710
Business suburban 80−234−210252900−1378
66−234−191434900−2328
Motorway 80−198−171261000−475
66−198−152461600−760
Table 7. Approx. savings vs. investment cost for the different BESS sizes and different scenarios.
ScenarioBusiness UrbanBusiness SuburbanMotorway
Peak Shaving [%]806680668066
PV size [kWp]Savings [k€]Invest [−k€]Savings [k€]Invest [−k€]Savings [k€]Invest [−k€]Savings [k€]Invest [−k€]Savings [k€]Invest [−k€]Savings [k€]Invest [−k€]
100088254710934389030221114209991894992250
2000136384715647381404322162550914231941423550
3000180514720060381845622205680918444941844850
40002236447241733822769222458109 2246150
5000 279863827082222879409
60003219938 32810,709
7000 Not evaluated36812,009Not evaluated
BESS size [kWh]262545003625612512502000
Disclaimer/Publisher’s Note: The statements, opinions and data contained in all publications are solely those of the individual author(s) and contributor(s) and not of MDPI and/or the editor(s). MDPI and/or the editor(s) disclaim responsibility for any injury to people or property resulting from any ideas, methods, instructions or products referred to in the content.

