Abstract
In a simulation study, it was investigated how the costs of supplying H2 for the refuelling of long-haul trucks along highways in Canada can be minimized by optimizing the design of the refuelling infrastructure. Scenarios using local or centralized blue H2 production were evaluated using two different modes of H2 transportation (liquid H2 tanker trucks and pipelines). For each scenario, the average H2 supply costs were determined considering H2 production costs from facilities of different sizes and transportation costs for H2 that was not produced locally. Average H2 supply costs were 2.83 CAD/kg H2 for the scenario with local H2 production at each refuelling site, 3.22–3.27 CAD/kg H2 for scenarios using centralized H2 production and tanker truck transportation, and 2.92–2.96 CAD/kg H2 for centralized H2 production scenarios with pipeline transportation. Optimized scenarios using the cheaper transportation option (tanker truck or pipeline) for each highway segment had average H2 supply costs (2.82–2.88 CAD/kg H2) similar to those of using only local H2 production, with slightly lower costs for the scenario using the largest H2 production volumes. Follow-on research is recommended to include the impact of CO2 transportation (from blue H2 production) on the design of an optimum supply infrastructure.
Keywords:
long-haul trucks; hydrogen; infrastructure; simulation; tanker truck; pipeline; transportation cost 1. Introduction
Around 27% of global CO2 emissions come from the transportation sector, which makes it the second largest emitter [1]. Over the last decade, significant momentum has built for the electrification of passenger vehicles mainly using battery electric technology. However, the use of hydrogen (H2) as a transportation fuel has significant potential to support the transition towards a low carbon economy since it does not emit carbon at the end-use point of combustion, has good storage life, and it can be transported by roads, ships, or pipelines in gaseous or liquid forms [2].
To drastically reduce emissions and eliminate the use of diesel in the long-haul trucking sector, it is expected that H2 fuel cell vehicles will be needed as battery electric vehicles cannot provide the same utility as diesel vehicles. Significant studies have been conducted on different aspects of using hydrogen as a clean fuel for long-distance transportation.
- Kumar et al. developed a framework to analyze the supply chain cost of low-carbon hydrogen exports from Alberta, Canada, to several viable destinations in North America, the Asia–Pacific, and Europe [3]. The supply chain includes all unit operations ranging from hydrogen production with carbon capture and storage, hydrogen pipeline transportation, liquefaction, shipping, and regasification at the destinations. A techno-economic assessment has been conducted to estimate the supply chain cost of different viable pathways considering the energy, material, and capacity. Results show that within North America, transporting hydrogen blended with natural gas using the existing natural gas pipelines could reduce the price by 17%. Further cost savings around 28% were achieved while transporting ammonia to the Asia–Pacific in comparison to shipping liquified hydrogen. An analysis of overseas H2 supply chains has been conducted by Lim et al. considering the economic (unit H2 cost), environmental (carbon footprint), and technological aspects [4]. The supply chains include all the operations ranging from H2 production, ship transportation, to inland distribution. Several supply chains were compared varying the economies of scale, amount of H2, and distance. Results show that the use of liquid organic hydrogen carrier, liquid hydrogen, and ammonia are the most potentially feasible options for H2 carriers considering these criteria.
- Stolen et al. developed a well-to-tank analysis to calculate the costs, energy consumption, and greenhouse gas (GHG) emissions for supplying hydrogen to fuel cell electric vehicles (FCEVs) [5]. The study followed a holistic approach considering the whole supply chain that includes the storage and transportation of hydrogen. The study discussed different hydrogen infrastructure technologies from ecological and economic points of view. Compression and liquefaction have been mentioned as the state-of-the-art H2 technologies, whereas liquid organic hydrogen carrier (LOHC) has been identified as the most promising H2 technology for the near future from an economic perspective. However, further research is needed regarding the system design of the LOHC-supplied refuelling stations and the heat source for dehydrogenation.
- Barbir et al. considered a wide range of hydrogen refuelling station (HRS) capacities and configurations [6]. For example, locating the hydrogen production and refuelling station within an existing wind farm in Croatia or nearby the end users, or site the hydrogen production within the wind farm and install the refuelling station nearby the users, etc. The study assumed that hydrogen is delivered to the refuelling station with a tube trailer and when hydrogen was produced within the wind farm, a mobile refuelling station was used for consumers in different locations. The techno-economic analysis of each hydrogen refuelling station configuration was conducted to estimate the levelized cost of hydrogen production—the capital, operational, and maintenance costs. The study results show that, since the capacity and location of the hydrogen refuelling stations depend on the users, it was difficult to identify the optimum configuration without the hydrogen infrastructure development in Croatia. However, the authors mentioned that the results could play a significant role in the implementation of hydrogen infrastructure in Croatia in the near future.
- Hurskainen and Ihonen conducted a techno-economic assessment for point-to-point large-scale road transportation of hydrogen [7]. The researchers compared liquid organic hydrogen carriers (LOHC), compressed H2 gas delivery by trucks, and on-site production of hydrogen using water electrolysis. Results show that the LOHC supply chain was the most economic option for long-distance hydrogen transportation by road. However, to achieve economic feasibility, the heat supply method for releasing hydrogen at the end-user site and the investment costs were found as the most critical parameters to consider.
- Qing et al. assessed four possible low-carbon hydrogen supply chains for a hydrogen refuelling station located in Shanghai [8]. The study analyzed the feasibility of using renewable hydrogen as a transportation fuel for fuel cell vehicles. Two routes considered on-site hydrogen production powered by a stand-alone or grid-connected photovoltaic (PV)–wind generation system separately, whereas the other two routes considered off-site hydrogen supply. The off-site hydrogen is also produced by a stand-alone or grid-connected PV–wind generation system located in the Qinghai Province, since it is a rich renewable energy area. The H2 is then delivered to Shanghai by liquid hydrogen tanker trucks. The study found the off-site production supply chains as feasible options. The study mentioned transporting liquid hydrogen for long distance using trucks is more economical compared to transporting compressed gaseous hydrogen due to its higher energy density. Although this study was focused on H2 supply for passenger vehicles, the results would also apply to H2 supply for long-haul trucks.
- Kumar et al. conducted a process-based techno-economic assessment of hydrogen transportation pathways [9], Including, for example, pure hydrogen (hydrogen pipeline and truck transport of gaseous and liquified hydrogen), hydrogen–natural gas blends (pipeline), ammonia (pipeline), and liquid organic hydrogen carriers (pipeline and rail). The authors estimated the costs and GHG emissions for high-capacity long distance H2 transportation, such as 1000 km, 3000 km. Kumar et al. identified the hydrogen pipelines and hythane (hydrogen and natural gas blends) as the least expensive H2 transportation pathways for long distances [9]. The ammonia, liquid organic hydrogen carrier, and truck transportation pathways were found to be more than 1.5 times expensive than the pure H2 pipelines.
- The International Energy Agency (IEA) assessed the opportunities and issues related to different alternative H2 transportation options [10]. Pipeline and shipping options were discussed for long-distance H2 transport such as 1000, 2000, and 3000 km. The report also elaborated on local H2 distribution options such as trucks carrying gaseous H2, liquid H2, ammonia, and LOHC and pipelines with 100 tonnes per day and 500 tonnes per day capacities. H2 conversion and reconversion technologies are also considered in the study. The study identified pipeline H2 transportation to be the cheapest option for less than 1500 km distances compared to ammonia and LOHC, which were more cost effective for overseas H2 transportation over longer distances. For local distribution, pipelines with high capacity were referred to as more cost effective than tanker trucks for H2 transportation over longer distances [10].
The above-mentioned studies focused on different aspects of H2 used as a transportation fuel technology such as H2 production technologies, techno-economic assessments of low-cost hydrogen transportation, H2 export by overseas or inland routes, assessments of low carbon hydrogen exports from cheaper production locations like Canada, economic, technological, and environmental impacts of H2 supply chains, and on different storage technologies of H2. However, very few studies have been addressing the significance of the H2 refuelling infrastructure on the overall H2 supply chain from a cost perspective. Current H2 prices are far above the level needed for cost-effective operation of H2-based transportation. Cost reductions in every part of the H2 supply chain will be needed to realize a sustainable cost level.
This study investigated how costs in the supply of H2 for the refuelling of long-haul trucks along major highways in Canada can be minimized by optimizing the design of the supply infrastructure. Given the high cost of green hydrogen, this study focussed on the use of blue hydrogen, produced from natural gas with carbon capture. Scenarios of local and centralized blue H2 production were evaluated to investigate whether cost savings from centralized H2 production on a larger scale would outweigh the additional costs of H2 transportation to refuelling sites without H2 production. The study analyzed two pathways for H2 transportation: tanker trucks carrying liquid H2 and pipelines transporting gaseous H2. The study used state-of-the-art H2 transportation and refuelling infrastructure design parameters both for pipelines and tanker trucks.
First, scenarios that used one of the two transportation methods for all refuelling sites in the total network were analyzed. Then the relationship between H2 volume, transportation cost, and transportation distance were investigated, enabling the evaluation of optimized scenarios, which used the least cost transportation option (either tanker truck or pipeline, based on local conditions) for different refuelling sites along the highways.
2. Methodology
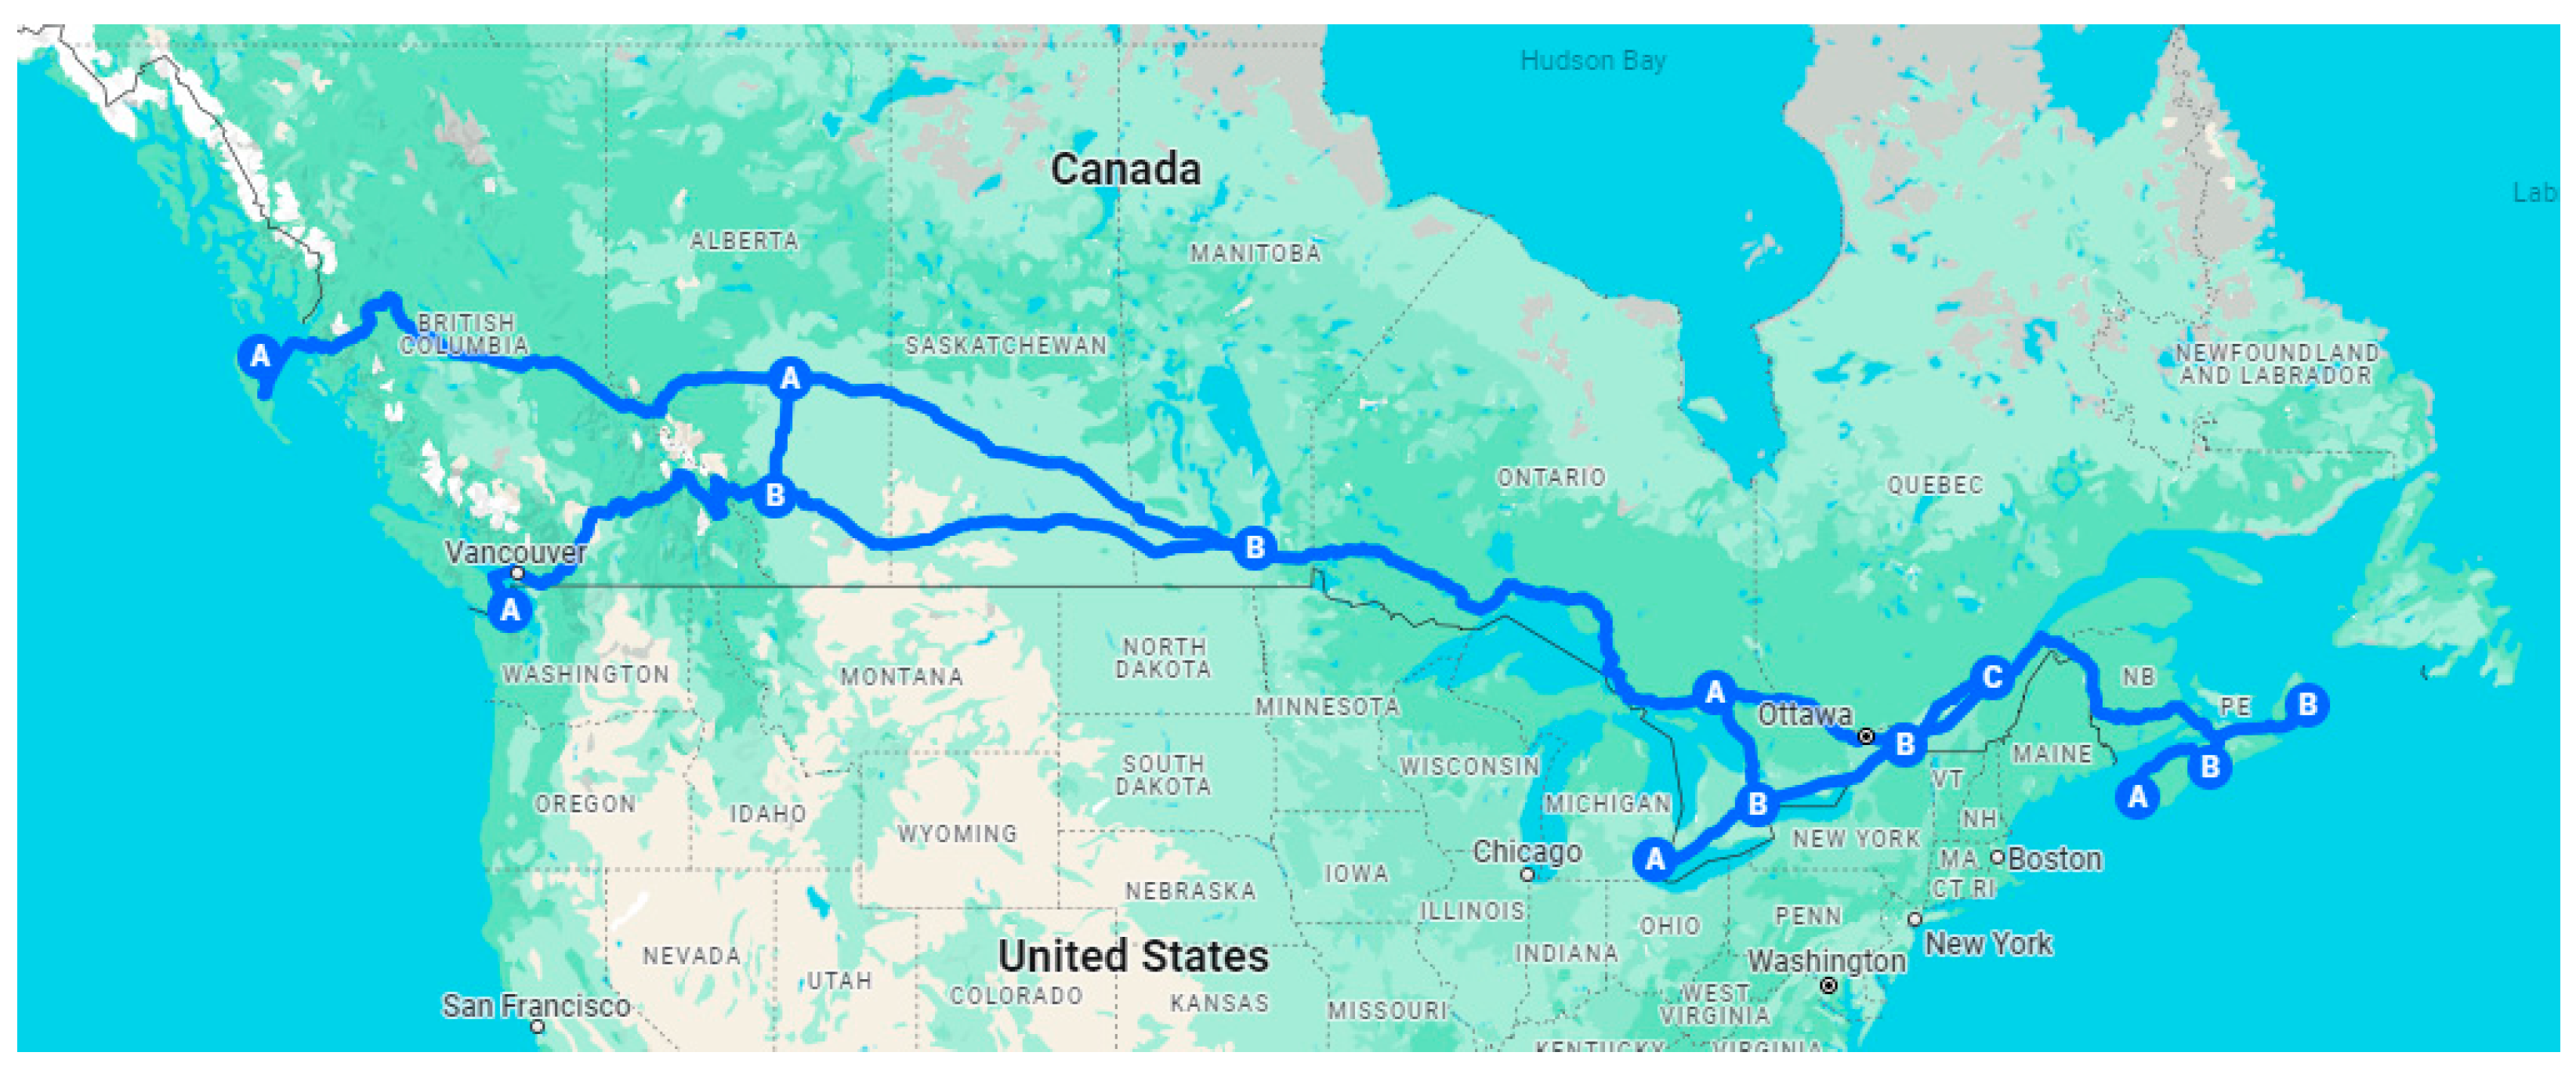
A simulation model was developed to estimate the H2 demand for heavy-duty long-haul trucks along major highways in Canada. Over 11,000 km of Canadian major highways were considered (see Figure 1). Data from provincial transportation authorities (like the Ontario Ministry of Transport) were used to estimate the annual average daily truck traffic (AADTT) flow for each of the highway segments, resulting in a large range in AADTT values from 500 trucks per day on more quiet highways to 17,000 trucks per day on the busiest segments. The model assumed that each highway segment should provide the H2 needed for all trucks that drive on that highway segment and for the total length of that segment.
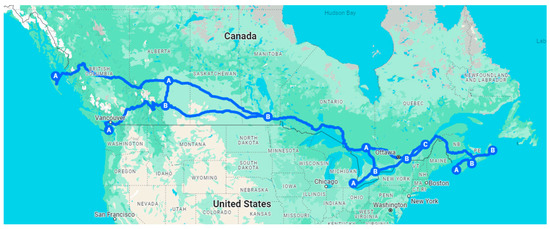
Figure 1.
Overview of major highways in Canada.
The required H2 production per highway segment was then calculated from the truck traffic kilometers driven on that segment and a fixed H2 consumption of 10 kg/100 km.
2.1. Hydrogen Refuelling Sites, Production Sites, and Pumps
To determine the number of H2 refuelling sites per highway, the highways were segmented based on the truck traffic flow. To minimize H2 transportation costs, production sites were co-located with refuelling sites. The standard distance between refuelling sites was assumed to be 100 km. However, the actual distance between refuelling sites on some highway sections was a bit shorter if the segment length was not exactly a multiple of 100 km. Given space constraints on truck rest stops, a maximum of 20 H2 pumps per refuelling site were allowed, requiring refuelling stations to be placed closer together on the busiest highway sections.
The number of refuelling sites for highway segment i, NR,i, was calculated using Equation (1):
in which Li is the length of highway segment i and Di the distance between H2 refuelling sites on that highway segment. Similarly, the number of H2 production sites for highway segment i, NP,i, was calculated:
with Rj being the number of refuelling sites supplied by a single production site in scenario j.
NR,i = Li/Di
NP,i = NR,i/Rj
2.2. Scenarios and Transportation Options
Different scenarios were developed to investigate the impact of the size of the H2 production facility on the amount of hydrogen that would need to be transported, the transportation distance, and on the costs to supply H2 to refuelling sites. Larger production sites were placed further apart, effectively increasing the number of refuelling sites that would be supplied by one production facility. Four scenarios were evaluated with a focus on identifying the potential to optimize the H2 supply to the refuelling infrastructure for long haul trucks:
- Scenario 1: Each refuelling site had its own production facility; hence, no transportation was required between production and refuelling stations. Production sites were about 100 km from each other.
- Scenario 2: Each production site supplied two refuelling sites (one of them being the co-located refuelling site), and the distance between production sites was around 200 km. Under this scenario, there were two times as many refuelling sites as production sites, requiring half of the total amount of H2 produced to be transported to a neighbouring refuelling site over 100 km distance (one-way) away.
- Scenario 3: Each production site supplied H2 to three refuelling sites, and there was generally one production site per 300 km of highway. With three times as many refuelling sites as production sites, two thirds of all refuelling sites needed to have their H2 transported from the neighbouring production site, which was placed at the middle location of the three refuelling sites. The H2 transportation distance was 100 km (one-way).
- Scenario 4: Each production site supplied five different refuelling sites, because production sites were placed about 500 km apart. Under this scenario, there were five times as many refuelling sites as production sites, requiring four fifths of all the H2 to be transported to neighbouring refuelling sites from the central H2 production station. On average, the H2 was transported over 150 km (one-way), as the distance to the closest refuelling sites was 100 km, and 200 km to the outer refuelling sites.
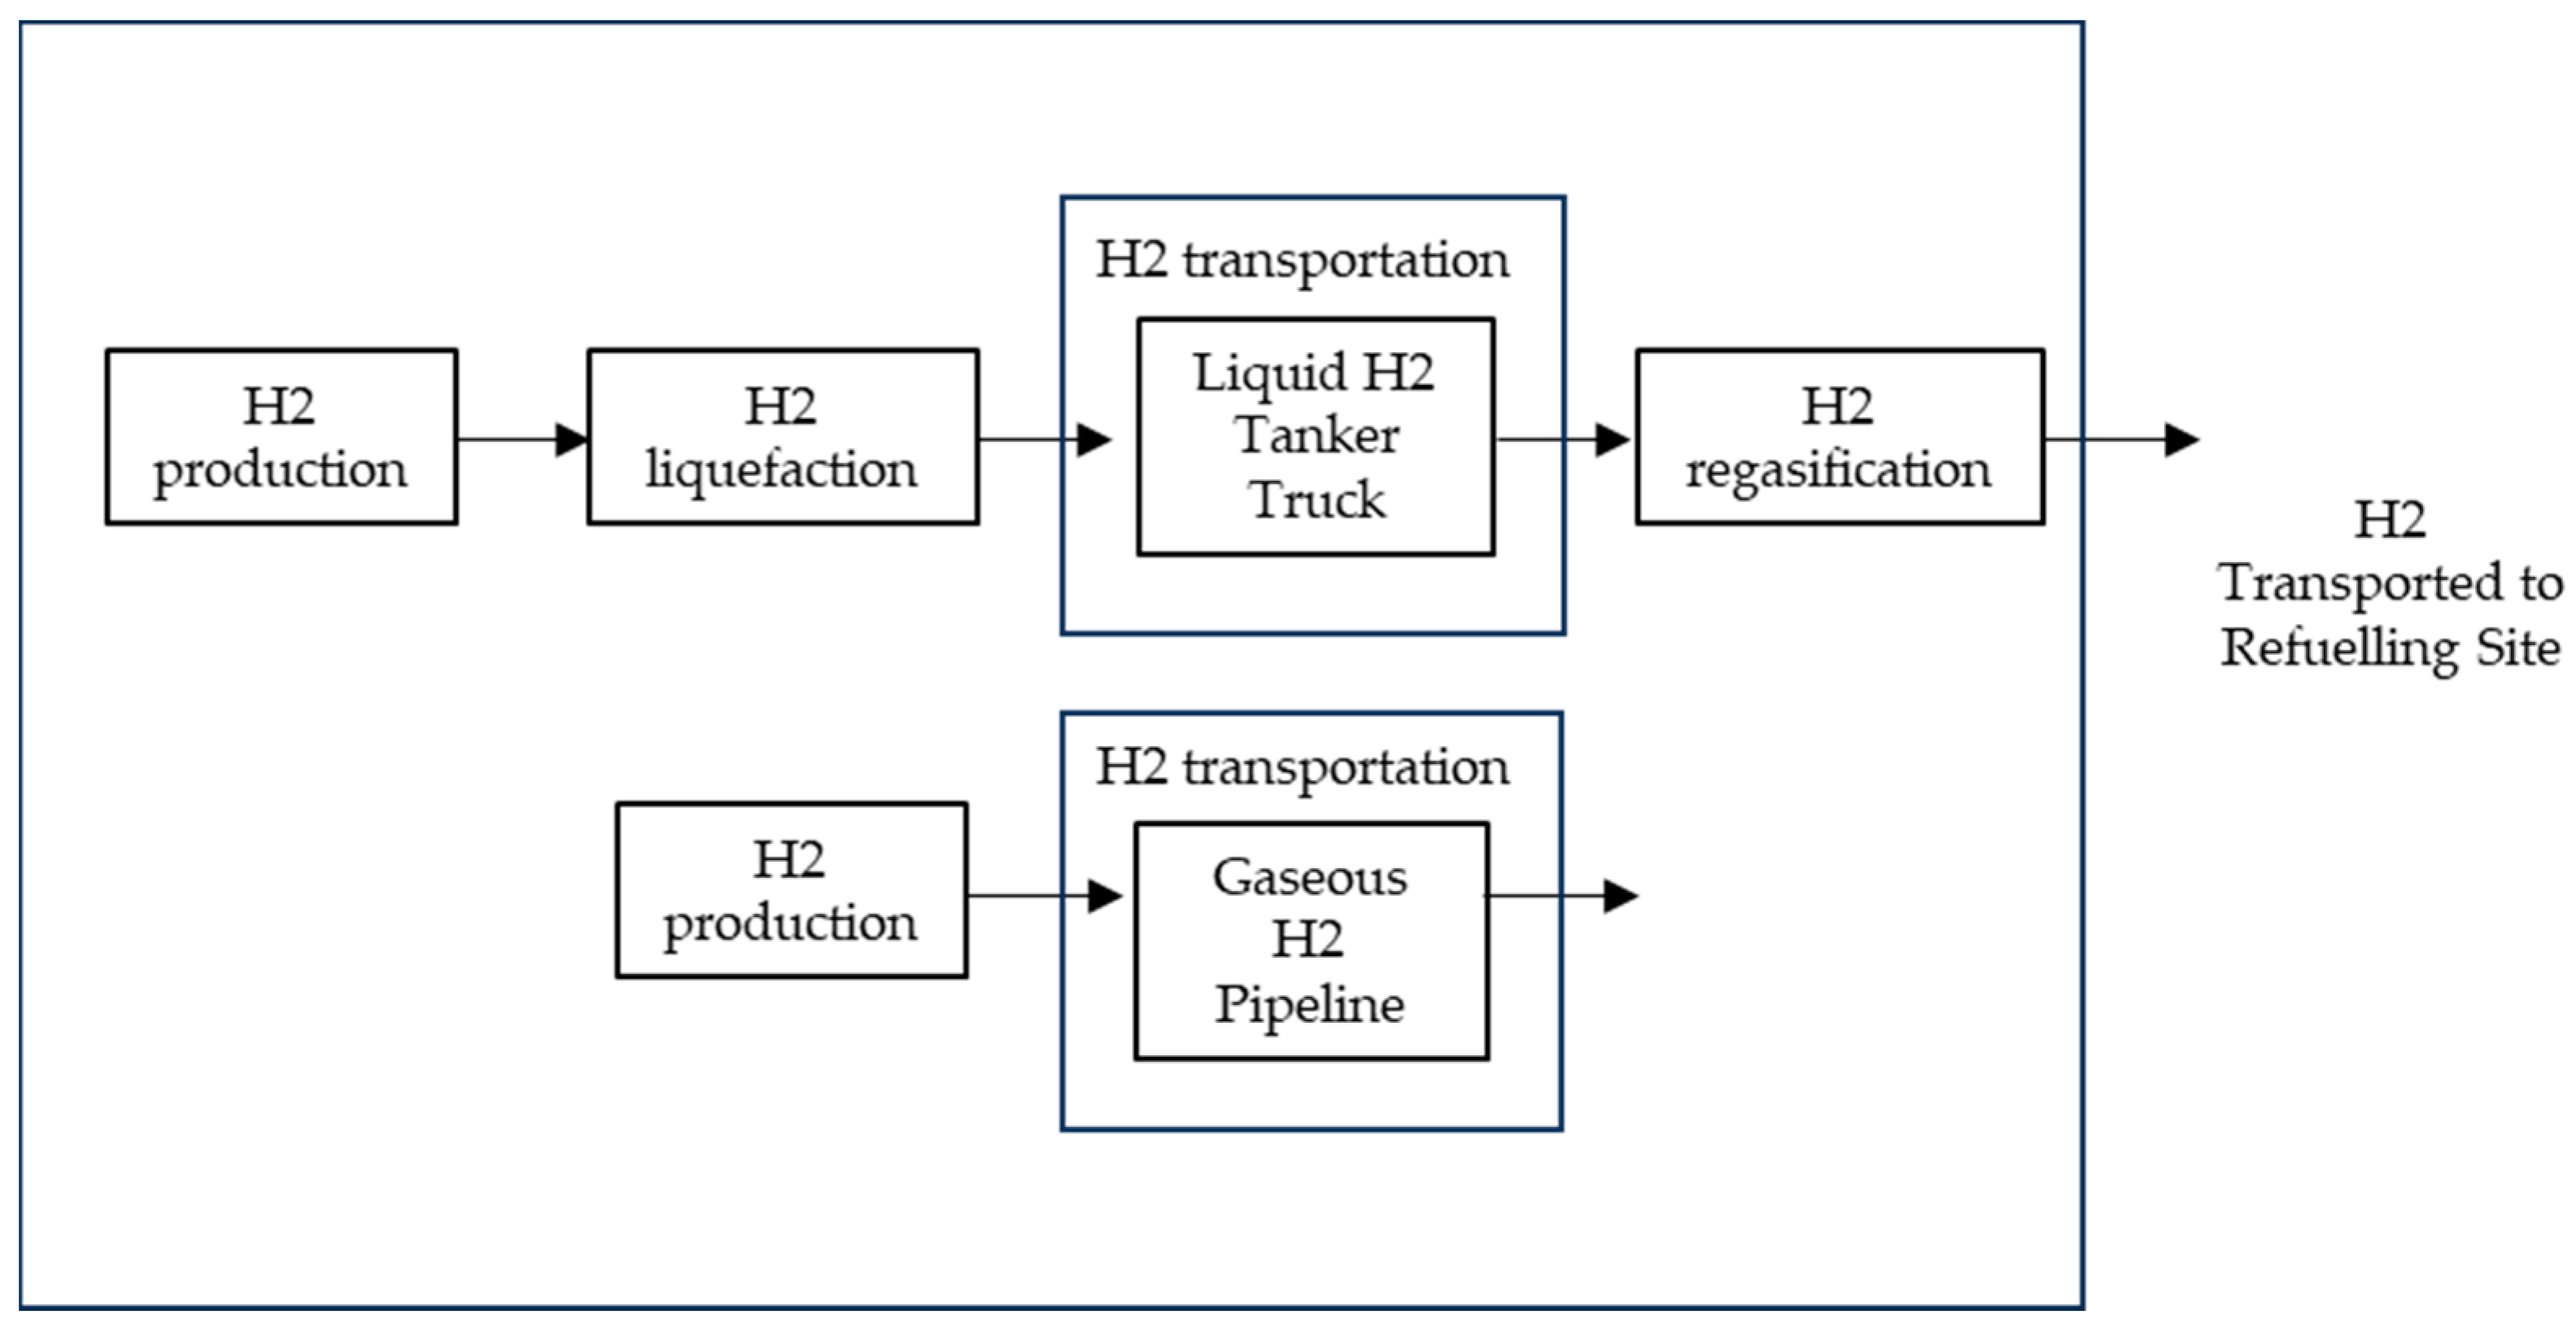
For each scenario of supplying H2 to a network of refuelling sites under Scenarios 2–4, two transportation variants were evaluated: tanker trucks and pipelines. The unit operations considered in the tanker truck pathway included production, liquefaction, transportation, and regasification, while the pipeline pathway considered production and transportation (see Figure 2). The unit operations are explained in detail in Section 2.3.1 and Section 2.3.2. For clarity, Scenario 1 does not use either of these pathways, because all H2 is produced locally at each refuelling site.
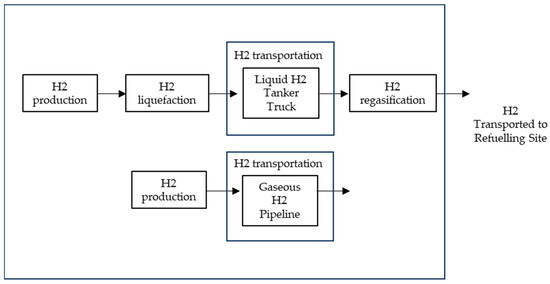
Figure 2.
Unit operations for two pathways of H2 supplying H2 to refuelling sites using different transportation methods: tanker trucks (top) and pipelines (bottom).
2.3. Hydrogen Production Cost and Transportation Costs
In the economic analysis, the total costs to supply H2 to the refuelling sites were calculated as the sum of the production costs and the transportation costs.
TCH = CP + CT
Here, TCH, CP, and CT are the total H2 supply cost, the H2 production costs, and the costs for transportation of H2 from production to the refuelling sites, respectively.
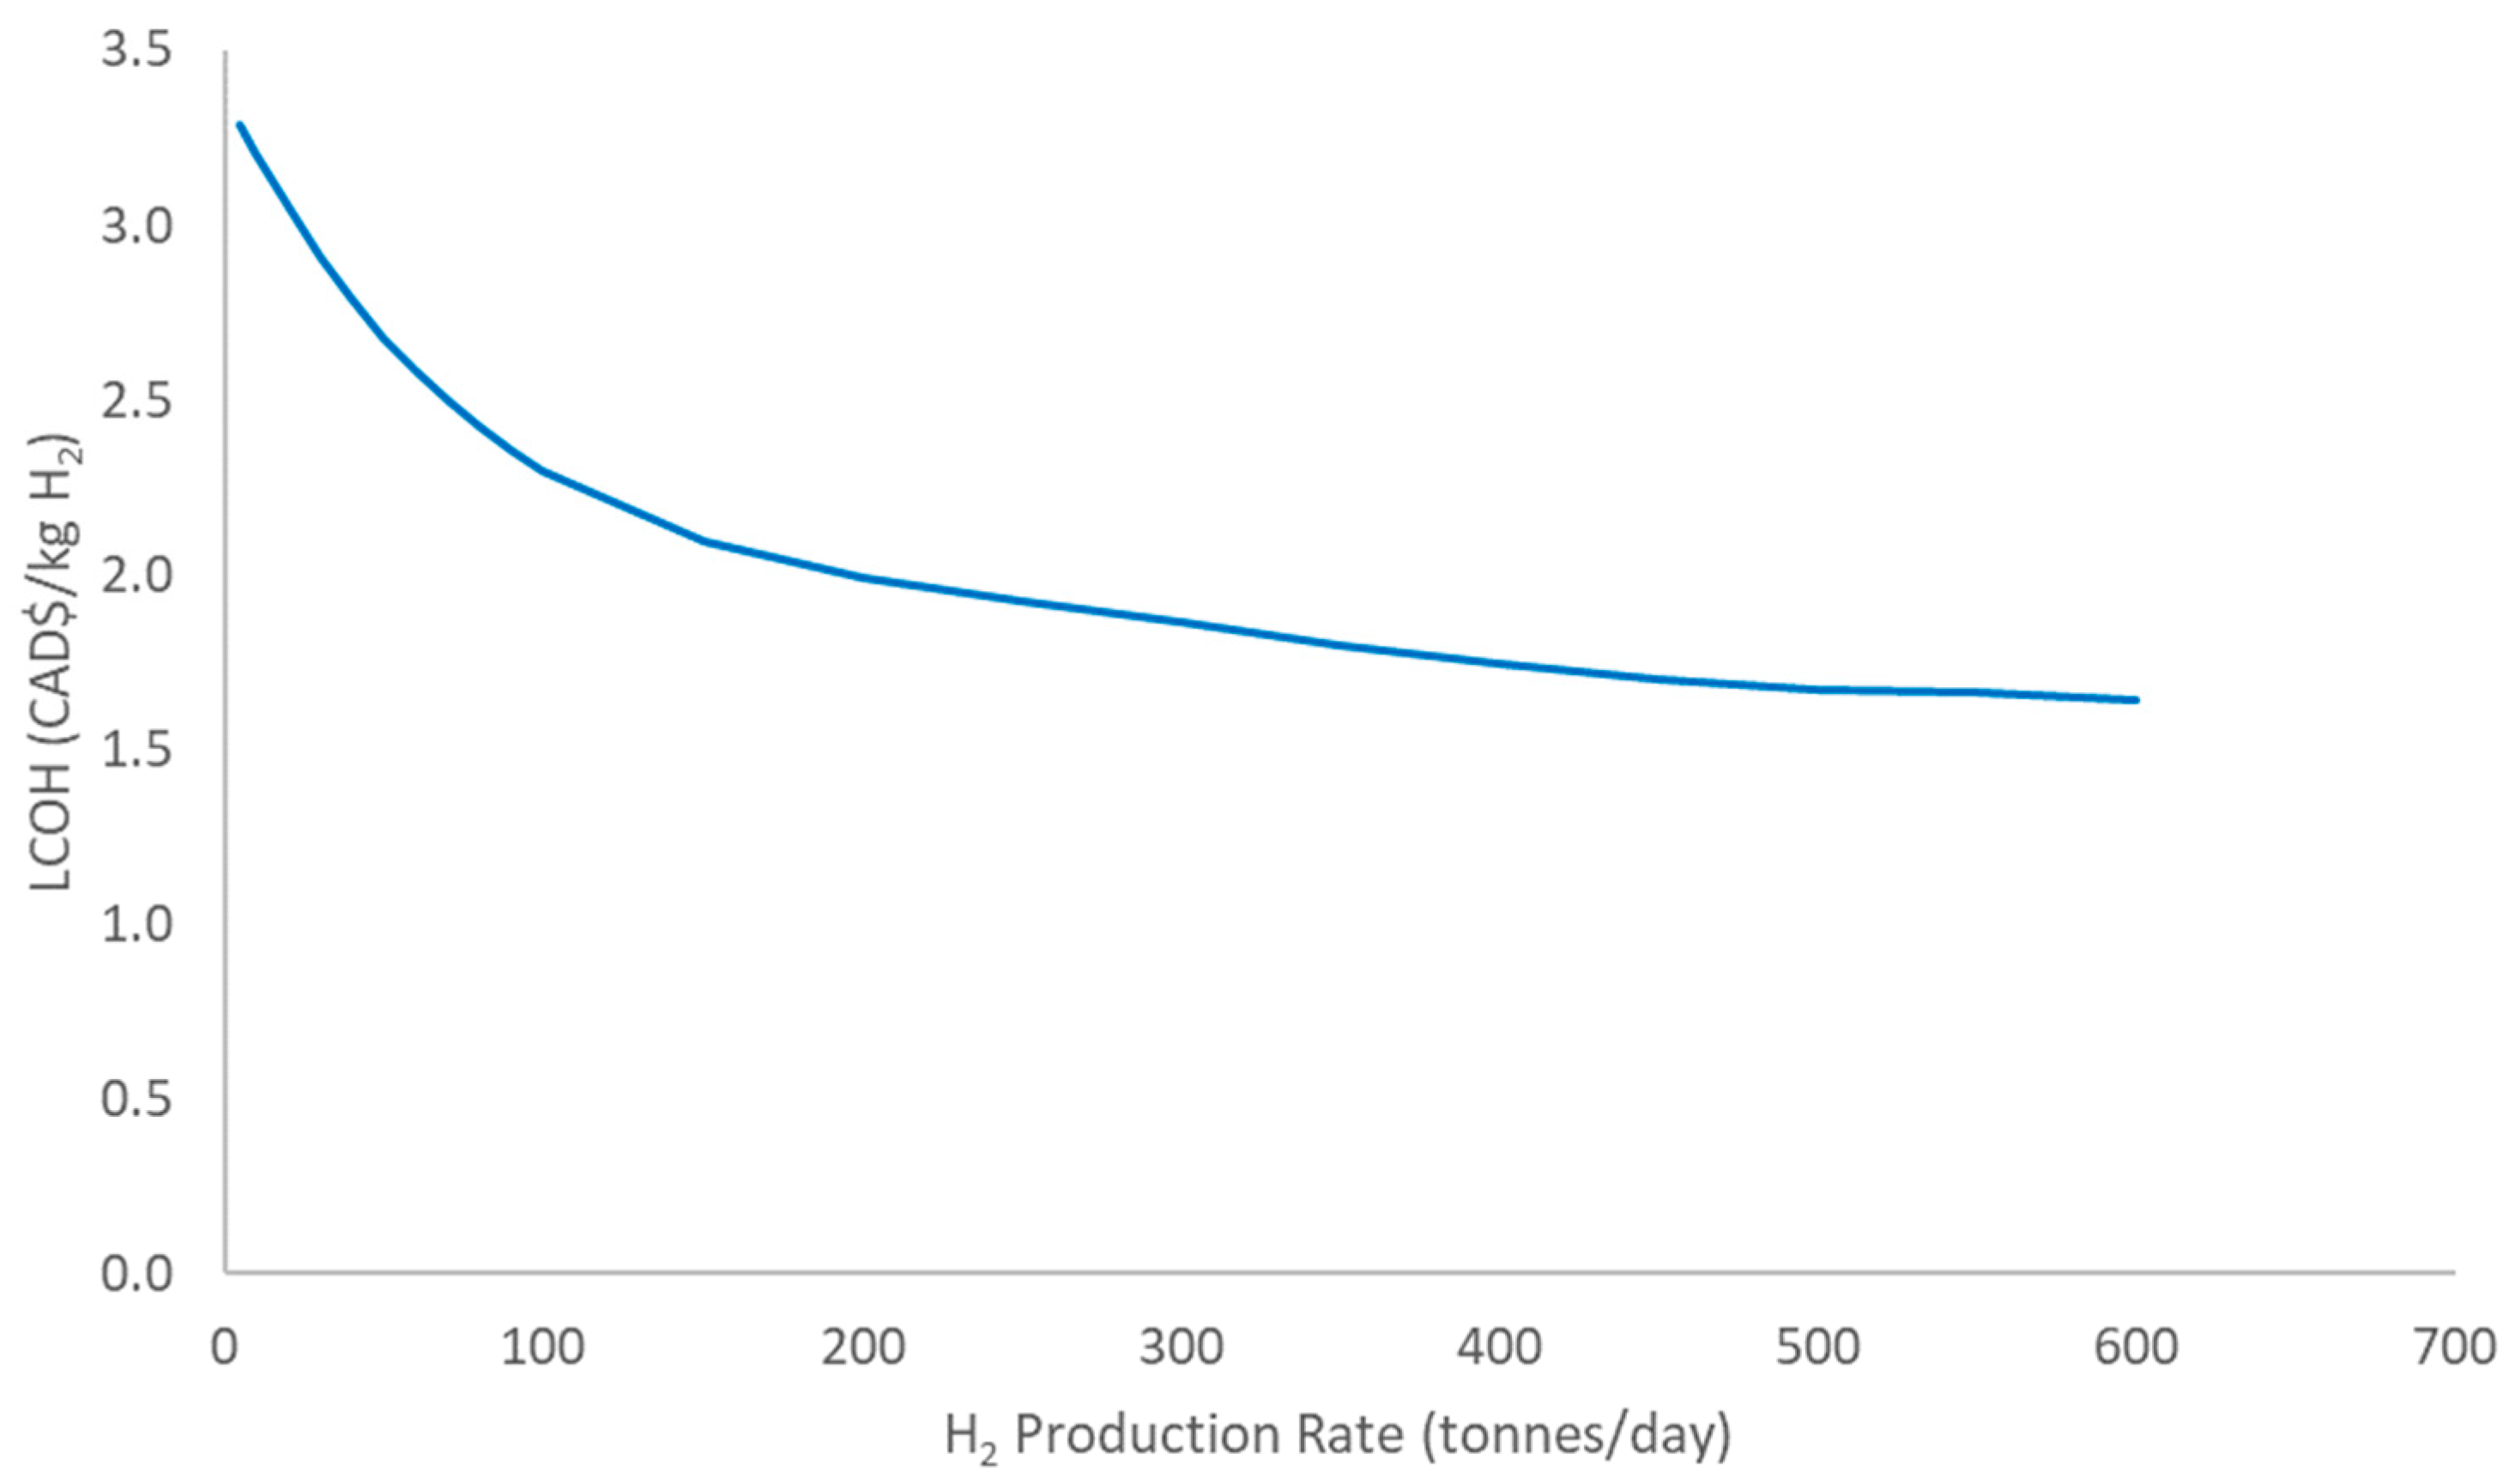
For the H2 production costs, a correlation between the costs of production and the production volume was used, based upon the results for blue H2 production by steam methane reforming (SMR) from [11]. The SMR cost curve was extrapolated to determine values for the smaller production volumes (between 5 and 100 tonnes/day) needed in this study (see Figure 3). The hydrogen production cost numbers developed by [11] include the cost to capture the associated CO2, but they exclude the costs to transport CO2 to storage sites.
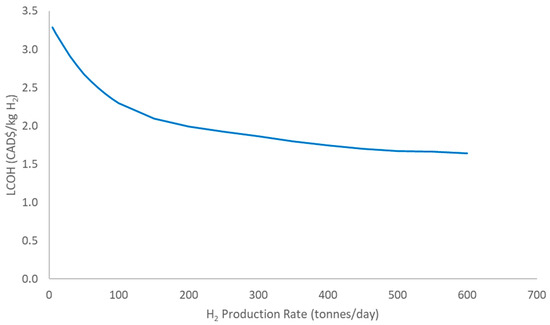
Figure 3.
Levelized costs of (blue) H2 production (LCOH), based on [11].
It should be noted that the overall cost numbers shown in the results of this study are the average costs over the total highway network and for all H2 supplied (a total of 2978 tonnes per day), considering the H2 production costs from facilities of different sizes, and distributing the total H2 transportation costs (for transportation over different distances) over all H2 supplied (i.e., the total of H2 that needed transportation and the H2 that was produced on-site and did not need transportation).
Section 2.3.1 and Section 2.3.2 discuss the details of the H2 transportation costs by liquid H2 tanker truck and by pipeline, respectively.
2.3.1. H2 Transportation by Liquid H2 Tanker Truck
The calculation of the costs to transport H2 by tanker truck included the capital cost for the liquid H2 tanker truck, the driver salary, diesel fuel costs, and maintenance and repair costs (including tires). Table 1 presents the technical, operational, and economic data for H2 transport by tanker truck used in this study. All costs are given in 2020 Canadian dollars (CAD).

Table 1.
Data and assumptions for H2 transportation by liquid tanker truck.
The truck capital cost includes the costs for tanker, undercarriage, and cab. The liquid H2 tanker can transport 10 times more hydrogen than a tube trailer for compressed H2 gas [12], hence, it was decided to use the liquid H2 tanker truck.
A diesel price of CAD 1.59 per liter was used in the tanker truck scenarios, based on the average diesel retail price in 17 Canadian cities over the period of May 2020–November 2023 [13].
The total salary costs per roundtrip to deliver H2 to a refuelling site was calculated based on the total time spent on the job, which included driving time and loading and unloading time.
While the costs of liquefying hydrogen were substantial (1.34 CAD/kg), the costs for regasification at the refuelling sites to convert it back to gaseous H2 were found to be negligible [10], and, hence, they were not included in this study.
The capital costs of the tanker trailer and cab were calculated using a net present value (NPV) approach. A 10% minimum acceptable rate of return (MARR) was used in the NPV calculation of the truck transportation infrastructure for a 20-year lifespan. The capital recovery factor (CRF) given by Equation (4) was used to obtain the annual capital cost.
CRF = {I*(1 + i)n/((1 + i)n − 1)}
Here, i is the MARR (10%) and n is the project lifespan of 20 years.
2.3.2. H2 Transportation by Pipeline
For the calculation of the costs to transport H2 by pipeline, capital, operational, and maintenance costs were considered for the two main components, namely, the pipeline and the H2 compressor.
The pure hydrogen transportation cost equations from [9,18] were used to estimate the pipeline capital cost and compressor capital cost, which included the equipment purchase and installation cost.
The pipeline capital cost was assessed using the following equation from [9,18].
Cpipe = ({1171*(D/25.4)2 + 15,251*(D/25.4) + 329,705}*L + 767,845)*AF
Cpipe is the H2 pipeline capital cost (CAD), D is the pipeline diameter (mm), and L is the pipeline length (km). A cost factor (Alberta factor 1.15) has been considered in this equation to reflect a 15% cost increase from the average North American value [9,19].
The internal pipeline diameter for the pipelines of the network used in this study was based on the maximum daily amount of H2 to be supplied to a refuelling site, which was 77 tonnes. In [9], a 16-inch (406.4 mm) pipeline was utilized for transporting 607 tonnes of H2 per day. Using a simplified scaling method, which assumes that pipeline throughput is linear with the area of the pipe opening, a 6-inch (152.4 mm) diameter was found to be sufficient for transporting up to 85 tonnes per day. It was decided to use this diameter for all pipelines in the network, because of the limited cost savings from using pipelines with smaller diameters (a pipeline with half the diameter (3-inch/76.2 mm) has a 75% lower capacity than a 6-inch pipeline, but costs only 16% less) in comparison to the opportunity to use the pipeline network for additional clients in the future.
The compressor capital cost was estimated using the factorial method. Applying this method, the purchase equipment cost of an equipment was first estimated, then the cost was multiplied by the factors (installation costs, offsite costs, design and engineering, and contingencies) to obtain the capital installation cost [9]. The purchase equipment cost (CPEC) and the installed capital costs (CICC) were determined using Equations (6) and (7) from [9,11].
CPEC = 30,746*P0.6089
CICC = (CPEC* ∑ CIF + OSBL + D&E + Contingency)*AF
Here, P is power consumption by the compressor motor (kW). The factors used in the CICC equation, namely, material and labour installation factor (CIF), off-site battery limit cost (OSBL), the design and engineering cost (D&E), and the contingency charge (Contingency) have values of 1.385, 0.3, 0.3, and 0.1 respectively.
The operating costs and maintenance costs were also considered to calculate the overall cost for a hydrogen pipeline transportation infrastructure. The operating and maintenance costs for the pipeline were assumed to be 1.5% and 3% of the pipeline capital cost, respectively [9]. The compressor operating cost was not considered in this study and would have been negligeable in comparison to the much higher costs to operate the pipeline.
The pipeline and compressor have an assumed lifetime of 25 and 10 years, respectively. A 10% minimum acceptable rate of return (MARR) was considered to calculate the net present value (NPV) of the pipeline infrastructure for a 25-year lifespan. The capital recovery factor (CRF) given by Equation (4) was used to obtain the annual capital cost. All costs for the pipeline scenario were adjusted to 2020 CAD.
The annualized capital, operating, and maintenance costs for all pipelines were added together into the total annual costs for H2 transportation. These costs were distributed over all H2 produced/supplied, to calculate the contribution of transportation to the average supply costs per kg of H2 for the pipeline scenarios.
It was assumed pipelines can be buried and they can follow the same trajectory as truck routes for H2 transportation. Hence, the distance between the H2 refuelling stations and the H2 production stations were kept the same as for truck transportation cases.
3. Results and Discussion
3.1. Hydrogen Production and Refuelling Sites
Different scenarios were evaluated for local and centralized H2 production (as explained in Section 2.2), varying the size of the production facility and the associated distance between production sites, and the number of refuelling sites that were supplied by one production site (see Table 2). For Scenario 1, where the H2 required for each refuelling site is produced locally, there is no need for any H2 transportation. For the other scenarios, the total H2 transportation distances were determined based upon the number of H2 refuelling sites that did not have on-site production and their distances to the nearest H2 production site.

Table 2.
Number of production and refuelling sites for the scenarios evaluated.
The results in Table 2 show a clear reduction in the number of production sites for scenarios in which one production site would supply an increasing number of refuelling sites. However, this reduction is not linear, because the number of required H2 production sites was evaluated per highway segment. If a highway segment was smaller than the standard distance between two production sites under a certain scenario, it would still have its own production facility. Similarly, if the length of the highway segment was 1.5 times the standard distance between production sites, the segment would have two production sites.
3.2. H2 Supply Costs and Potential Cost Savings
The total cost per kg of hydrogen supplied to the refuelling sites for each of the scenarios are presented in Table 3 and Table 4. The cost numbers shown here are average costs over the total highway network for all H2 supplied, 2978 tonnes H2 per day, considering the full range of H2 costs from production facilities of different sizes, and distributing the H2 transportation costs over all H2 supplied.

Table 3.
Total H2 cost per kg supplied and H2 costs savings for different scenarios using liquid H2 tanker trucks for transportation.

Table 4.
Total H2 cost per kg supplied and H2 costs savings for different scenarios using pipelines for transportation.
H2 production costs varied significantly across the evaluated scenarios. The average H2 production cost ranged from 2.31 CAD/kg to 2.83 CAD/kg, with the lowest cost for Scenario 4, which had, on average, the highest production volume per production facility.
For the truck transport scenarios (see Table 3), the costs of the H2 liquefaction had a major impact on the overall H2 transportation costs (i.e., the average of the costs for H2 that needed transportation and for H2 that did not need transportation). For the scenarios using centralized H2 production, more refuelling sites need transportation when moving from Scenario 2 to Scenario 4, hence, the results in Table 3 show an increase in the average transportation costs. Due to the high costs for liquefaction, the scenario needing no transportation due to local H2 production at every refuelling site (Scenario 1) was overall more cost-effective in supplying H2 than the scenarios using centralized H2 production.
For the pipeline scenarios, H2 was transported in gaseous form, avoiding the need for costly liquefaction. Similar to the scenarios using tanker trucks, the transportation cost increased when moving from Scenario 2 to Scenario 4 to more centralized H2 production (see Table 4), with each scenario needing more H2 to be transported. The overall costs to supply H2 by pipeline were fairly similar for all scenarios with centralized H2 production.
The results in Table 3 and Table 4 show that while pipeline transport results in lower H2 supply costs than truck transport, all scenarios involving H2 transportation are still more expensive than the scenario that has on-site H2 production at all refuelling sites and does not need any H2 transportation (Scenario 1).
The evaluated scenarios for H2 supply using tanker truck or pipeline transportation, however, may not be optimized scenarios, because they used the same transportation method for the total network of refuelling sites. In the next section, first the relationship between the transportation costs and transportation distance is investigated for tanker truck transportation and for pipelines, after which results for a mixed scenario using both truck transport and pipelines are presented.
3.2.3. Comparison of H2 Transportation Costs between Tanker Truck and Pipelines
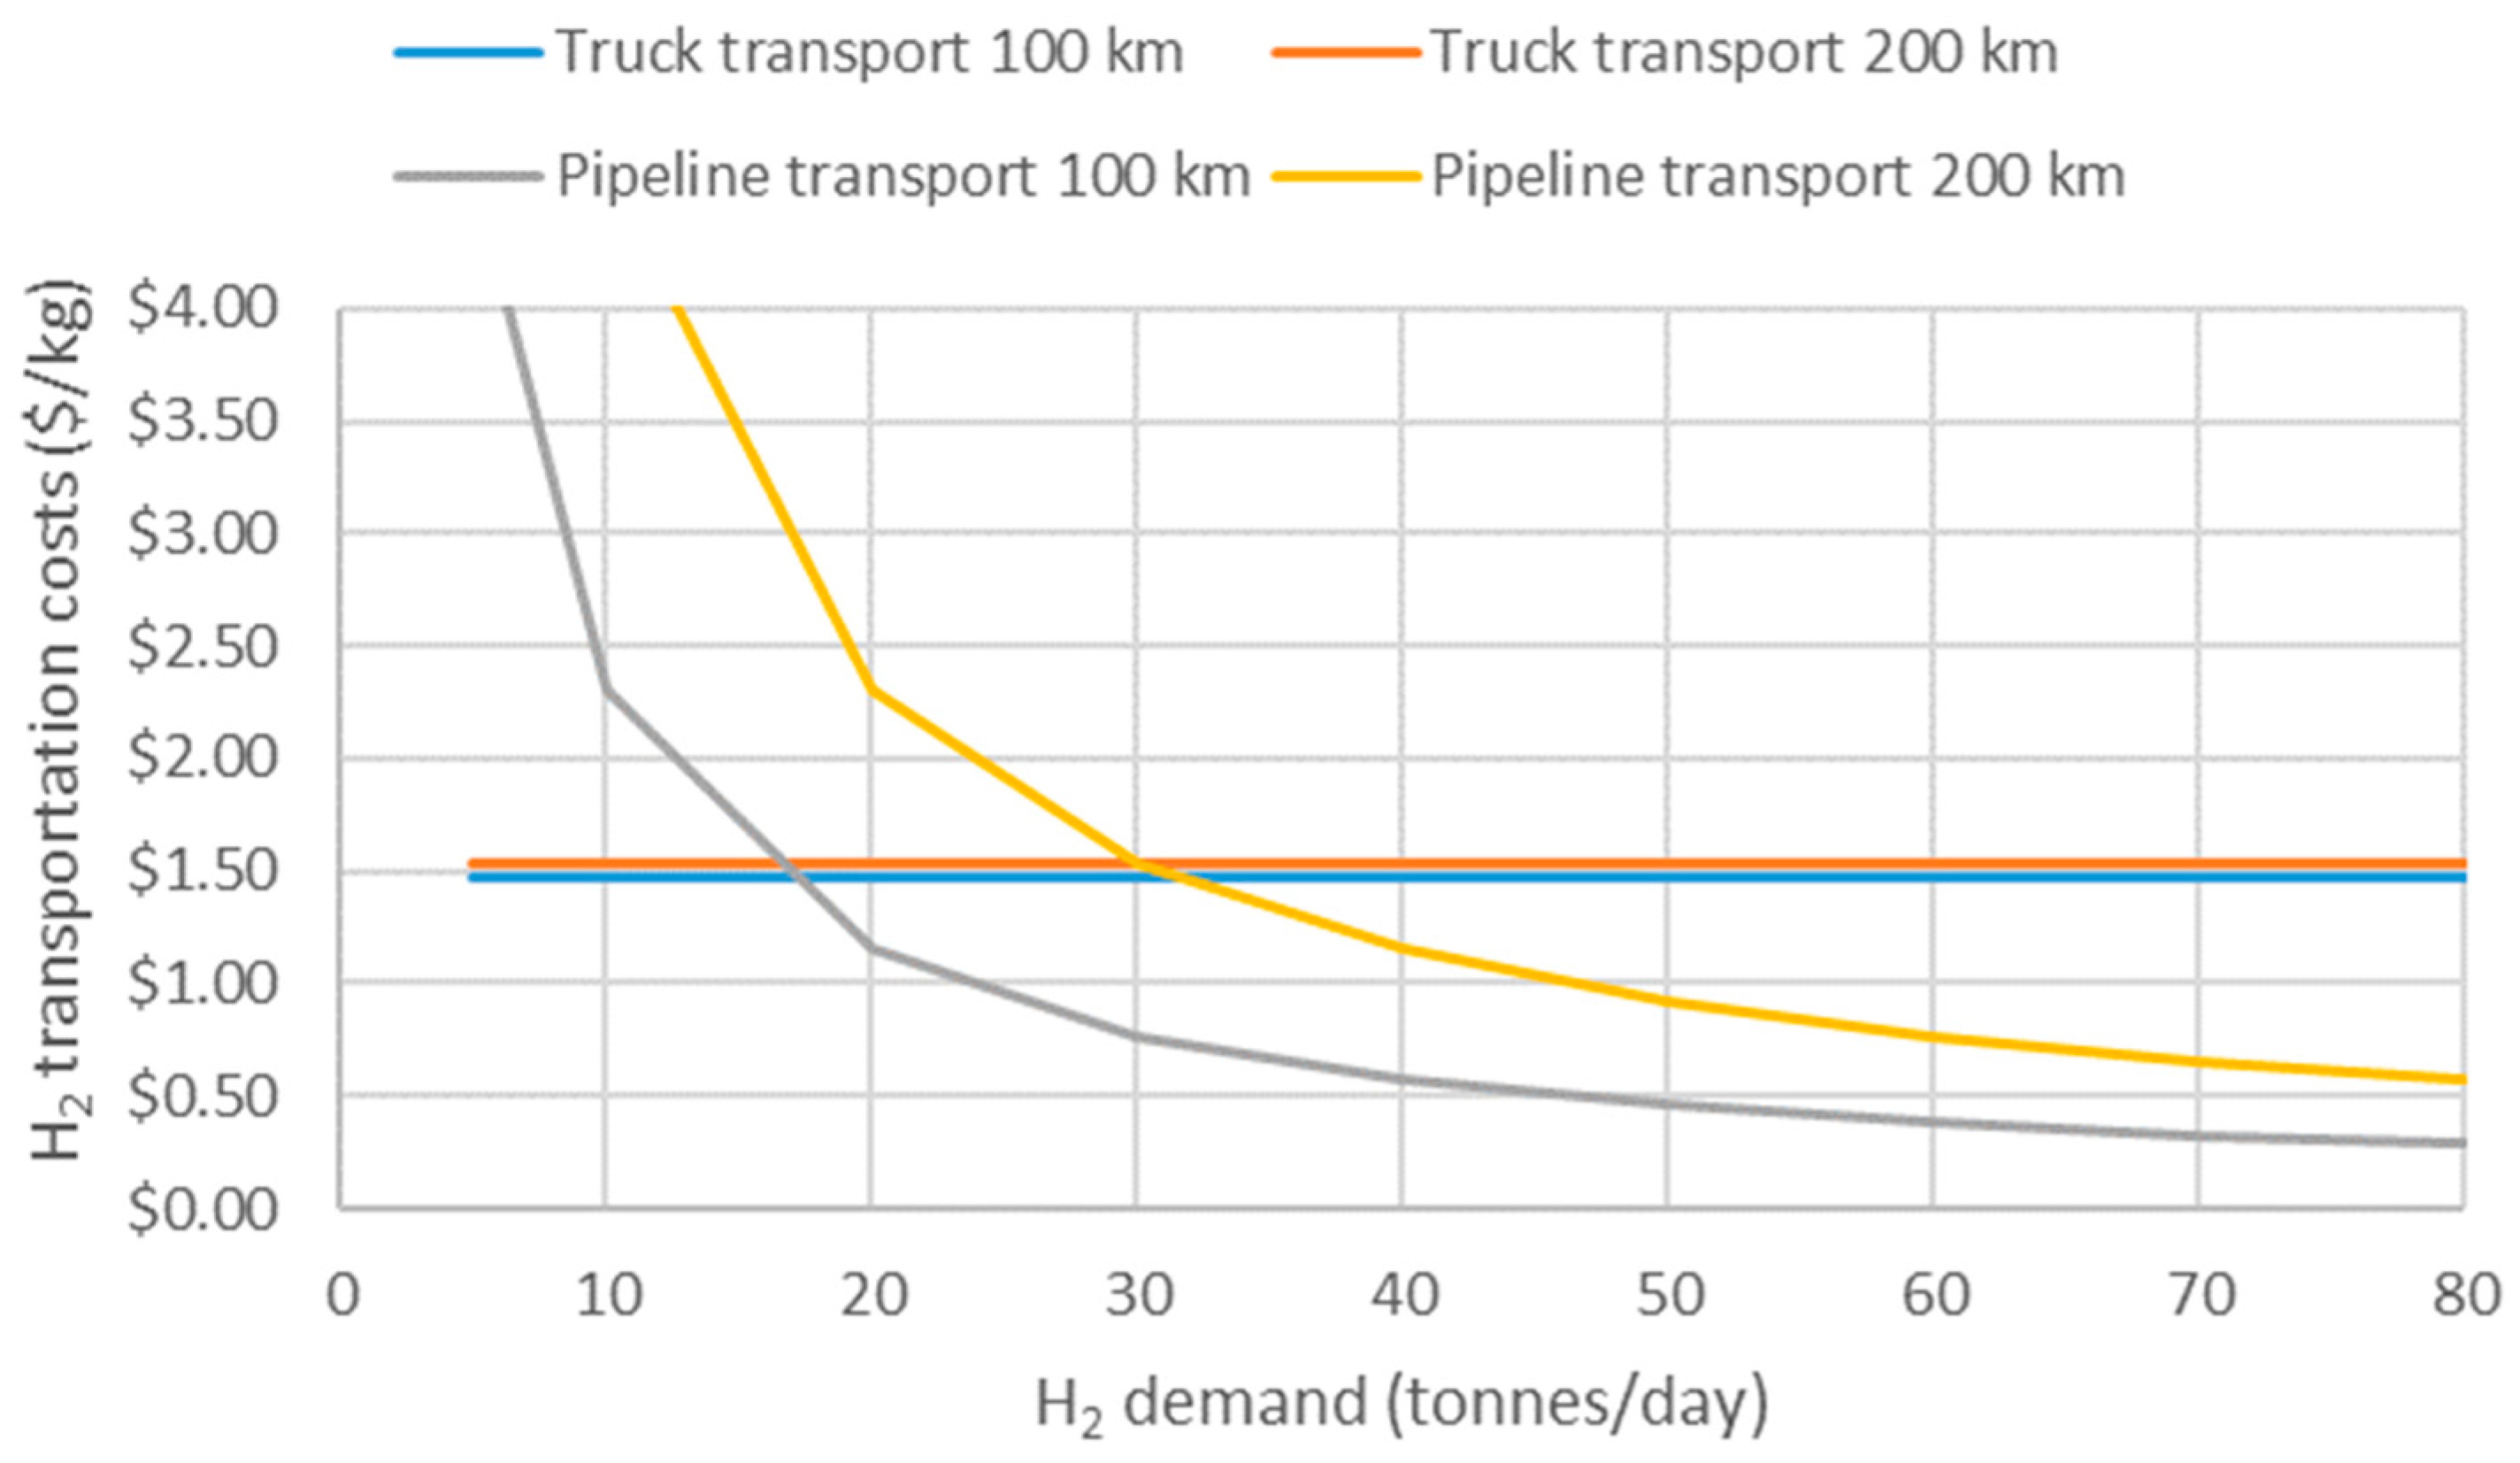
Figure 4 compares the per kg H2 transportation cost for different transportation methods and for a range in daily H2 demand (volume), focusing on transportation between locations that are 100 km and 200 km apart. For the tanker truck scenarios, the roundtrip driving distance per delivery was twice the distance between locations, i.e., 200 km and 400 km, respectively, for the examples illustrated in Figure 4.
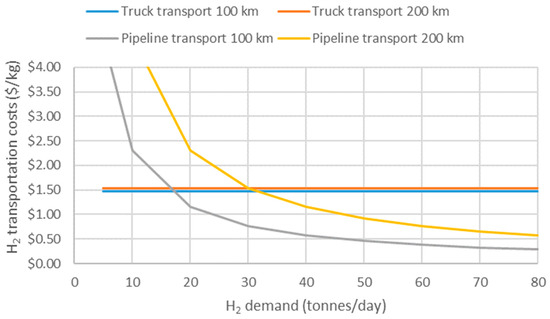
Figure 4.
Comparison of transportation costs per kg of H2 between liquid H2 tanker trucks and pipelines.
From Figure 4, it is observed that the pipeline transportation costs change with hydrogen demand whereas the truck transportation costs per kg of H2 remain constant. This is caused by the different characteristics of the two transportation methods. Since the tanker truck capacity is fixed (4000 kg of hydrogen per tanker truck), the per kg H2 transportation costs are also constant with demand, because if more H2 will need to be transported, this will be achieved by a larger number of tanker trucks, each having the same H2 transportation costs per kg of H2 transported. For pipelines, the overall transportation costs are dominated by capital costs, which are fixed once a network with a certain capacity has been constructed. Using this pipeline network for different H2 demands will then lead to differences in H2 transportation costs. If the H2 throughput of the pipeline (the H2 demand) was increased, the transportation cost would decrease and vice versa.
Figure 4 shows that truck transportation is more cost-effective for lower H2 demands (i.e., for refuelling sites along quiet highways) and that pipeline transportation is favored for higher H2 demands (refuelling sites along busy highways). For a distance of 100 km between production and refuelling sites, pipelines have lower costs for H2 demands starting around 17 tonnes per day, while for a 200 km transportation distance, pipelines will result in lower costs for demands over 30 tonnes per day.
3.2.4. Optimized Scenarios Using a Mix of H2 Transportation Methods
The results from Figure 4 were used to create optimized scenarios for Scenarios 2 to 5 by selecting the lowest costs transportation method (tanker truck or pipeline) for each highway segment. Thus, the optimized scenario represents a combination of transportation modes to supply H2 to the total network of refuelling sites across highways in Canada.
Table 5 presents details on the optimized scenarios and compares the average cost to supply H2 from centralized production to the costs for when using local H2 production (Scenario 1). It was observed that for each scenario, almost half of the refuelling sites used tanker truck transportation, while the other sites utilized pipelines. The optimized scenarios had average H2 supply costs that were further reduced in comparison to the scenarios that used either tanker truck or pipeline transport and were similar to those of Scenario 1.

Table 5.
Total H2 cost per kg supplied and H2 costs savings for optimized scenarios using a mix of tanker trucks and pipelines for H2 transportation.
Although the average H2 supply costs for the optimized scenarios utilizing centralized H2 production were comparable to those for the scenario using decentralized H2 production, there is one additional aspect that is outside the scope of the current study, but that will need to be taken into account for a full view on the optimum H2 supply infrastructure for refuelling sites for long-haul trucks along highways in Canada: The study used cost information for H2 production from natural gas, which included the costs of CO2 removal, but not the costs to transport CO2 to the storage site. These costs may be substantial, because for a large fraction of the production sites along the Canadian highway network it is expected that CO2 may need to be transported over long distances. This may have a significant impact on the overall H2 supply costs and may influence whether centralized or decentralized H2 production would be most cost-effective. It is, therefore, recommended that the transportation of CO2 from the H2 production sites to the storage location(s) will be included in follow-on research on an optimized H2 supply infrastructure.
4. Conclusions
In this study, it was analyzed how the costs of supplying H2 to refuelling sites for long-haul trucks along major highways in Canada can be minimized by optimizing the design of the refuelling infrastructure. Scenarios using local or centralized blue H2 production were evaluated using two different modes of H2 transportation (liquid H2 tanker trucks and pipelines).
For each scenario, the average H2 supply costs were determined considering H2 production costs from facilities of different sizes and transportation costs for H2 that was not produced locally. Average H2 supply costs were 2.83 CAD/kg H2 for the scenario with local H2 production at each refuelling site. Scenarios with centralized H2 production had average H2 supply costs of 3.22–3.27 CAD/kg H2 when using tanker trucks for H2 transportation and of 2.92–2.96 CAD/kg H2 when utilizing pipeline transportation. The high costs for H2 liquefaction were a major factor in the higher supply costs for the tanker truck transportation scenarios.
The different characteristics of the two H2 transportation methods allowed for the creation of optimized scenarios, which utilized each transportation mode when it would be the cheaper option (tanker trucks for refuelling sites with lower H2 demand along quiet highways, and pipelines for sites along busy highways that had higher H2 demand). The average H2 supply costs for the optimized scenarios of centralized H2 production (2.82–2.88 CAD/kg H2) were similar to the average supply costs when using local H2 production at each refuelling site (2.83 CAD/kg H2), with slightly lower costs for the scenario using the largest H2 production volumes.
While the results of this study seem to indicate that there is little difference in the results between scenarios using local or centralized H2 production, the transport of CO2 from the production site of the blue H2 to a storage location were out of scope for this study. Follow-on research is recommended to investigate how the CO2 transportation costs will impact the H2 supply costs and may influence the design of an optimum supply infrastructure for a network of refuelling sites for long-haul trucks.
It is recommended that in future research, the results obtained from blue hydrogen pathways will be updated to include the costs for CO2 transportation and storage, and to compare them to those of green hydrogen pathways to identify the optimum solution.
Author Contributions
Conceptualization, H.R. and N.M.; formal analysis, H.R. and N.M.; investigation, H.R. and N.M.; writing—original draft preparation, N.M.; writing—review and editing, H.R. and N.M.; supervision, H.R.; project administration, H.R.; funding acquisition, H.R. All authors have read and agreed to the published version of the manuscript.
Funding
Funding for this work was provided by Natural Resources Canada through the Carbon Capture, Utilization and Storage (CCUS) Program and the Program of Energy Research and Development (PERD).
Data Availability Statement
Data sharing is not possible for this article due to confidentiality issues with the source data.
Conflicts of Interest
Nafisa Mahbub and Hajo Ribberink are employees of CanmetENERGY Research Centre. The paper reflects the views of the scientists, and not the company.
References
- International Energy Agency. CO2 Emissions from Fuel Combustion: Overview. Available online: https://www.iea.org/reports/CO2-emissions-from-fuel-combustion-overview (accessed on 10 December 2022).
- Di Lullo, G.; Giwa, T.; Okunlola, A.; Davis, M.; Mehedi, T.; Oni, A.O.; Kumar, A. Blending blue hydrogen with natural gas for direct consumption: Examining the effect of hydrogen concentration on transportation and well-to combustion greenhouse gas emissions. Int. J. Hydrogen Energy 2021, 46, 19202–19216. [Google Scholar] [CrossRef]
- Okunlola, A.; Giwa, T.; Di Lullo, G.; Davis, M.; Gemechu, E.; Kumar, A. Techno-economic assessment of low-carbon hydrogen export from Western Canada to Eastern Canada, the USA, the Asia-Pacific, and Europe. Int. J. Hydrogen Energy 2022, 47, 6453–6477. [Google Scholar] [CrossRef]
- Kim, A.; Yoo, Y.; Kim, S.; Lim, H. Comprehensive analysis of overall H2 supply for different H2 carriers from overseas production to inland distribution with respect to economic, environmental, and technological aspects. Renew. Energy 2021, 177, 422–432. [Google Scholar] [CrossRef]
- Reuß, M.; Grube, T.; Robinius, M.; Preuster, P.; Wasserscheid, P.; Stolten, D. Seasonal storage and alternative carriers: A flexible hydrogen supply chain model. Appl. Energy 2017, 200, 290–302. [Google Scholar] [CrossRef]
- Simunovi, J.; Pivac, I.; Barbir, F. Techno-economic assessment of hydrogen refueling station: A case study in Croatia. Int. J. Hydrogen Energy 2022, 47, 24155–24168. [Google Scholar] [CrossRef]
- Hurskainen, M.; Ihonen, J. Techno-economic feasibility of road transport of hydrogen using liquid organic hydrogen carriers. Int. J. Hydrogen Energy 2020, 45, 32098–32112. [Google Scholar] [CrossRef]
- Chen, Q.; Gu, Y.; Tang, Z.; Wang, D.; Wu, Q. Optimal design and techno-economic assessment of low-carbon hydrogen supply pathways for a refueling station located in Shanghai. Energy J. 2021, 237, 121584. [Google Scholar] [CrossRef]
- Di Lullo, G.; Giwa, T.; Okunlola, A.; Davis, M.; Mehedi, T.; Oni, A.O.; Kumar, A. Large-scale long-distance land-based hydrogen transportation systems: A comparative techno-economic and greenhouse gas emission assessment. Int. J. Hydrogen Energy 2022, 47, 35293–35319. [Google Scholar] [CrossRef]
- International Energy Agency. The Future of Hydrogen. Available online: https://www.iea.org/reports/the-future-of-hydrogen (accessed on 16 October 2023).
- Elnigoumi, A. Investigating Cost Effective Pathways for Blue Hydrogen Production in Alberta. Unpublished. Master′s Thesis, University of Calgary, Calgary, AB, Canada, 2021. Available online: http://hdl.handle.net/1880/113957 (accessed on 5 November 2023).
- Yang, C.; Ogden, J.M. Determining the Lowest-Cost Hydrogen Delivery Mode; Institute of Transportation Studies: UC Davis, CA, USA, 2008; Available online: https://escholarship.org/uc/item/0st9s56s (accessed on 5 November 2023).
- Monthly Average Retail Prices for Gasoline and Fuel Oil, by Geography. Available online: https://www150.statcan.gc.ca/t1/tbl1/en/tv.action?pid=1810000101 (accessed on 20 December 2023).
- Truck Driver Salary in Canada. Available online: https://ca.indeed.com/career/truck-driver/salaries (accessed on 15 December 2023).
- Annual Exchange Rates. Available online: https://www.bankofcanada.ca/rates/exchange/annual-average-exchange-rates/ (accessed on 10 November 2023).
- CPI Inflation Calculator. Available online: https://www.in2013dollars.com/us/inflation/2008?endYear=2020&amount=1 (accessed on 11 November 2023).
- Leslie, A.; Murray, D. An Analysis of the Operational Costs of Trucking: 2023 Update June 2023; American Transportation Research Institute: Arlington, VA, USA, 2023. [Google Scholar]
- Parker, N. Using Natural Gas Transmission Pipeline Costs to Estimate Hydrogen Pipeline Costs. Available online: https://escholarship.org/content/qt2gk0j8kq/qt2gk0j8kq_noSplash_cfbe115e54fba9e62c107c7ac2f3ef17.pdf (accessed on 12 November 2023).
- Olateju, B.; Kumar, A. Techno-economic assessment of hydrogen production from underground coal gasification (UCG) in Western Canada with carbon capture and sequestration (CCS) for upgrading bitumen from oil sands. Appl. Energy 2023, 111, 428–440. [Google Scholar] [CrossRef]
Disclaimer/Publisher’s Note: The statements, opinions and data contained in all publications are solely those of the individual author(s) and contributor(s) and not of MDPI and/or the editor(s). MDPI and/or the editor(s) disclaim responsibility for any injury to people or property resulting from any ideas, methods, instructions or products referred to in the content. |
© His Majesty the King in Right of Canada, as represented by the Minister of Natural Resources, 2024.

