Article

Free Riding of Vehicle Companies under Dual-Credit Policy: An Agent-Based System Dynamics Model

School of Economics & Management, Shanghai Institute of Technology, Shanghai 201418, China
*
Author to whom correspondence should be addressed.
World Electr. Veh. J. 2024, 15(6), 227; https://doi.org/10.3390/wevj15060227
Submission received: 12 April 2024 / Revised: 17 May 2024 / Accepted: 22 May 2024 / Published: 23 May 2024
(This article belongs to the Special Issue New Energy Special Vehicle, Tractor and Agricultural Machinery)

Abstract

:
The dual-credit policy promotes green transition in automobile companies. This paper investigates the dual-credit policy framework in the Chinese automotive industry, with a focus on the phenomenon of free riding. This occurs when traditional vehicle manufacturers within an alliance benefit from the excess credits generated by a transitioning vehicle company without fully committing to their own green transitioning. The focus of this study lies on an alliance constituted by a transitioning vehicle company in partnership with two traditional vehicle manufacturers, all interconnected via equity ties. Utilizing an agent-based system dynamics model, this study explores the strategic behaviors emerging from such credit collaborations and their consequent effects on operational efficiency and financial performance. The findings reveal that 1. free riding negatively impacts the transitioning company’s revenue but benefits the alliance by easing transition pressures and boosting collective performance; 2. stricter policies increase intra-alliance credit transfers and performance, while lower credit prices reduce transfer value and harm the transitioning company’s earnings. This study implies that transitioning vehicle companies with equity-linked partners can benefit from a nuanced understanding of how policy mechanisms interact with alliance dynamics under free riding. By adjusting credit transfer strategies in line with market conditions and policy trends, they can better navigate the dual-credit policy landscape, balancing individual profitability with the needs of the broader alliance and long-term sustainability goals.

1. Introduction

“Parallel Management Regulation for Corporate Average Fuel Consumption and New Energy Vehicle Credits for Passenger Cars”, conventionally referred to as the dual-credit policy, was jointly issued and enforced by the government of China in 2017 [1]. This policy is specifically designed for passenger vehicle companies, introducing a groundbreaking regulatory framework that measures automotive energy efficiency through a credit system. Furthermore, it imposes credit limits and implements stringent punitive actions to enforce compliance with energy efficiency standards [2]. The dual-credit policy boosts technological innovation and transition within vehicle companies. It holds significant importance for the development of the global new energy vehicle industry [3].
The dual-credit policy permits credit transfers among affiliated enterprises [4], thereby indirectly promoting the formation of horizontal alliance among equity-related enterprises [5]. Within alliances, the transfer of credits between companies serves as a primary mode of collaboration. However, credit cooperation could potentially give rise to free riding behavior, wherein one party gains resources without bearing the associated costs [6]. For example, cooperation among the Shanghai Automotive Group, the Volkswagen Group of Germany, and General Motors of the United States has formed the horizontal alliance [7]. Within this alliance, Chinese vehicle companies display a pronounced tendency towards transitioning to new energy vehicles. The production and sales share of new energy vehicles within joint venture (JV) portfolios remains significantly diminutive, resulting in their substantial need to acquire large amounts of credits externally. Chinese vehicle companies confront the dilemma of whether to transfer surplus credits at no cost to JV partners. Research on the dual-credit policy has primarily concentrated on the strategic production decisions of vehicle manufacturers, underscoring the significance of collaborative efforts that harness complementary resources to amplify overall performance and expedite the transition to cleaner energy solutions [8,9]. Nonetheless, a gap exists in understanding the impacts that arise when the collaborative dynamics within horizontal alliances composed of vehicle companies become intricate due to free riding behaviors.
This study adopts an agent-based perspective to delineate the internal structure and interactive traits of equity-related horizontal alliances. It utilizes system dynamics to create a model for technology management, production operations, and credit settlement in passenger vehicle companies under the influence of the dual-credit policy. Through this process, it devises several comparative scenarios that effectively simulate how traditional companies might exhibit free riding behavior within a horizontal alliance context, as well as examining the strategic options available to those companies undergoing transition. The purpose of this study was to answer the following research questions:
(1)
Faced with the free riding behavior of partners, would the supportive actions of transitioning vehicle companies harm their own and alliance performance?
(2)
How does corporate transition and policy change affect performance under free riding behavior?
The innovative contributions and significance of this research lie in the following: ① It focus on free riding behavior and member strategies within equity-related horizontal alliances, which will aid in enriching the theoretical framework of strategic alliances. ② This study employs modeling tools to simulate annual rollovers, credit transfers among affiliates, and secondary market transactions under the framework of the dual-credit policy. These comprehensive simulations and the strategic decisions offer valuable groundwork for comprehending complex industrial policies analogous to the dual-credit policy. ③ This study provides guidance for enterprises to optimize their production strategies under the scrutiny of policy assessment, offering valuable feedback and suggestions for policymakers on the effective implementation of policies. The research positively contributes to the ongoing promotion of sustainable development within the new energy vehicle industry.
The remainder of this paper is structured as follows. Section 2 provides a summary of the literature relevant to this study. In Section 3, based on the analysis of policy mechanisms, we employed the system dynamics methodology to construct a model, defining the parameters of the model accordingly. Section 4 conducts a simulation analysis to examine the free riding behavior of conventional vehicle manufacturers within a horizontal alliance and evaluate the strategic options of transitioning vehicle companies in this context. Section 5 summarizes the findings and implications, along with suggesting avenues for future research.

2. Literature Review

2.1. The Dual-Credit Policy

Since 2017, academic research has extensively engaged with the intricacies of China’s dual-credit policy, a regulatory framework designed to incentivize the production and sale of new energy vehicles (NEVs) while promoting overall energy efficiency in the automotive industry [10]. On a macroeconomic level, studies have delved into the far-reaching implications of this policy, including its facilitation of industry-wide growth and market expansion [11,12], its role in mitigating greenhouse gas emissions and contributing to climate change mitigation targets [13], and its stimulation of technological progress and innovation in both NEV and conventional vehicle technologies [14,15]. Collectively, this body of research underscores the dual-credit policy’s multifaceted nature, its ability to reshape industry dynamics, and its contribution to the broader objectives of environmental sustainability.
From a more granular, micro-economic perspective, the literature has explored the policy’s influence on specific aspects of automobile manufacturing and market dynamics. These inquiries have ranged from the direct impact on vehicle production volumes and the resultant changes in energy efficiency standards of gasoline vehicles [16] to strategic timing considerations for manufacturers’ investments in electric vehicle (EV) production capacity and portfolio transitions [17]. The policy’s effect on financial decisions regarding green technology investments and research and development (R&D) [18], as well as the strategic interplay between competition and cooperation among manufacturers in their production and credit trading activities [1,8], have also been meticulously analyzed. Moreover, the implications for supply chain management, particularly the coordination and alignment of efforts between upstream suppliers and downstream manufacturers to meet the dual-credit criteria [9], have been a significant focus of investigation.
Most studies on the dual credit policy typically take into account the purchase of NEV credits as an integral aspect of the policy [19]. The rollover, transfer, and trade of credits are pivotal features of the dual-credit policy, which are integrated into the decision-making framework along with technology management and production operations. Despite this, this specific aspect has not received sufficient attention, particularly from the viewpoint of alliances forged by equity-related enterprises.

2.2. Free Riding Behavior

Existing research commonly asserts that the formation of strategic alliances serves as a pivotal approach for companies to establish competitive advantages and elevate performance [5]. Horizontal alliances comprising competitors within the same industry segment typically necessitate external facilitation. However, they exhibit intricate game-theoretic dynamics among members due to technological spill-over effects.
There is a substantial amount of research dedicated to vertical strategic alliances, predominantly focusing on how supply chain contract choices affect costs and profits [20]. Regarding horizontal alliances, scholars have investigated the collaborative mechanisms for sharing resources and the associated arrangements for distributing benefits among participating parties [21], the pricing decisions of company alliances in the supply chain [22], and the influence of partner resemblance on horizontal alliances [23]. Under the dual-credit policy, researchers have looked at coordination contracts from the vantage point of component suppliers and vehicle companies [24]. Resources obtained through complementary partnerships enable enterprises to enhance alliance performance [25]. However, there is a dearth of inquiry into production collaboration within enterprise alliances when free riding behavior is present.
The phenomenon of free riding in common-interest entities garners attention from experts. Free riding refers to a situation where one party benefits from the sales efforts or resources of another party without incurring the corresponding cost [6]. Differentiated pricing in dual distribution channels results in varying degrees of consumer free riding behavior, affecting sales efforts and service levels across channels [26,27]. Researchers like Liu et al. [28] and Guo et al. [29] have approached the topic from a consumer angle, addressing pricing and service level issues for businesses and supply chains across different channel combinations. Inter-firm free riding also occurs, such as instances where both companies and consumers exploit services provided by traditional retailers [30]. Scholars have used evolutionary game theory and similar methods to analyze supplementary benefits attached to free riding behavior in supply chain structures [6] and identify key determinants that weaken free riding behavior in supply chains [31] to mitigate the detrimental effects of free riding on corporate interests. While most existing literature addresses free riding from consumer and supply chain viewpoints, supply chain members need to carefully design incentive mechanisms and coordination strategies to balance individual interests with collective emission reduction goals, while mitigating the detrimental effects of free riding [32]. However, in the field of the new energy vehicle industry, existing research fails to take into account the impact of free riding behavior on corporations’ manufacturing choices within the framework of a horizontal alliance.
In conclusion, current research on the dual-credit policy mostly emphasizes production decisions made by companies within the supply chain. in the context of the dual-credit policy, cooperation mechanisms and performance improvements via resource complementary partnerships are emphasized, with a gap in understanding how these dynamics affect production collaboration amidst free riding. This behavior, characterized by one party benefiting without equal investment, garners interest in management circles, especially concerning its implications across dual distribution channels and in balancing individual and collective goals within supply chains. Thus, there is a clear need to bridge this gap by examining free riding’s influence on manufacturing strategies within horizontal alliances more closely.

3. Agent-Based System Dynamics Modeling Approach

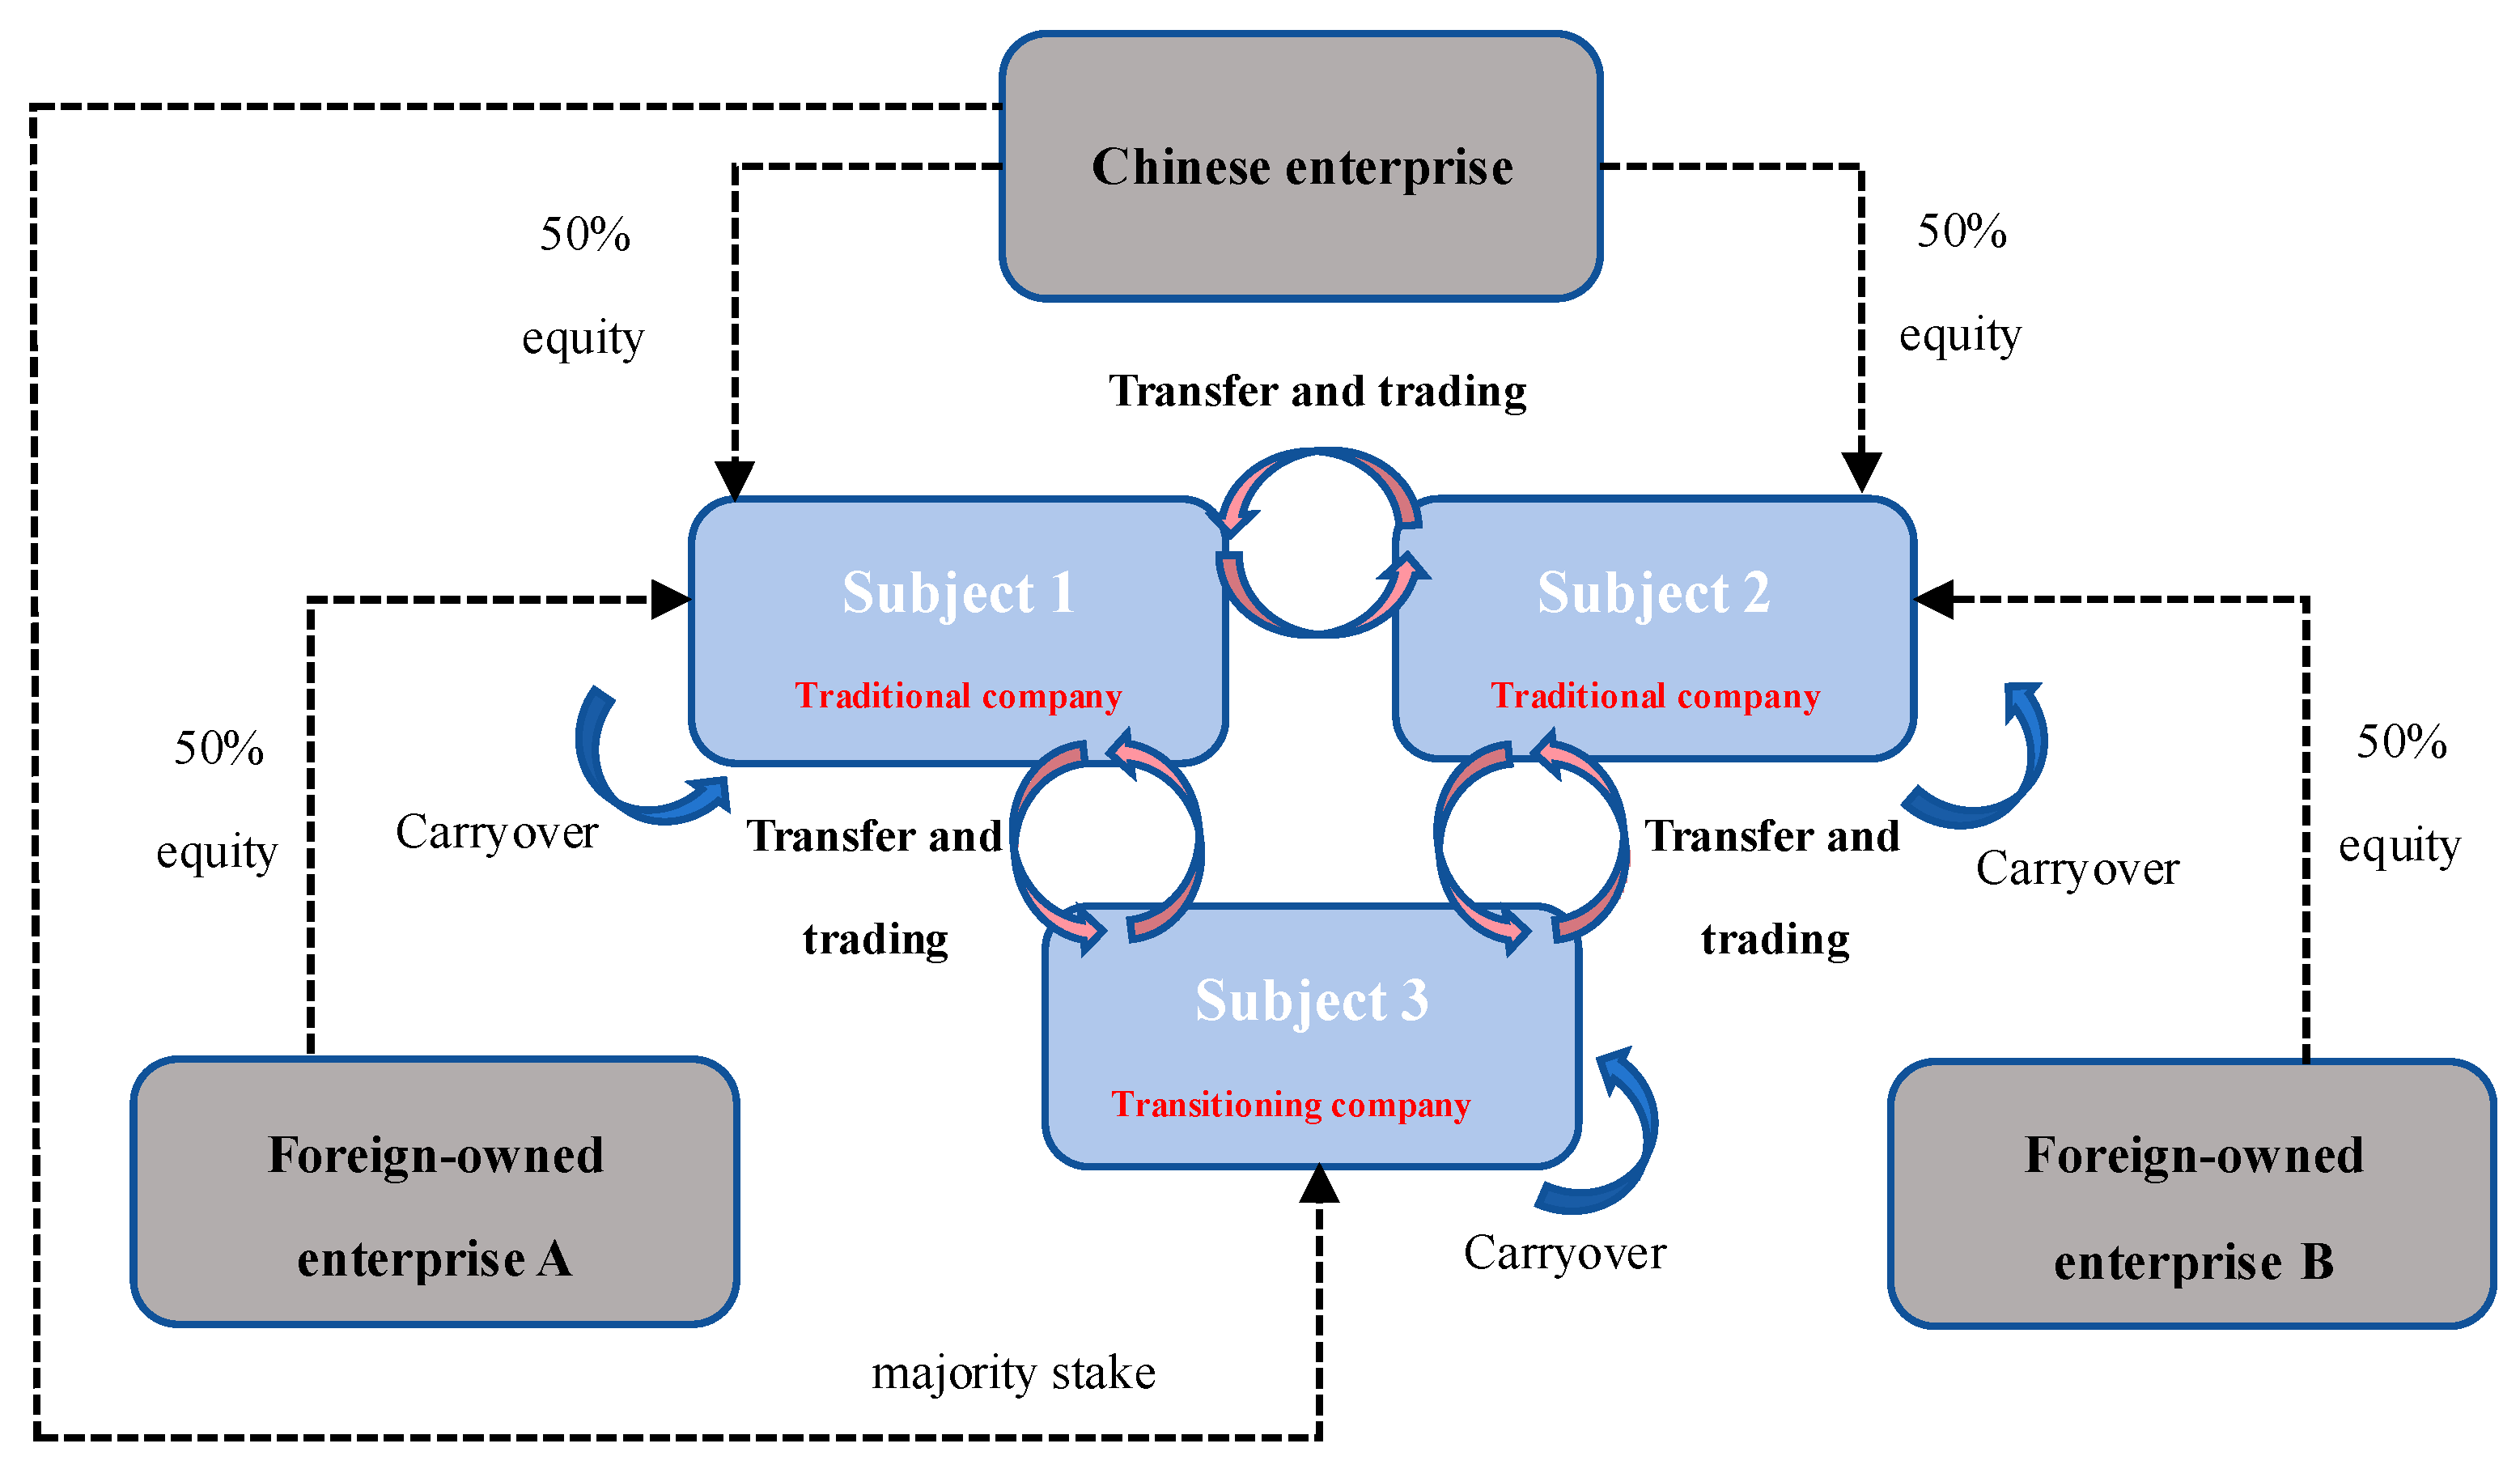
3.1. Model Framework

The dual-credit policy plays a pivotal role in forging a community of interests among certain Chinese vehicle companies, with its policy framework consisting of three core mechanisms [4]: (1) the calculation and offset rules for corporate average fuel consumption credits (CAFC) and new energy vehicle credits (NEV); (2) the carryover and inter-affiliate transfer of CAFC; and (3) the carryover and trading of NEV credits. If a company incurs negative credits that cannot be cleared in a given year, it faces penalties such as the suspension of new product registration and production. After clearing the negative credits, excess NEV can be sold in the credit market. According to the dual-credit policy, enterprises are considered related if they hold direct or indirect equity totaling 25% or more in another domestic passenger vehicle company, or if they are both held by a third party with direct or indirect equity totaling 25% or more.
Considering the reality of China’s automotive industry, as depicted in Figure 1, this study focuses on a horizontal alliance consisting of three equity-related enterprises. All three companies are domestic passenger vehicle companies engaged in both internal combustion engine vehicles and new energy vehicles, with equity types classified as joint venture, joint venture, and Chinese enterprise. This assumption aligns with “China Passenger Vehicle Enterprise Average Fuel Consumption and New Energy Vehicle Credits Calculation Sheet”, as well as the equity relationships among major Chinese passenger vehicle producers.
Adhering to the agent-based modeling philosophy, each entity is an independent decision-maker despite complex equity linkages. Each agent in the model can possess distinct decision-making rules and behavioral logic, reflecting the diversity and complexity of real-world market participants [33]. System dynamics is a cross-disciplinary research method applied to comprehend and analyze complex systems with dynamic characteristics [34]. It involves designing stable information feedback structures to describe and analyze the behavior of time-varying systems, thereby exploring the effectiveness of strategies and their optimization. The combination of agents and modeling is intended to solve complex systems [35]. This approach allows for the modeling of intricate systems, the prediction of future trends, and the evaluation of policy interventions under different scenarios, contributing to a deeper understanding and more informed decision-making in managing complex real-world problems. As a pioneering integrated industrial policy that directly influences the management and operation of both emerging and established technologies, the dual-credit policy is designed around fuel consumption targets linked to research and development endeavors, driving range indicators, and production volume, which collectively constitute several pivotal credit calculation parameters. Based on the dual-credit policy mechanisms and drawing upon existing research, a system dynamics modeling method is adopted. The affected single decision-making entity is decomposed into four primary sub-models: the production sub-model, the R&D sub-model, the credit calculation sub-model, and the credit interaction sub-model, with the causal loop diagram illustrated in Figure 2, where arrows denote the interdependencies among key variables.
From the causal loop diagram, it is evident that in the production and R&D input sub-models, R&D strategies influence vehicle performance, which, combined with production decisions, determines the CAFC and NEV credit values in the credit calculation sub-model. The surplus or deficit of credits dictates the amount needed to offset and zero out annually. When internal credit transfers and rollovers fail to meet the required credit offset, companies must purchase credits from external markets. This feedback loop influences the company’s production and R&D strategies, prompting adjustments in vehicle production allocation and investment in R&D.

3.2. Stock and Flow Diagrams of Sub-Models

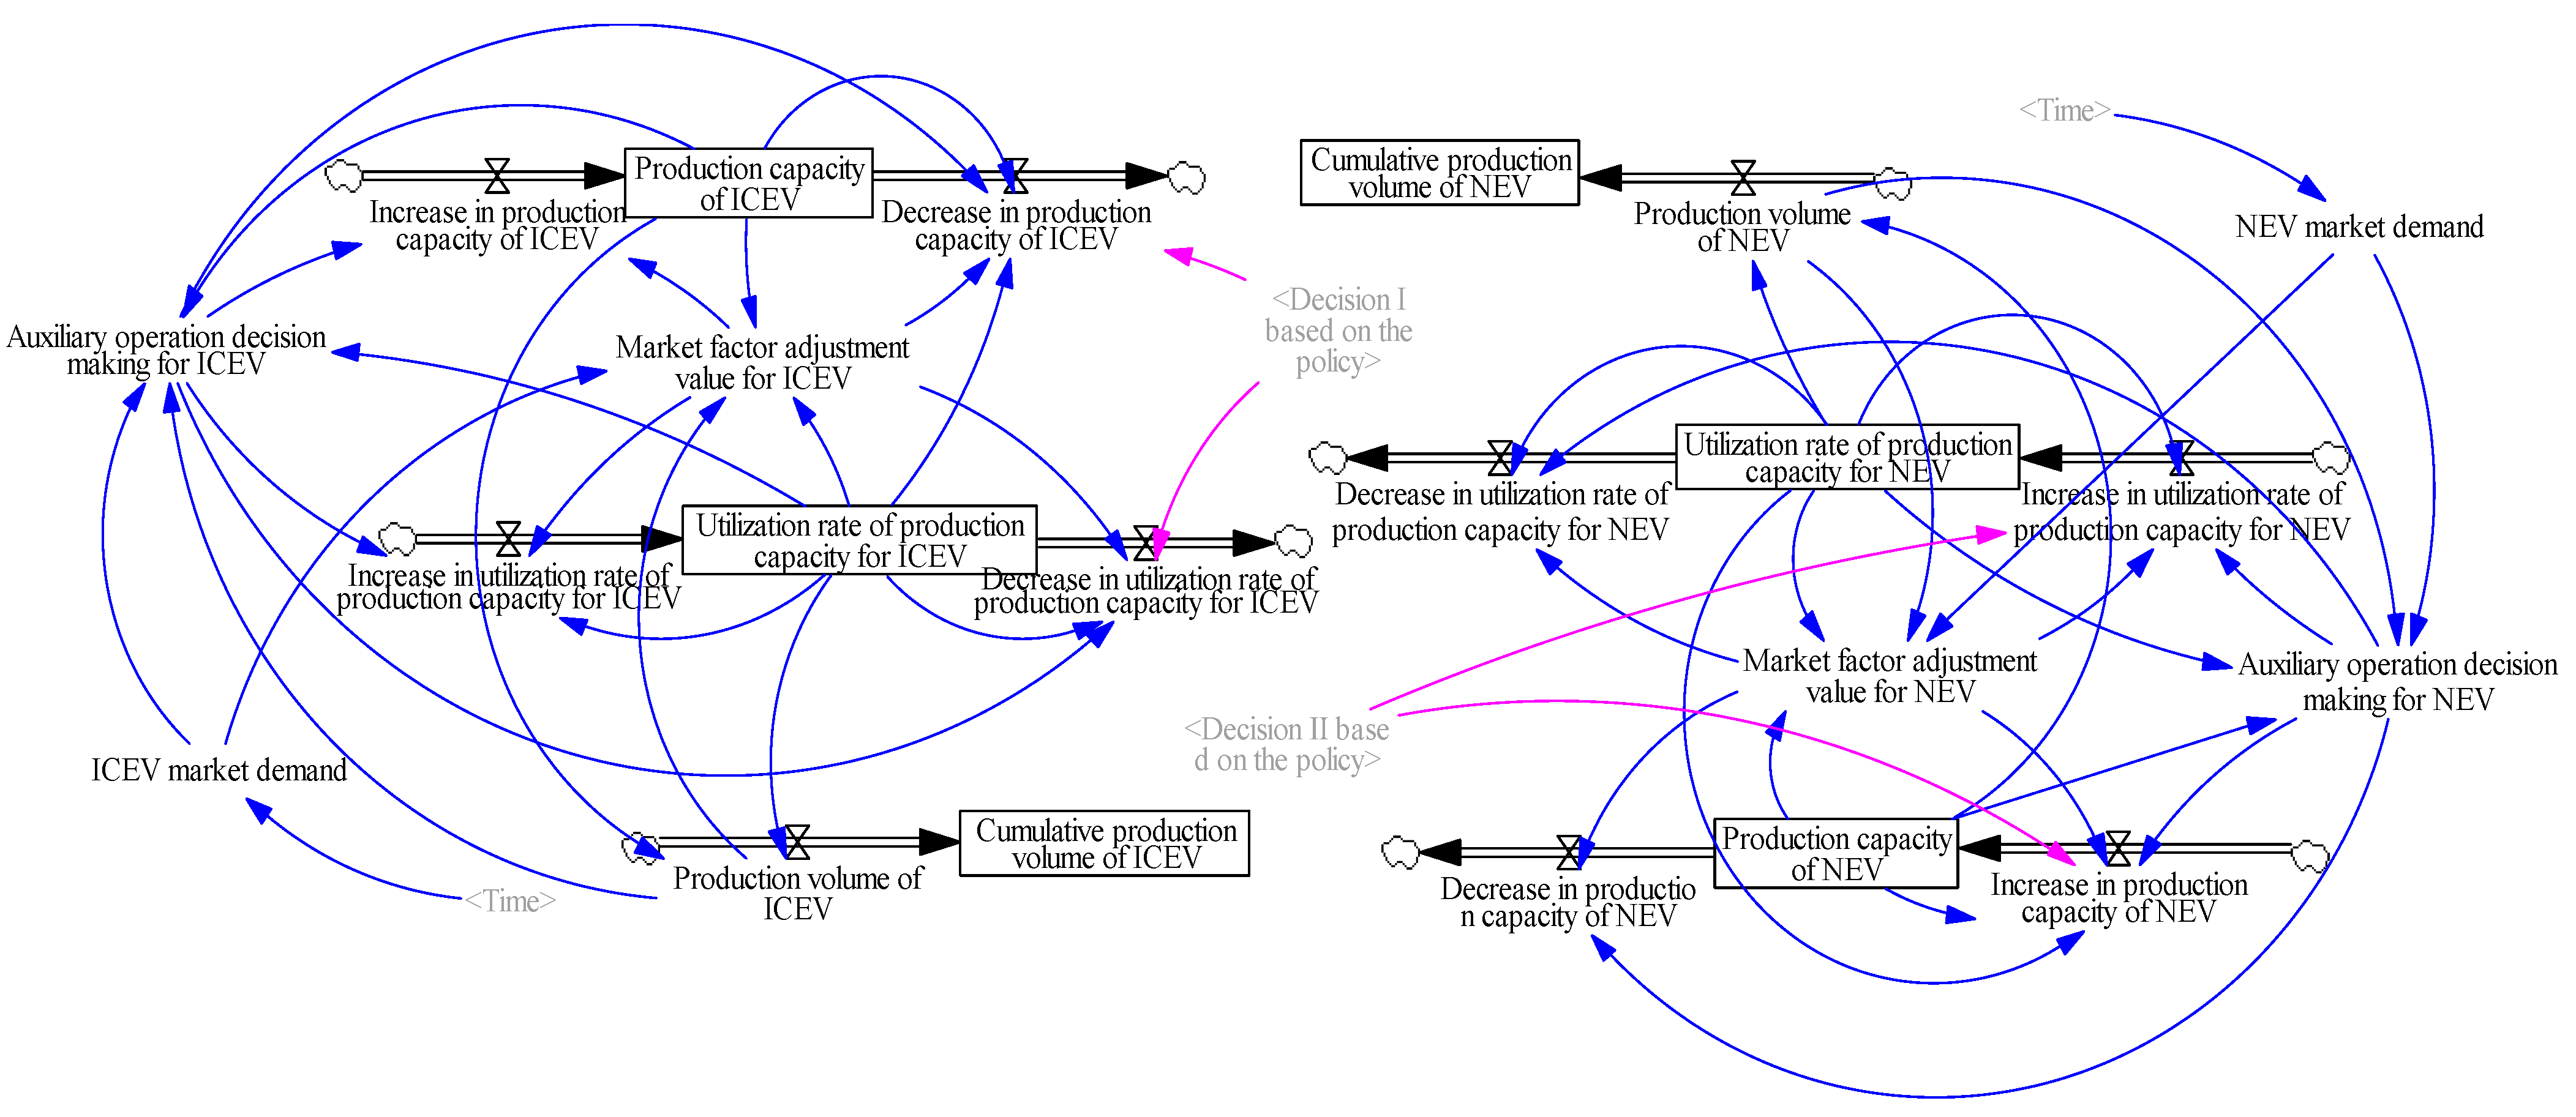
3.2.1. Production Sub-Model

The production sub-model reflects the automotive production processes and decision-making within a vehicle company. Fundamentally, vehicle companies engage in profit-seeking behavior through external market activities and refine their strategies internally. considering the external characteristics of the dual credit policy, there exists a more intimate relationship of response between enterprises and the market as two main stakeholders. This is largely due to the distinct preferences of consumers towards traditional ICEVs and NEVs in terms of attributes and purchase decisions [36]. Consequently, under the impetus of respective market demands, automobile manufacturers primarily adjust the production volume of both vehicle types by manipulating production capacity and capacity utilization rates [11]. As shown in Figure 3, the company produces traditional fuel vehicles and new energy vehicles according to market demands and adjusts production based on purchasing credits from the external credit market. This study assumes that over time, market demand changes, and companies respond to these changes, indicating their operational strategies in both internal combustion engine vehicles and new energy vehicle sectors.
The operating mechanisms for internal combustion engine vehicles and new energy vehicles are detailed in Table 1. When market demand exceeds current production capacity, if the demand increase is less than the potential utilization rate increase, the vehicle company first boosts the utilization rate; if higher, it simultaneously raises capacity while increasing the utilization rate. Conversely, when demand falls below current production, a threshold for capacity utilization is established. If actual utilization is lower than the threshold, it suggests severe overcapacity, warranting a rational decision to reduce capacity. If the adjusted utilization rate after considering market decline is above the threshold, the vehicle company merely adjusts the utilization rate; otherwise, it reduces both utilization and capacity.
Under the influence of the dual-credit policy, companies give priority to producing more new energy vehicles and, based on credit status, may opt for a moderate overproduction of new energy vehicles before considering reducing internal combustion engine vehicle production. The extent of new energy vehicle production increase and internal combustion engine vehicle production decrease is determined by the strictness of the dual-credit policy execution and the company’s credit situation. The auxiliary variable “Policy-based Decision” will be further elaborated in the R&D sub-model.

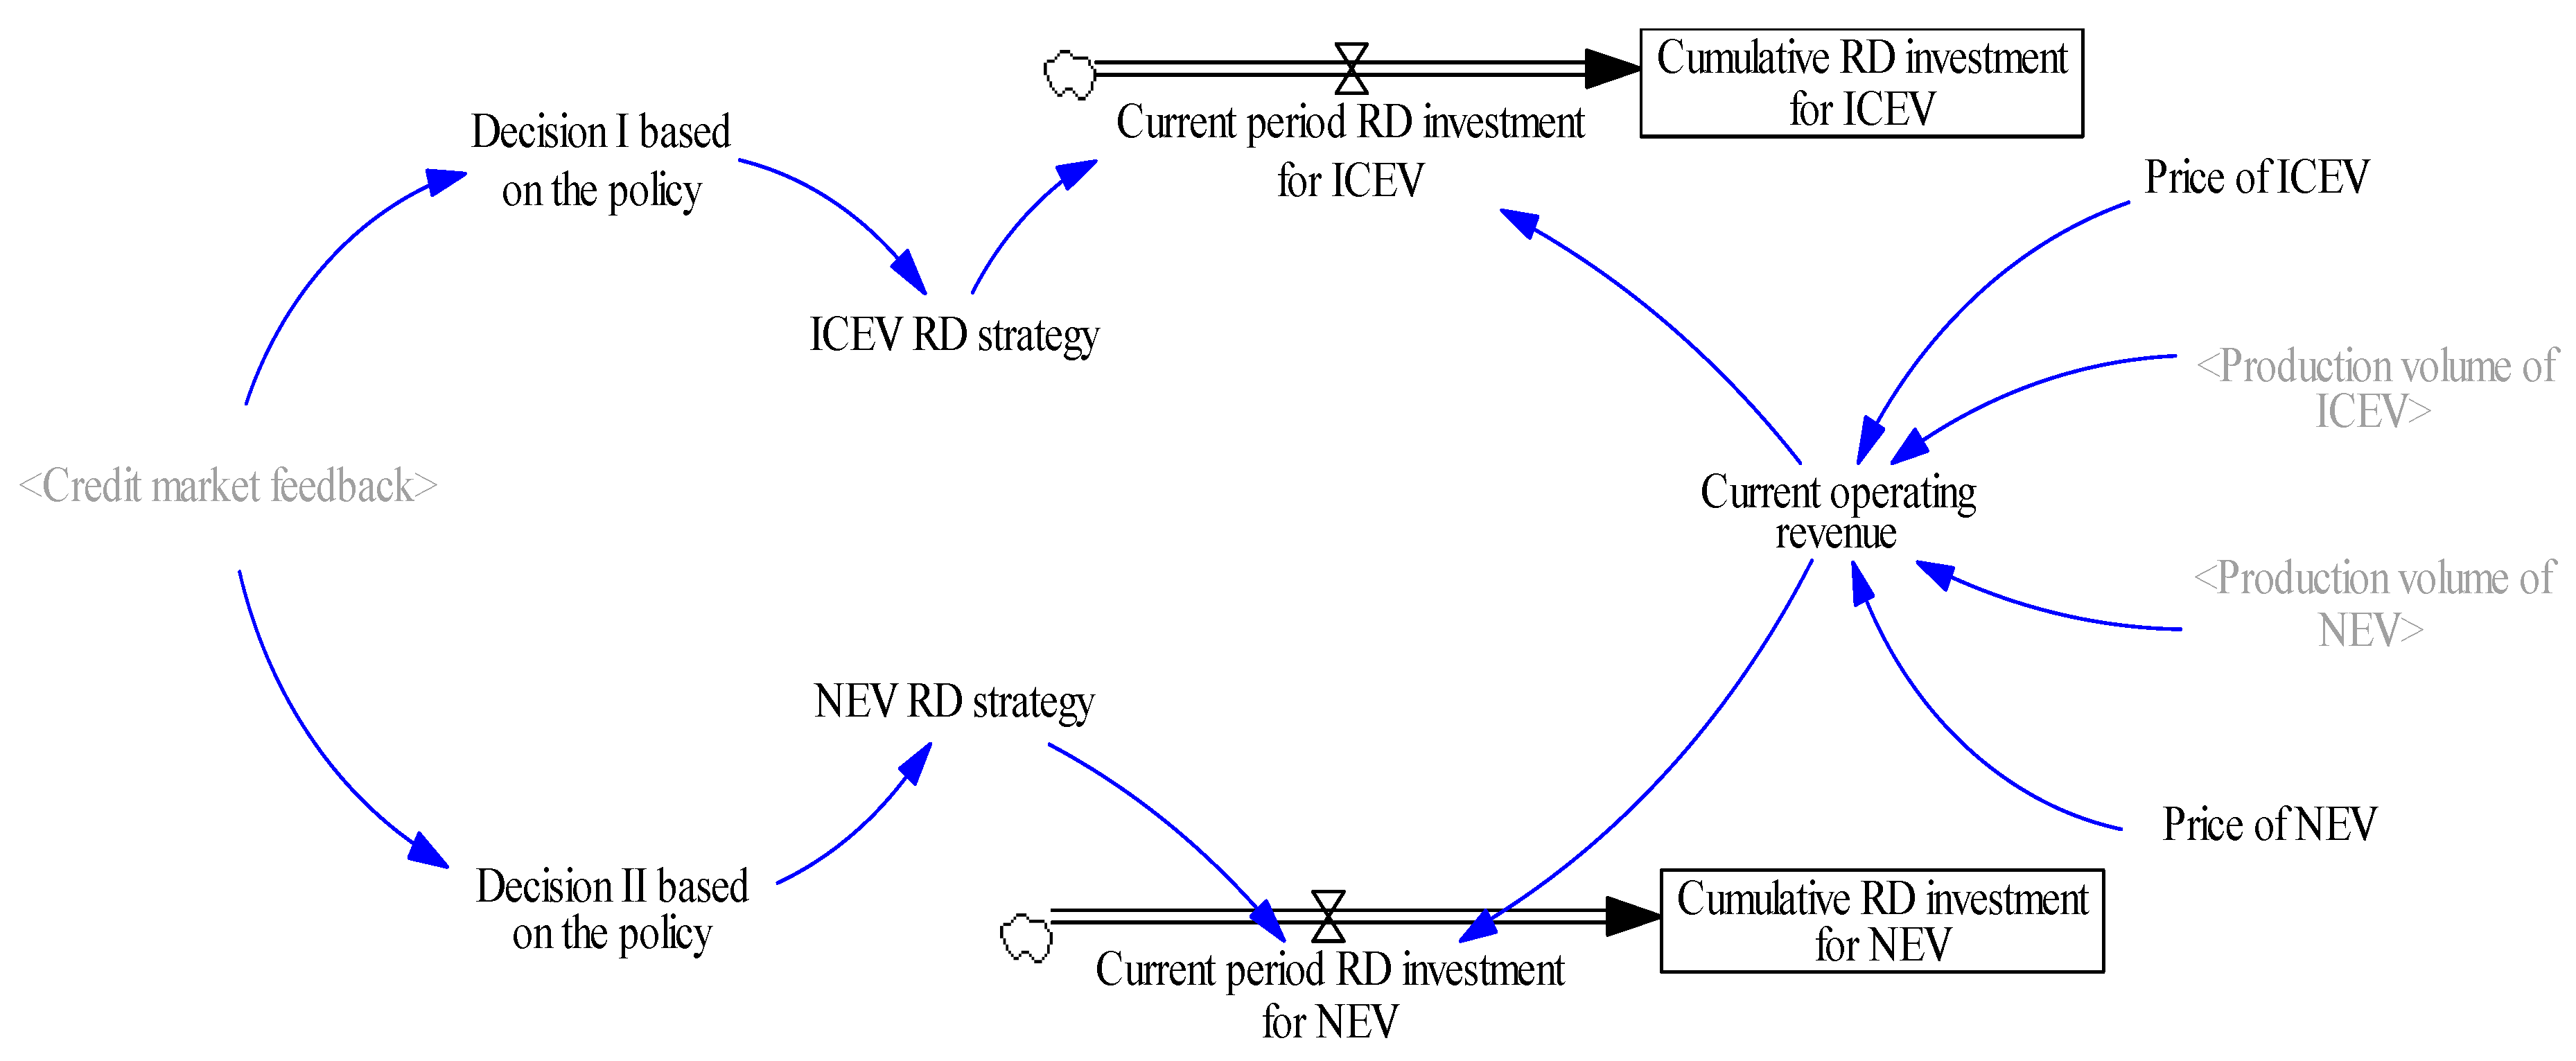
3.2.2. R&D Sub-Model

R&D on engine technology is a primary means to improve fuel economy [22]. Improved fuel economy translates to a lower actual average fuel consumption, and similar logic applies to R&D investments in battery ranges for new energy vehicles [37]. The R&D sub-model is shown in Figure 4. In response to the dual-credit policy, vehicle companies can also consider boosting automotive R&D investment. In the R&D sub-model, the company invests in R&D based on a percentage of revenue. However, the uncertainty in R&D investment and the non-linear nature of learning curves can complicate the analysis of their impact on enterprise strategies. Therefore, this model assumes that passenger vehicle companies adopt a fixed R&D investment strategy. Drawing from annual reports of automotive groups and historical data from “China Passenger Vehicle Enterprise Average Fuel Consumption and New Energy Vehicle Credits Calculation Sheet”, the relationship between R&D investment and vehicle performance is linearly modeled as follows:
Actual value of CAFC = −0.0005 × Cumulative R&D investment for ICEV + 7
Unit credit for NEV = (2 × Cumulative R&D investment for NEV + 3600)/1900
Moreover, if the two types of negative credits cannot be offset, the vehicle company must purchase NEV credits from the external market. This transaction provides feedback to the company, shaping a policy-based decision that not only adjusts the production configuration in the production sub-model but also increases the revenue percentage allocated to R&D expenses for the current period.

3.2.3. Credit Calculation Sub-Model

In the credit calculation sub-model, the credits for CAFC and NEV are computed based on the company’s produced vehicle quantities and performances, following policy-regulated formulas [38]. Since the introduction of the dual-credit policy in 2017, it has achieved positive outcomes in supporting new energy vehicle development. To optimize policy effectiveness and promote high-quality development of energy-saving and new energy vehicle industries in line with carbon neutrality goals, relevant parameters for credit calculations have become stricter over the years [39]. For instance, the multiplication factor for NEV production declined from 5 times in 2017 to 1.6 times in 2023, and the required proportion of NEV credits rose from 10% in 2019 to 18% in 2023. The two formulas for calculating CAFC and NEV credits as per the dual-credit policy are listed in Table 2. Using vehicle production quantities, average fuel consumption rates, and policy-controlled parameters, the model calculates the company’s annual CAFC and NEV credits.

3.2.4. Credit Interaction Sub-Model

In the credit interaction sub-model, the vehicle company’s current CAFC positive credits can carryover or transfer, while CAFC negative credits can be offset by carryover credits, transferred credits, or NEV positive credits. Current NEV credits can carryover, or trade within related companies, and NEV negative credits can be offset by carryover credits or traded credits. As shown in Figure 5, this study stipulates that the order of credit settlement for companies is carryover, transfer between related companies, and then trading in the external credit market. Vehicle companies first use carryover credits to offset negative credits. If there are still CAFC (NEV) negative credits after settling carryovers, the priority for transferring (trading) related companies’ CAFC (NEV) positive credits is from Chinese-owned to joint venture companies. If there are still negative credits after settling with related companies, credits are purchased from the credit market. This assumption conforms to the parallel management rules of the dual-credit policy and reflects the actual conditions of passenger vehicle companies.

3.3. Model Parameter Settings

Data obtained from sources such as group annual reports and credit accounting disclosure tables reveal distinct characteristics in production configurations and credit situations between these two types of companies under the same group. As a representative case, this research selects the Shanghai Automotive Group (SAIC). Specifically, data for conventional companies A and B come from SAIC Volkswagen and SAIC-GM, while data for transitioning company C come from SAIC Motor Passenger Car Company. Table 3 presents the initial and fixed values of the variables for these three companies, providing reasonable estimates for their parameter values.
Regarding the equity-related horizontal alliance under the dual-credit policy, this study explores the credit transfer strategies of transitioning vehicle companies in the context of free riding behavior. This study designs four different scenarios through parameter adjustments, as shown in Table 4 and Table 5. The specific ideas and differences behind these scenarios are explained below:
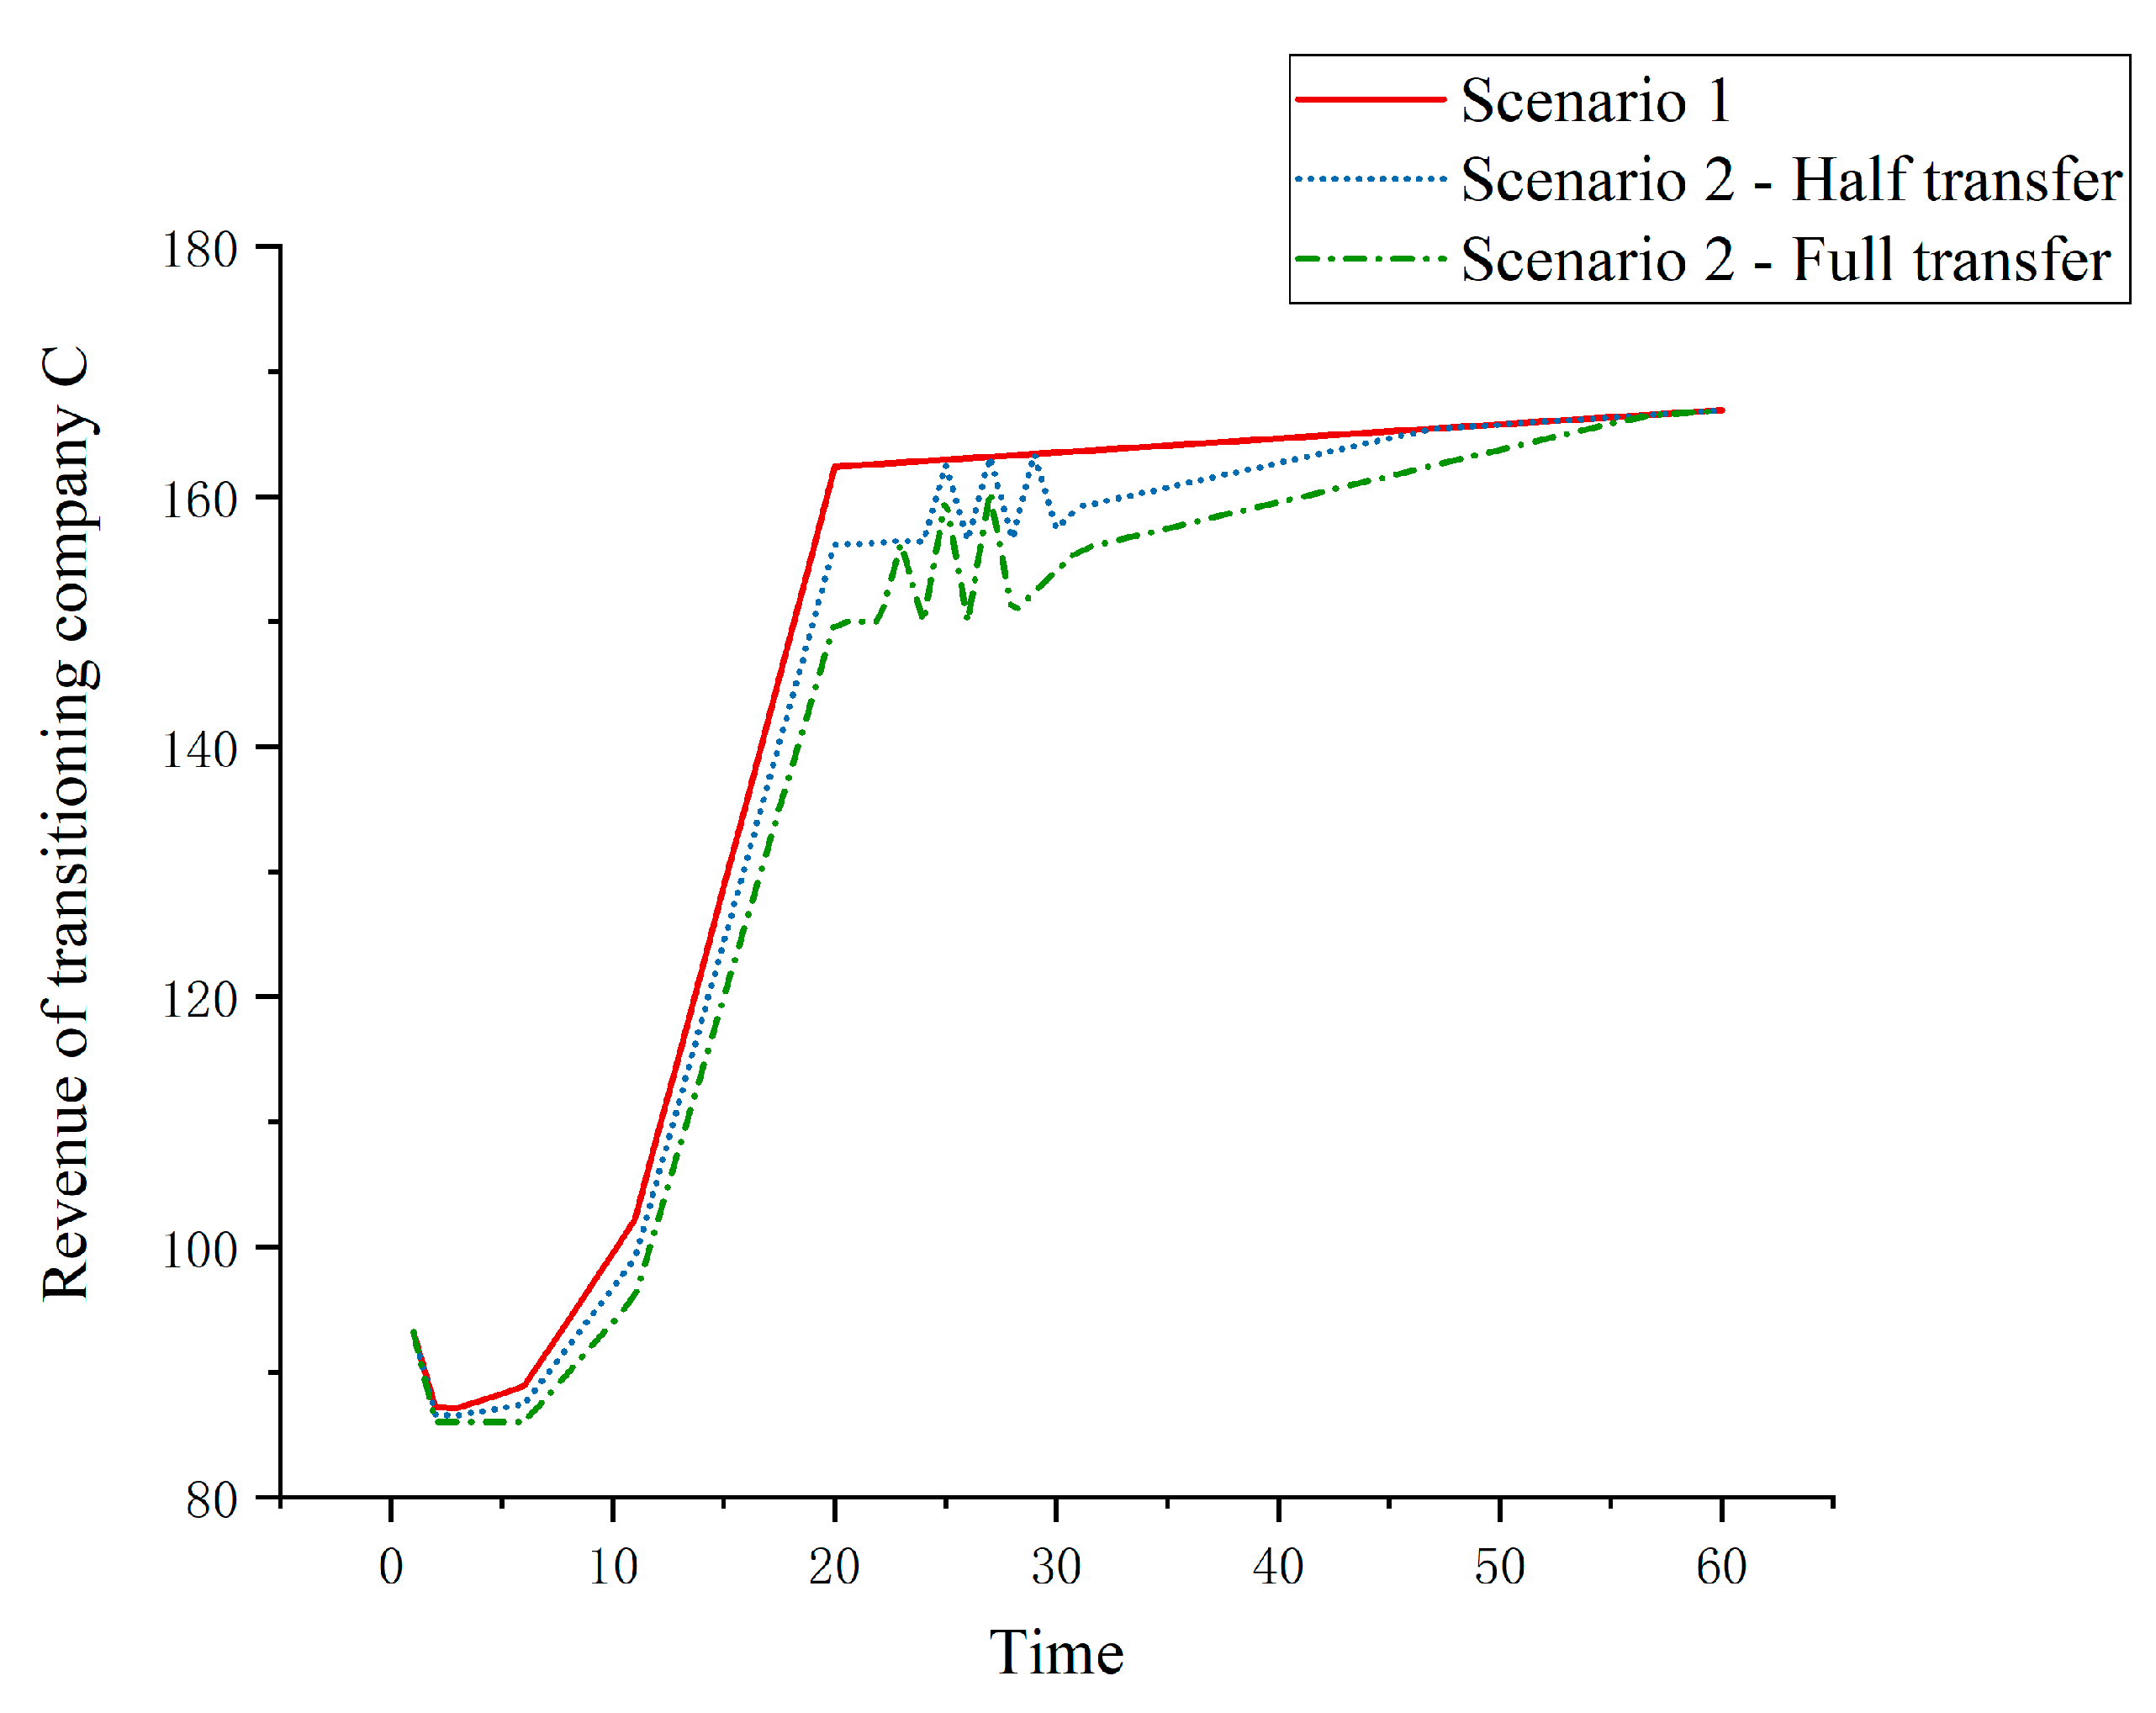
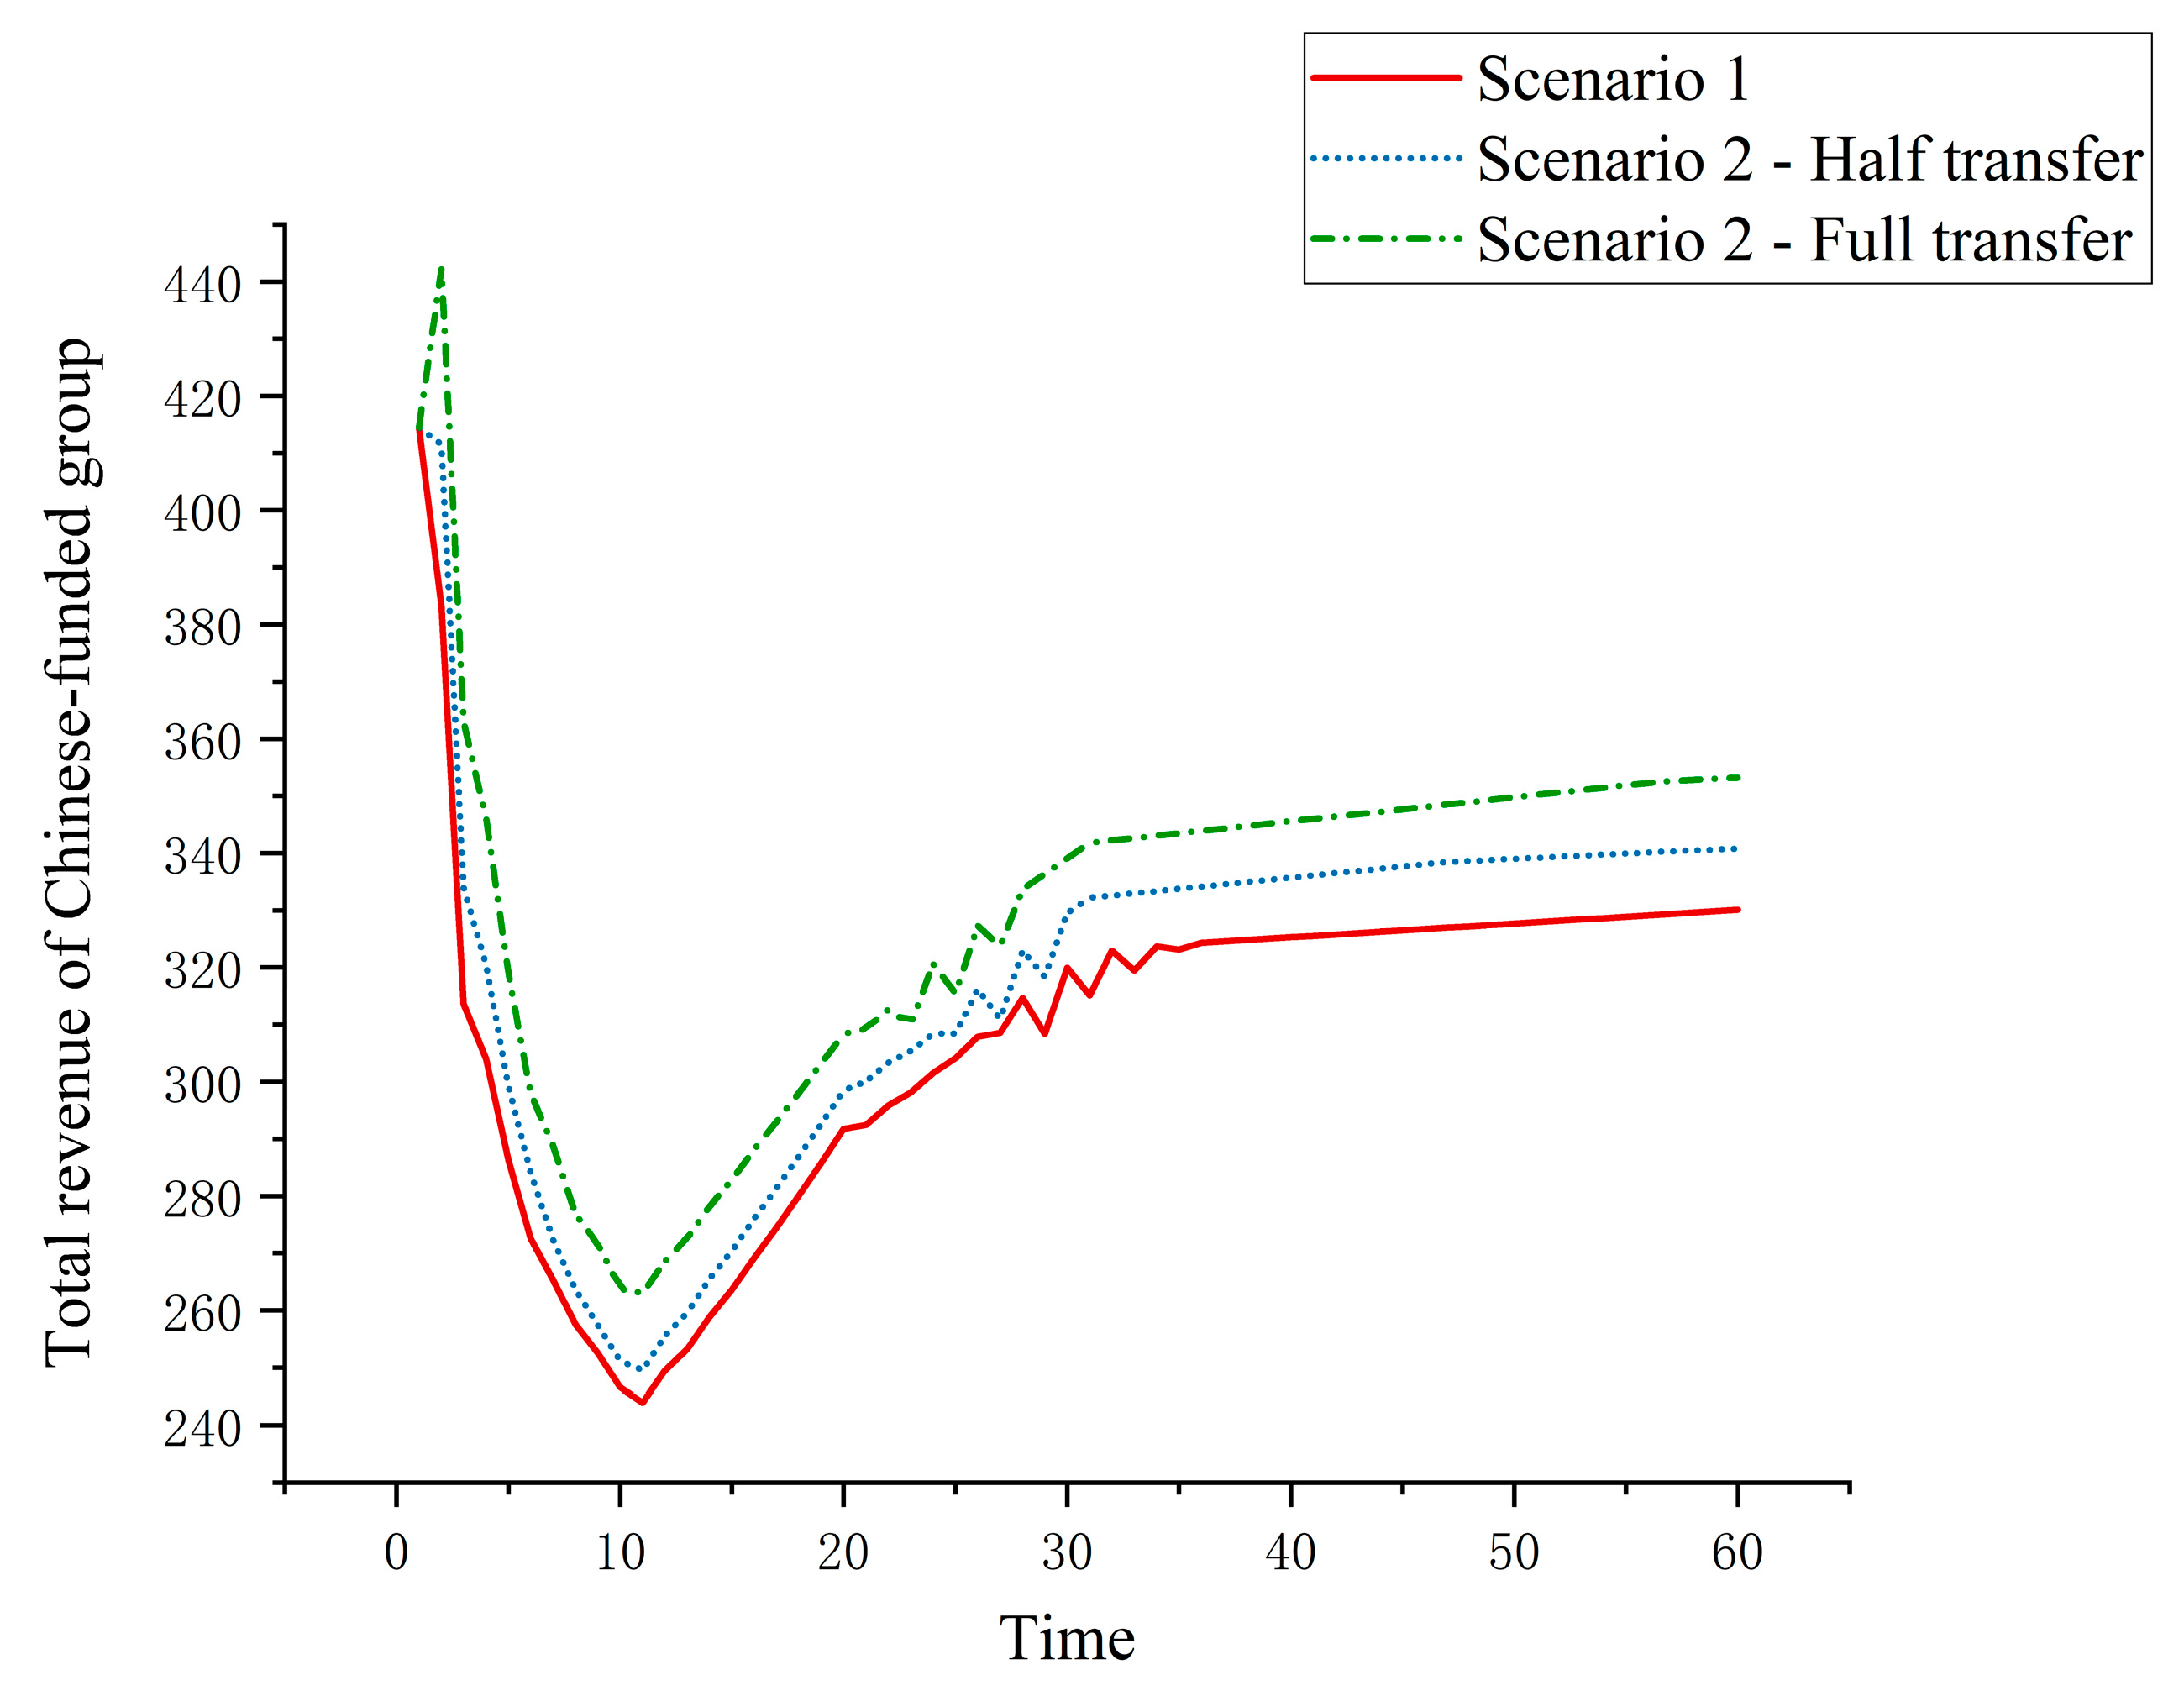
  • Scenario 1: Baseline scenario. Transitioning vehicle companies settle their own credits independently, and there is no credit transfer between equity-related vehicle companies.
  • Scenario 2: Free riding scenario. The transitioning vehicle company considers choosing to partially or fully transfer its surplus credits to traditional vehicle companies. This eases the credit pressure on the traditional companies, weakening their motivation to cut down on fuel vehicle production, thereby exhibiting free riding behavior.
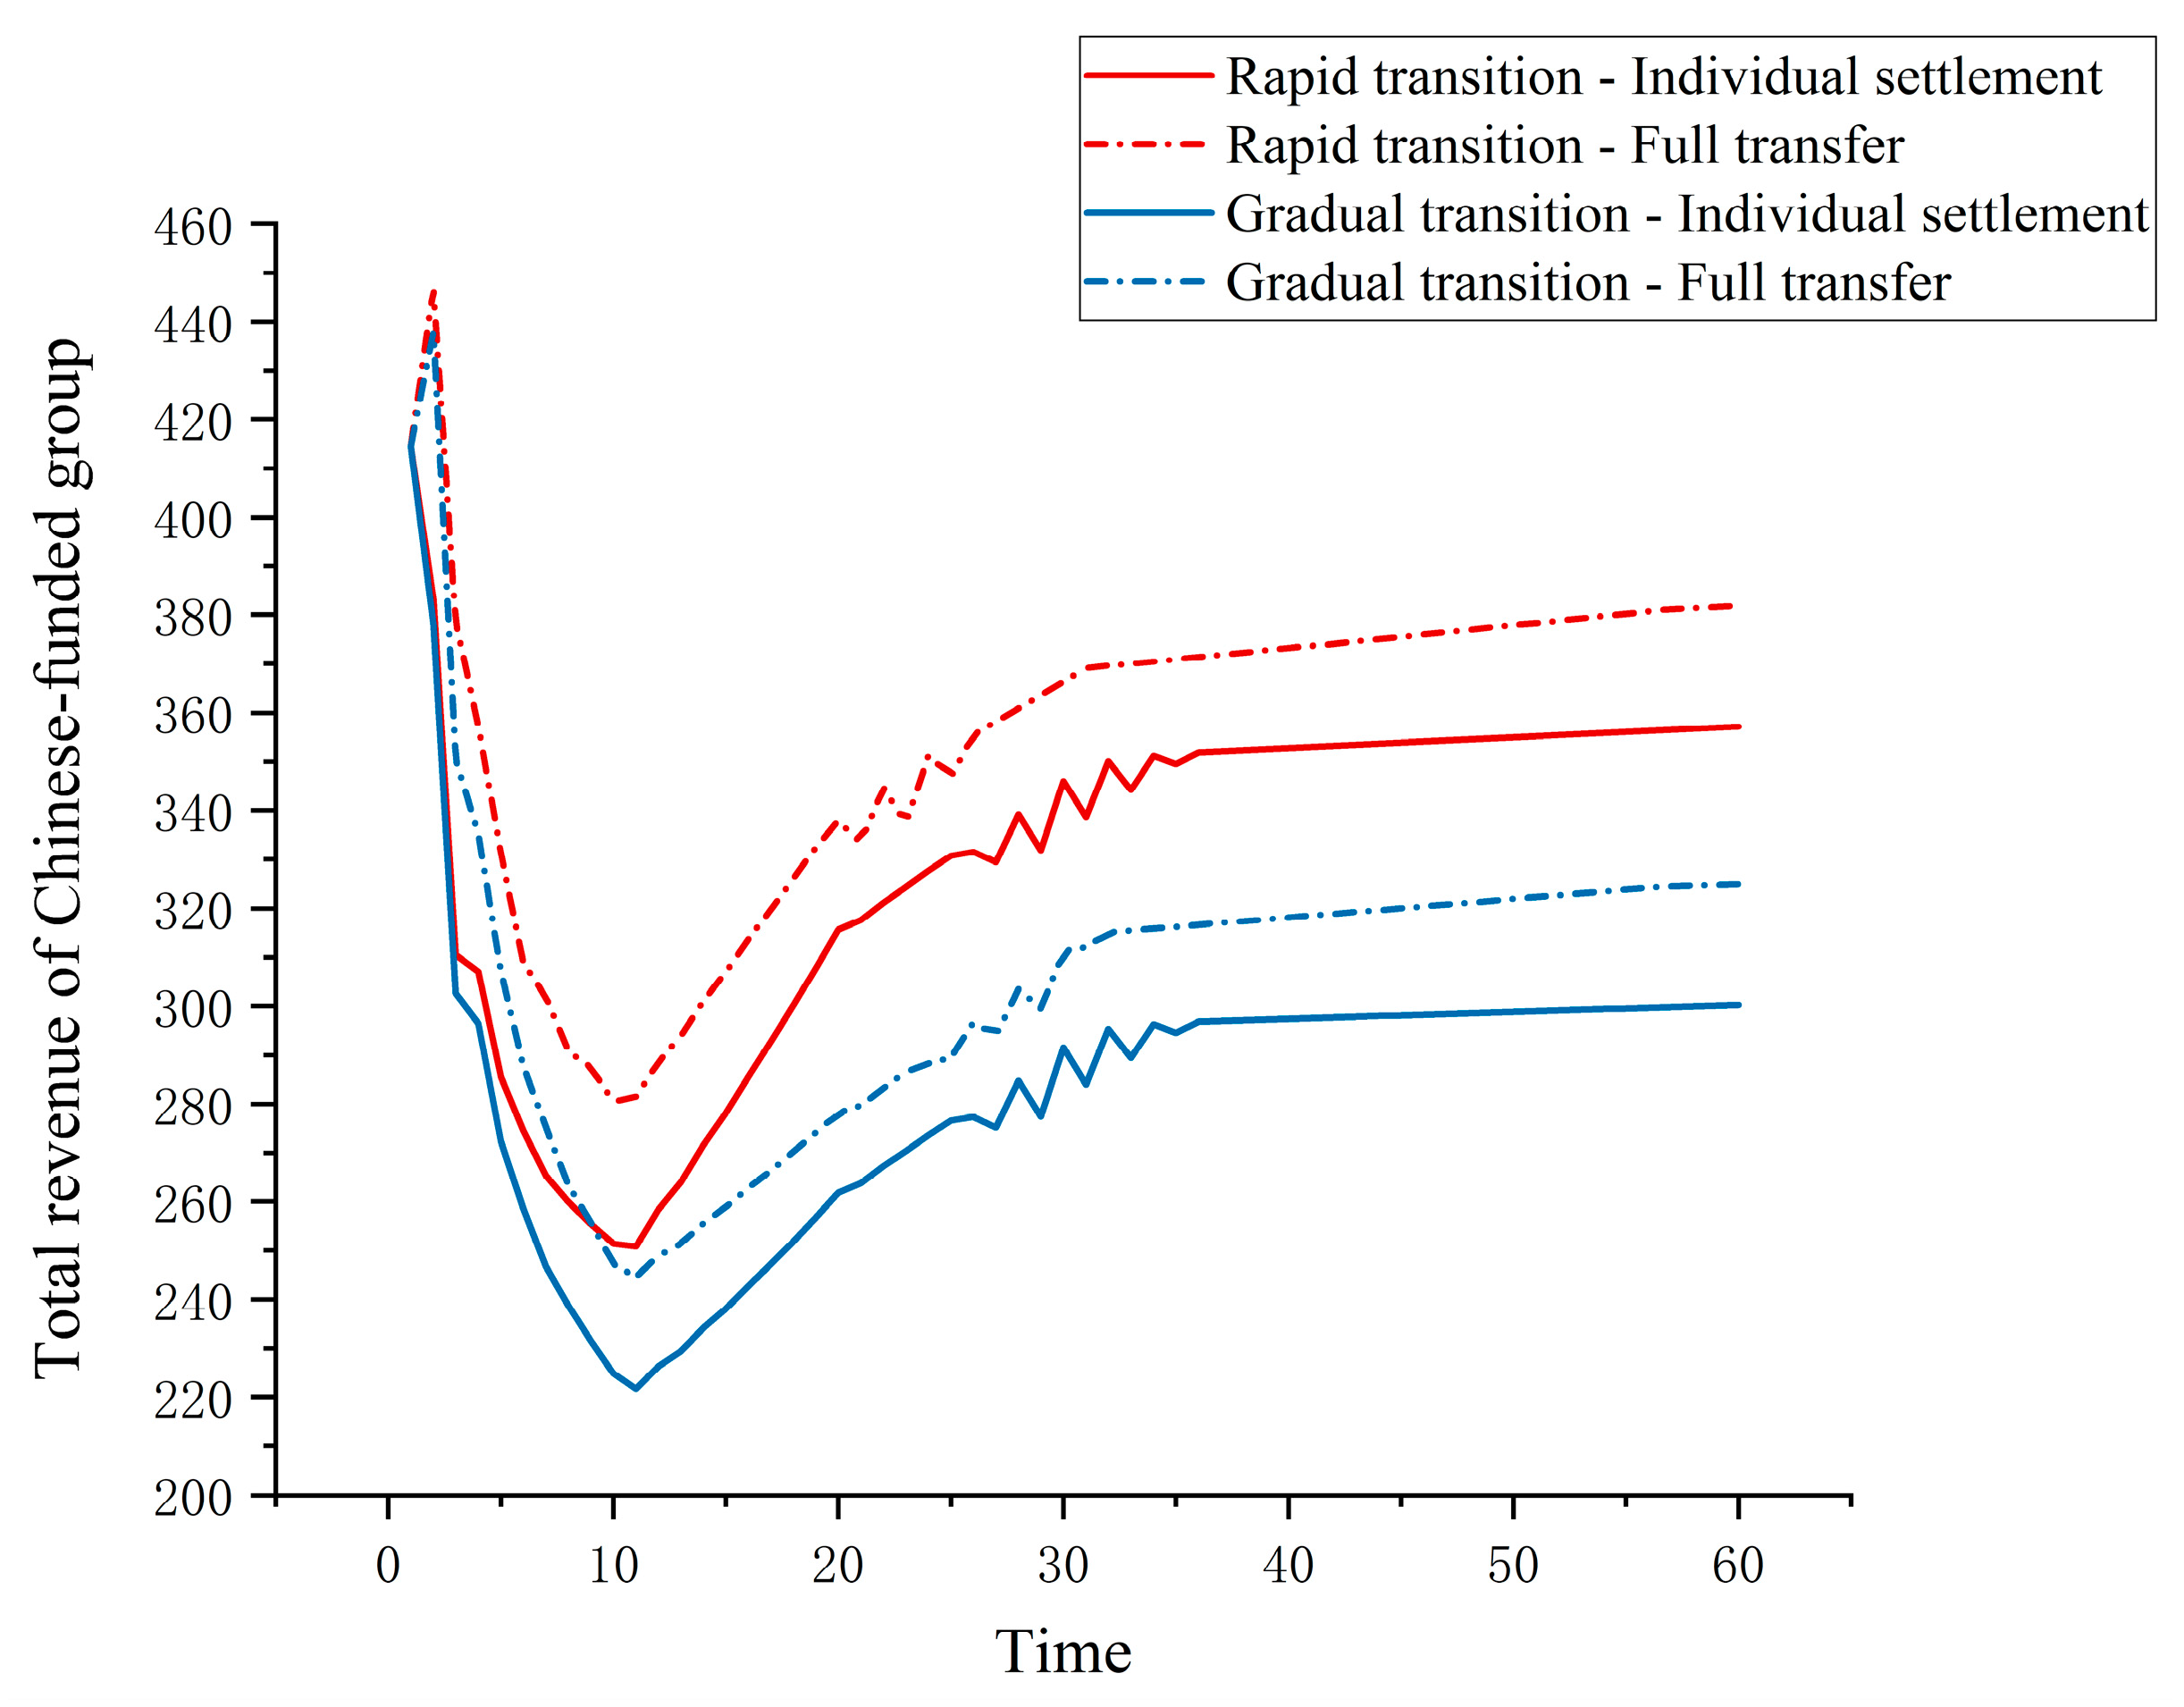
  • Scenario 3: Impact of corporate transition. Building upon Scenarios 1 and 2, this scenario examines the credit transfer strategies of transitioning vehicle companies at varying degrees of transition. Three different situations are set up to form Scenario 3, with parameter adjustments detailed in Table 5.
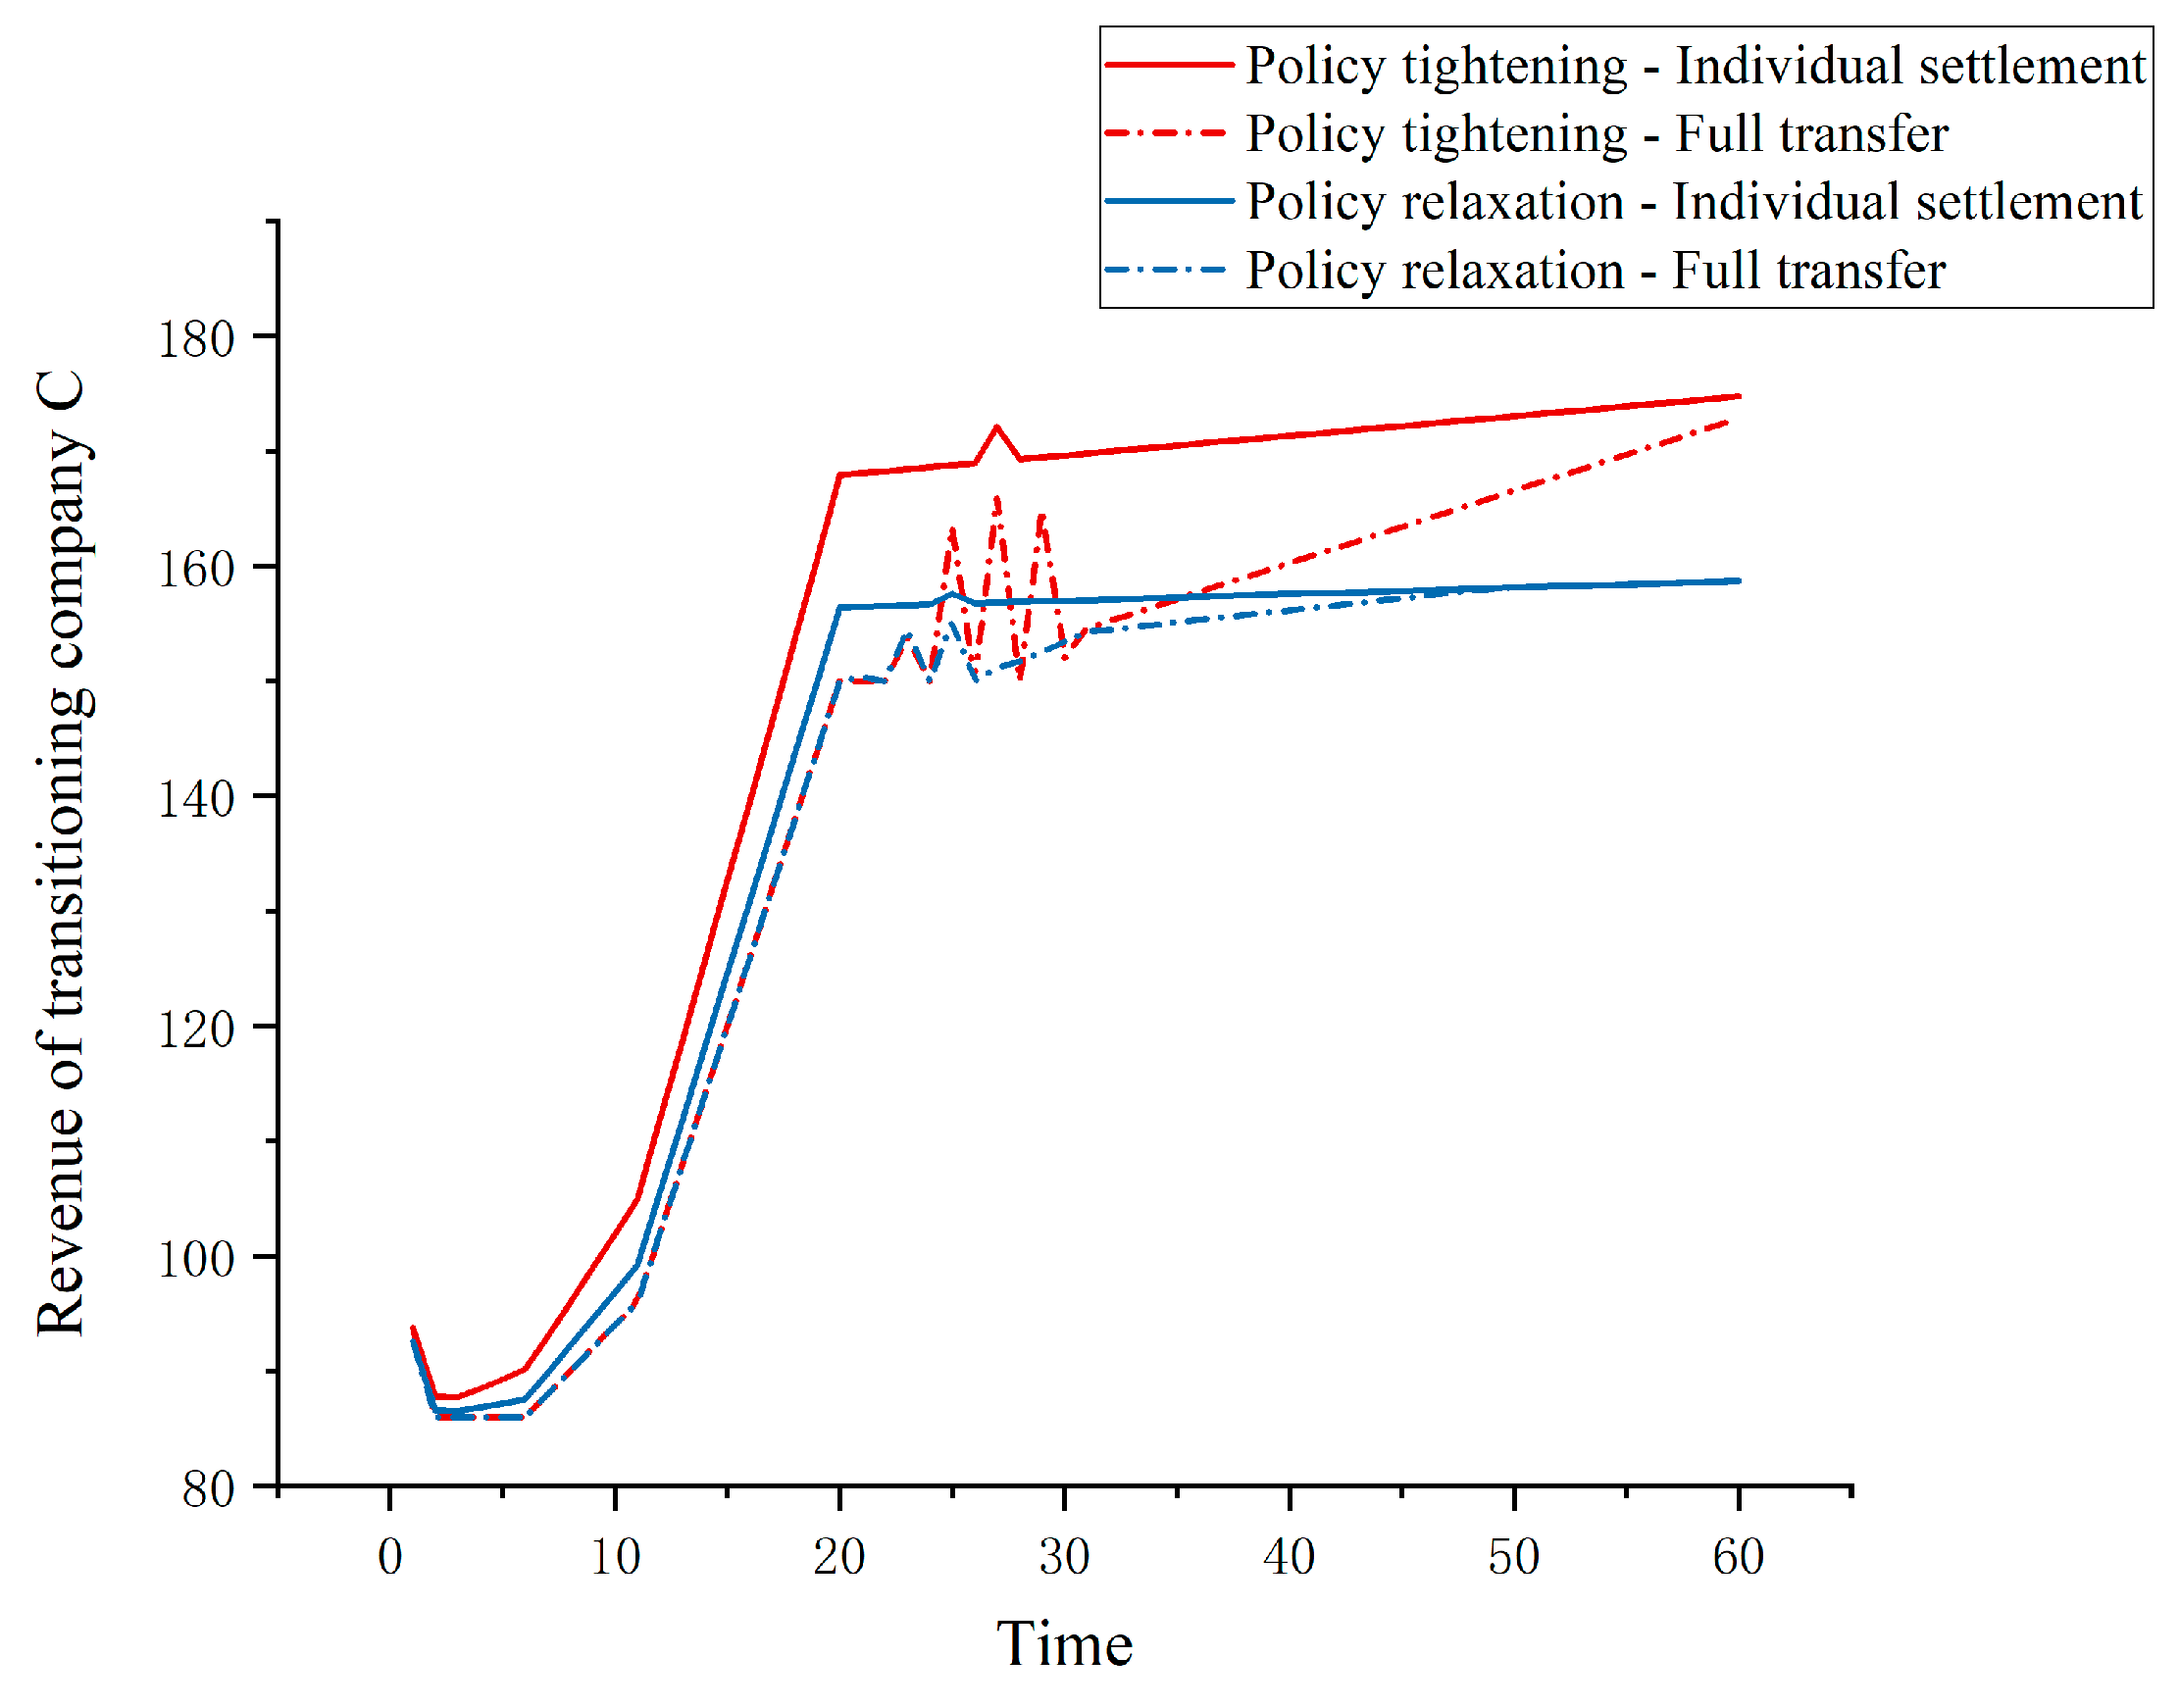
  • Scenario 4: Influence of policy regulation. Also building on Scenarios 1 and 2, this scenario investigates the impacts of varying stringency levels of the dual-credit policy. The policy adjustment parameter chosen is the requirement for the proportion of NEV credits. Details are presented in Table 5, where “time” represents the simulation time in the model. Considering the actual price of NEV credits in recent years, a base unit credit price of 2000 yuan is assigned in the baseline scenario. When the policy tightens, the availability of tradable credits in the market becomes scarce, leading to an increase in the unit credit price. Conversely, when the policy relaxes, the unit credit price decreases.
Table 4. Scenarios 1 and 2 vehicle decision adjustment parameters.
Scenario 1—Separate SettlementsScenario 2—Half TransfersScenario 2—Total Transfer
Transfer coefficient00.250.5
Adjustment of ICEV production for ICEV0%+10%+20%
Table 5. Transitioning vehicle company C’s production strategy and policy credit adjustment parameters.
Transitional car decision-makingSlowBaseFast
Adjustment of NEV production−20%0%+20%
Policy adjustmentBaseAusterityEasing
NEV points ratio requirementsIF THEN ELSE (Time ≤ 18, IF
THEN ELSE (Time ≤ 2, 0,
0.1 + 0.02 × (Time − 3)), 0.4)
IF THEN ELSE (Time ≤ 18, IF THEN ELSE (Time ≤ 2, 0,
0.1 + 0.03 × (Time − 3)), 0.55)
IF THEN ELSE (Time ≤ 18, IF
THEN ELSE (Time ≤ 2, 0,
0.1 + 0.01 × (Time − 3)), 0.25)
Credit price0.20.30.1

4. Simulation Analysis

4.1. Sensitivity Analysis

This paper conducts relevant tests on the model. Based on a thorough review of existing research results and actual conditions, it meticulously revises and enhances the causal diagrams and flowcharts within the model, ensuring that extraneous research variables are not included. With an annual time step, a total of 60 simulation periods are executed, starting from an initial time of 0. The system dynamics model constructed in this research is simulated using Vensim PLE 7.3.5.
Sensitivity analysis examines whether conclusions significantly change in a manner relevant to the objective when assumptions vary within a reasonable range of uncertainty. To conduct a sensitivity analysis on the revenues of automobile manufacturers, three indicators—NEV market demand, ICEV market demand, and the credit transfer coefficient—were each increased by 5%. The simulation forecasts obtained using Vensim PLE 7.3.5 were compiled into a dataset, represented as Table 6. Observations from the table indicate that despite varying influencing factors, the trends in revenue changes align consistently. The simulation outcomes closely match the known patterns observed in the real world, thereby validating the system dynamics model established in this paper.

4.2. Free Riding Behavior and Credit Transfer Decisions

Under Scenario 1 and Scenario 2, the annual operating revenue of transitioning vehicle companies C is shown in Figure 6. As a company involved in both traditional fuel cars and new energy vehicles, this revenue includes the performance of its own two types of vehicle businesses, along with income from selling surplus NEV credits or expenses from purchasing NEV credits. Additionally, the Chinese capital group holds a 50% stake in each of the two traditional companies, thereby gaining a corresponding share of their operational performance. In Scenario 1, where all three companies settle credits independently, the annual revenue of the transitioning company rapidly rises during the first 20 periods and slows down after the transition, as it accumulates more credits by improving vehicle performance and increases corporate performance through credit trading. In Scenario 2, the transitioning company C transfers credits to its equity-affiliated horizontal alliance partners, traditional companies A and B, offsetting their negative credits free of charge.
As seen in Figure 6, when transitioning company C transfers surplus credits to its equity-related companies in Scenario 2, its operating revenue is lower compared with settling credits individually. The underlying reason is that traditional companies A and B benefit from the credit transfer, reducing their pressure on credits and consequently slowing down the pace of cutting production of fuel cars. With reduced demand for purchasing credits from the external market, there is also a decreased incentive effect on adjusting the production strategies of traditional companies A and B, leading to a decrease in the annual average proportion of new energy vehicle production. This causes a higher amount of negative credits annually compared with Scenario 1, necessitating the transitioning company C to transfer more credits over a longer period, which reduces the number of NEV credits available for sale in the credit trading market. If all credits can be transferred, the annual average revenue of the transitioning company C decreases by 3.63% compared with Scenario 1. Conversely, as shown in Figure 7, the overall operating performance of the group indicates that in Scenario 1, traditional companies A and B purchase credits externally. This causes them to reduce production and hence lower their operating income, reducing the total profits attributable to the Chinese capital group. Under Scenario 2, with smaller production cuts by traditional companies, the difference in sales revenues from fuel cars outweighs the income gap from the transitioning company C selling credits. When transitioning company C transfers all its surplus credits, the group attains the highest profit.

4.3. Impacts of Company Transition

Scenario 3 compares the annual revenue results of transitioning company C under different transition speeds. The annual revenue of the transitioning company is illustrated in Figure 8. When the transitioning company C undergoes rapid transition and the credits are settled independently among the three companies, company C has the highest revenue. On the other hand, when the transitioning company C transitions slowly and transfers all current-period credits, its revenue is at its lowest. Regardless of the transition speed, the revenue of transitioning company C still inversely correlates with the transfer coefficient. Furthermore, when transitioning quickly, not transferring any credits leads to a 3.71% higher average annual revenue for company C compared with fully transferring credits, and this percentage increases to 3.45% when transitioning slowly. Therefore, the higher the proportion of surplus credits transferred by transitioning company C, the lower its revenue, and the faster the transition speed, the greater the cumulative revenue disparity. Additionally, the speed of the transition of company C does not affect the timing at which the average annual revenue plateaus across scenarios.
For the Chinese capital group, the total operating revenue resulting from the transition of company C is depicted in Figure 9. Similar to Scenarios 1 and 2, under the rapid or slow transition of company C, the higher the credit transfer ratio, the higher the group’s total operating income. This is because the transition of company C does not reverse the degree of free riding by traditional companies A and B, who continue to adjust production according to the credit transfer ratio. Moreover, the compression of fuel car production by traditional companies A and B affects the group’s total revenue in the early stages, with the allowance of credit transfer enhancing early-stage performance. An increase in the transition speed of company C brings about more revenue in later stages; thus, when company C transforms rapidly and transfers all surplus credits, the group achieves the highest total revenue. Independently settling credits does not affect traditional companies’ purchases of credits due to the transition speed of the transitioning company. However, when all credits are transferred by the transitioning company, the faster the transition speed, and the fewer credits the group needs to buy from the market.

4.4. Impact of Policy Regulation

Scenario 4 compares the annual revenue of transitioning company C under varying degrees of policy tightness, as shown in Figure 10. When policies become stringent, the NEV credit ratio requirement increases, and the three companies settle credits independently, and the revenue of transitioning company C is at its highest. When policy requirements tighten, companies receive fewer credits, and the supply of credits in the external market also shrinks, causing credit prices to rise. This increased credit price benefits transitioning company C, which does not need to assist affiliated companies, resulting in a 6.22% higher average annual revenue when settling credits independently compared with fully transferring, while under loose policy conditions, the difference is only 1.63%. As seen in Figure 10, under different levels of policy tightness, the revenue of transitioning company C continues to form an inverse relationship with the transfer coefficient, with credit prices amplifying differences in corporate revenues. Furthermore, if transitioning company C chooses to transfer all surplus credits to traditional companies A and B, its revenue stays relatively constant in the first 20 periods. Due to policy adjustments, the significant negative credit balance from the large-scale production of fuel cars by traditional companies A and B leaves transitioning company C with no surplus credits to sell and thus no related revenue.
Figure 11 shows the total operating revenue of the Chinese capital group. Based on the parameters of Scenarios 1 and 2, under both relaxed and tightened policy regulations, if a horizontal alliance strategy involves the full transfer of surplus credits, the group realizes higher revenue performance. Under tightened policy conditions, compared with relaxed or standard policy scenarios, joint ventures generate more negative credits, leading to a lower level of total revenue in the early to mid-simulation periods due to a combination of increased credit prices caused by a reduction in market supply and the compressed production of fuel cars following the purchase of credits. Once the three companies complete their transitions and contribute credits to the market, the total revenue of the Chinese capital group rebounds and exceeds that under other policy regulation scenarios.

5. Conclusions and Implications

5.1. Conclusions

This study focuses on a specific form of affiliation that arises in response to the dual-credit policy—a horizontal equity-based alliance. In this alliance, a representative Chinese-funded transitioning vehicle company collaborates with two joint venture traditional company collaborates. This study employs agent-based modeling concepts and develops a system dynamics model to explore the effects of policy mechanisms and credit free riding behavior on company operations.
Through multi-scenario simulation analysis, the following is demonstrated: (1) When the transitioning vehicle company allows credit transfers, an increase in the transfer ratio negatively impacts the transitioning company’s revenue performance, but it weakens the willingness for drastic production cuts among traditional auto companies, thus indirectly contributing to improved overall alliance performance. (2) Under free riding, accelerating the transition towards new energy vehicles amplifies the effect on the transitioning company’s performance. Stringent policy requirements enhance the role of increasing the credit transfer ratio in boosting overall alliance performance. A decline in credit prices mitigates the extent to which a high credit transfer ratio depresses the transitioning company’s revenue.
According to the findings, traditional vehicle companies, considering factors such as market demand for fossil-fuel vehicles and their business strategies, face difficulties in transitioning to green technology. And stringent policy requirements could lead to profit losses due to insufficient credit generation. However, the policy allowing credit transfers provides traditional vehicle companies within the alliance an opportunity to “free-ride” on the credits of transitioning companies. It alleviates their immediate transition pressures under the policy, potentially providing a positive effect on the alliance. It is also noted that such free riding behavior might dampen the transitioning company’s enthusiasm for green innovation and transition.

5.2. Implications

For practitioners, our research underscores the importance of strategic decision-making in credit allocation within alliances. Transitioning vehicle companies must delicately balance individual profitability against the collective performance of the alliance. Our findings suggest that, practically, these companies could adopt flexible credit transfer strategies that adjust based on market conditions and policy stringency. By doing so, they can maximize the value of their credits while supporting the gradual transition of traditional partners towards producing electric vehicles.
In the domain of electric vehicle industry evolution, this study enriches the understanding of strategic management and organizational behavior in the context of environmental policy-driven collaborations. It introduces a new dimension to the analysis of coordination strategies within horizontal alliances, especially under regulatory frameworks that incentivize green transition. The integration of agent-based modeling and system dynamics offers a powerful toolset for analyzing complex systems influenced by policy mechanisms, setting a foundation for future theoretical advancements.
The present study has certain limitations that call for further research. It assumes that the transitioning vehicle company transfers credits gratuitously and with a fixed transfer ratio. It does not consider contractual arrangements for credit transfers or the dynamic adjustment of the transfer ratio. Moreover, the technical performance of vehicles plays a critical role in the effectiveness of the dual-credit policy. Future studies could delve into innovation decisions made by enterprises in horizontal strategic alliances with free riding behavior under the dual-credit policy.

Author Contributions

Methodology, Z.Z.; resources, Z.Z. and Y.S.; data curation and analysis, Z.Z. and Y.S.; writing—original draft preparation, Z.Z. and Y.S.; writing—review and editing, Z.Z. and Y.S.; supervision, Z.Z. All authors have read and agreed to the published version of the manuscript.

Funding

This research was funded by the National Social Science Fund of China, grant number 19CGL056.

Data Availability Statement

Data available on request due to restrictions eg privacy or ethical. The data presented in this study are available on request from the corresponding author.

Conflicts of Interest

The authors declare no conflicts of interest.

References

  1. Ma, M.; Meng, W.; Huang, B.; Li, Y. The influence of dual credit policy on new energy vehicle technology innovation under demand forecast information asymmetry. Energy 2023, 271, 127106. [Google Scholar] [CrossRef]
  2. Li, B.; Chen, Y.; Cao, S. Carrot and stick: Does dual-credit policy promote green innovation in auto firms? J. Clean. Prod. 2023, 403, 136863. [Google Scholar] [CrossRef]
  3. Li, Y.; Zhang, Q.; Li, H.; Tang, Y.; Liu, B. The impact of dual-credit scheme on the development of the new energy vehicle industry. Energy Procedia 2019, 158, 4311–4317. [Google Scholar] [CrossRef]
  4. Li, J.; Ku, Y.; Yu, Y.; Liu, C.; Zhou, Y. Optimizing production of new energy vehicles with across-chain cooperation under China’s dual credit policy. Energy 2020, 194, 116832. [Google Scholar] [CrossRef]
  5. Panico, C. Strategic interaction in alliances. Strateg. Manag. J. 2017, 38, 1646–1667. [Google Scholar] [CrossRef]
  6. Yan, N.; Zhang, Y.; Xu, X.; Gao, Y. Online finance with dual channels and bidirectional free-riding effect. Int. J. Prod. Econ. 2021, 231, 107834. [Google Scholar] [CrossRef]
  7. Li, R.; Yan, J.-J.; Wang, X.-Y. Horizontal cooperation strategies for competing manufacturers in a capital constrained supply chain. Transp. Res. Part E Logist. Transp. Rev. 2024, 181, 103369. [Google Scholar] [CrossRef]
  8. Wang, Y.; Zhang, X.; Cheng, T.C.E.; Wu, T.H. Choice of the co-opetition model for a new energy vehicle supply chain under government subsidies. Transp. Res. Part E. Logist. Transp. Rev. 2023, 179, 103326. [Google Scholar] [CrossRef]
  9. Cong, L.; Jie, L.; Lu, S.; Yan, Z. Contract Design to Incentive Supplier Innovation under Dual-Credit Policy. Chin. J. Manag. 2022, 19, 928. [Google Scholar]
  10. Yang, D.-X.; Yang, L.; Chen, X.-L.; Wang, C.; Nie, P.-Y. Research on credit pricing mechanism in dual-credit policy: Is the government in charge or is the market in charge? Environ. Dev. Sustain. 2023, 25, 1561–1581. [Google Scholar] [CrossRef]
  11. Li, Y.; Zhang, Q.; Liu, B.; McLellan, B.; Gao, Y.; Tang, Y. Substitution effect of New-Energy Vehicle Credit Program and Corporate Average Fuel Consumption Regulation for Green-car Subsidy. Energy 2018, 152, 223–236. [Google Scholar] [CrossRef]
  12. Ou, S.; Lin, Z.; Qi, L.; Li, J.; He, X.; Przesmitzki, S. The dual-credit policy: Quantifying the policy impact on plug-in electric vehicle sales and industry profits in China. Energy Policy 2018, 121, 597–610. [Google Scholar] [CrossRef]
  13. He, X.; Ou, S.; Gan, Y.; Lu, Z.; Przesmitzki, S.V.; Bouchard, J.L.; Sui, L.; Amer, A.A.; Lin, Z.; Yu, R.; et al. Greenhouse gas consequences of the China “dual-credit” policy. Nat. Commun. 2020, 11, 5212. [Google Scholar] [CrossRef] [PubMed]
  14. Chen, K.; Zhao, F.; Hao, H.; Liu, Z.; Liu, X. Hierarchical Optimization Decision-Making Method to Comply with China’s Fuel Consumption and New Energy Vehicle Credit Regulations. Sustainability 2021, 13, 7842. [Google Scholar] [CrossRef]
  15. Zhang, H.; Zhao, F.; Hao, H.; Liu, Z. Effect of Chinese Corporate Average Fuel Consumption and New Energy Vehicle Dual-Credit Regulation on Passenger Cars Average Fuel Consumption Analysis. Int. J. Environ. Res. Public Health 2021, 18, 7218. [Google Scholar] [CrossRef] [PubMed]
  16. Lou, G.; Ma, H.; Fan, T.; Chan, H.K. Impact of the dual-credit policy on improvements in fuel economy and the production of internal combustion engine vehicles. Resour. Conserv. Recycl. 2020, 156, 104712. [Google Scholar] [CrossRef]
  17. He, H.; Zhang, C.; Li, S.; Sun, Y.; Zhang, J.; Sun, Q. Dual-credit price variation and optimal electrification timing of traditional automakers: A dynamic programming approach. J. Clean. Prod. 2022, 353, 131593. [Google Scholar] [CrossRef]
  18. Zhou, D.; Yu, Y.; Wang, Q.; Zha, D. Effects of a generalized dual-credit system on green technology investments and pricing decisions in a supply chain. J. Environ. Manag. 2019, 247, 269–280. [Google Scholar] [CrossRef] [PubMed]
  19. Xiao, L.; Chen, Z.-S.; Hou, R.; Mardani, A.; Skibniewski, M.J. Greenness-based subsidy and dual credit policy to promote new energy vehicles considering consumers’ low-carbon awareness. Comput. Ind. Eng. 2023, 185, 109620. [Google Scholar] [CrossRef]
  20. Huang, X.; He, J.; Mao, L. Carbon Reduction Incentives under Multi-Market Interactions: Supply Chain Vertical Cooperation Perspective. Mathematics 2024, 12, 599. [Google Scholar] [CrossRef]
  21. Abou Mjahed, M.; Ben Abdelaziz, F.; Tarhini, H. A multiobjective coalition formation in facility and fleet sharing for resilient horizontal supply chain collaboration. Ann. Oper. Res. 2023, 1–26. [Google Scholar] [CrossRef]
  22. Lin, P.; Shi, M.; Kai, L.; Ye, C. Manufacturer Optimal Alliance Pricing Decision in Many to One Supply Chain with Cross Elasticity of Demand Taken into Account. Manag. Rev. 2021, 33, 313–324. [Google Scholar]
  23. Gao, H.; Yang, J.; Yin, H.; Ma, Z. The impact of partner similarity on alliance management capability, stability and performance. Int. J. Phys. Distrib. Logist. Manag. 2017, 47, 906–926. [Google Scholar] [CrossRef]
  24. Ma, H.; Lou, G.; Fan, T.; Chan, H.K.; Chung, S.H. Conventional automotive supply chains under China’s dual-credit policy: Fuel economy, production and coordination. Energy Policy 2021, 151, 112166. [Google Scholar] [CrossRef]
  25. Liu, X.; Wang, W.; Su, Y. Leveraging complementary resources through relational capital to improve alliance performance under an uncertain environment: A moderated mediation analysis. Sustainability 2022, 15, 310. [Google Scholar] [CrossRef]
  26. Zhou, Y.-W.; Guo, J.; Zhou, W. Pricing/service strategies for a dual-channel supply chain with free riding and service-cost sharing. Int. J. Prod. Econ. 2018, 196, 198–210. [Google Scholar] [CrossRef]
  27. Pu, X.; Gong, L.; Han, X. Consumer free riding: Coordinating sales effort in a dual-channel supply chain. Electron. Commer. Res. Appl. 2017, 22, 1–12. [Google Scholar] [CrossRef]
  28. Liu, Y.; Lin, C.-X.; Zhao, G. A pricing strategy of dual-channel supply chain considering online reviews and in-sale service. J. Bus. Ind. Mark. 2024. ahead-of-print. [Google Scholar] [CrossRef]
  29. Guo, J.; Zhou, Y.; Li, B. The Optimal Pricing and Service Strategies of A Dual-Channel Retailer under Free Riding. J. Ind. Manag. Optim. 2022, 18, 2049. [Google Scholar] [CrossRef]
  30. Cao, Y.; Yi, C.; Wan, G.-Y. Inventory Competition and Promotion Strategy in a Dual-channel Supply Chain with Free Riding Behavior. Chin. J. Manag. Sci. 2019, 27, 106–115. [Google Scholar]
  31. Liu, Z.; Qian, Q.; Hu, B.; Shang, W.-L.; Li, L.; Zhao, Y.; Zhao, Z.; Han, C. Government regulation to promote coordinated emission reduction among enterprises in the green supply chain based on evolutionary game analysis. Resour. Conserv. Recycl. 2022, 182, 106290. [Google Scholar] [CrossRef]
  32. Yan, L.; Hong, P.; Wu, Z. Dynamic pricing and emission reduction efforts in a dual-channel green supply chain under bidirectional free riding. J. Clean. Prod. 2024, 438, 140713. [Google Scholar] [CrossRef]
  33. Westphal, R.; Sornette, D. How Market Intervention can Prevent Bubbles and Crashes: An Agent Based Modelling Approach. Comput. Econ. 2023, 1–42. [Google Scholar] [CrossRef]
  34. Deng, R.; Shen, N.; Zhao, Y. Diffusion model to analyse the performance of electric vehicle policies: An evolutionary game simulation. Transp. Res. Part D Transp. Environ. 2024, 127, 104037. [Google Scholar] [CrossRef]
  35. Wu, J.; Ohya, T.; Sekiguchi, T. Applications of agent-based modeling and simulation in organization management: A quarter-century review through bibliometric mapping (1998–2022). Comput. Math. Organ. Theory 2024, 30, 1–31. [Google Scholar] [CrossRef]
  36. Carley, S.; Siddiki, S.; Nicholson-Crotty, S. Evolution of plug-in electric vehicle demand: Assessing consumer perceptions and intent to purchase over time. Transp. Res. Part D Transp. Environ. 2019, 70, 94–111. [Google Scholar] [CrossRef]
  37. Ma, L.; Zhong, W.; Mei, S. Study on subsidy strategy of new energy automobile industry chain based on endurance demand. Syst. Eng. Theory Pract. 2018, 38, 1759–1767. [Google Scholar]
  38. Zhao, D.; Wang, J.; Li, Y.-K.; Tang, J.-H.; Zhang, S.-W. How to promote the transition of fuel vehicle enterprises under dual credit policy? An improved tripartite evolutionary game analysis with time delay. Energy 2024, 293, 130696. [Google Scholar] [CrossRef]
  39. Wu, D.; Zhang, Z.; Tu, Q. Research on decision optimization of new energy vehicle supply chain considering demand disruptions under dual credit policy. J. Ind. Manag. Optim. 2024. [Google Scholar] [CrossRef]
Figure 1. Structure of equity-linked horizontal alliance system.
Wevj 15 00227 g001
Figure 2. Causal loop diagram.
Wevj 15 00227 g002
Figure 3. Production sub-model stock flow diagram.
Wevj 15 00227 g003
Figure 4. R&D sub-model stock flow diagrams.
Wevj 15 00227 g004
Figure 5. Credit accounting path for a single decision subject.
Wevj 15 00227 g005
Figure 6. Revenue of transitioning company C in Scenarios 1–2.
Wevj 15 00227 g006
Figure 7. Total revenue of Chinese group in Scenarios 1–2.
Wevj 15 00227 g007
Figure 8. Revenue of transitioning company C in Scenario 3.
Wevj 15 00227 g008
Figure 9. Total revenue of Chinese group in Scenario 3.
Wevj 15 00227 g009
Figure 10. Revenue of transitioning company C in Scenario 4.
Wevj 15 00227 g010
Figure 11. Total revenue of Chinese group in Scenario 4.
Wevj 15 00227 g011
Table 1. Analysis of the decision-making mechanism of passenger car producers in response to market demand.
Market SituationDecision-Making MechanismsMarket Factor Adjustments
Market demand ≥ ProductionIncrease in demand <
1—Utilization rate
Increased capacity utilization(Demand—production)/capacity
Increase in demand ≥
1—Utilization rate
Increased capacity utilization
increase production capacity
Increased capacity utilization to 100%
Capacity increase: (demand—capacity)/capacity
market
<Yield
Utilization < threshold/Reduce production capacityCapacity—demand/utilization
Utilization > thresholdDecrease in demand <
Utilization rate—threshold
Reduced capacity utilization(Production—demand)/capacity
Table 2. Average fuel consumption and new energy vehicle points calculation rules.
Formula NumberKey Function Expressions and InterpretationsVariable Description
(3)Actual value of CAFC
A C A F C = C A F C × P I C E V P I C E V + W × P N E V
ACAFC—Actual value of CAFC
CAFC—Corporate average fuel consumption of ICEV
PICEV—Annual production of ICEV
PNEV—Annual production of NEV
W—NEV production multiplier (policy control)
(4)Corporate average fuel consumption credits
C r e d i t I C E V = T C A F C A C A F C × P I C E V
Credit-ICEV—Corporate average fuel consumption credits
TCAFC—Target value of CAFC (policy control)
(5)New energy vehicle credits
C r e d i t N E V = P N E V × U P I C E V × R
Credit-NEV—New energy vehicle credits
R—Required ratio of NEV (policy control)
U—Unit credit for NEV (policy control)
Table 3. Model initial values and fixed value settings.
VariableTypeValueUnitDescriptive
ABC
Fuel vehicle production capacityInitial value200020001000thousand Estimated based on existing capacity data disclosed in the 2022 Annual Report of SAIC
Fuel vehicle capacity utilizationInitial value80%80%80%/Derived from the proportion of ICEV production capacity utilization reported in the 2022 Annual Report of SAIC
Total R&D investment in fuel vehiclesInitial value800800400billionEstimated based on the cumulative R&D investment figures from the annual reports of SAIC between 2013 and 2022
New energy vehicle production capacityInitial value100100200thousand Estimated using NEV production data compiled by the China Association of Automobile companies for SAIC
New energy vehicle capacity utilization rateInitial value10%10%30%/Based on the ratio of production volume in 2022 to total capacity
Total R&D investment in new energy vehiclesInitial value1010100billionEstimated from the cumulative R&D investment figures in the Annual Reports of SAIC between 2013 and 2022
Average selling price of fuel vehiclesConstant 150150100thousand Estimated using the sales volume and revenue of ICEV as reported in the 2022 Annual Report of SAIC
Average selling price of new energy vehiclesConstant200200150thousand Estimated using the sales volume and revenue of NEV as reported in the 2022 Annual Report of SAIC
Table 6. Sensitivity analysis.
TimeRevenueNEV Market DemandICEV Market DemandTransfer Coefficient
+5%+5%+5%
1463.947463.947463.947463.947
2474.948478.945494.698474.948
3480.334485.132499.737480.334
4490495.25509.25490
5500506519500
6510516.75528.75510
7520527.5538.5520
531012.671058.491019.521012.27
541024.41071.071031.011023.99
551036.181083.71042.551035.76
5610481096.371054.131047.56
571059.861109.091065.761059.41
581071.771121.851077.431071.31
591083.721134.671089.151083.25
601095.721147.531100.911095.24
Disclaimer/Publisher’s Note: The statements, opinions and data contained in all publications are solely those of the individual author(s) and contributor(s) and not of MDPI and/or the editor(s). MDPI and/or the editor(s) disclaim responsibility for any injury to people or property resulting from any ideas, methods, instructions or products referred to in the content.

