Article

Detection and Analysis of Abnormal High-Current Discharge of Cylindrical Lithium-Ion Battery Based on Acoustic Characteristics Research

1
School of Mechanical Engineering and Automation, Northeastern University, Shenyang 110819, China
2
Key Laboratory of Vibration and Control of Aero-Propulsion System, Northeastern University, Shenyang 110819, China
3
Key Laboratory of Advanced Manufacture Technology for Automobile Parts, Chongqing University of Technology, Chongqing 400054, China
4
School of Mechanical Engineering, Xi’an Jiaotong University, Xi’an 710049, China
*
Author to whom correspondence should be addressed.
World Electr. Veh. J. 2024, 15(6), 229; https://doi.org/10.3390/wevj15060229
Submission received: 3 April 2024 / Revised: 17 May 2024 / Accepted: 22 May 2024 / Published: 24 May 2024

Abstract

:
The improvement of battery management systems (BMSs) requires the incorporation of advanced battery status detection technologies to facilitate early warnings of abnormal conditions. In this study, acoustic data from batteries under two discharge rates, 0.5 C and 3 C, were collected using a specially designed battery acoustic test system. By analyzing selected acoustic parameters in the time domain, the acoustic signals exhibited noticeable differences with the change in discharge current, highlighting the potential of acoustic signals for current anomaly detection. In the frequency domain analysis, distinct variations in the frequency domain parameters of the acoustic response signal were observed at different discharge currents. The identification of acoustic characteristic parameters demonstrates a robust capability to detect short-term high-current discharges, which reflects the sensitivity of the battery’s internal structure to varying operational stresses. Acoustic emission (AE) technology, coupled with electrode measurements, effectively tracks unusually high discharge currents. The acoustic signals show a clear correlation with discharge currents, indicating that selecting key acoustic parameters can reveal the battery structure’s response to high currents. This approach could serve as a crucial diagnostic tool for identifying battery abnormalities.

1. Introduction

Energy storage systems are integral to global energy strategies, particularly as the world grapples with increasing energy demands and the push for sustainable solutions. Lithium-ion batteries (LIBs) are especially notable for their role in this sector due to their efficiency, high energy density, and versatility, making them pivotal in the shift towards renewable energy utilization. These batteries are increasingly used in electric vehicles (EVs), providing essential attributes like high energy density, low self-discharge rates, and extensive recharge cycles, positioning them as a practical and environmentally friendly alternative to conventional energy sources. The development and widespread adoption of lithium-ion batteries in EVs are closely linked to advancements in battery technology, marked by a balance of cost-efficiency and safety [1,2]. This progress necessitates a sophisticated BMS to ensure optimal performance, longevity, and safety. Current BMS practices include monitoring electrode data and temperatures and utilizing advanced algorithms for real-time analysis [3]. However, the growing number of battery cells in EVs introduces challenges in state detection and failure prediction, emphasizing the need for innovative monitoring solutions.
Acoustic monitoring has emerged as a critical technology within this framework, providing a non-invasive yet sensitive approach to early fault detection. This technique analyzes acoustic signals from batteries, offering insights into their condition and enabling early identification of potential failures, thus enhancing the safety and reliability of EVs [4,5]. Integrating acoustic monitoring into BMS not only improves diagnostic accuracy but also supports the development of more effective safety management strategies. Future research is poised to refine acoustic signal analysis algorithms, enhance sensor technology, and integrate acoustic data with other diagnostic inputs to create a comprehensive battery health assessment framework. This integrated approach promises to advance battery diagnostics significantly, leading to safer and more reliable energy storage solutions in the rapidly evolving EV industry. These advancements are crucial for sustaining the transition from fossil fuels to more sustainable energy alternatives, supporting a broad range of technologies and reducing the ecological footprint of our transportation systems.

1.1. Current Research Status

In recent years, some scholars have applied acoustic detection methods to batteries due to the characteristics of less damage, convenient use, strong adaptability, and high detection. Common acoustic detection techniques include ultrasonic testing (UT) and AE research. UT is renowned for its proficiency in non-destructive testing (NDT), utilizing ultrasonic waves to inspect internal defects in diverse fields such as materials science, medicine, and structural engineering [6,7]. In the realm of battery technology, Sood et al. [8] pioneered the adaptation of UT for LIBs, demonstrating its effectiveness in identifying structural changes that reflect the battery’s health status. Their research indicated that UT could detect variances within the battery structure, thereby offering a method to monitor the health and integrity of batteries in a non-invasive manner.
Acoustic measurement is an innovative method for assessing electric currents that is particularly effective in detecting arcing faults within EV batteries, and it offers distinct advantages over traditional methods like Hall Effect sensors, shunt resistors, and Rogowski coils. Unlike Hall Effect sensors, which detect magnetic fields and can be susceptible to magnetic interference, acoustic sensors detect sound waves generated by electrical discharges, offering a unique advantage in environments with high electromagnetic noise [9]. Shunt resistors, while cost-effective and direct in measuring current through voltage drop, inherently generate heat and can suffer from power loss; these are issues not encountered with acoustic methods, which are non-contact and non-invasive [10]. Rogowski coils, suitable for high-frequency AC currents, require complex integration and calibration to accurately measure current, whereas acoustic sensors can directly identify rapid changes in current associated with fault conditions without the need for electrical contact or complex circuit integration [11]. However, acoustic measurement’s effectiveness can be limited by ambient noise and requires sophisticated signal processing algorithms to distinguish relevant acoustic signals from background noise, which is less of a concern with more direct electrical measurement techniques. Moreover, the rapid response of acoustic methods to high-current scenarios provides crucial advantages in operational settings, enabling real-time monitoring and immediate detection of structural changes within batteries, a capability that is vital for the safety and efficiency of electric vehicle operations.
The advancement of battery technology for electric vehicles and energy storage systems has necessitated the development of sophisticated diagnostic methods to ensure safety and efficiency. Among these, acoustic detection methods, such as UT and AE, have emerged as promising non-invasive techniques due to their minimal damage risk, convenience, adaptability, and high detection capabilities.
Expanding on this foundation, subsequent studies have focused on the specificity of UT in relation to the battery’s state of charge (SOC). Hsieh et al. [12] applied UT to various commercial batteries, observing changes in the time of flight (TOF) and sound intensity as the SOC increased. These acoustic parameters have proven to be reliable indicators of battery status, enhancing the understanding of how acoustic properties correlate with battery chemistry and charge levels. Moreover, Chang et al. [13] advanced UT application by introducing a non-contact, air-coupled method that established a linear relationship between signal amplitude and SOC, significantly improving the accuracy of SOC predictions. These innovations underscore the versatility of UT in battery diagnostics and its potential to evolve into a standard tool for battery management systems.
Studies by Sun have examined the use of ultrasonic nondestructive diagnosis at multiple frequencies to identify the optimal conditions for assessing the health of lithium-ion batteries, indicating significant progress in understanding the complex interactions within battery cells [14,15]. Gold et al. have further developed the application of ultrasonic transmission to probe lithium-ion batteries’ state of charge, offering a novel approach that enhances the precision of battery monitoring systems [16,17]. Additionally, Wu et al. focused on the health monitoring of lithium-ion batteries using ultrasonic sensing techniques, emphasizing the need for improved access to the battery cells for effective diagnostics [18,19]. These advancements suggest that ultrasonic testing could play a critical role in future battery management systems, particularly in ensuring the longevity and reliability of batteries in high-demand applications such as electric vehicles.
AE detection distinguishes itself by capturing stress waves generated from structural or compositional changes within the battery without the need for external stimulation. This technique has been instrumental in identifying the health status of lithium-ion batteries, where the amplitude and pattern of AE signals correlate with battery aging and degradation processes. For instance, Zhang et al. [20] demonstrated that continuous and pulsed AE signals could effectively characterize lithium-ion battery health, with signal amplitude (SA) variations indicating the degree of degradation. Further investigations into AE have focused on detecting the formation and evolution of the solid electrolyte interphase (SEI) [21,22,23], as well as changes in electrode morphology due to electrochemical processes [24,25]. These studies illustrate AE’s capability to monitor intricate battery behaviors, offering insights into failure mechanisms and the effects of aging [26,27]. Specifically, in short-circuit detection, acoustic measurements can characterize cell anomalies across various SOCs, complementing conventional electrode assessments [28,29]. Additionally, for aging-related failures, these methods offer a swift and reliable means to detect defect accumulation, outperforming standard inspection techniques [16,30].
Acoustic detection technologies present innovative solutions to the limitations of current BMS by offering additional non-invasive means of monitoring lithium-ion batteries’ internal states. These methods complement traditional voltage, current, and temperature measurements, promising to enhance the accuracy and robustness of BMS through the provision of detailed acoustic data on battery operation and health. Despite their potential, the deployment of UT and AE faces challenges, including high costs and the need for adaptation to various production environments. Future research is directed towards developing cost-effective sensor technologies and refining algorithms for data analysis to overcome these barriers. Ultimately, the continued evolution of acoustic diagnostic methods is expected to significantly contribute to the development of safer and more reliable battery systems, marking a crucial advancement in automotive battery diagnostics.
Ultrasonic testing offers unique insights into the internal health and structural integrity of batteries, which is essential for enhancing safety and performance in applications like electric vehicles. For cylindrical cells, ultrasonic testing helps in evaluating the mechanical and structural properties during the operational stresses and aging processes [31]. Prismatic cells benefit from detailed structural assessments that can detect deformations and failures, which are crucial for maintaining the operational reliability of battery packs in automotive applications [32]. Pouch cells, which are susceptible to swelling and mechanical stresses, are monitored using ultrasonic techniques to ensure the stability of the electrode structures and to prevent catastrophic failures [33]. Furthermore, ongoing research continues to focus on enhancing the precision of ultrasonic diagnostics to better understand the degradation mechanisms and to improve the predictive maintenance strategies for lithium-ion batteries [34].
AE techniques are finding increasingly practical applications across various battery types, including cylindrical, prismatic, and pouch configurations. For cylindrical batteries, AE has been used to analyze the acoustic characteristics under conditions such as external short circuits, providing insights into potential battery safety and health issues [30]. In studies on prismatic batteries, AE monitoring has proven effective in exploring mechanical properties and failure mechanisms, which are crucial for predicting battery life and preventing catastrophic failures [7]. For pouch cells, AE is instrumental in cyclic aging monitoring, where the emissions are linked with the battery’s declining capacity, offering a non-destructive tool for assessing battery health over its operational lifespan [35]. These studies demonstrate the broad application potential of acoustic detection technologies across different battery configurations, especially highlighting their unique advantages in battery health monitoring and fault diagnosis.

1.2. Motivation and Original Contribution

The operation of electric vehicle (EV) batteries under varying road conditions necessitates their frequent engagement in high-current charging and discharging activities. Such conditions impose significant stress on the batteries, leading to degradation of performance, capacity, and lifespan, thereby increasing the likelihood of thermal runaway events. The motivation for this study arises from the critical need to enhance battery monitoring capabilities, particularly under high-current discharge scenarios that traditional electrode voltage and current measurements fail to accurately capture. Current literature primarily focuses on conventional diagnostic methods, leaving a significant gap in the understanding and application of AE for battery state detection under stress conditions. This research seeks to address this gap by exploring the utilization of AE to detect subtle changes within the battery’s internal structure that traditional methods might overlook. Theoretical considerations suggest that the microstructural alterations in the anode and cathode during high-current discharges, which potentially compromise the battery’s charge-discharge cycle performance and safety, can be effectively captured through acoustic signals.
The introduction of a novel methodological framework for the collection, analysis, and interpretation of AE data aims to establish a more reliable mapping between acoustic signals and the battery’s discharge state. Through controlled experiments conducted under both low (0.5 C) and high (3 C) discharge currents, the study identifies AE acoustic characteristic parameters that accurately reflect the battery’s condition. Such methodological advancements offer a new avenue for real-time battery monitoring, presenting a significant contribution to the field. The practical implications of these findings are far-reaching. Integrating AE-based diagnostics into BMS can potentially achieve more sophisticated, real-time monitoring of battery health. This integration promises not only to enhance vehicle safety and battery reliability but also to extend the battery’s operational lifespan.
Furthermore, the study sets the stage for future investigations into additional acoustic parameters, their applicability to different battery types and operational conditions, and the synergistic integration of AE with other diagnostic technologies. Ultimately, the research provides a foundational step towards the development of more advanced, acoustic-based diagnostics for EV batteries, addressing the urgent need for improved safety and performance monitoring in the rapidly evolving electric vehicle sector.

1.3. Configuration of This Paper

The structure of this paper is organized as follows: Section 2 describes the experimental setup; Section 3 introduces the primary methods employed in this study; Section 4 presents the results and analysis of the acoustic response of batteries subjected to different discharge currents, along with pertinent discussions. The paper concludes with a summary of the findings in the Section 5. Additionally, a Nomenclature section is included to define all term abbreviations used throughout the study.

2. Experimental Section

This experiment investigates 18650-type cylindrical lithium nickel manganese cobalt oxide (NMC) cells. The cylindrical cells used were manufactured by Tianjin Lishen Battery Joint-Stock Co., Ltd. Tianjin, China, model Lishen LR1865SZ. The study is conducted within a chamber maintained at an ambient temperature of 25 degrees Celsius. Table 1 details the relevant battery parameters. Throughout the charge and discharge cycle of the battery, the charge current is maintained at 1 A (0.5 C), while the discharge current is set to both 1 A (0.5 C) and 6 A (3 C). The experiment does not account for the influence of temperature variations. Instead, it concentrates on examining the relationship between the battery’s acoustic signals and the electrical signals of current and voltage during the discharge process.
Figure 1 shows the established acoustic analysis system for lithium-ion battery discharge. In the experiment, the upper computer is connected to the Motohawk ECM-5554-112 (Woodward, Inc. Woodward County, Oklahoma, United States) through the controller area network (CAN), and the charging and discharging cycle is completed by controlling the closing of the relay. The current data are measured by Hall current sensors. Acoustic signal acquisition uses the ultrasonic needle sensor from ndtXducer (Englewood, Florida United States) which provides low-cost sensors for industrial and laboratory use in ultrasonic and acoustic measurements. It has the advantages of flat sensitivity and good directivity. The vibration signal generated by the structural change inside the battery is received by the needle sensor and the output as a high-frequency voltage signal. The data acquisition device is the Nioki MR6000 system (Hioki E.E. Corporation, Hioki, Japan) which simultaneously records the voltage, current, and acoustic signal of the battery. Vibration isolation materials are arranged around the battery and the acoustic sensor to reduce the interference of the external environment during the test; at the same time, Vaseline gel is used in the contact area between the battery body and the sensor to obtain better acoustic signals and shield unnecessary interference.
The charging, resting, and discharging phases of the battery are distinctly identifiable through the collected current signal. To analyze the intrinsic relationship between the battery’s acoustic signal and its varying discharge currents, the original acoustic data must be filtered. This preprocessing step isolates the acoustic responses specific to each battery operational state, allowing for an in-depth analysis of how different discharge currents affect acoustic signal characteristics.

3. Preliminary Analysis of Acoustic Signals

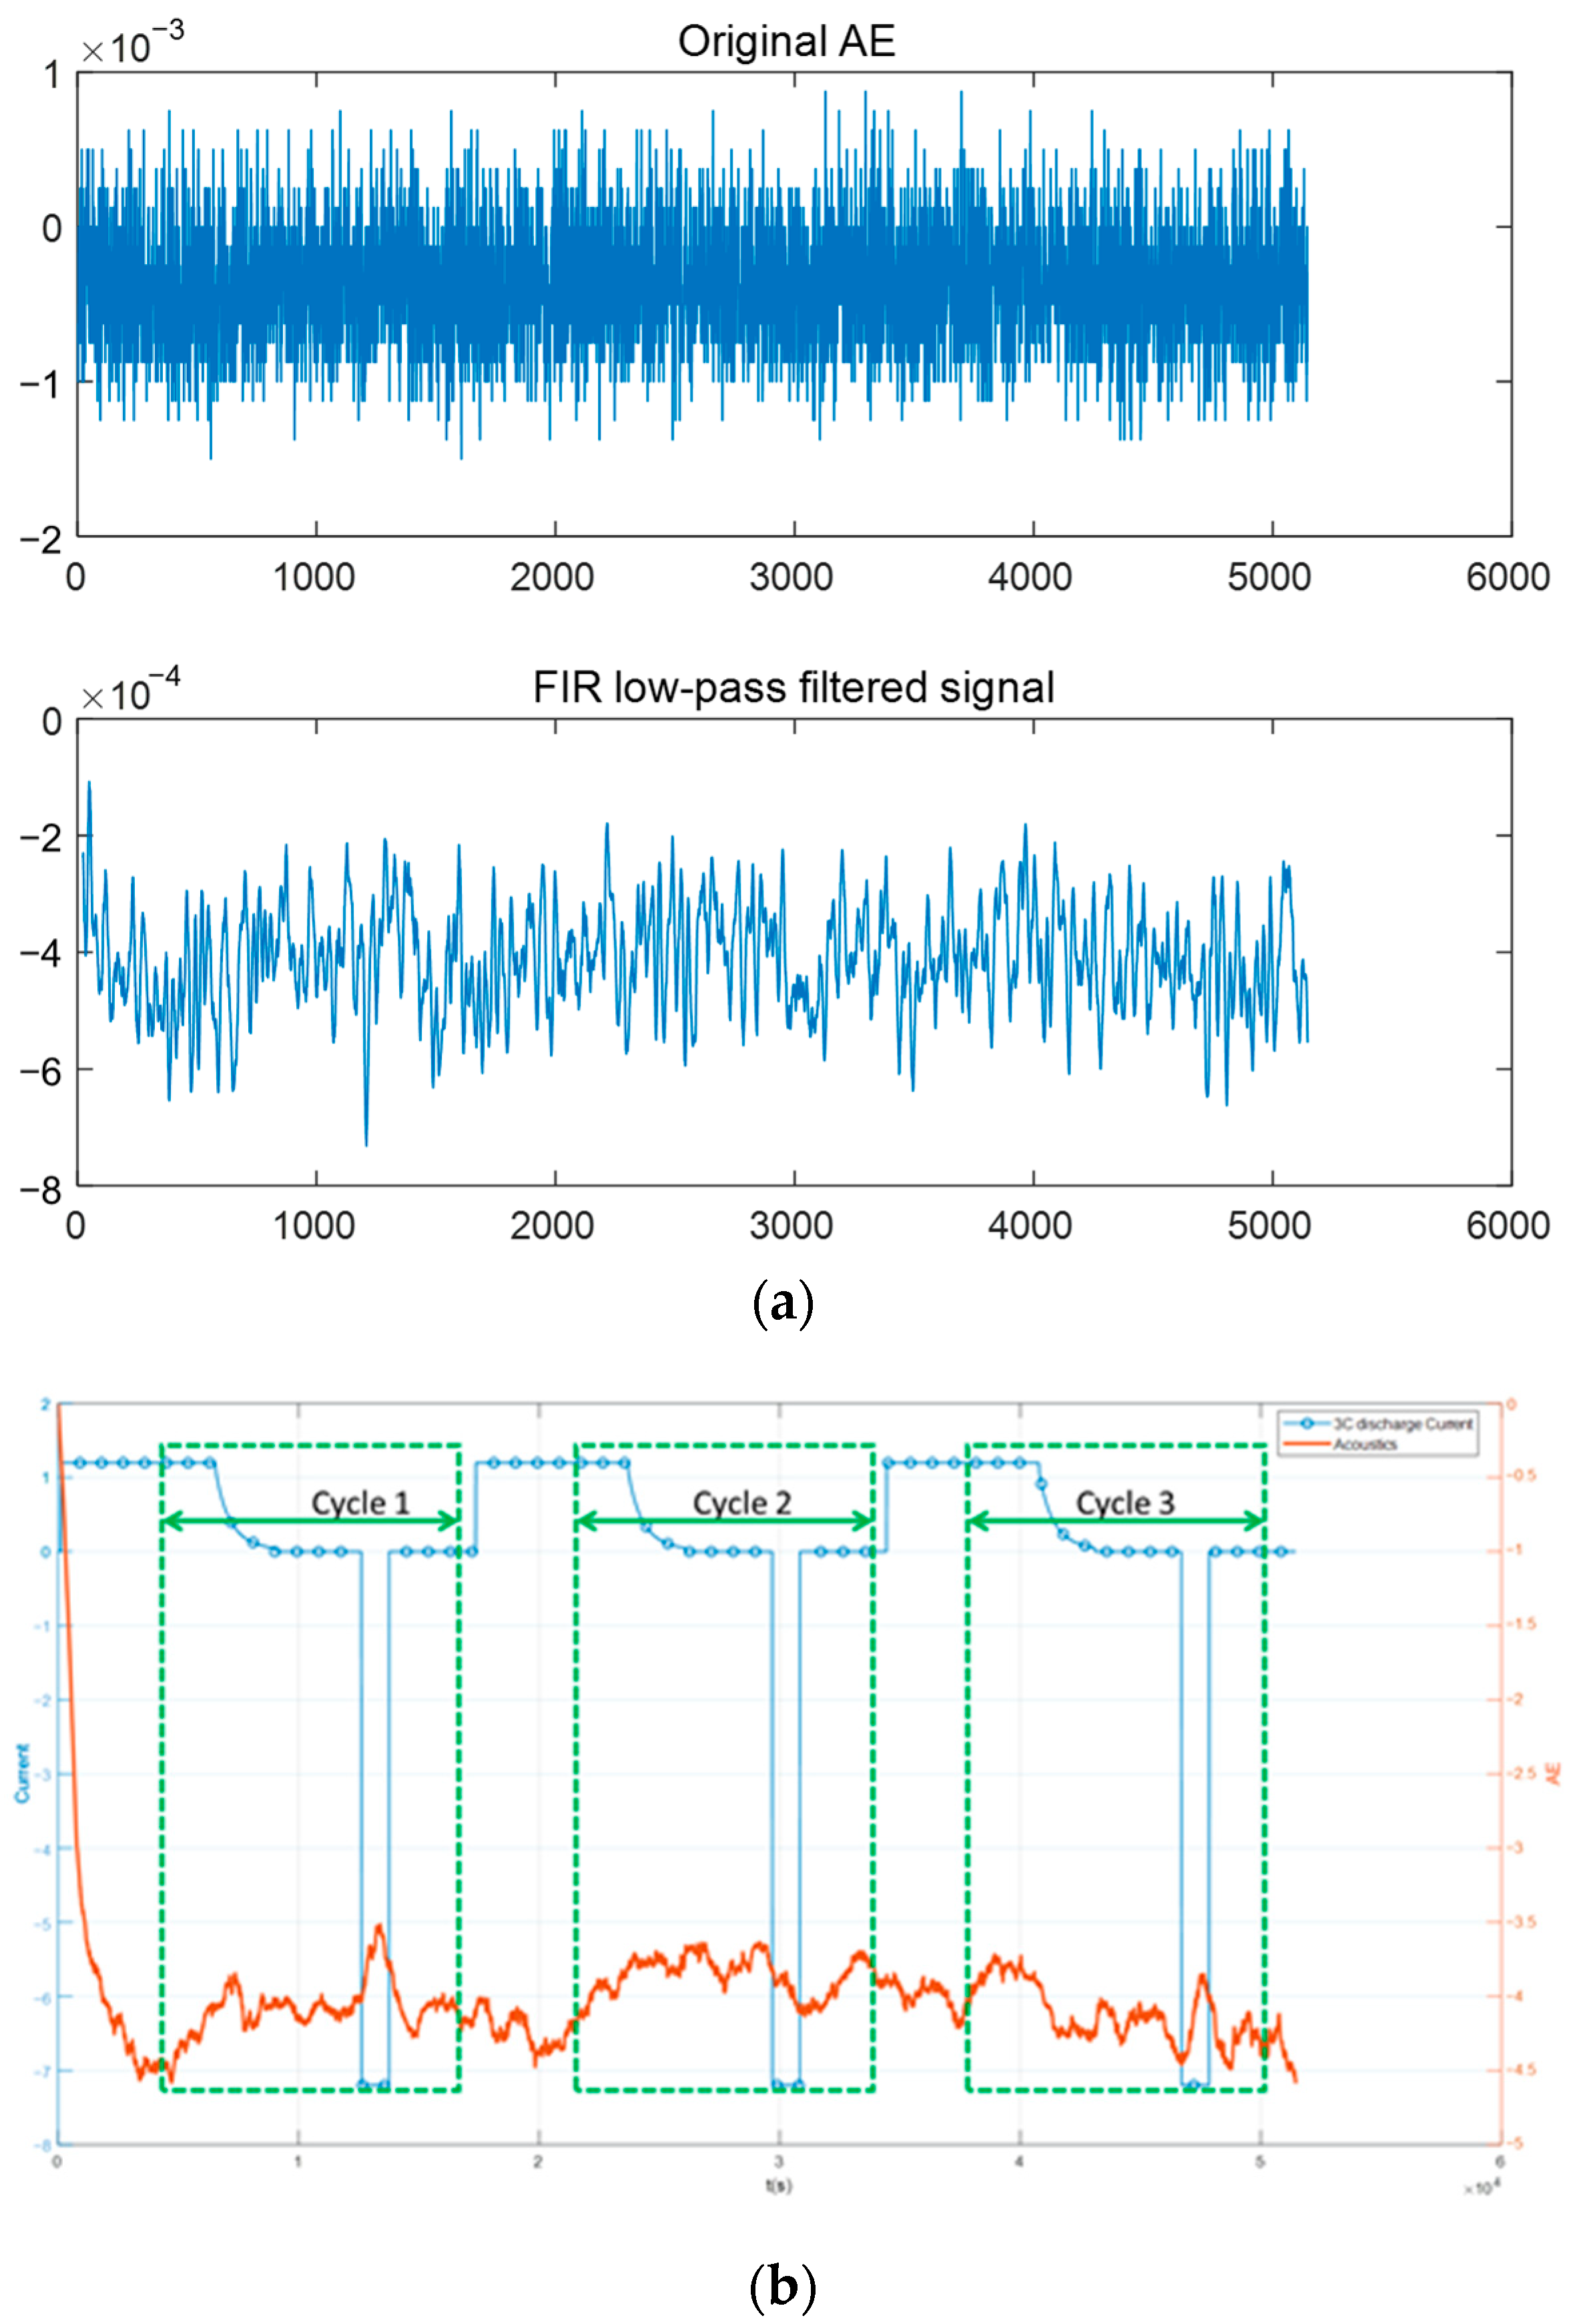
According to the variation of current during the experiment, the decision to divide the acoustic signal into three continuous charge and discharge cycles is based on preliminary observations indicating distinct acoustic response patterns within these cycles. This division aims to ensure a focused analysis of cycles that is most representative of the battery’s operational behavior. Each discharge segment includes the processes of charging, resting, discharging, and resting again. The acoustic signals captured by the sensor, initially containing significant noise, were processed using a Finite Impulse Response (FIR) filter. Specific parameters such as the filter’s order and cutoff frequency were meticulously chosen to optimize the signal-to-noise ratio. This processing facilitated the generation of a coaxial change curve, illustrating the synchronized variations of acoustic and current signals during the battery cycles, as depicted in Figure 2a. In Figure 2b, each of the continuous three charging and discharging cycles—cycle 1, cycle 2, and cycle 3—was set within the same time window. These windows encompassed four distinct phases: charging, resting, discharging, and resting. This setup allowed for the concurrent recording of both current and acoustic changes, aiming to elucidate the patterns and sensitivity of acoustic responses to changes in discharge currents. This visualization intuitively demonstrates the correlation between the acoustic signal and battery operation. For better readability, the normalization of the acoustic signal was conducted using a standard max-min scaling technique to align the signal amplitude with a consistent reference frame.
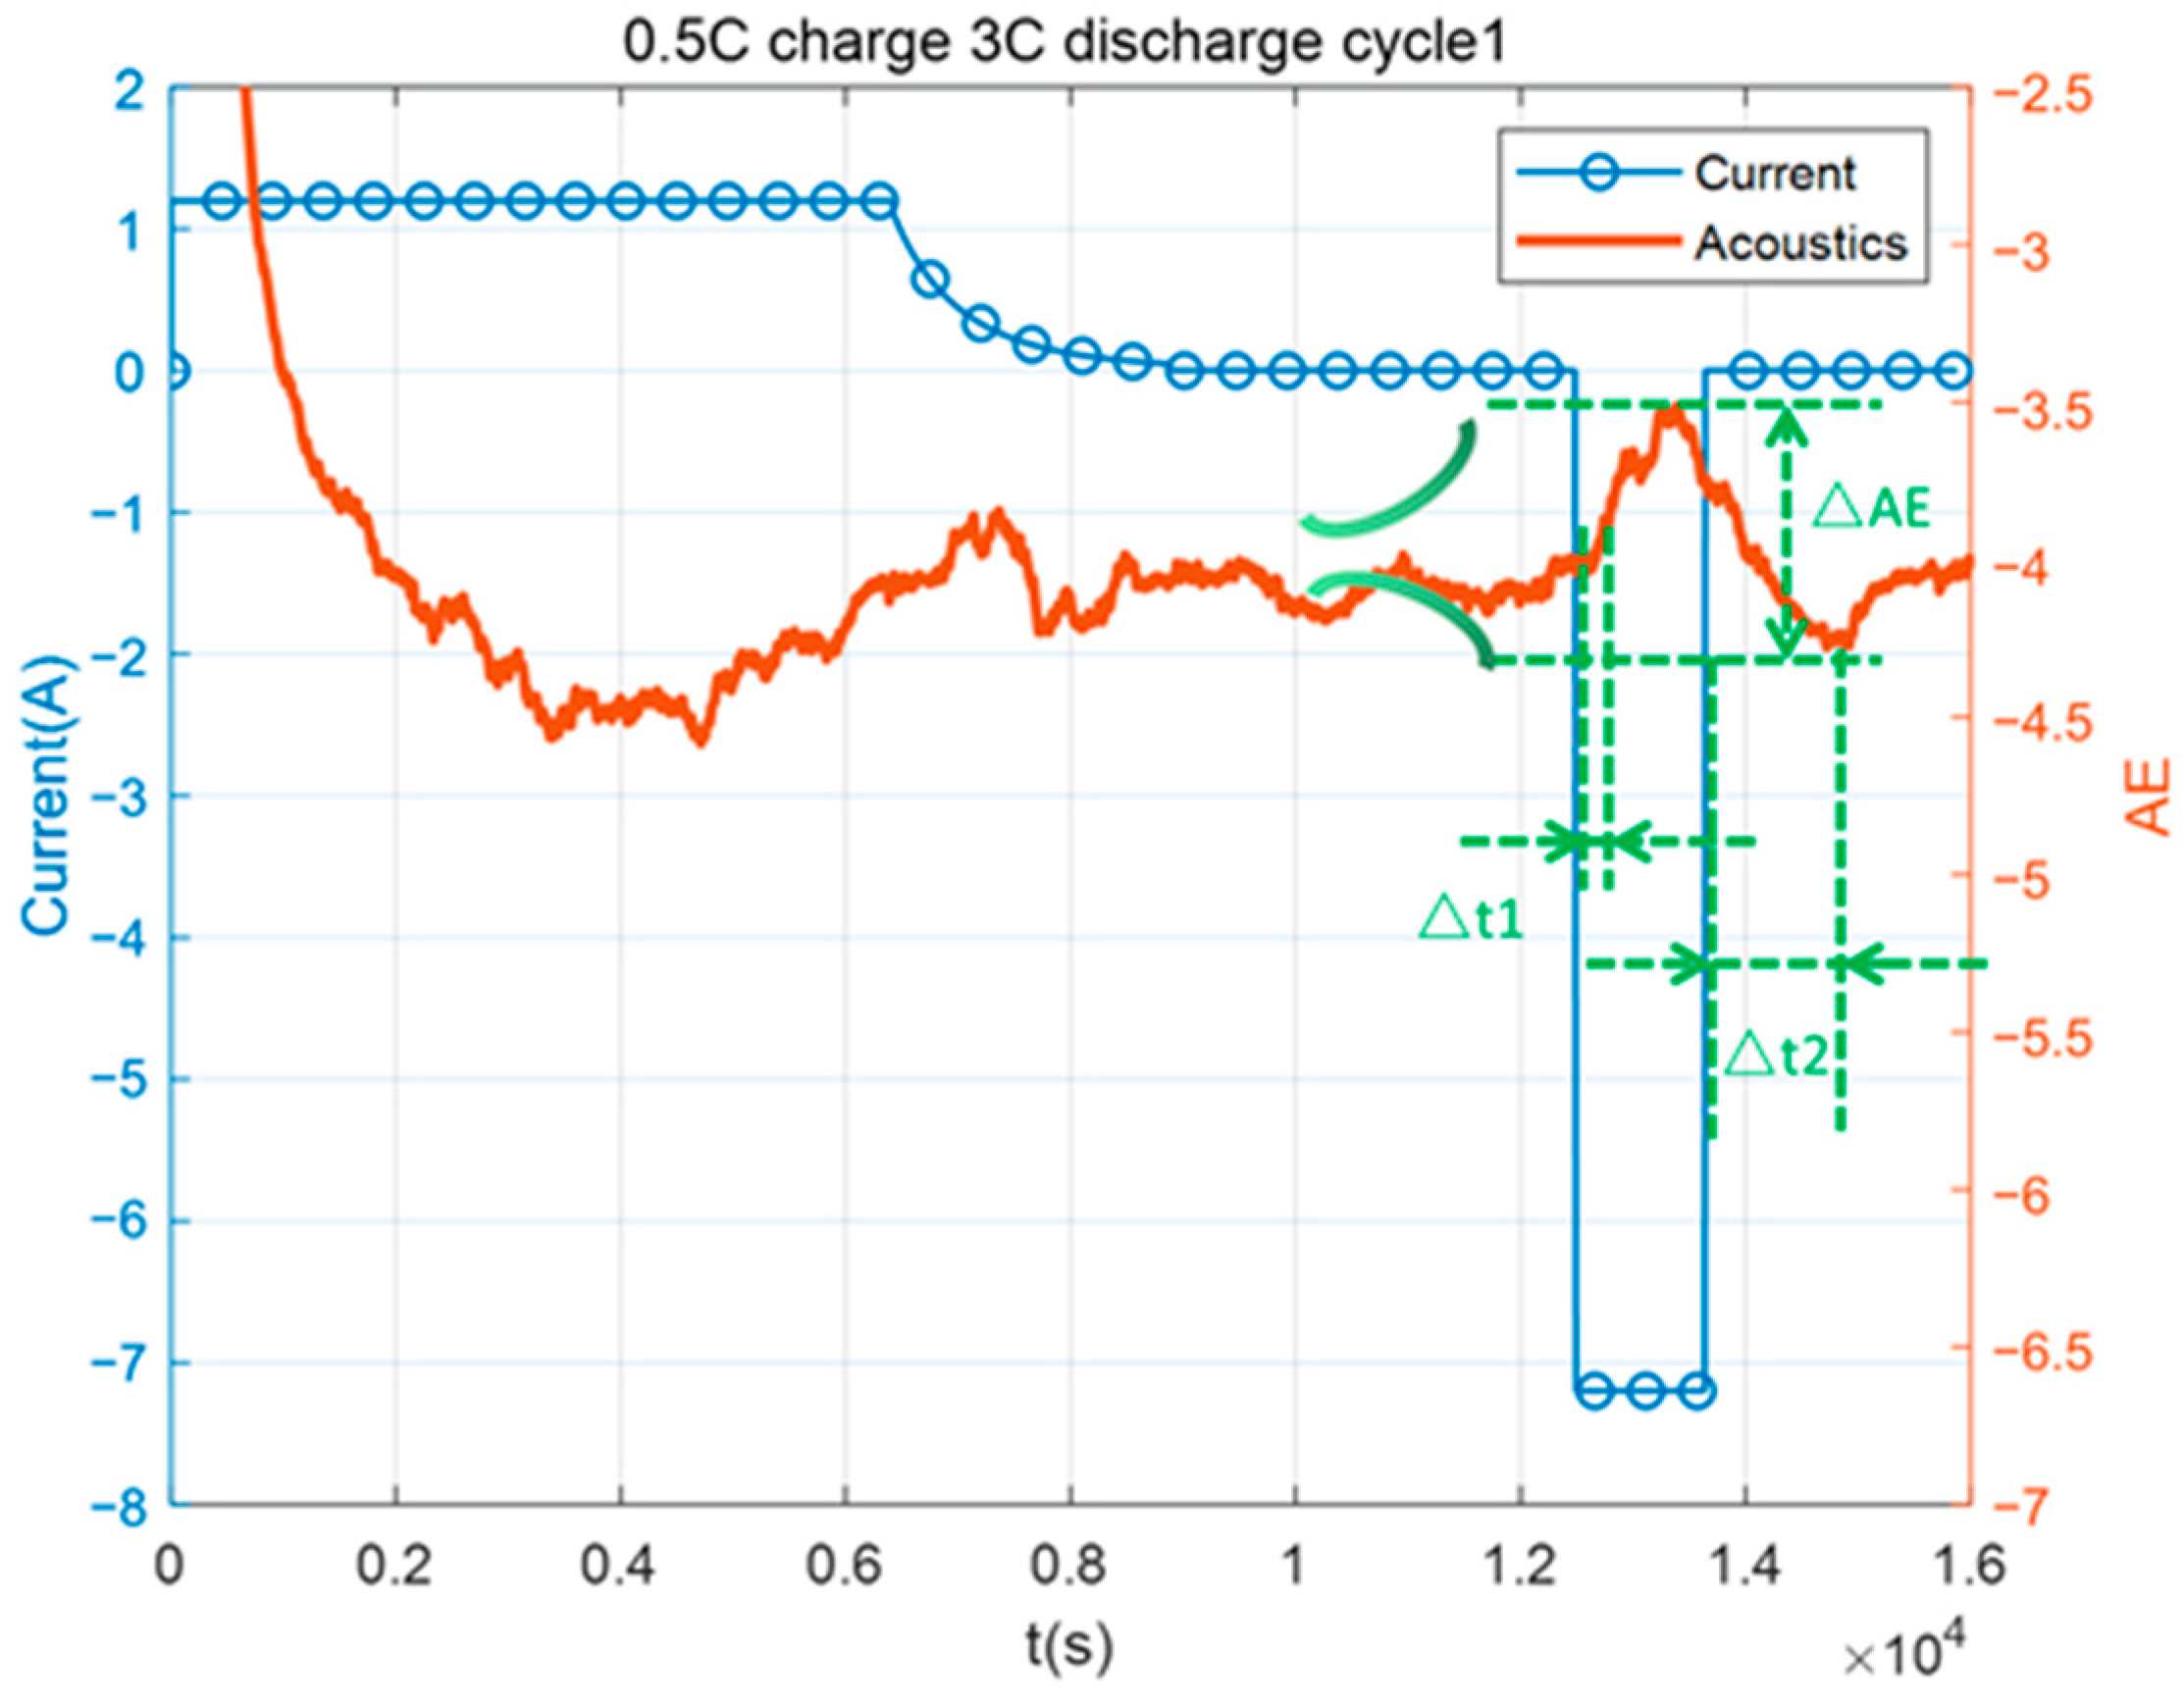
Common characteristic values for battery acoustic signals include rise time, the length of time between crossing the set threshold and the signal’s peak amplitude value; signal duration, the time interval between the beginning and the end of signal fluctuation crossing the set threshold; and the range of amplitude variation of a signal. These parameters were selected for their sensitivity to changes in the battery’s operational state, providing a quantitative framework for detecting abnormalities in discharge behavior. The focus of this research is on the acoustic characteristics of abnormal current discharge, hence the definition of specific parameters: Δt1, the time interval of the first acoustic signal fluctuation after the onset of current discharge; Δt2, the time interval after the end of current discharge until the signal fluctuation returns to baseline; and ΔAE, the maximum range of amplitude change of the acoustic signal during discharge. These parameters are critical for quantifying the acoustic response to different discharge rates and are pivotal for understanding the structural integrity and operational health of the battery.
During the charge and discharge process, the evolution of the battery’s structure inevitably influences the acoustic signal, with its amplitude reflecting the intensity of acoustic emissions due to structural changes or rearrangements. Moreover, the response time of acoustic signals is indicative of how different discharge currents affect the cell structure, aligning with findings from similar studies in the literature [28,29]. Figure 3 graphically defines these parameters against the backdrop of the acoustic signal changes during the 3 C discharge process.
For the frequency domain analysis of acoustic signal data, the Fast Fourier Transform (FFT) method is employed to dissect the characteristics of acoustic emission signals. Through phase spectrum analysis, signal amplitude and phase value information are extracted, offering insights into the acoustic signal’s frequency domain characteristics. By identifying the most representative center frequency and observing amplitude changes, the analysis reveals alterations in the battery’s internal structure and mechanical properties under different discharge currents.
These methodological choices and the introduction of specific acoustic parameters enhance the study’s ability to capture and interpret the nuances of battery behavior under varying operational conditions, thereby contributing to a more robust understanding of battery diagnostics through acoustic signal analysis.

4. Results and Discussion for Acoustic Characteristics of Battery under Different Discharge Currents

4.1. Analysis of Acoustic Signal Characteristics in the Time Domain

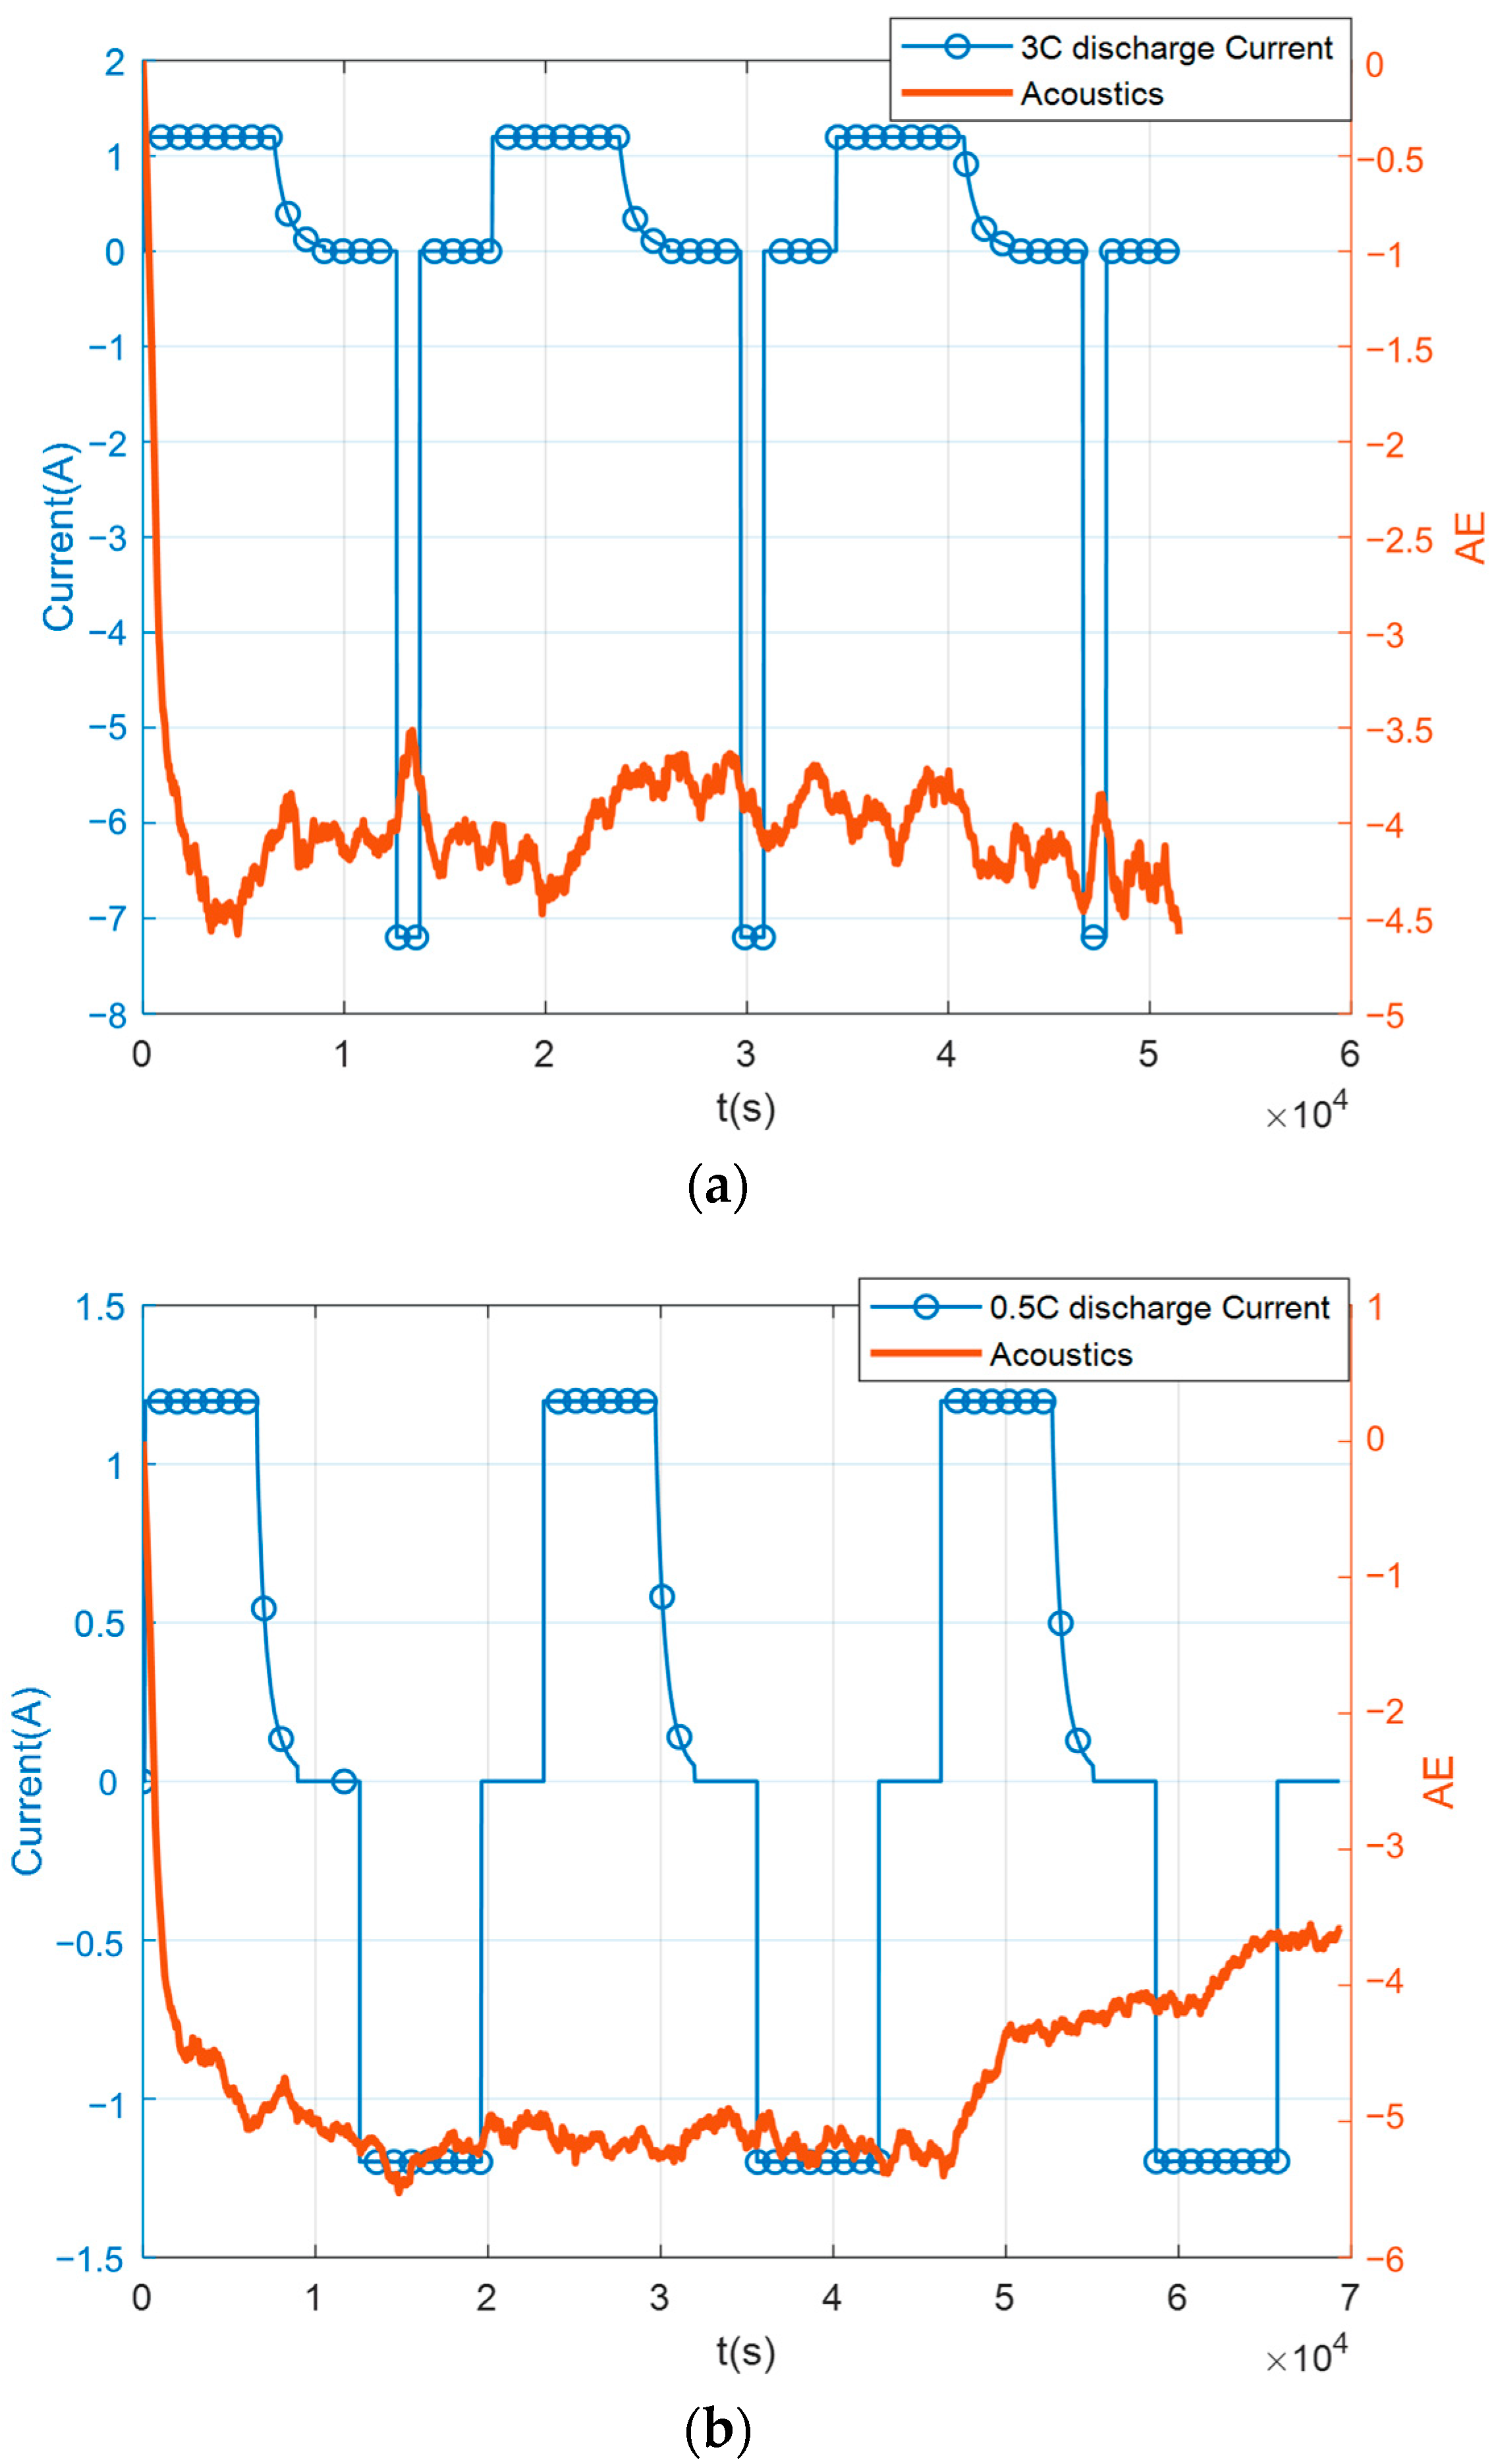
The analysis of acoustic signal characteristics under different discharge currents reveals critical insights into battery behavior, particularly highlighting the acoustic diagnostics’ sensitivity to discharge rates and their potential in monitoring battery health.
Observing the acoustic signal fluctuations in Figure 4, it is noted that under a 3 C discharge, there are more pronounced variations compared to a 0.5 C discharge. This distinction not only validates the acoustic method’s ability to detect structural changes within the battery but also emphasizes its capacity to differentiate between operational states based on the discharge intensity. A key finding from the time domain analysis is the discernible delayed response of the acoustic signal under both 3 C and 0.5 C discharge conditions. This delay, established through statistical analysis, demonstrates a significant correlation with discharge rates, illustrating how the acoustic signal’s behavior is influenced by current density variations. Despite slight differences within the same discharge current cycle, the overall delay length suggests a level of dependency on the discharge current, reinforcing the idea that acoustic diagnostics can provide meaningful insights into the battery’s structural rearrangement during discharge.
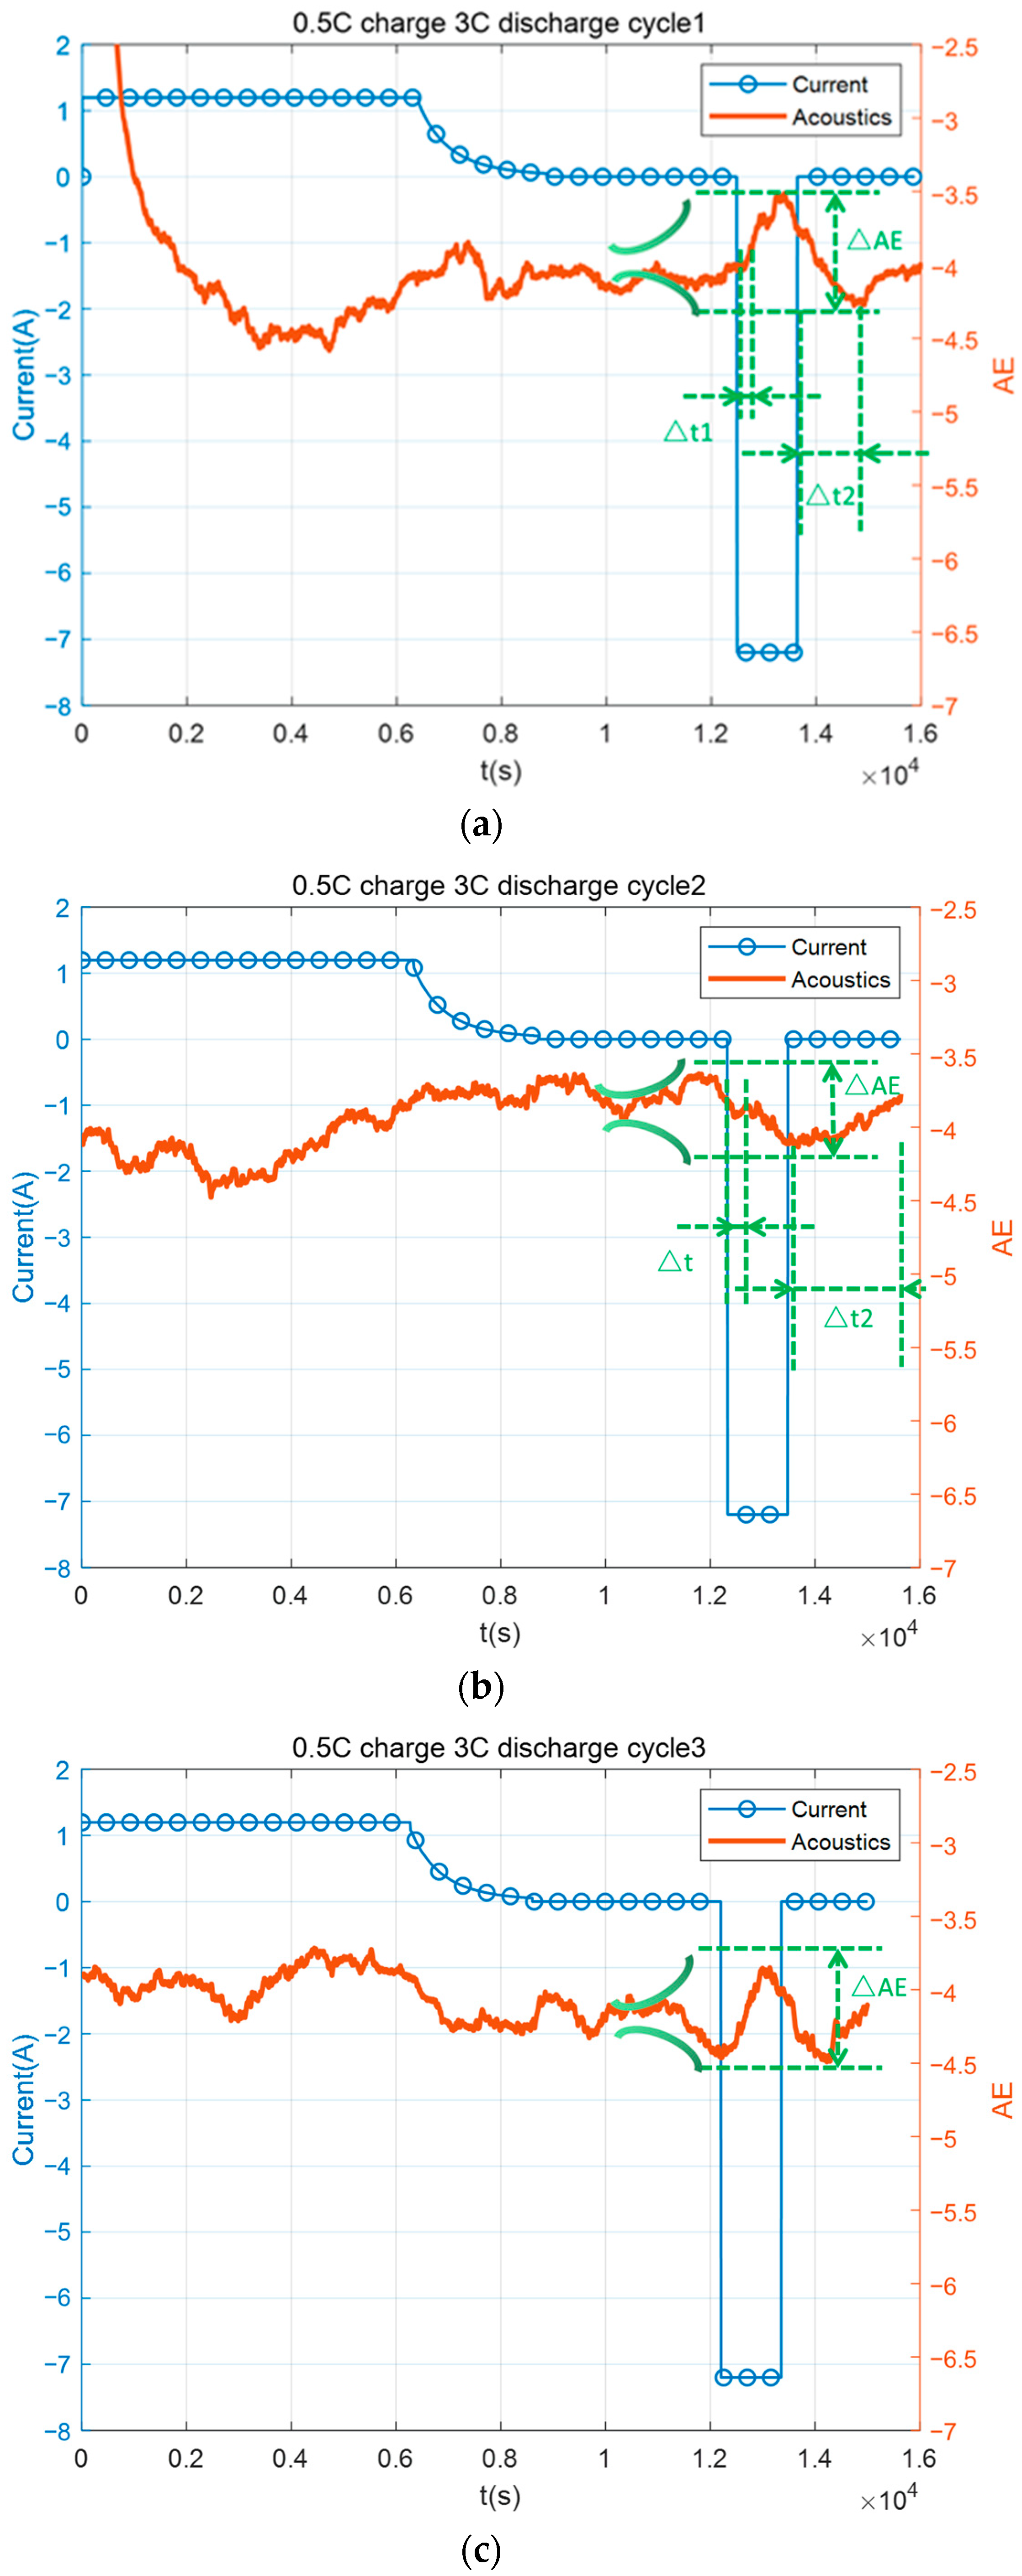
From the overall observation in Figure 5, the correlation analysis between current and AE under 3 C discharge conditions reveals distinct acoustic signal behaviors across different discharge cycles. In the continuous 0.5 C charge to 3 C discharge cycle, for the three replay segments of cycle 1, cycle 2, and cycle 3, a short time delay Δt1 is observed before the acoustic signal response intensifies post-discharge initiation. Interestingly, the rise in acoustic signal intensity is not uniform across cycles. In the 3 C discharge segment, cycles 1 and 3 exhibit an increase in acoustic signal intensity, while cycle 2 shows a noticeable drop, suggesting complex internal battery structure responses to high-current discharge influenced by factors such as the battery’s state of health and internal structural differences at the cycle’s start.
When the current changes, this study selects the variation range of the battery acoustic amplitude signal (ΔAE) as the characteristic parameter, which better reflects the acoustic response of the structure while considering the different directions of the acoustic signal variation. The calculated ΔAE changes of cycle 1, cycle 2, and cycle 3 are 0.72, 0.45, and 0.69, respectively, with a fluctuation range of about 14~20% of the respective acoustic signals. This range demonstrates the sensitivity of acoustic diagnostics to internal structural changes during high-current discharge, showing a clear degree of recognition and correlation with current changes.
In terms of the acoustic response delay compared to the start of current change, i.e., the change in Δt1, the three cycle segments all exhibit faster acoustic response signals after 3 C discharge begins, indicating a significant structural change. The robust acoustic signal is swiftly transmitted to the battery surface, resulting in a relatively short Δt1 value. The calculated parameter changes for Δt1 of cycle 1, cycle 2, and cycle 3 are 5.8 s, 7 s, and 3.3 s, respectively. After the discharge concludes, large-scale structural changes inside the battery cease, but minor structural repairs and rearrangements continue, contributing to ongoing acoustic feedback. The Δt2 parameters for cycle 1, cycle 2, and cycle 3 are calculated to be 53 s, 71 s, and 47 s, respectively.
A definitive correlation exists between current changes and acoustic variations across different discharge cycles, underscoring the potential of acoustic diagnostics as a critical tool for future battery anomaly state monitoring. The parameters such as ΔAE, Δt1, and Δt2 not only reflect the immediate response to electrical inputs but also demonstrate a consistent relationship with the magnitude and timing of current fluctuations, emphasizing the applicability of acoustic diagnostics in real-time battery monitoring and anomaly detection.
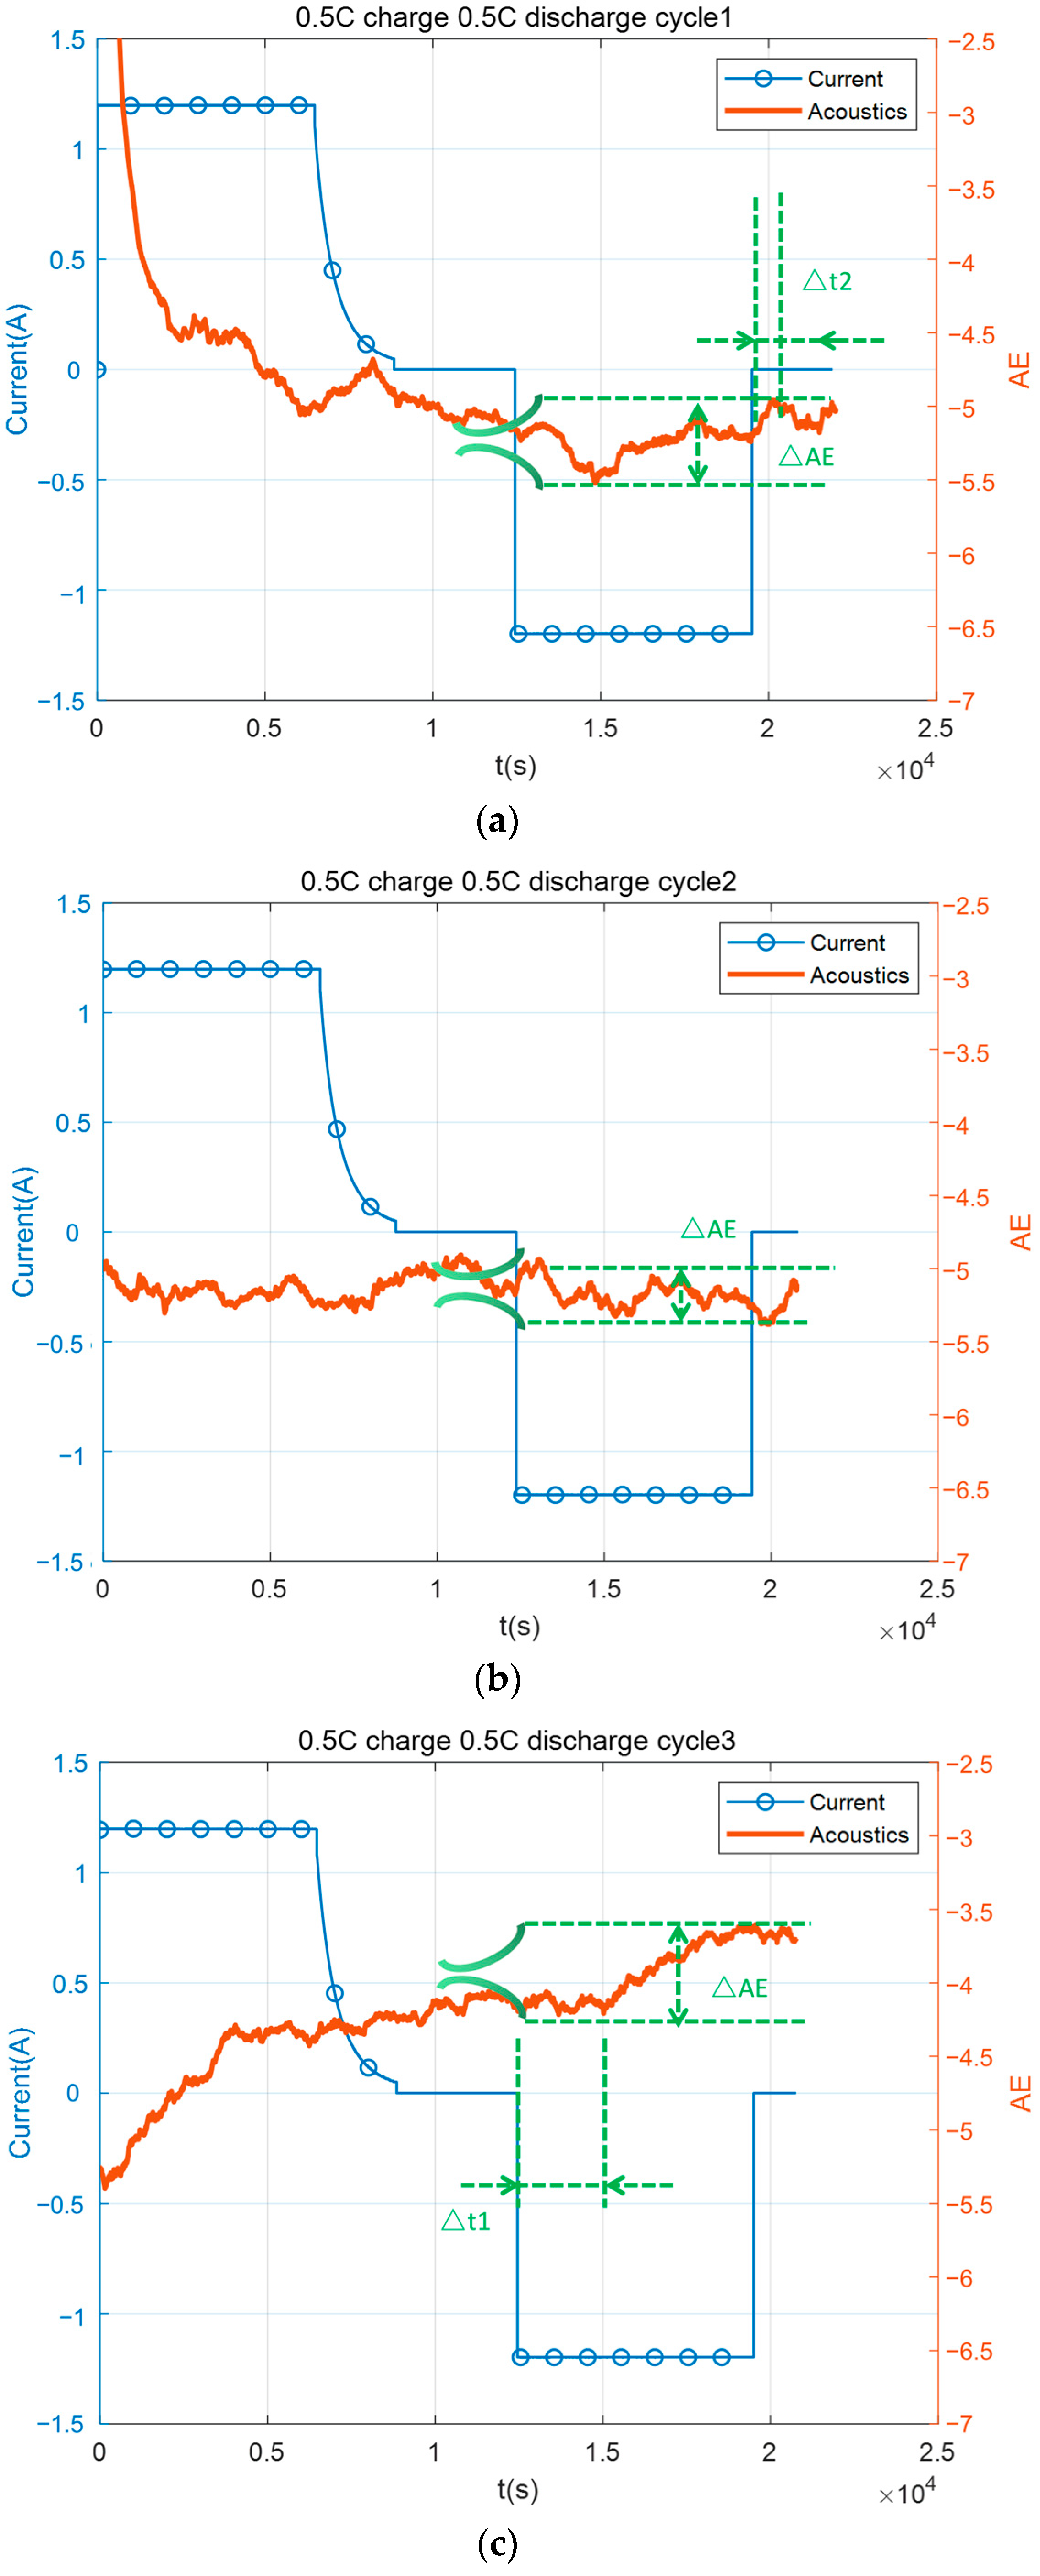
The analysis of acoustic signal characteristics during the 0.5 C discharge process, as depicted in Figure 6, provides insights into the correlation between current discharge patterns and acoustic emissions. The methodology for correlating current and AE signals involves both temporal analysis and statistical correlation techniques, offering a robust framework for identifying significant patterns in acoustic signal behavior in relation to current discharge activities. This examination elucidates the extended observation window for acoustic signals due to the longer duration of the 0.5 C discharge process, which incorporates two phases of equivalent 0.5 C charge and discharge, thereby introducing interference in observing acoustic discharge characteristics.
In cycle 1, Figure 6a, the resting period with zero current between charge and discharge cycles marks a distinct point of analysis. The signal change trend exhibits a clear upward trend after a period (Δt1) from the start of the 0.5 C discharge, indicating more pronounced acoustic signal fluctuations; this upward trend ceases after a period (Δt2) as the current returns to zero, underscoring the acoustic signal’s delayed response to the discharge process. The range of amplitude variation during this entire process, denoted as ΔAE, is significant, enhancing the discriminability of acoustic signals during different operational states.
In cycle 2, Figure 6b, the acoustic characteristics reflected by the charge and discharge at 0.5 C show slight differences, with minimal amplitude change during the discharge process, highlighting the challenges in distinguishing between charge and discharge phases based solely on acoustic data under low current conditions. This observation underscores the need for advanced analytical techniques to enhance signal discrimination and accuracy in battery diagnostics.
In Figure 6c, cycle 3 reveals an evident rise in the acoustic signal following the 0.5 C discharge, with the rising peak after the discharge end serving as a marker for the acoustic response to the discharge process. This phase demonstrates a significant amplitude change, illustrating the acoustic signal’s sensitivity to discharge activities and its potential as a diagnostic tool for battery health monitoring.
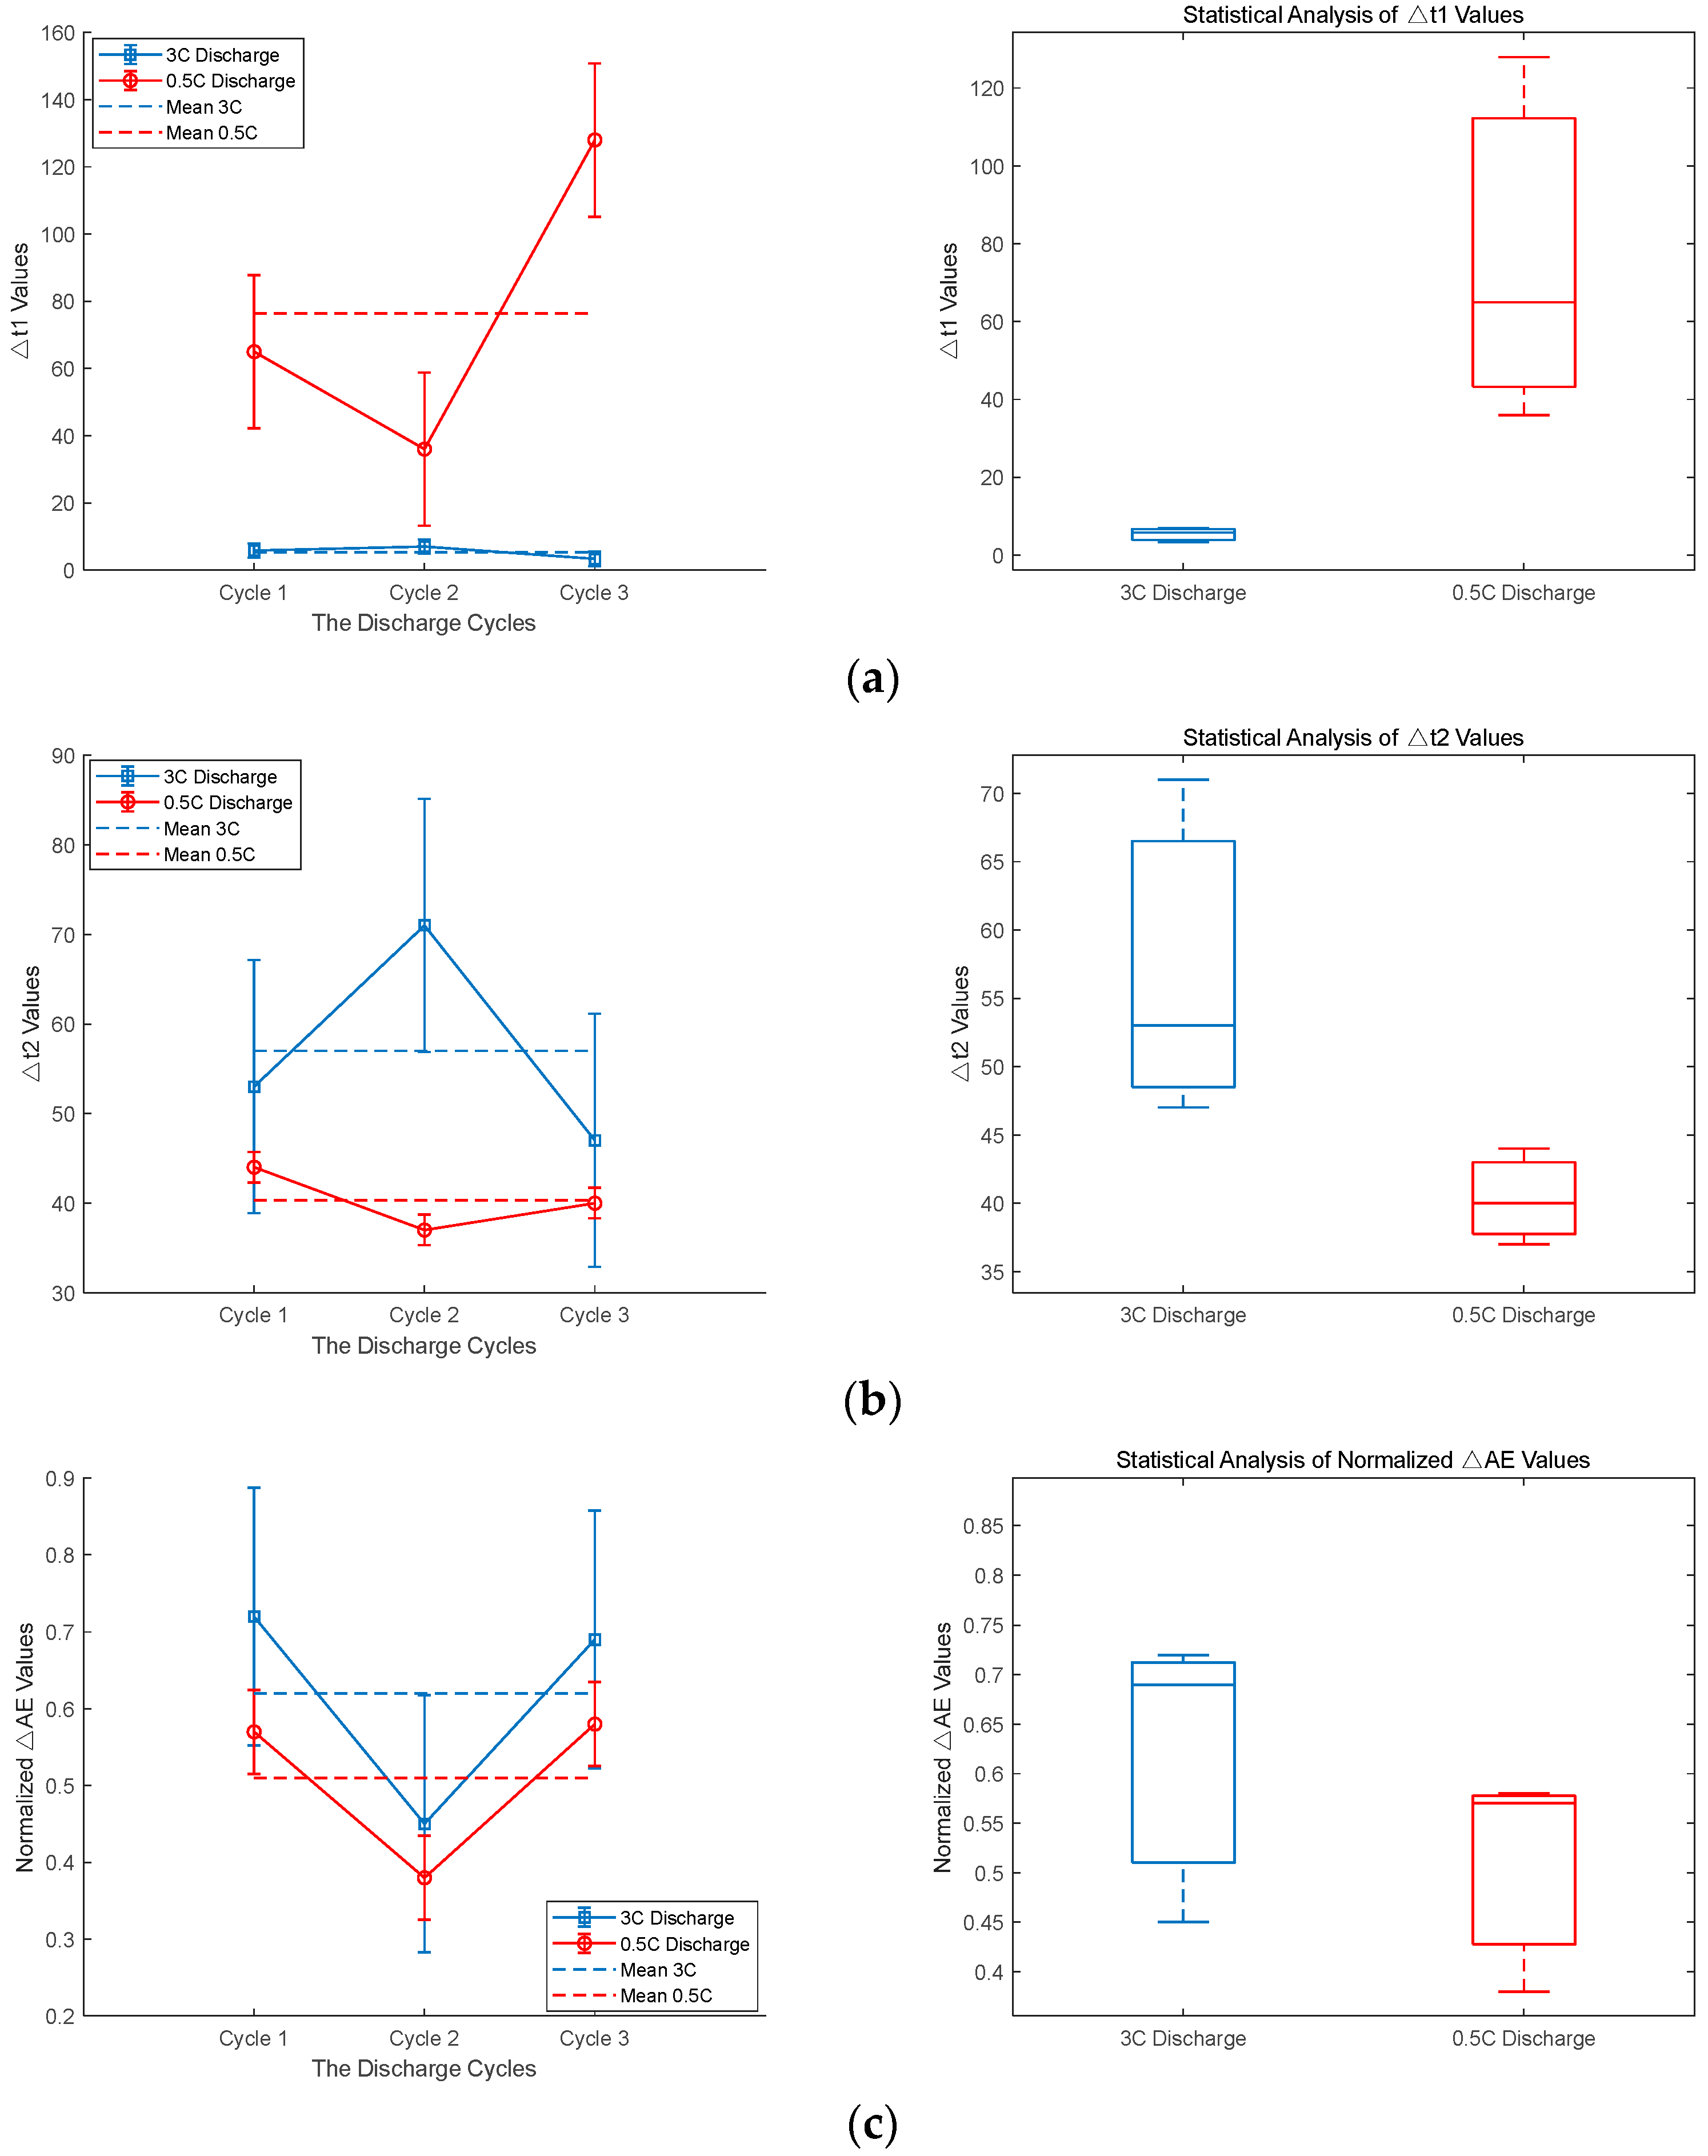
In this study, error bars and box plots are utilized in Figure 7 to visually represent the variability and central tendencies of acoustic emission data under different discharge conditions. Error bars were computed using confidence intervals based on the standard error of the mean for each dataset, reflecting the precision and reliability of the measurements under varied operational stresses. Similarly, box plots were constructed to display the range of data distribution and central tendency, providing a comprehensive overview of the acoustic response variability under high and low discharge conditions. This approach not only highlights the dynamic and sometimes unpredictable behavior of the battery under stress but also ensures that our analysis adheres to rigorous statistical standards, offering clear insights into the operational safety and performance of the batteries. This combined method helps illustrate the extent of variation in parameters such as ΔAE, Δt1, and Δt2, reflecting the differing structural responses and stress levels of the battery at various discharge rates and offering a more comprehensive understanding of battery behavior under different operational conditions.
In Figure 7a, error bars for ΔAE at 3 C discharge show significant variations, indicating a wide range of acoustic responses and suggesting varying stress levels at each cycle due to rapid load changes. Longer error bars imply inconsistent behaviors, reflecting dynamic responses to high operational stress. Conversely, at 0.5 C discharge, error bars are shorter, suggesting more consistent acoustic emissions and stable structural integrity under lower stress, leading to uniform responses. The box plot for 3 C might display a higher median and broader interquartile range, highlighting greater fluctuations in acoustic emissions and possibly impacting battery longevity and safety due to high stress. In contrast, the box plot at 0.5 C shows a lower median and narrower range, indicating less variability and stress, promoting controlled battery behavior under these conditions.
In Figure 7b, error bars at 3 C discharge for Δt1 are notably short, suggesting a rapid response to high discharge demands and consistent, quick reactions across cycles, underlining the effectiveness of acoustic diagnostics in capturing fast structural responses under stress. At 0.5 C discharge, Δt1 values are higher and show greater inconsistency, as reflected by longer and more varied error bars, highlighting slower and more variable responses under lower stress conditions. The box plot for 3 C would likely show a tightly grouped distribution, indicating uniformity in rapid responses, while the box plot for 0.5 C would display a wider spread, reflecting inconsistent response times and less efficient structural reactions at lower discharge rates.
In Figure 7c, error bars for Δt2 at 3 C discharge indicate a moderate duration of acoustic signals, showing some variability but not excessively, suggesting that while the battery structure undergoes stress, it does not persist too long. At 0.5 C discharge, shorter Δt2 values with smaller error bars indicate a quicker cessation of acoustic signals, implying faster recovery or less impactful structural changes. The box plot for 3 C discharge might show moderate variability in signal duration, with outliers possibly indicating prolonged stress episodes. Conversely, a tighter box plot at 0.5 C would reflect more consistent and shorter durations, aligning with quicker recoveries and less severe operational stresses.
The results reveal a heightened sensitivity of acoustic diagnostics to high discharge rates. Signals at 3 C discharge exhibited more pronounced fluctuations and variations than those at 0.5 C, demonstrating the method’s ability to detect and quantify the stress and structural changes occurring within the battery. This makes acoustic diagnostics a non-invasive, crucial tool for assessing battery health and ensuring operational safety. Furthermore, the analysis shows that acoustic signals under high discharge conditions have a delayed response to discharge activities, which highlights the method’s capability of capturing the nuances of stress relaxation and microstructural rearrangements within the battery. This delay, more noticeable under high discharge conditions, provides insights beyond what traditional electrical measurement techniques can offer. Additionally, the acoustic signal amplitude (ΔAE) under 3 C discharge conditions showed, on average, 1.35 times greater variation compared to 0.5 C, underscoring the method’s effectiveness in monitoring structural changes. The duration of these signals (Δt2) was also, on average, 1.3 times longer during 3 C discharges, indicating more substantial internal structural changes due to the higher current impact. These findings collectively emphasize the diagnostic precision of acoustic methods, proving special value for non-invasive assessments and advancing battery management systems.

4.2. Analysis of Acoustic Signal Characteristics in the Frequency Domain

The frequency domain analysis offers a nuanced perspective on the battery’s acoustic characteristics under varying discharge currents, complementing the insights gained from the time-domain analysis. This analysis delves into the structural dynamics and the effects of operational stresses on the battery, as evidenced by acoustic emissions.
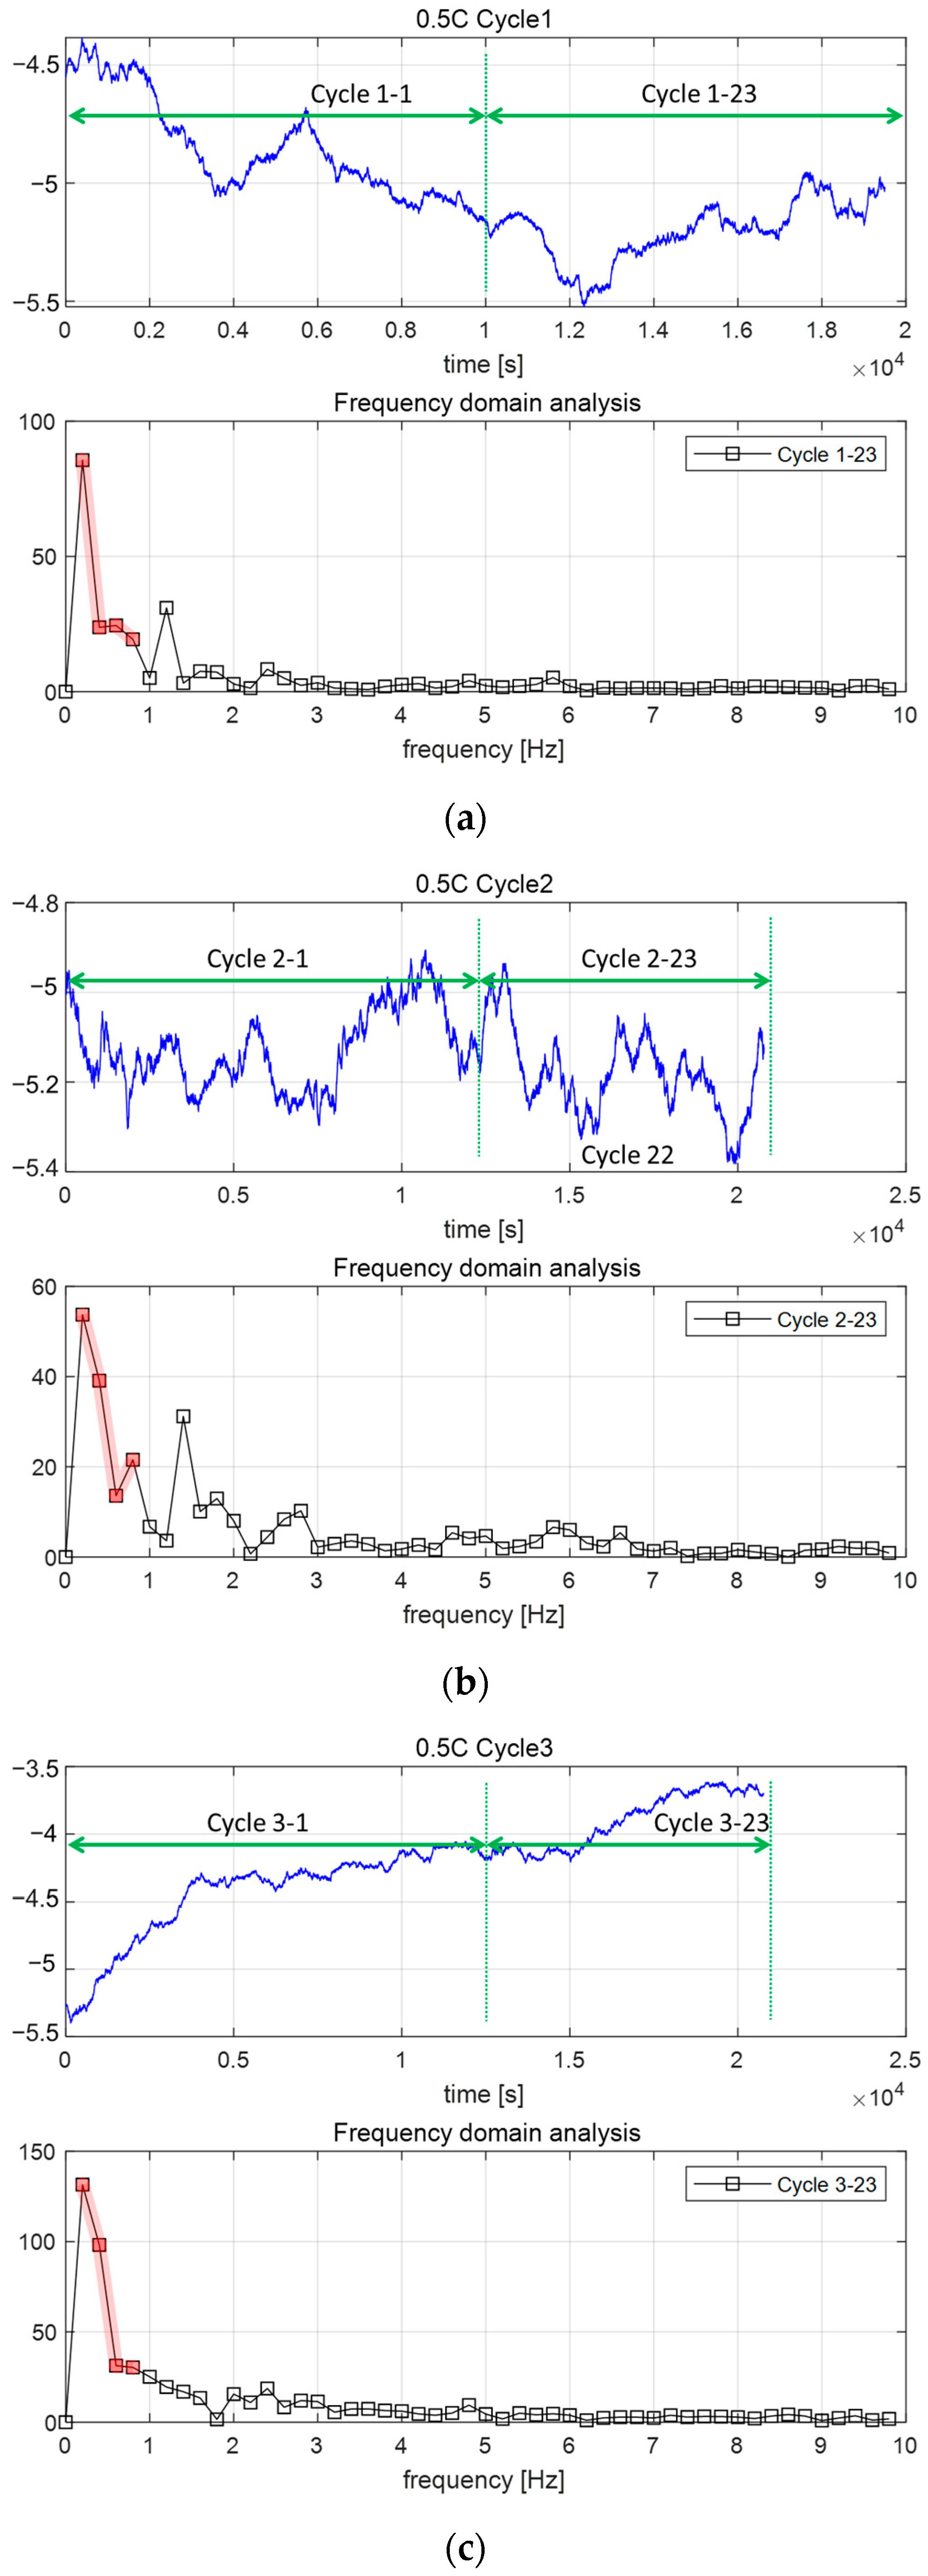
For the 0.5 C discharge, observed in Figure 8, the notable amplitude of the center frequency underscores the acoustic signal’s stability and the mild impact of lower discharge rates on the battery’s structure. This clear and discernible frequency domain characteristic suggests that the structural changes are minimal, with a consistent impact from the discharge process, making it a reliable indicator of the battery’s operational health.
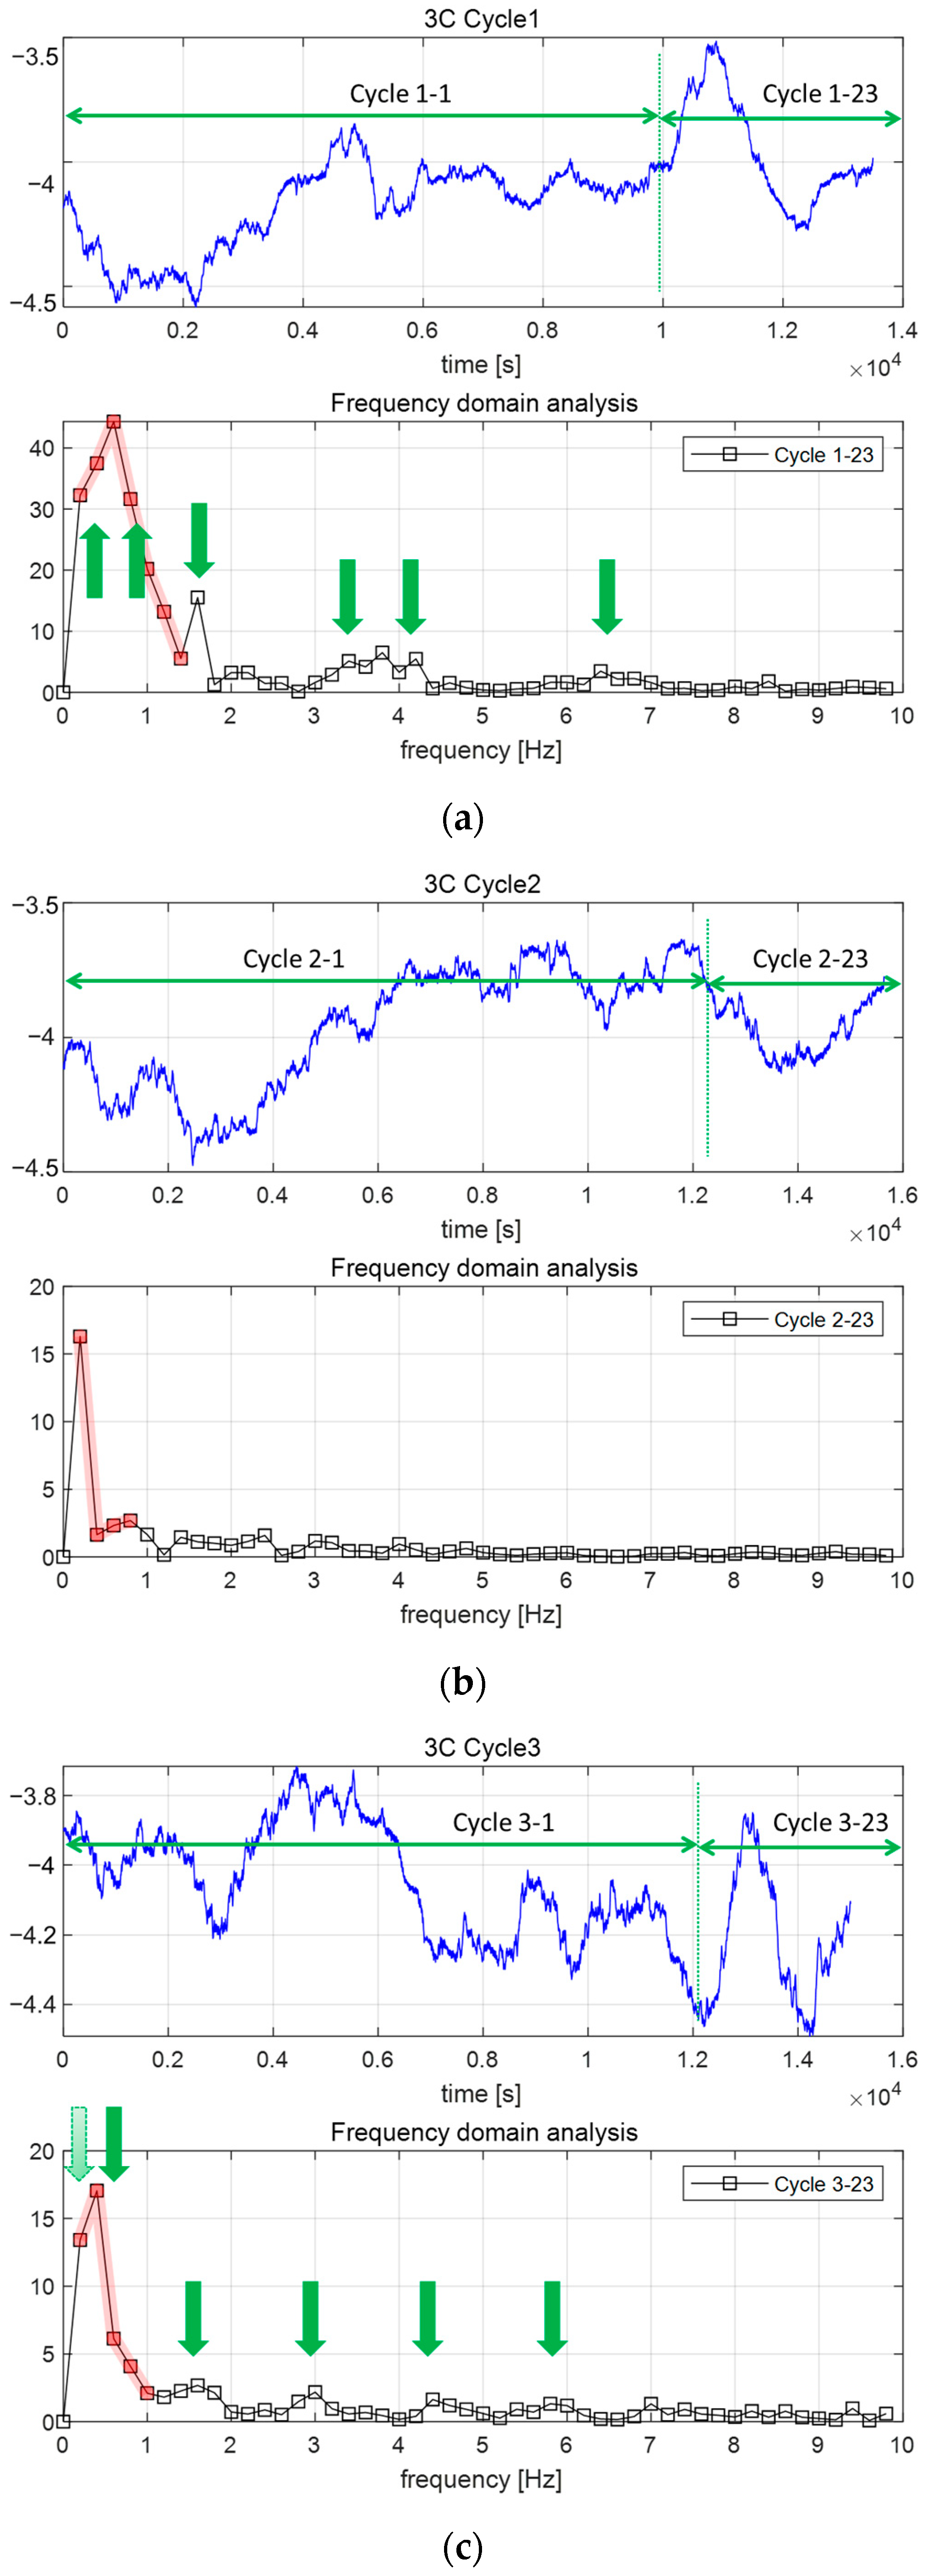
Conversely, the 3 C discharge cycles depicted in Figure 9 show a significant reduction in the center frequency’s amplitude. This indicates a substantial impact of high-current discharge on the battery structure despite the shorter duration of the discharge process. The emergence of multi-peak or peak-shift phenomena suggests complex structural dynamics at play, with the battery exhibiting varied responses to the intense discharge conditions. These findings highlight the acoustic signal’s sensitivity to discharge intensity and its diagnostic potential in identifying structural impacts and changes within the battery.
By comparing the acoustic responses to 0.5 C and 3 C discharge currents through frequency domain analysis, several key insights are uncovered that underscore the pivotal role of this approach in acoustic diagnostics. First and foremost, the sensitivity of acoustic diagnostics to discharge rates is evident, as lower currents like 0.5 C discharge lead to higher amplitude values of the center frequency, indicating a more focused and consistent acoustic signal response. This contrasts sharply with the 3 C discharge, where significant structural impacts manifest through decreased amplitude and the emergence of multi-peak phenomena, pointing to the differential effects of discharge rates on battery structure. Moreover, the diagnostic capabilities of frequency domain analysis become apparent, offering clear and pronounced amplitude information for low-current discharges, which aids in evaluating long-term battery operation status. In contrast, the distinct multi-peak characteristics observed during high-current discharges act as crucial indicators for assessing immediate structural impacts. Integrating insights from both time and frequency domain analyses facilitates a comprehensive understanding of battery behavior under varying discharge conditions. This holistic approach not only bolsters our capacity to monitor and diagnose battery health with precision but also highlights the indispensable value of acoustic diagnostics as a key tool for advancing battery technology and ensuring operational safety and reliability.

5. Conclusions and Future Prospects

This study has successfully demonstrated the efficacy of acoustic diagnostics in monitoring the health and operational integrity of cylindrical batteries under varying discharge currents. Through rigorous analysis in both time and frequency domains, the research has identified distinct acoustic behaviors at different discharge rates, notably at 0.5 C and 3 C. These findings underscore the sensitivity of acoustic diagnostics to different stress levels induced by varying discharge rates, offering a non-invasive approach to assessing battery health comprehensively. The study elucidates several key conclusions that highlight the unique attributes of acoustic diagnostics and their practical implications:
  • Sensitivity to Discharge Conditions: The acoustic signals displayed pronounced differences in behavior under low (0.5 C) and high (3 C) discharge conditions. Specifically, lower discharge rates showed more stable acoustic signals, indicating lesser structural impact, whereas higher rates exhibited significant reductions in center frequency amplitude and the emergence of multi-peak phenomena, signaling substantial internal structural stress.
  • Diagnostic Accuracy: the delay in acoustic signal change (Δt1) under 3 C discharge was found to be four times greater, on average, compared to 0.5 C, indicating heightened sensitivity to higher discharge rates. The amplitude of the acoustic signals (ΔAE) showed an average of 1.35 times greater variation under 3 C than under 0.5 C, suggesting a more significant impact on the battery’s internal structure at higher discharge rates. The duration of the acoustic signals (Δt2) extended by an average of 1.3 times under 3 C conditions, reflecting the more substantial structural changes and stress experienced by the battery.
  • Implications for Battery Management: The discharge current of electric vehicles fluctuates within a certain range, depending on operating conditions. Under conditions where temperature variations are not considered, it is generally believed that higher current charging and discharging put greater stress on the battery structure, causing more significant structural damage, thus generating more pronounced acoustic signals. Therefore, one important purpose of acoustic monitoring is to promptly capture the acoustic characteristics associated with significant structural damage induced by 3 C high currents; on the other hand, capturing acoustic signals at 0.5 C low currents helps monitor long-term changes in battery structure, which is very helpful for understanding battery aging.
  • Future Prospects: Building on the current findings, future research will focus on refining the integration of acoustic diagnostics within BMS. This includes enhancing the precision of fault detection and increasing the reliability of the diagnostics through advanced signal processing techniques and the integration of machine learning algorithms. Additionally, exploring the scalability of this technology for different battery types and operational conditions in EVs will be crucial. The research will also delve into the development of real-time adaptive monitoring strategies that can dynamically adjust to changing battery conditions, thereby optimizing battery performance and extending lifespan. The ultimate goal is to utilize acoustic diagnostics not only for safety and maintenance but also for the proactive management of battery health, thereby supporting the broader application of EVs in sustainable transportation.

Author Contributions

N.Z. and Z.C. made contributions to the conception and design of the work. N.Z. and K.W. performed the algorithm, experiments and result analysis. X.S. performed the algorithm programming. All authors have read and agreed to the published version of the manuscript.

Funding

This research was funded by the National Natural Science Foundation of China (51977029), the Fundamental Research Funds for the Central Universities (N2003002), the Fundamental Research Funds for the Central Universities (N2303006), the Opening Foundation of Key Laboratory of Advanced Manufacture Technology for Automobile Parts, Ministry of Education (2022 KLMT01) and the Liaoning Provincial Science and Technology planned project (2021JH6/10500135). Chinese National Natural Science Foundation (52172401). Liaoning Provincial Science and Technology planned project (2022JH2/101300225).

Data Availability Statement

The original contributions presented in the study are included in the article, further inquiries can be directed to the corresponding author.

Acknowledgments

We acknowledge Affiliation 2 for providing the site and some equipment for experiments.

Conflicts of Interest

The authors declare no conflicts of interest.

Nomenclature

EVselectric vehicles
SOCstate of charge
BMSbattery management system
SAsignal amplitude
LIBslithium-ion batteries
TOFtime of flight
FIRFinite Impulse Response
UTultrasonic testing
AEacoustic emission
SEIsolid electrolyte interface
NDTnon-destructive testing
FFTFast Fourier Transform
CANcontroller area network
NMCnickel manganese cobalt oxide

References

  1. Sun, F. Green Energy and Intelligent Transportation—Promoting green and intelligent mobility. Green Energy Intell. Transp. 2022, 1, 100017. [Google Scholar] [CrossRef]
  2. Xiong, R.; Kim, J.; Shen, W.; Lv, C.; Li, H.; Zhu, X.; Zhao, W.; Gao, B.; Guo, H.; Zhang, C.; et al. Key technologies for electric vehicles. Green Energy Intell. Transp. 2022, 1, 100041. [Google Scholar] [CrossRef]
  3. Parsa, S.M.; Norozpour, F.; Shoeibi, S.; Shahsavar, A.; Aberoumand, S.; Afrand, M.; Said, Z.; Karimi, N. Lithium-ion battery thermal management via advanced cooling parameters: State-of-the-art review on application of machine learning with exergy, economic and environmental analysis. J. Taiwan Inst. Chem. Eng. 2023, 148, 104854. [Google Scholar] [CrossRef]
  4. Li, S.; Zhang, C.; Du, J.; Cong, X.; Zhang, L.; Jiang, Y.; Wang, L. Fault diagnosis for lithium-ion batteries in electric vehicles based on signal decomposition and two-dimensional feature clustering. Green Energy Intell. Transp. 2022, 1, 100009. [Google Scholar] [CrossRef]
  5. Lu, J.; Xiong, R.; Tian, J.; Wang, C.; Sun, F. Deep learning to estimate lithium-ion battery state of health without additional degradation experiments. Nat. Commun. 2023, 14, 2760. [Google Scholar] [CrossRef]
  6. Li, X.; Hua, W.; Wu, C.; Zheng, S.; Tian, Y.; Tian, J. State estimation of a lithium-ion battery based on multi-feature indicators of ultrasonic guided waves. J. Energy Storage 2022, 56, 106113. [Google Scholar] [CrossRef]
  7. Hao, W.; Yuan, Z.; Li, D.; Zhu, Z.; Jiang, S. Study on mechanical properties and failure mechanism of 18650 Lithium-ion battery using digital image correlation and acoustic emission. J. Energy Storage 2021, 41, 102894. [Google Scholar] [CrossRef]
  8. Hendricks, C.; Bhanu, S.; Michael, P. Lithium-ion battery strain gauge monitoring and depth of discharge estimation. J. Electrochem. Energy Convers. Storage 2023, 20, 011008. [Google Scholar] [CrossRef]
  9. Zhang, M.; Fan, X. Review on the state of charge estimation methods for electric vehicle battery. World Electr. Veh. J. 2020, 11, 23. [Google Scholar] [CrossRef]
  10. Laadjal, K.; Cardoso, A.J.M. Estimation of lithium-ion batteries state-condition in electric vehicle applications: Issues and state of the art. Electronics 2021, 10, 1588. [Google Scholar] [CrossRef]
  11. Liu, W.; Placke, T.; Chau, K.T. Overview of batteries and battery management for electric vehicles. Energy Rep. 2022, 8, 4058–4084. [Google Scholar] [CrossRef]
  12. Hsieh, A.G.; Bhadra, S.; Hertzberg, B.J.; Gjeltema, P.J.; Goy, A.; Fleischer, J.W.; Steingart, D.A. Electrochemical-acoustic time of flight: In operando correlation of physical dynamics with battery charge and health. Energy Environ. Sci. 2015, 8, 1569–1577. [Google Scholar] [CrossRef]
  13. Chang, J.-J.; Zeng, X.-F.; Wan, T.-L. Real-time measurement of lithium-ion batteries’ state-of-charge based on air-coupled ultrasound. AIP Adv. 2019, 9, 085116. [Google Scholar] [CrossRef]
  14. Sun, H.; Muralidharan, N.; Amin, R.; Rathod, V.; Ramuhalli, P.; Belharouak, I. Ultrasonic nondestructive diagnosis of lithium-ion batteries with multiple frequencies. J. Power Sources 2022, 549, 232091. [Google Scholar] [CrossRef]
  15. Gold, L.; Bach, T.; Virsik, W.; Schmitt, A.; Müller, J.; Staab, T.E.; Sextl, G. Probing lithium-ion batteries’ state-of-charge using ultrasonic transmission–Concept and laboratory testing. J. Power Sources 2017, 343, 536–544. [Google Scholar] [CrossRef]
  16. Wu, Y.; Wang, Y.; Yung, W.K.C.; Pecht, M. Ultrasonic health monitoring of lithium-ion batteries. Electronics 2019, 8, 751. [Google Scholar] [CrossRef]
  17. Das, A.; Barai, A.; Masters, I.; Williams, D. Comparison of tab-to-busbar ultrasonic joints for electric vehicle Li-ion battery applications. World Electr. Veh. J. 2019, 10, 55. [Google Scholar] [CrossRef]
  18. Guillet, N.; Gau, V.; Thivel, P.-X. Ultrasound interrogation, an operando technique for the monitoring of battery materials. In International Operando Battery Days; HAL: Grenoble, France, 2022. [Google Scholar]
  19. Galiounas, E.; Tranter, T.G.; Owen, R.E.; Robinson, J.B.; Shearing, P.R.; Brett, D.J. Battery state-of-charge estimation using machine learning analysis of ultrasonic signatures. Energy AI 2022, 10, 100188. [Google Scholar] [CrossRef]
  20. Zhang, K.; Yin, J.; He, Y. Acoustic Emission Detection and Analysis Method for Health Status of Lithium Ion Batteries. Sensors 2021, 21, 712. [Google Scholar] [CrossRef] [PubMed]
  21. Cattin, V.; Perichon, P.; Dahmani, J.; Schwartzmann, B.; Heiries, V. Detection of electric arcs in large batteries. World Electr. Veh. J. 2013, 6, 762–770. [Google Scholar] [CrossRef]
  22. Schweidler, S.; Dreyer, S.L.; Breitung, B.; Brezesinski, T. Acoustic Emission Monitoring of High-Entropy Oxyfluoride Rock-Salt Cathodes during Battery Operation. Coatings 2022, 12, 402. [Google Scholar] [CrossRef]
  23. Beganovic, N.; Söffker, D. Estimation of remaining useful lifetime of lithium-ion battery based on acoustic emission measurements. J. Energy Resour. Technol. 2019, 141, 041901. [Google Scholar] [CrossRef]
  24. Villevieille, C.; Boinet, M.; Monconduit, L. Direct evidence of morphological changes in conversion type electrodes in Li-ion battery by acoustic emission. Electrochem. Commun. 2010, 12, 1336–1339. [Google Scholar] [CrossRef]
  25. Copley, R.J.; Cumming, D.; Wu, Y.; Dwyer-Joyce, R.S. Measurements and modelling of the response of an ultrasonic pulse to a lithium-ion battery as a precursor for state of charge estimation. J. Energy Storage 2021, 36, 102406. [Google Scholar] [CrossRef]
  26. Davies, G.; Knehr, K.W.; Tassell, B.V.; Hodson, T.; Biswas, S.; Hsieh, A.G.; Steingart, D.A. State of charge and state of health estimation using electro-chemical acoustic time of flight analysis. J. Electrochem. Soc. 2017, 164, A2746. [Google Scholar] [CrossRef]
  27. Lu, J.; Xiong, R.; Tian, J.; Wang, C.; Hsu, C.-W.; Tsou, N.-T.; Sun, F.; Li, J. Battery degradation prediction against uncertain future conditions with recurrent neural network enabled deep learning. Energy Storage Mater. 2022, 50, 139–151. [Google Scholar] [CrossRef]
  28. Ke, Q.; Jiang, S.; Li, W.; Lin, W.; Li, X.; Huang, H. Potential of ultrasonic time-of-flight and amplitude as the measurement for state of charge and physical changings of lithium-ion batteries. J. Power Sources 2022, 549, 232031. [Google Scholar] [CrossRef]
  29. Robinson, J.B.; Owen, R.E.; Kok, M.D.R.; Maier, M.; Majasan, J.; Braglia, M.; Stocker, R.; Amietszajew, T.; Roberts, A.J.; Bhagat, R.; et al. Identifying defects in Li-ion cells using ultrasound acoustic measurements. J. Electrochem. Soc. 2020, 167, 120530. [Google Scholar] [CrossRef]
  30. Zhou, N.; Cui, X.; Han, C.; Yang, Z. Analysis of Acoustic Characteristics under Battery External Short Circuit Based on Acoustic Emission. Energies 2022, 15, 1775. [Google Scholar] [CrossRef]
  31. Zeng, X.; Ivanchenko, P.; Kalogiannis, T.; Van Mierlo, J.; Berecibar, M. Novel Sensing Techniques for Lithium-ion Battery Modeling and States Estimation. In Proceedings of the 36th International Electric Vehicle Symposium and Exhibition (EVS36), Sacramento, CA, USA, 11–14 June 2023. [Google Scholar]
  32. Zwicker, M.F.R.; Moghadam, M.; Zhang, W.; Nielsen, C. Automotive battery pack manufacturing—A review of battery to tab joining. J. Adv. Join. Process. 2020, 1, 100017. [Google Scholar] [CrossRef]
  33. McGee, T.M.; Neath, B.; Matthews, S.; Ezekoye, O.A.; Haberman, M.R. Ultrasonic inspection of lithium-ion pouch cells subjected to localized thermal abuse. J. Power Sources 2023, 583, 233542. [Google Scholar] [CrossRef]
  34. Popp, H.; Koller, M.; Jahn, M.; Bergmann, A. Mechanical methods for state determination of Lithium-Ion secondary batteries: A review. J. Energy Storage 2020, 32, 101859. [Google Scholar] [CrossRef]
  35. Wang, K.; Chen, Q.; Yue, Y.; Tang, R.; Wang, G.; Tang, L.; He, Y. Cyclic aging monitoring of lithium-ion battery based on acoustic emission. Nondestruct. Test. Eval. 2023, 38, 480–499. [Google Scholar] [CrossRef]
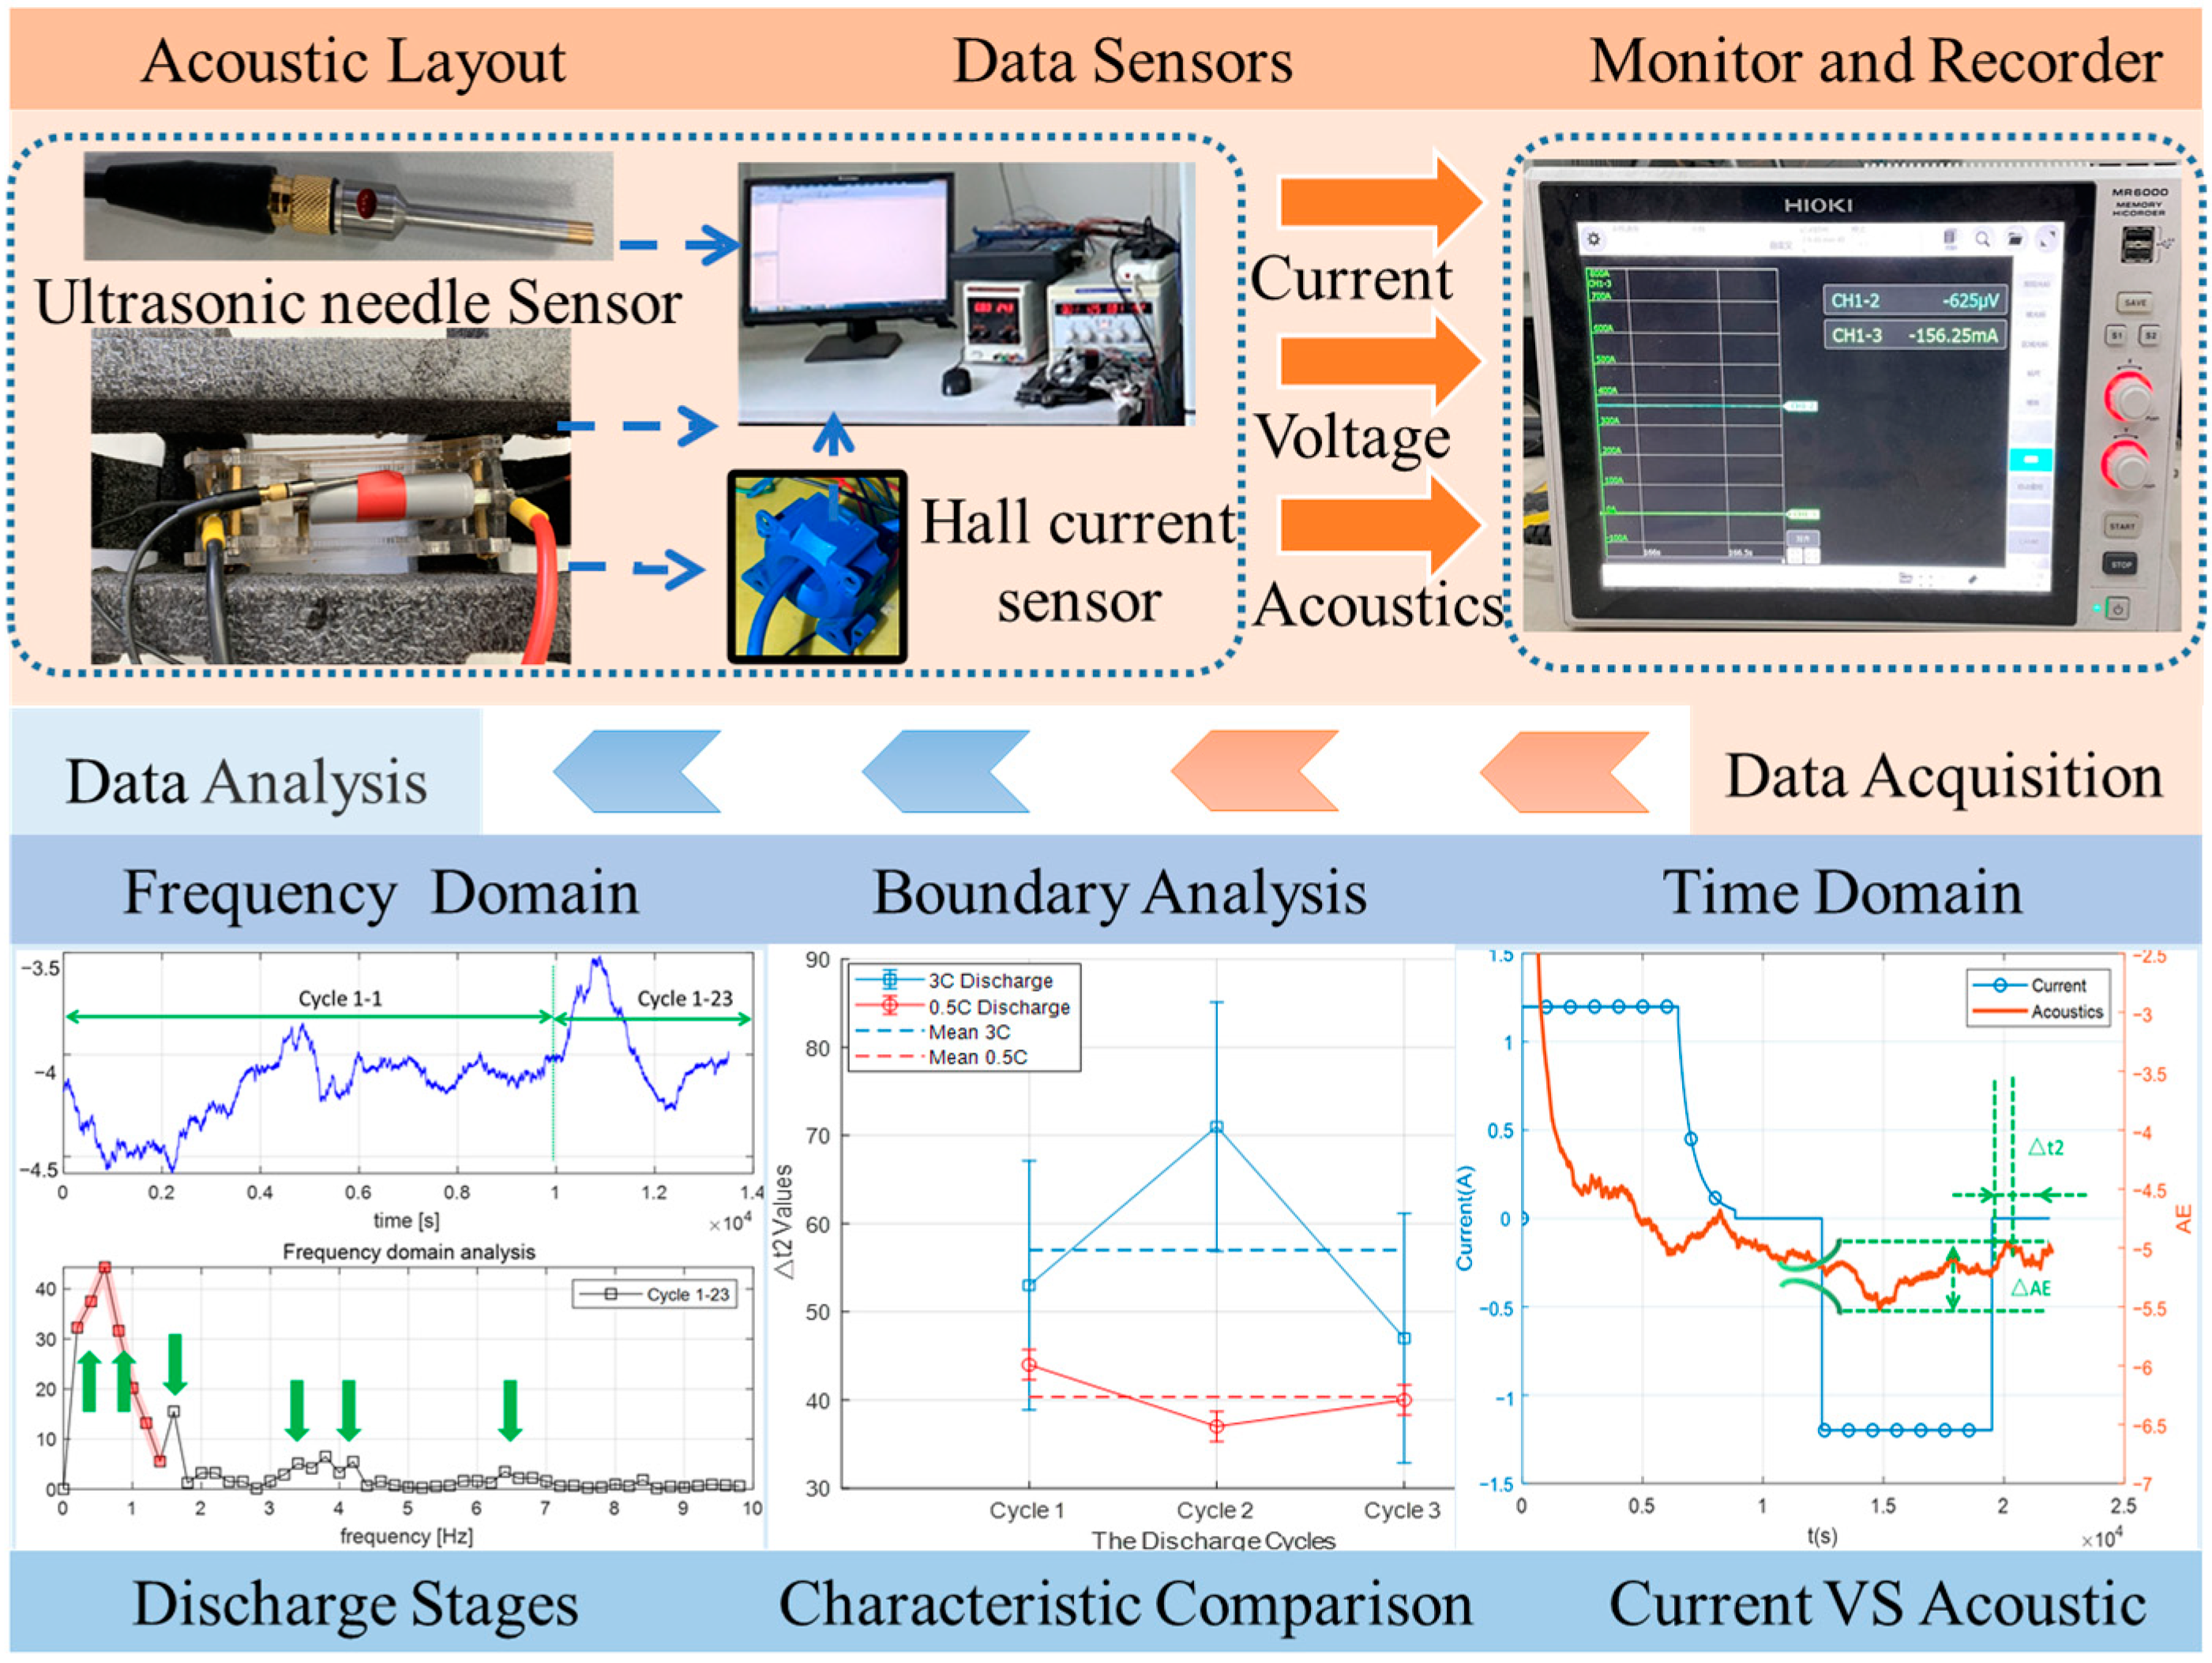
Figure 1. Schematic diagram of the experimental setup based on AE.
Wevj 15 00229 g001
Figure 2. (a) The original acoustic signal is compared with the filtered signal; (b) coaxial variation curve of the acoustic signal and current signal and division of 3 cycles.
Wevj 15 00229 g002
Figure 3. The definition of the parameters for the acoustic signal.
Wevj 15 00229 g003
Figure 4. (a) The overall acoustic signal for 3 C discharge current; (b) The overall acoustic signal for 0.5 C discharge current.
Wevj 15 00229 g004
Figure 5. (a) Current and acoustic characteristics of 3 C discharge for cycle 1; (b) current and acoustic characteristics of 3 C discharge for cycle 2; (c) current and acoustic characteristics of 3 C discharge for cycle 3.
Wevj 15 00229 g005
Figure 6. (a) Current and acoustic characteristics of 0.5 C discharge for cycle 1; (b) current and acoustic characteristics of 0.5 C discharge for cycle 2; (c) current and acoustic characteristics of 0.5 C discharge for cycle 3.
Wevj 15 00229 g006
Figure 7. (a) Comparison of Δt1 for different discharge currents; (b) comparison of Δt2 for different discharge currents; (c) comparison of ΔAE for different discharge currents.
Wevj 15 00229 g007
Figure 8. (a) Frequency domain characteristics of 0.5 C discharge current for cycle 1; (b) frequency domain characteristics of 0.5 C discharge current for cycle 2; (c) frequency domain characteristics of 0.5 C discharge current for cycle 3.
Wevj 15 00229 g008
Figure 9. (a) Frequency domain characteristics of 3 C discharge current for cycle 1; (b) frequency domain characteristics of 3 C discharge current for cycle 2; (c) frequency domain characteristics of 3 C discharge current for cycle 3.
Wevj 15 00229 g009
Table 1. List of main parameters of the experiment.
Type of Battery Cell18650-Type Cylindrical NMC Lithium Cells
Nominal cell capacity (0.3 C)2.0 Ah
Average battery cell voltage3.6 V
End of discharge voltage2.5 V
High voltage protection4.2 V
Disclaimer/Publisher’s Note: The statements, opinions and data contained in all publications are solely those of the individual author(s) and contributor(s) and not of MDPI and/or the editor(s). MDPI and/or the editor(s) disclaim responsibility for any injury to people or property resulting from any ideas, methods, instructions or products referred to in the content.