Article

Design and Optimization of External Rotor Consequent Pole Permanent Magnet Motor with Low Iron Loss and Low Torque Ripple

School of Electrical Engineering, Tiangong University, Tianjin 300387, China
*
Author to whom correspondence should be addressed.
World Electr. Veh. J. 2024, 15(6), 232; https://doi.org/10.3390/wevj15060232
Submission received: 25 April 2024 / Revised: 20 May 2024 / Accepted: 26 May 2024 / Published: 28 May 2024

Abstract

:
To reduce the iron loss and torque ripple of an external rotor consequent pole (ERCP) motor used in an electric vehicle air-conditioning compressor, the magnetic pole structure of the motor was improved, and an unequal piecewise consequent pole (CP) structure was designed. The performance of the motor is optimized by reducing the harmonic content in the air gap flux density and reducing the iron saturation degree of the motor. The designed CP structure can significantly reduce the iron loss and torque ripple of the motor. Based on the Taguchi method, the optimal size parameters of the unequal piecewise CP structure are determined, and the final optimization design scheme is obtained. The results of finite element simulation and high-precision iron loss model show the following: compared with the original motor, the iron loss and torque ripple of the motor with the final optimized design scheme are significantly reduced.

1. Introduction

As electric vehicle technology becomes more and more mature, its advantages such as low energy consumption are becoming more prominent and it will gradually become one of the commonly used means of transportation in daily life [1]. Permanent magnet motors have the advantages of high efficiency and high power density and are widely used in electric vehicles. The efficiency and healthy operation of the motor are very important to the normal operation of the electric vehicle [2,3]. The motor losses affect the operating efficiency and safety of the electric vehicle. Excessive motor loss will not only reduce efficiency, but also lead to excessive temperature rise, which will affect the safe operation of electric vehicles [4]. Therefore, the problem of reducing motor losses in electric vehicles needs to be focused on.
The external rotor consequent pole permanent magnet motor (ERCP-PMM) has the characteristics of a compact structure, convenient installation, reliable operation, low noise, energy saving and high efficiency. In recent years, due to the rising price of rare earth, the development of rare earth permanent magnet motors has been limited. The consequent pole (CP) structure can effectively reduce the amount of permanent magnet while ensuring the power density of the motor, which is conducive to reducing the manufacturing cost of the motor [5,6]. However, the arc length of the magnetic pole of the CP structure is generally much larger than that of the iron pole, resulting in an asymmetric distribution of the air gap flux density and many even harmonics. Therefore, it will cause high iron loss and torque ripple of the motor [7,8,9,10].
To reduce the iron loss and torque ripple of the motor, many scholars have proposed various optimization schemes. In [11], the asymmetric magnetic pole arrangement is used to suppress the even harmonics in the air gap flux density of the CP motor. In [12], the even harmonics in the counter electromotive force of the motor are reduced by increasing the number of winding layers, thereby reducing the torque ripple and iron loss of the motor. In [13], the iron loss of the motor is reduced by increasing the width of the stator slot opening and changing the shape of the rotor slot to reduce the harmonic content in the air gap flux density. In [14,15], the iron loss of the permanent magnet motor is reduced by optimizing the rotor structure of the PMM. The shape of the magnet and rotor core is determined by the combination of automatic optimization and the adaptive finite element method. In [16], a novel method for optimizing the pole pitch ratio of the magnet and the shape of the rotor core was proposed to reduce the harmonics of the rotor magnetomotive force. This method is used to effectively reduce the iron loss of the interior PMM. In [17], the iron loss of the motor was reduced by optimizing the geometry of the rotor flux barrier. In [18], a method of considering different stator tooth lengths and rotor pole air gap surface radii is introduced. The iron loss of the motor is reduced by changing the air gap surface radius of the rotor pole and the air gap radius of the stator teeth located between different phases.
In [19], a new symmetrical magnetic pole structure of N-S-Iron-S-N-Iron is proposed. The magnetic pole structure can improve the symmetry of the air gap magnetic field of the motor, which is beneficial to reduce the iron loss of the permanent magnet motor. It can also improve the unipolar magnetic flux leakage problem of the motor. In [20], two structures of staggered arrangement of polar magnetic poles and iron cores were proposed. The symmetry of the magnetic flux distribution of the motor is improved, and the even harmonics of the air gap flux density are reduced. It is beneficial to reduce the iron loss and torque ripple of the motor. In [21,22], changing the edge angle of the magnetic pole was proposed. In [23], an arc-shaped magnetic pole optimization structure was proposed. The magnetic pole structure proposed above can make the flux distribution of the motor more uniform and reduce the even harmonics of the air gap flux density and the torque ripple of the motor.
In [24], an external rotor consequent pole permanent magnet motor (ERCP-PMM) with hybrid consequent pole structure was designed. It is mainly used in air conditioning compressors in electric vehicles. In this paper, the average torque, torque ripple, and iron loss of the motor are calculated with finite element simulation and the high-precision iron loss model. In practical applications, the iron loss and torque ripple of the motor need to be further reduced to avoid affecting the service life of the motor and the safety and stability of the automobile air conditioning operation. Therefore, this paper improves the magnetic pole structure of this ERCP-PMM. An unequal piecewise CP structure is proposed. The S-pole is designed as a one long and two short symmetrical arrangement. The N pole is equivalently replaced by the iron pole designed on both sides of the permanent magnet, and the iron pole is symmetrically modified to achieve better results. The improved CP structure can effectively reduce the harmonic content in the air gap flux density and the iron saturation degree of the motor.
The unequal piecewise CP structure is optimized based on the Taguchi method. The optimal size parameters are obtained, and the final optimization scheme is determined. The average torque and torque ripple of the original motor and the final improved motor are obtained with finite element simulation. The iron loss of the original motor and the iron loss of the final improved motor are calculated using the high-precision iron loss model. The finite element simulation and calculation results show the following: the unequal piecewise magnetic pole structure can use less permanent magnet consumption to achieve the average torque of the original motor, which is beneficial to reduce the cost of motor manufacturing. Under the condition that the average torque is basically unchanged, the iron loss and torque ripple of the motor are significantly reduced, which is beneficial to improve the operation stability and service life of the motor.

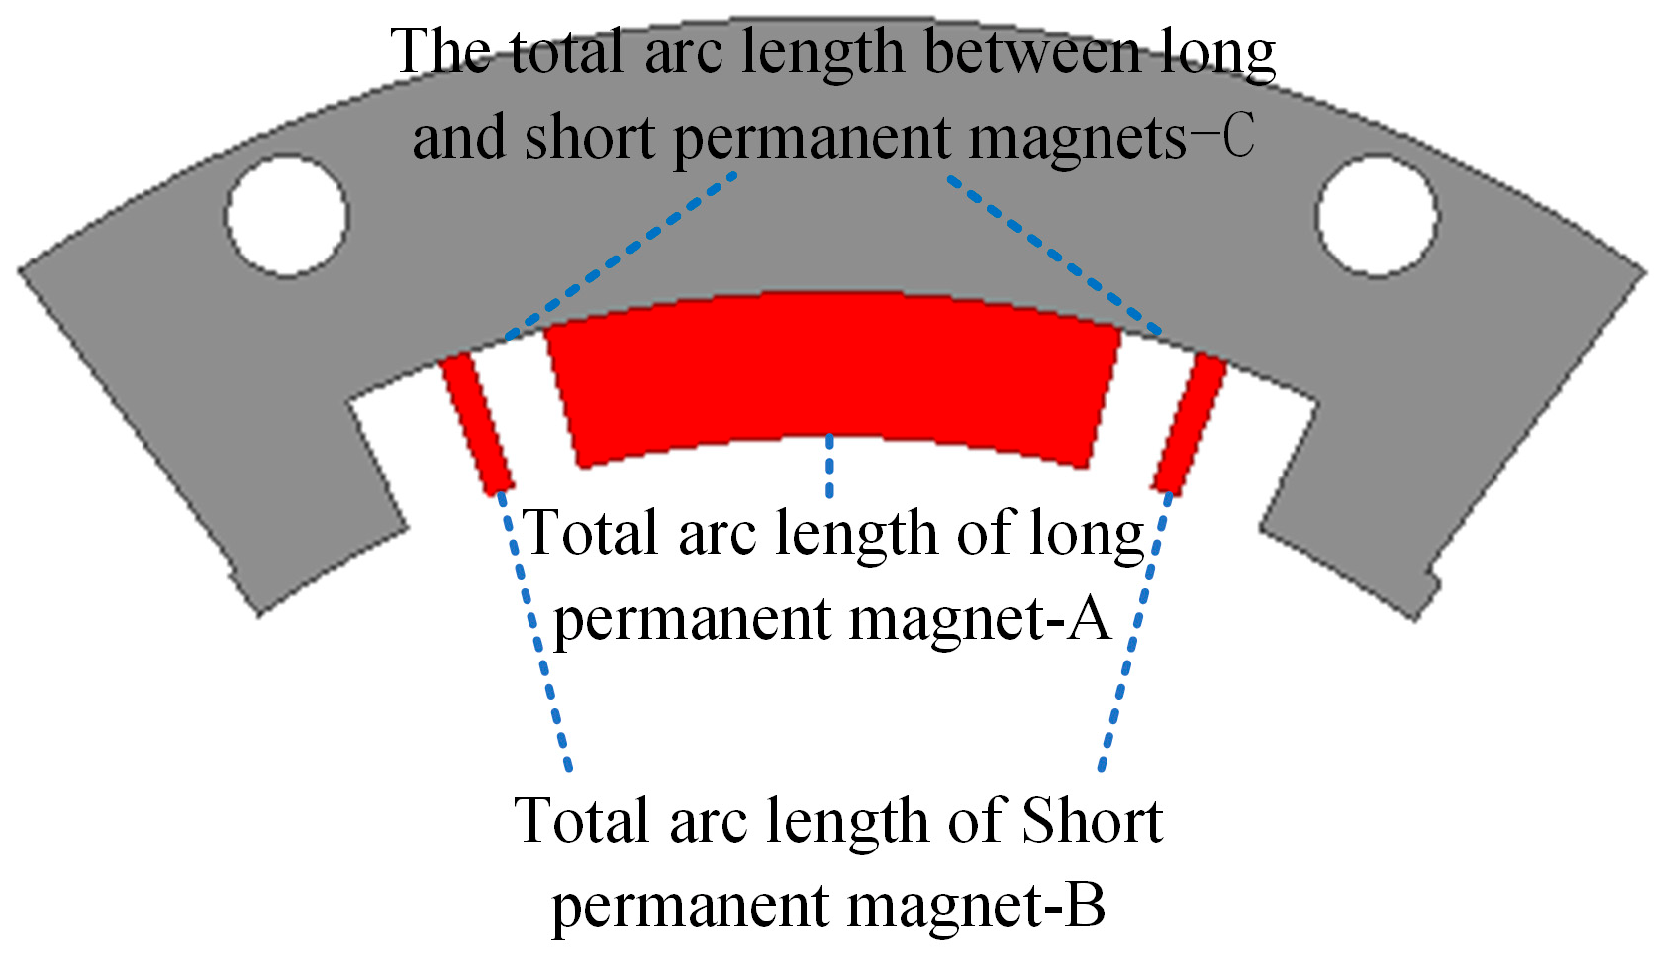
2. Design and Analyses of Unequal Piecewise Consequent Pole Structure

This paper is based on the optimization design of a 10-pole 12-slot ERCP-PPM applied to the air conditioning compressor of electric vehicles. The iron loss and torque ripple of the motor are effectively reduced by improving the CP magnetic pole structure of the motor. Before the improvement of the magnetic pole structure, the physical model of the motor is shown in Figure 1. The specific parameters are shown in Table 1. The main performance of the original motor is shown in Table 2.
To reduce the iron loss and torque ripple of the motor, this paper improves the magnetic pole structure of the original motor and proposes an unequal piecewise CP structure. The magnetic pole structure of the original motor is improved to an unequal piecewise consequent pole structure with a one long and two short circumferential symmetrical distribution. Only the S-pole permanent magnet is used in the motor, and the N-pole is replaced by the iron pole designed on both sides of the permanent magnet. The thickness of the permanent magnet in the motor remains unchanged, the total arc length of the permanent magnet decreases, the slotted arc length of the rotor decreases, and the iron pole is widened.
The long PM is fixed in the center of the rotor slot, and the short PMs are symmetrically distributed on both sides. There is a certain interval between the short PMs and the long PM. The interval between the two short permanent magnets to the long permanent magnet remains equal. The amount of two short PMs is the same. The thickness of the iron pole on both sides of the permanent magnet is consistent. The Iron-S-N arrangement of the original motor is improved to an Iron-S-S-S-Iron arrangement. The physical model of the motor with unequal piecewise CP structure is shown in Figure 2. The specific parameters are shown in Table 3.

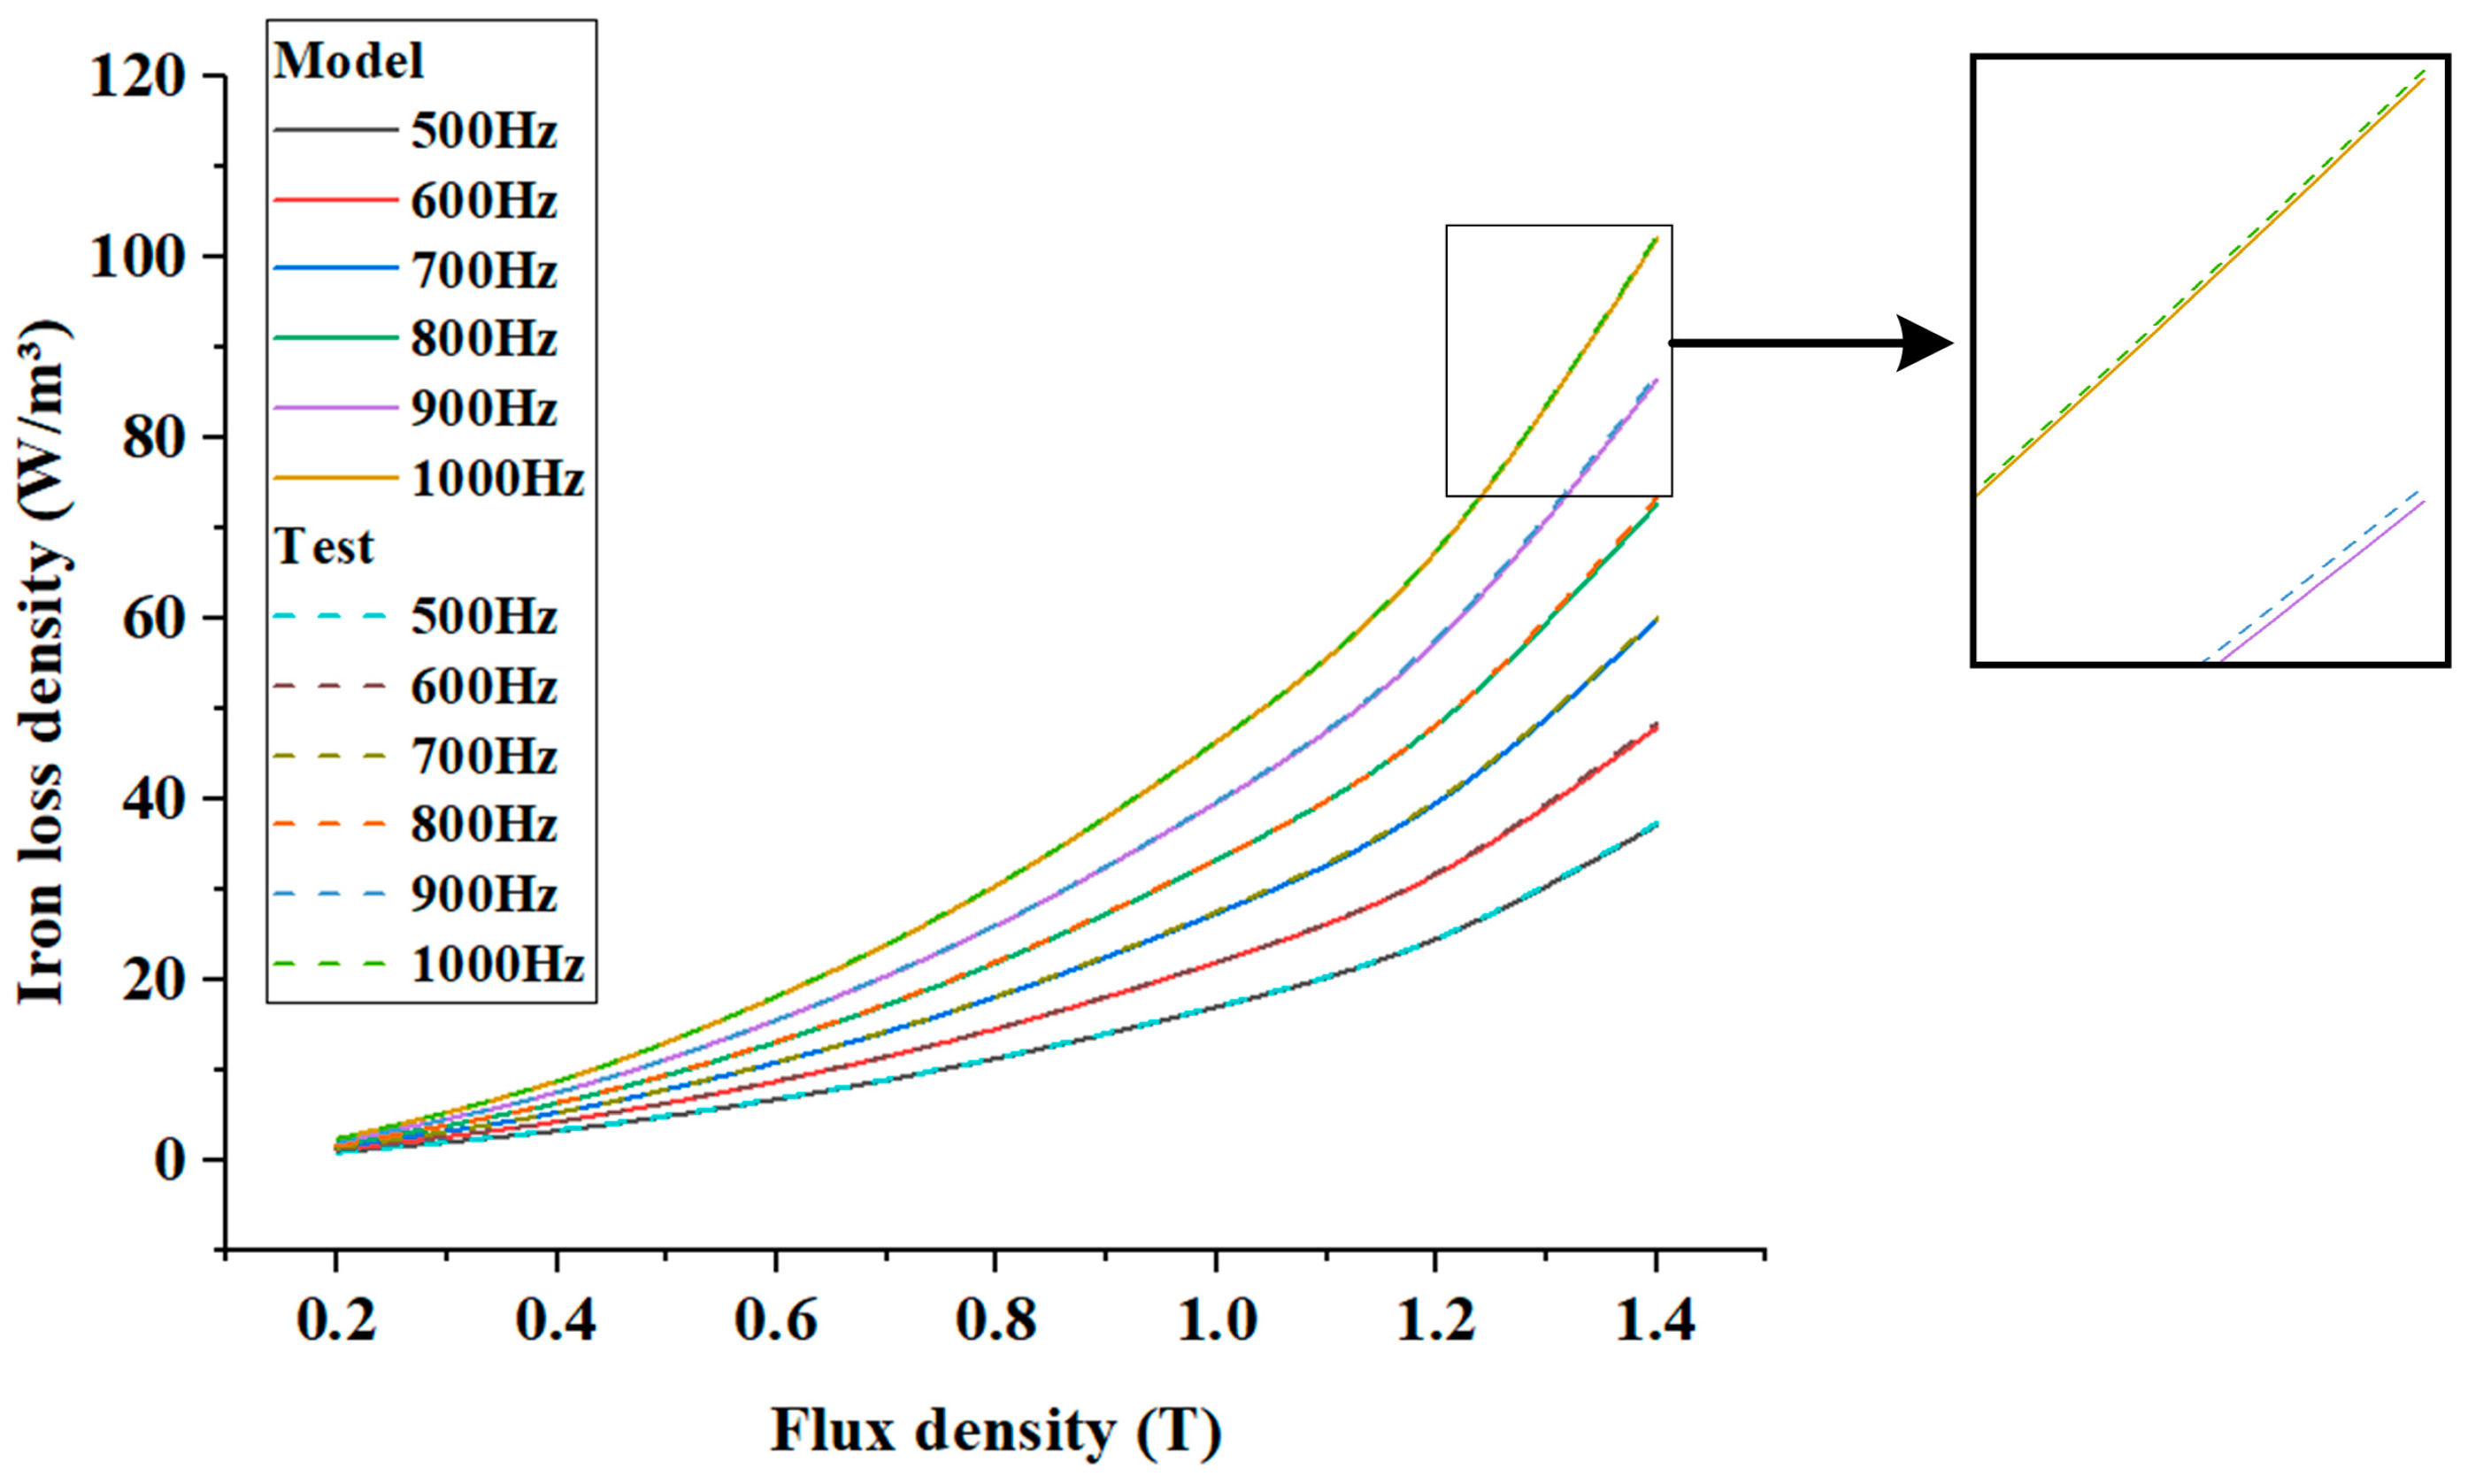
2.1. Calculation Method of Motor Iron Loss

The generation mechanism of iron loss is complex, and the traditional iron loss model used in the finite element software (AnsysEM21.1) cannot accurately calculate the iron loss of the motor [25]. Therefore, this paper uses the proposed high-precision piecewise variable coefficient two-term iron loss model to calculate the iron loss of the original motor and the improved motor. The specific expression of the iron loss model is as follows:
P F e , L = k h L f , B m f B m α L f , B m + k s f , B m k e f 2 B m 2 1 + b L f , B m B m c L f , B m P F e , H = k h H f , B m f B m α H f , B m + k s f , B m k e f 2 B m 2 1 + b H f , B m B m c H f , B m
k s f , B m = 3 D h f s i n h D h f     s i n D h f c o s h D h f     c o s D h f D h = d h π μ B m σ μ ( B m ) = 3736.6 B m 5 + 29,071 B m 4 64,533 B m 3 + 42,291 B m 2 + 1767.5 B m + 2070
where khL(f, Bm) and khH(f, Bm) are the hysteresis loss coefficients that vary with frequency and flux density amplitude at low frequency and high frequency, respectively; αL(f, Bm) and αH(f, Bm) are the Steinmetz coefficients that vary with frequency and flux density amplitude at low frequency and high frequency, respectively; ks(f, Bm) is the improved skin effect coefficient that varies with frequency and flux density amplitude; bL(f, Bm) and cL(f, Bm) are two correction coefficients that vary with frequency and flux density amplitude at low frequency; bH(f, Bm) and cH(f, Bm) are two correction coefficients that vary with frequency and flux density amplitude at high frequency. dh is the thickness of the silicon steel sheet; σ is the electrical conductivity of the silicon steel sheet; μ(Bm) is the relative permeability with the change in flux density at 50 Hz.
The iron loss data for the silicon steel sheet used in the ERCP-PMM were obtained with the Epstein square test. The model of the silicon steel sheet is B20AT1500, and the thickness is 0.2 mm. To obtain the expression of each coefficient in the iron loss model, the iron loss data obtained from the Epstein square test are imported into Matlab for fitting. The coefficients in the iron loss model are affected by two variables, namely frequency and flux density amplitude. Therefore, the binary polynomial based on the least square method can be used for fitting. Considering the complexity of the coefficient expression, the binary quadratic polynomial is finally used for fitting. The expression is as follows:
k h L f , B m = 1.24 × 1 0 7 f 2 + 0.027 B m 2 + 2.53 × 1 0 4 f B m 6.29 × 1 0 5 f 0.014 B m + 0.0035 α L f , B m = 1.13 × 1 0 5 f 2 0.52 B m 2 + 3.42 × 1 0 3 f B m + 7.3 × 1 0 3 f + 1.166 B m 0.7358 b L f , B m = 8.5 × 1 0 7 f 2 15.26 B m 2 + 4.34 × 1 0 3 f B m 0.013 f + 47.29 B m 41.81 c L f , B m = 9.39 × 1 0 6 f 2 2.02 B m 2 + 5.05 × 1 0 3 f B m + 0.0014 f + 3.786 B m + 0.7 k h H f , B m = 1.34 × 1 0 8 f 2 + 0.0019 B m 2 1.59 × 1 0 5 f B m 1.47 × 1 0 5 f + 0.016 B m + 0.0036 α H f , B m = 1.22 × 1 0 5 f 2 0.215 B m 2 + 2.05 × 1 0 3 f B m 0.014 f 0.38 B m + 4.242 b H f , B m = 2.6 × 1 0 7 f 2 + 4.39 B m 2 2.48 × 1 0 5 f B m 1.07 × 1 0 4 f 13.18 B m + 10.9 c H f , B m = 7.51 × 1 0 7 f 2 + 0.82 B m 2 + 6.49 × 1 0 4 f B m + 0.0012 f + 0.47 B m + 0.9623
Substituting the fitted expression of each coefficient and the corresponding frequency and magnetic flux density into the high-precision iron loss model, the iron loss can be calculated. The actual iron loss density curves at different frequencies and magnetic flux densities are shown in Figure 3 and Figure 4. It can be seen from Figure 3 and Figure 4 that the differentials between the calculation results of the high-precision iron loss model and the Epstein square test results are very small. This shows that the proposed iron loss model has a good fitting degree with the Epstein square test results, and the accuracy of the high-precision iron loss model has been verified.
In order to further verify the accuracy of the proposed high-precision iron loss model, the relative errors between the high-precision iron loss model and the Epstein square test results are compared, as shown in Figure 5 and Figure 6. It can be seen from Figure 5 and Figure 6 that the maximum relative error between the calculation results of the iron loss model and the test results is 4.32% under the low-frequency conditions. The maximum relative error under the high-frequency condition is 0.98%. It can be seen from the data results that the constructed high-precision iron loss model has a good fitting effect with the iron loss data of the silicon steel sheet. Therefore, the use of the iron loss model can effectively ensure the accuracy of the iron loss calculation of the consequent pole permanent magnet motor.

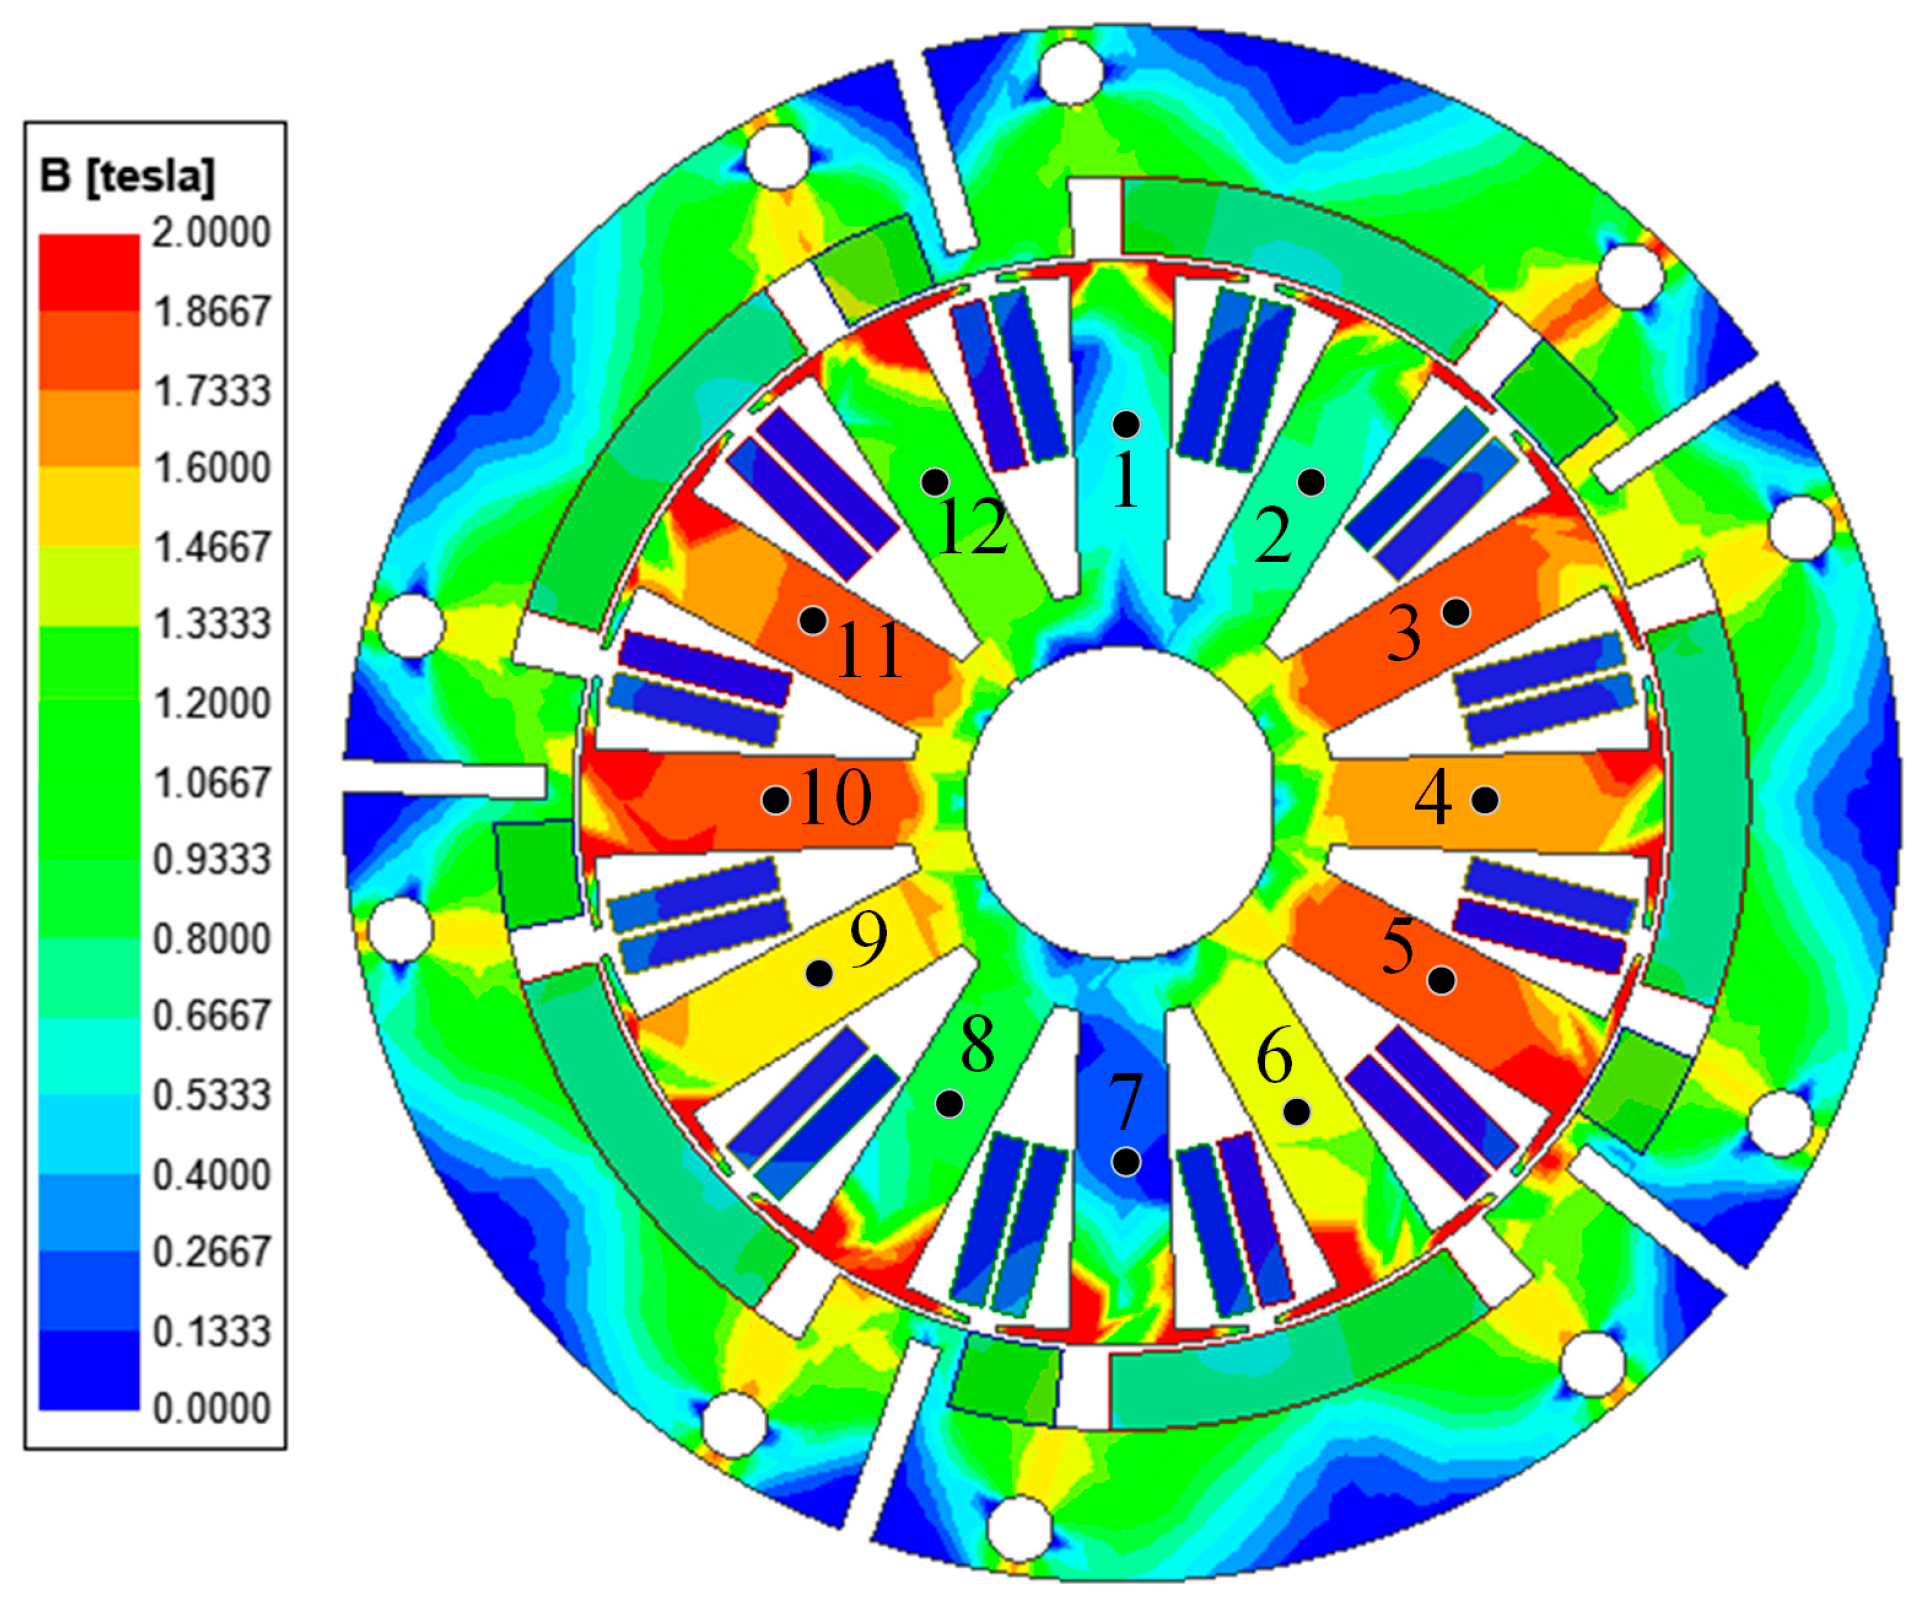
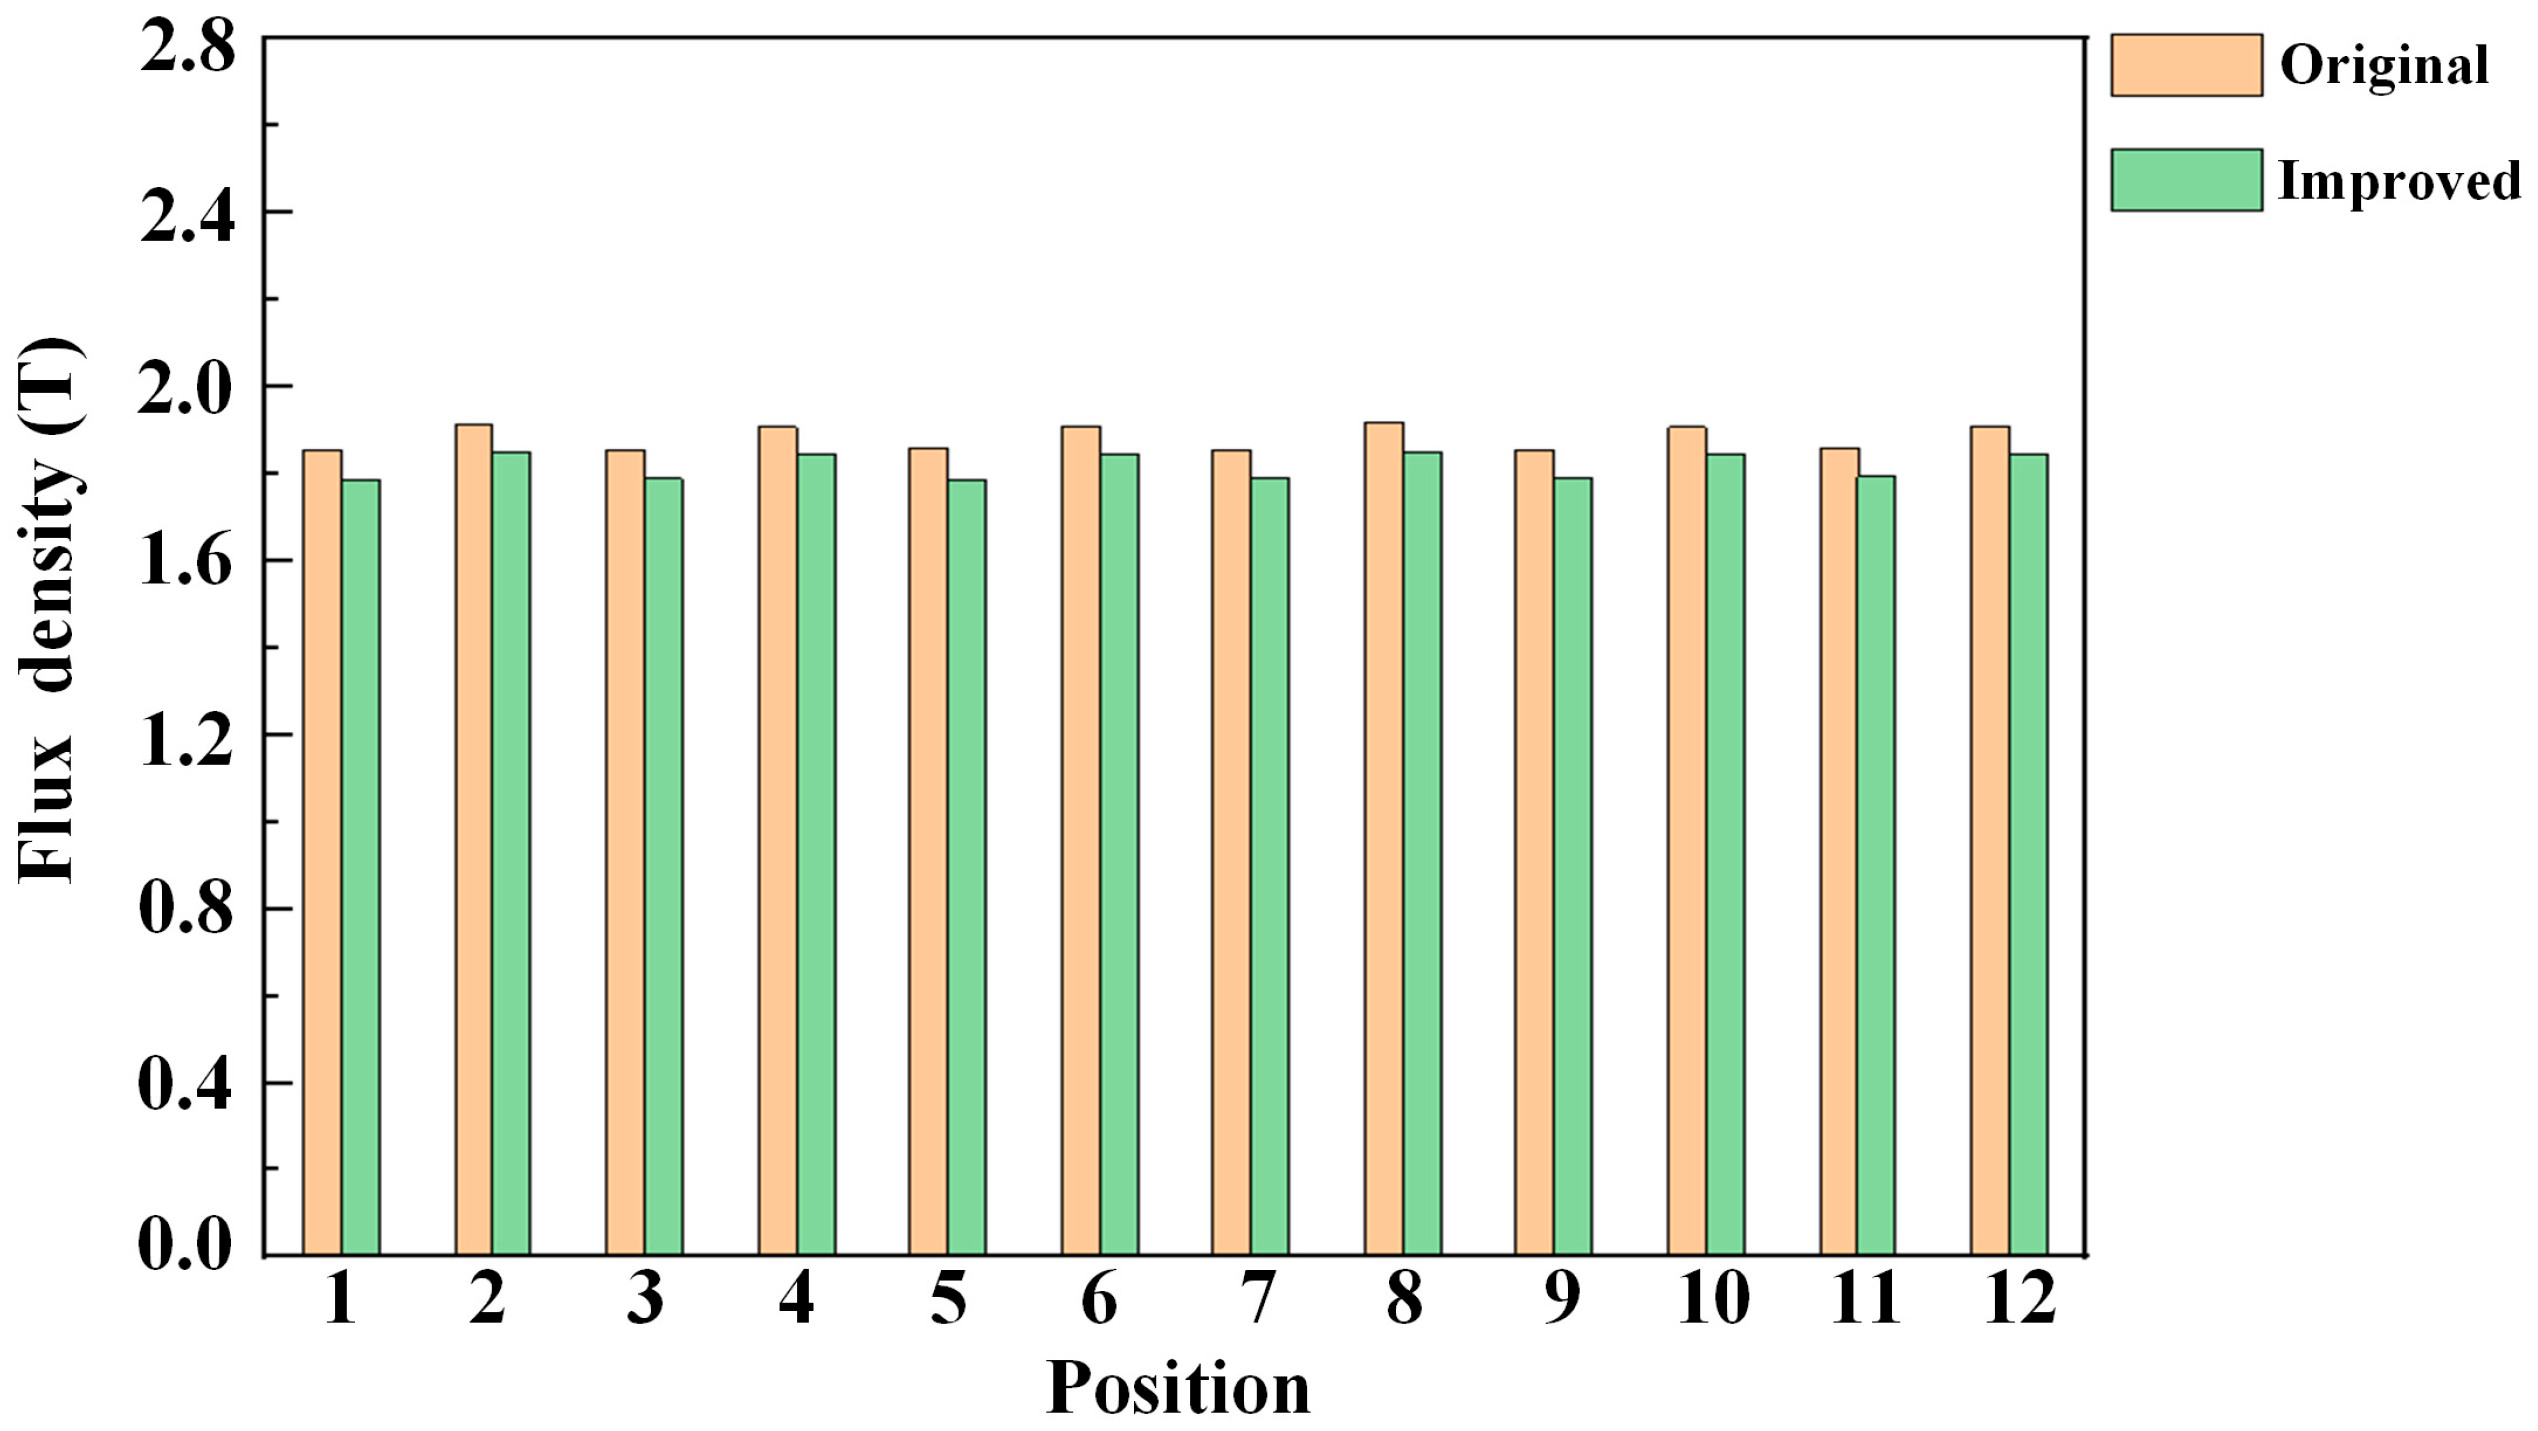
2.2. Performance Comparison between the Original Motor and the Preliminary Improved Motor

Through the finite element simulation, the flux density distribution of the motor before and after the improvement of the CP structure can be obtained, as shown in Figure 7 and Figure 8. Through the stator flux density distribution of the original motor and the preliminary improved motor, the iron saturation of the motor mostly occurs at the tooth tip of the stator. This is mainly caused by the harmonics in the air gap flux density. After using the unequal piecewise CP structure, the iron saturation area of the stator tooth tip of the motor is reduced. The overall iron saturation of the motor has decreased.
In order to more clearly see the change in the iron saturation degree of the motor before and after the improvement of the CP structure, the magnetic flux densities at twelve different positions of 1, 2, 3, 4, 5, 6, 7, 8, 9, 10, 11, and 12 are selected for comparison. The magnetic flux density at different positions of the original motor and the preliminary improved motor is shown in Figure 9. It can be seen from Figure 9 that the iron saturation degree at different positions of the preliminary improved motor has decreased. Therefore, the proposed unequal piecewise CP structure is beneficial to reduce the iron loss of the motor. The amplitudes of the fundamental wave and each harmonic wave obtained with Fourier decomposition of the air gap flux density are listed in Table 4.
Through Table 4, the main harmonics contained in the air gap flux density of the original motor are 2nd harmonics, 3rd harmonics, and 4th harmonics. After using the unequal piecewise CP structure, the amplitudes of the 2nd, 3rd, and 4th harmonics in the air gap flux density of the motor are effectively weakened. Therefore, the unequal piecewise CP structure can effectively reduce the harmonic content in the air gap flux density waveform, thereby effectively reducing the iron loss of the motor.
Through finite element simulation and iron loss model calculation, the average torque, torque ripple, and iron loss of the motor before and after the improvement of the CP structure can be obtained, as shown in Table 5. Through data comparison, the average torque of the preliminary improved motor under rated load is almost unchanged, while the iron loss of the motor is reduced by 27.51%. However, compared with the original motor, the torque ripple of the motor is increased. This is because the parameter size of the unequal piecewise CP structure has not reached the optimal selection. Therefore, the Taguchi method can be used to further optimize the unequal piecewise CP structure.

3. Optimization Design Based on the Taguchi Method

The Taguchi method is a local optimization design method that can achieve multi-objective optimization design. It was founded by Taguchi G of Japan in the 1970 s. By setting the orthogonal table, the Taguchi method can obtain better optimization design results through fewer tests. Therefore, the Taguchi method can improve the efficiency of motor optimization design and is an efficient motor optimization design method.
In order to better play the role of the unequal piecewise CP structure proposed in the previous section, this section uses the Taguchi method to optimize it. The influence of three optimization variables on the optimization objective is analyzed, that is, the total arc length of the long PM and the total arc length of the short PM and the interval between the long PM and the short PM. The long PM is fixed in the middle of the rotor slot. There are two short PMs with the same amount, which are symmetrically placed on both sides of the long PM. On this basis, the optimal design is carried out, the optimal size parameters are determined, and the final optimal design scheme is obtained.

3.1. Orthogonal Test Design

According to the proposed unequal piecewise CP structure, three optimization variables A, B, and C are selected, as shown in Figure 10. The A represents the total arc length of the long PM. The B represents the total arc length of the short PM, which, because there are two pieces, needs to be divided into two. The C represents the total arc length of the interval between the long PM and the short PM. Because the short PM has two pieces, the interval also needs to be divided into two. The minimum torque ripple and iron loss of the motor are set as the optimization objectives of this orthogonal test. The constraint condition is that the average torque reduction of the CP structure motor with the final optimization scheme is not more than 5% of the average torque of original motor.
According to the principle that the amount of permanent magnet does not exceed the amount of permanent magnet of the original motor, the value range of the optimization variable A is 21.12~29.12°, and the value range of the optimization variable B is 3~7°. Following the principle that the arc length of the long PM and the arc length of the short PM and the sum of the intervals between the two do not exceed the arc length of the rotor slot, the value range of C is selected to be 6~14°. According to the range of the upper and lower limits of each design variable, the values of five levels of each factor are evenly selected. The factor level table established is shown in Table 6.
According to the data in Table 6, the values of each factor at its five levels gradually increase with the increase in the number of levels. According to the number of selected factors and the number of levels of each factor, an orthogonal table L25 (53) is established, as shown in Table 7.
According to Table 7, the average torque and torque ripple of the motor under each orthogonal test are obtained via finite element simulation. The iron loss of the motor is calculated by using the high-precision iron loss model. The results of finite element simulation and iron loss model calculation of each orthogonal test are listed in Table 8.
In order to analyze the specific changes in the iron loss, average torque, and torque ripple of the ERCP-PMM under the five levels of the three optimization variables, and to analyze the relative importance of the three design variables, the results of 25 orthogonal tests need to be analyzed with average value analysis and variance analysis.

3.1.1. Average Value Analysis

The average value analysis is divided into the overall average value analysis of the performance indicators and the average value analysis of the performance indicators at various levels of each factor. The calculation formula for the overall average value analysis of the performance indicators is as follows:
m = i = 1 n m i n
where m is the overall average value of a performance index; n is the number of tests; and mi is the test result of a performance index corresponding to the i th test.
According to the above formula, the overall average value analysis of the test results of each column in Table 8 is carried out. The calculation results are shown in Table 9.
The average value of a performance index at each level of each factor refers to the average value of the test results of a performance index corresponding to a certain level of a certain factor. If the test results of the performance index P corresponding to the level I of factor A are P1, P2, P3, P4, and P5, respectively, the average value of the test results can be calculated with the following formula:
m P A ( I ) = P 1 + P 2 + P 3 + P 4 + P 5 5
where mPA(I) is the average value of the test results of the performance index P corresponding to level I of factor A.
According to the above formula, the average value of the average torque, torque ripple, and iron loss of the motor at each level taken by each factor can be analyzed, as shown in Table 10.
Through the data in Table 8, we can know the changes in the average torque, torque ripple, and iron loss of the motor under various factors and levels. The specific changes are as follows: when the value of factor A is smaller, or the value of factor C is larger, the iron loss of the motor will be lower; when the value of factor A is larger, the average torque of the motor will be larger, but the value of factor A becomes larger, and the iron loss will also increase. The linear change in torque ripple cannot be obtained by the change in factor A, factor B, or factor C, that is, there is no linear relationship between motor torque ripple and factor A, factor B, and factor C. Therefore, it needs to be further analyzed. Similarly, under the rated condition, the A(I) B(II) C(V) can minimize the total iron loss of the motor; the A(V) B(V) C(V) can maximize the average torque of the motor; and the A(V) B(III) C(III) can minimize the torque ripple of the motor.

3.1.2. Variance Analysis

From the average value analysis results of the previous section, the combination of the horizontal values of the optimization variables that maximize the average torque of the motor, minimize the torque ripple, and minimize the iron loss can be obtained. However, it can also be seen from the results that the combinations of the factors that make the average torque maximal and make the torque ripple and iron loss minimal are different. Therefore, variance analysis is also needed to obtain the relative importance of the influence of each factor on the average torque, torque ripple, and iron loss, and then the combination of the levels of each factor is selected by taking into account the average torque, torque ripple, and iron loss. The calculation formula of variance analysis is as follows:
S A = j = 1 Q ( m A ( j ) m ) 2 Q
where SA represents the variance of a performance index under factor A; mA(j) is the average value of a performance index under the level j of factor A; m is the overall average value of a performance index; and Q is the number of levels taken by each factor.
According to the above formula, the variance analysis of the test results is carried out, and the variance of the average torque, torque ripple, and iron loss of the motor under various factors are calculated. The specific calculation results are shown in Table 11. According to the variance results, factor A has the greatest influence on the iron loss and average torque of the motor; Factor B has the greatest influence on the torque ripple of the motor; Factor C has a certain influence on the iron loss and torque ripple of the motor and has little influence on the average torque.

3.2. Determination of the Final Optimized Design Scheme

According to the results of the average value and variance analysis, different optimization variables can be combined at five levels to obtain the final optimal design scheme of the motor. It can be seen from Table 9 that factor A not only has the greatest influence on the iron loss of the motor but also has the greatest influence on the average torque of the motor. This requires comprehensive consideration. Since ensuring the average torque of the motor output is an important prerequisite for motor optimization, the average torque reduction in the motor cannot exceed 5% while reducing the iron loss of the motor. Therefore, considering the overall influence of factor A on the performance of the motor, A(V) is finally selected. The influence of factor B on the iron loss of the motor is second only to factor A, and the selection of factor A focuses on ensuring the average torque of the motor. Therefore, the selection of factor B should focus on reducing the iron loss of the motor, that is, B(II). To meet the constraint requirements of the motor torque ripple, factor C should focus on reducing the torque ripple of the motor, that is, select C(III). So far, the final optimization scheme is A(V) B(II) C(III).

4. The Performance of the Final Improved Motor

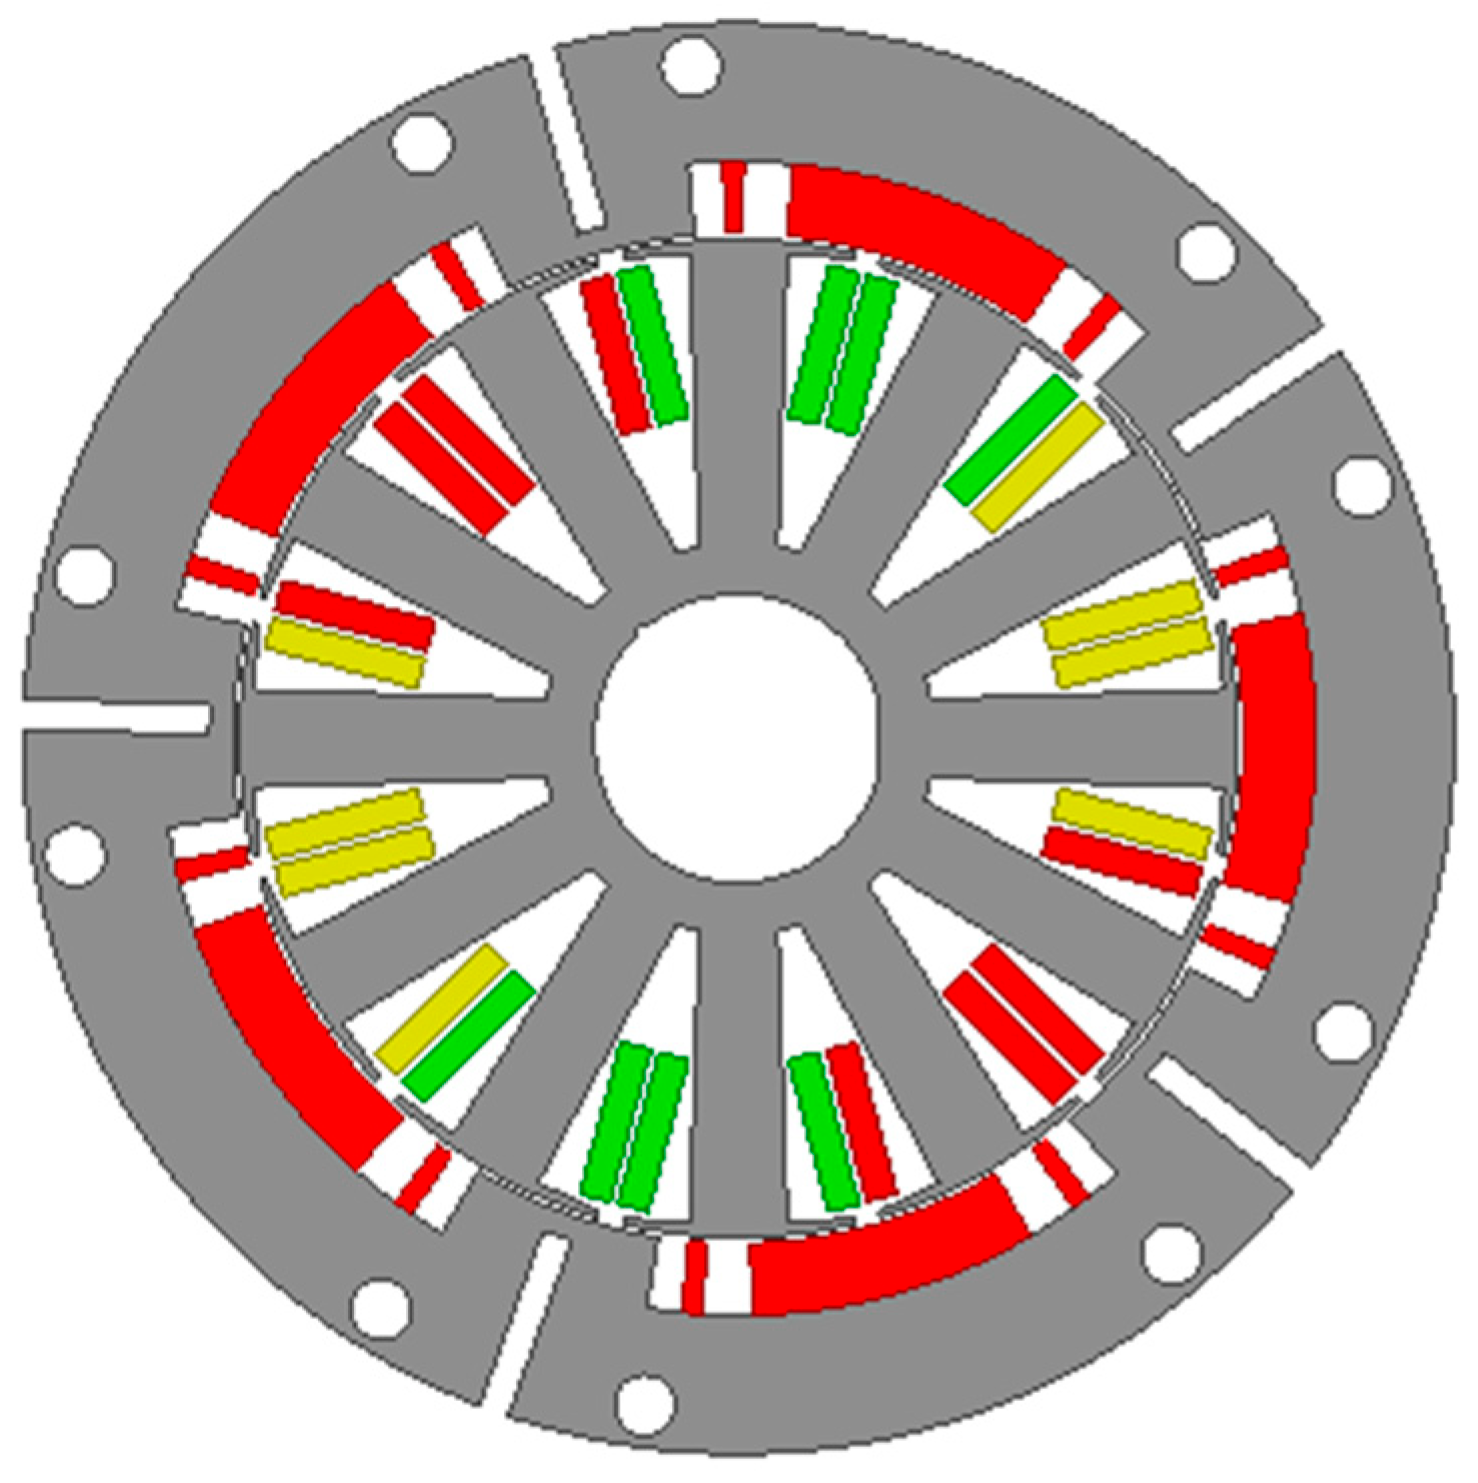
4.1. Structure of the Final Improved Motor

According to the final optimization design scheme, the final improved motor structure can be obtained. The physical model of the final improved motor is shown in Figure 11. The specific parameters are shown in Table 12.

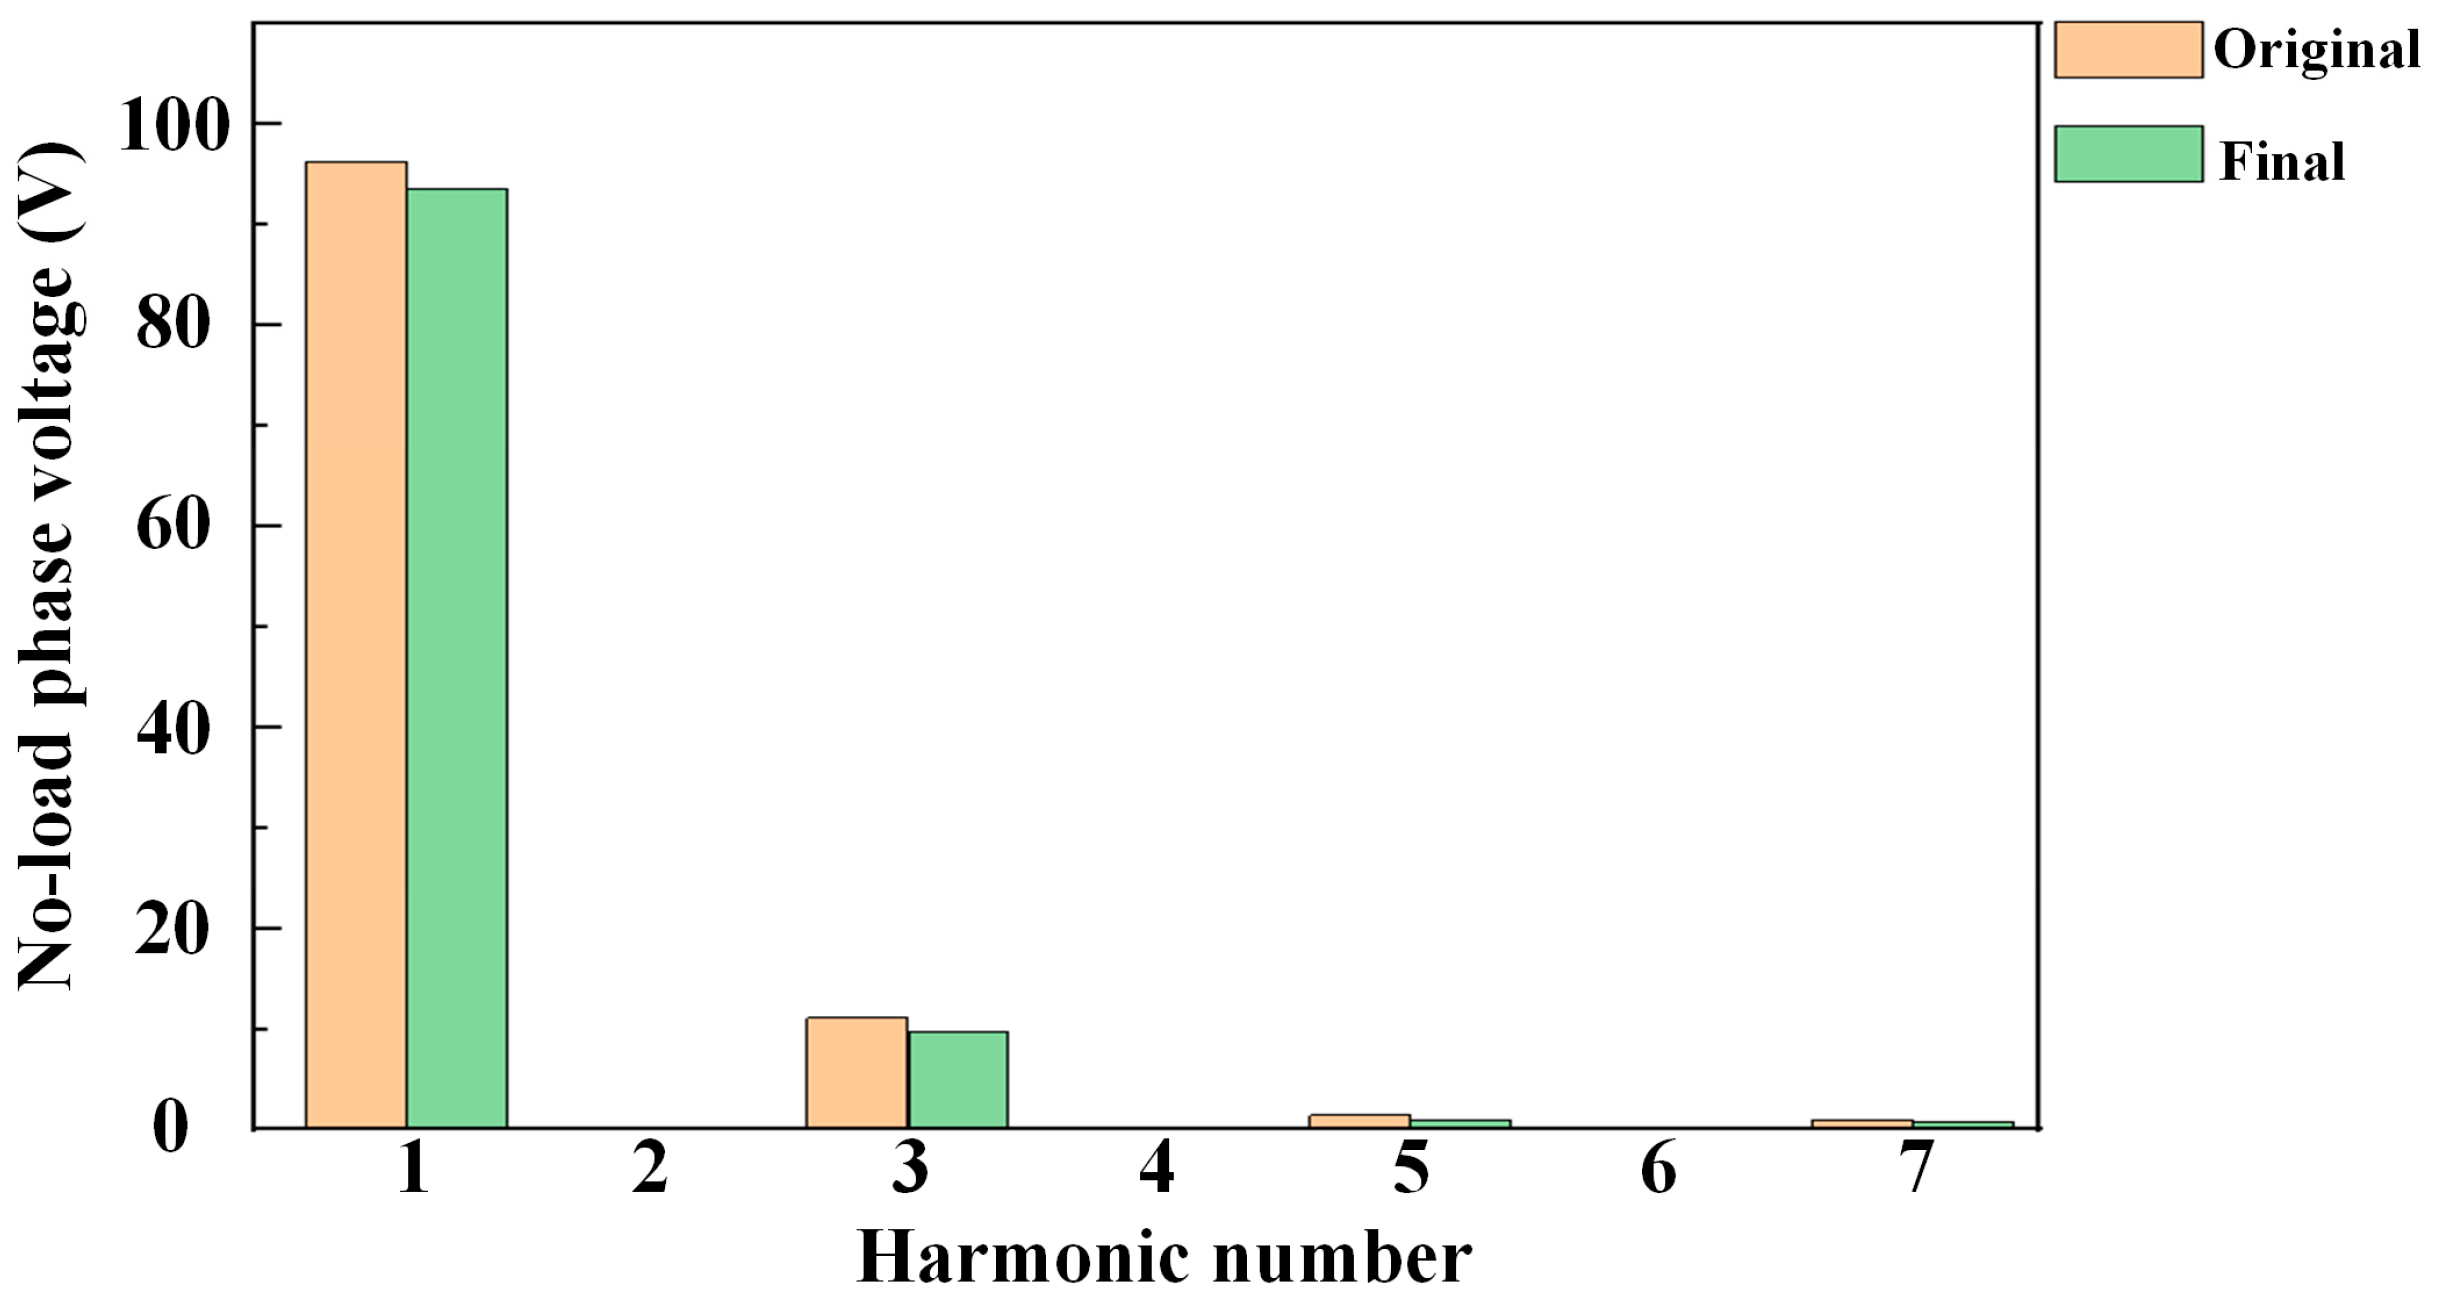
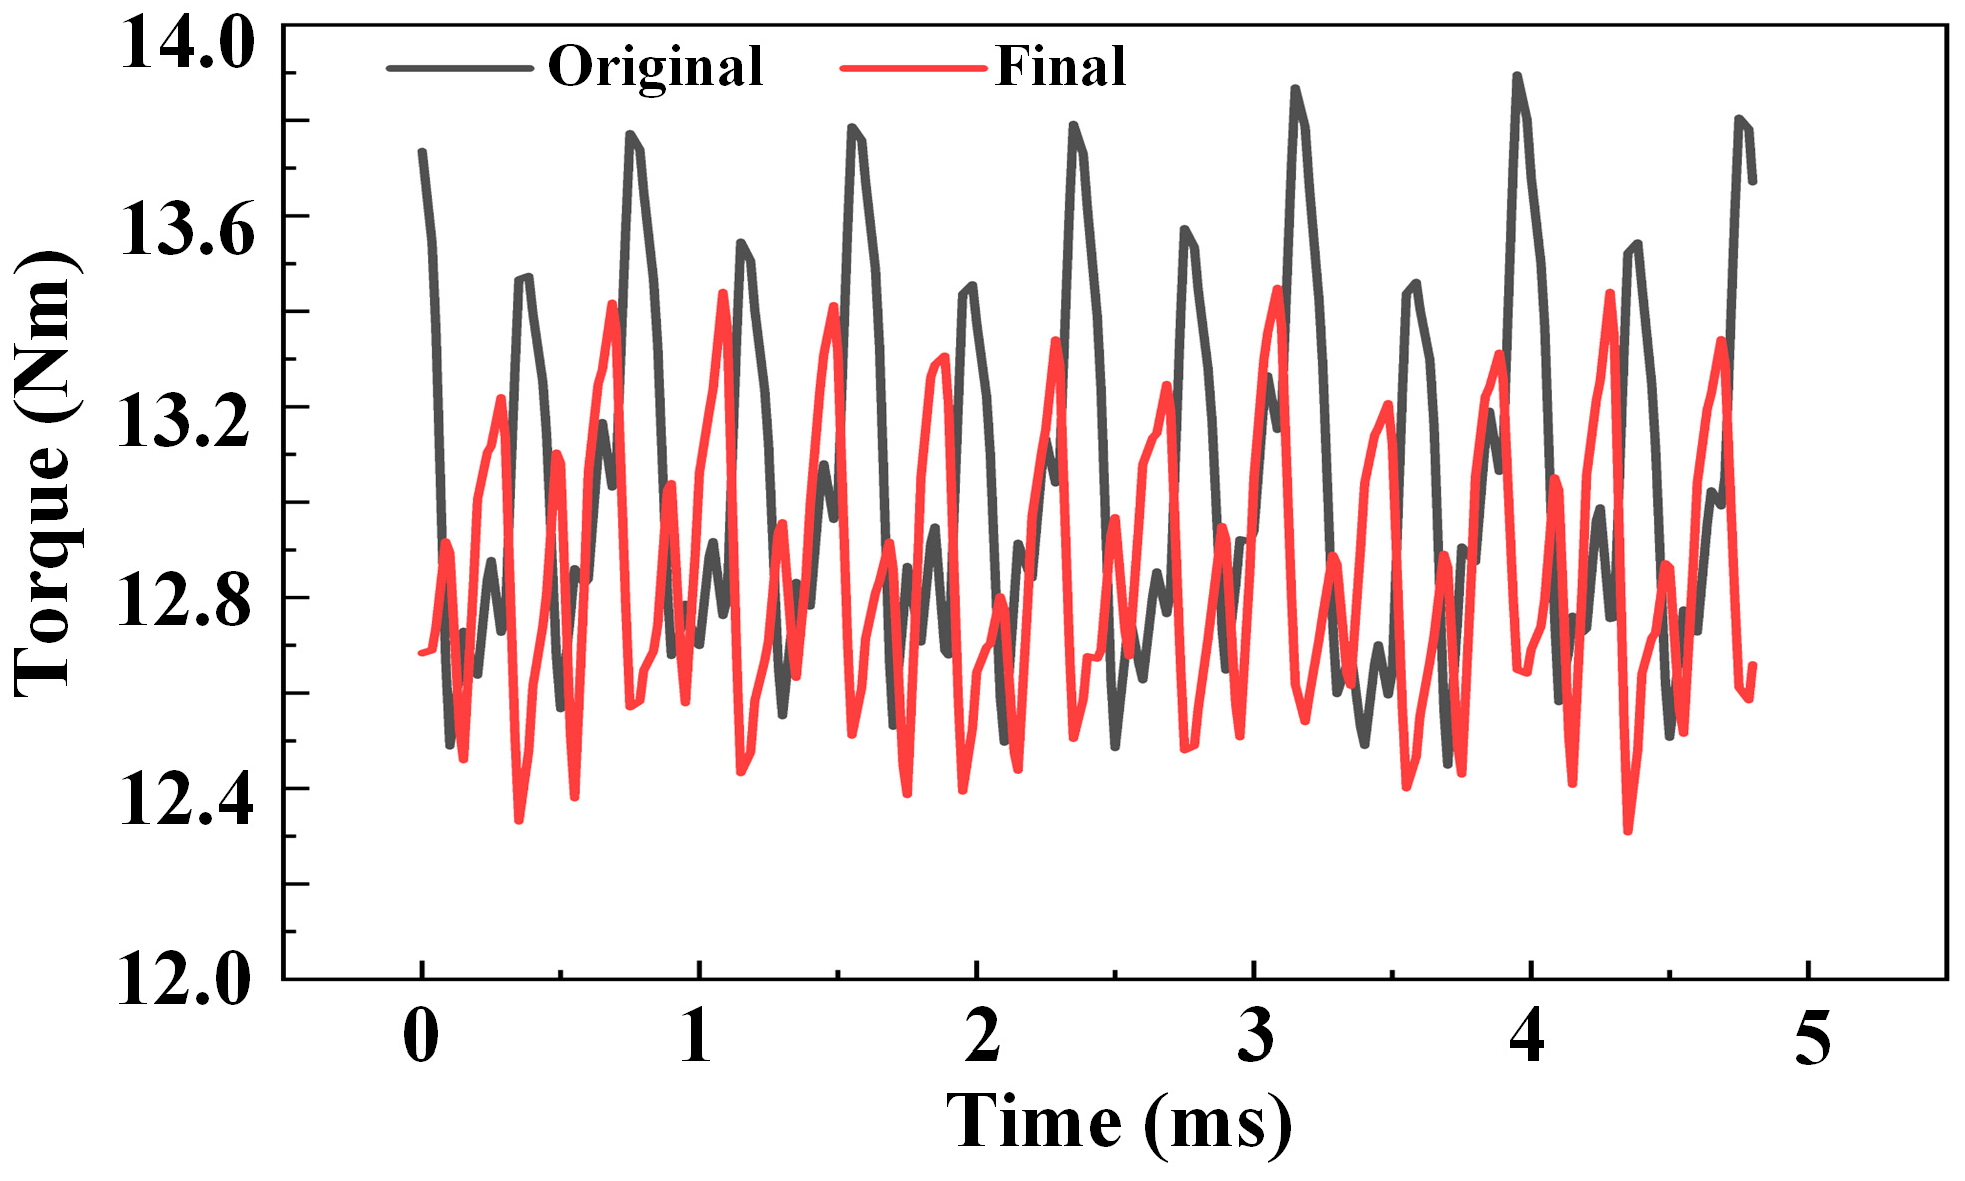
4.2. Performance of the Final Improved Motor

Through the finite element simulation and the calculation of the high-precision iron loss model, the main performance of the final improved motor can be obtained. The simulation and calculation results are shown in Table 13. The FFT analysis of the no-load phase voltage of the original motor and the final improved motor is shown in Figure 12. It can be seen from Figure 12 that, compared with the original motor, the no-load phase voltage of the final improved motor is slightly reduced, and the harmonic content is also reduced.
Since this paper mainly studies the average torque, torque ripple, and iron loss of the motor, the average torque, torque ripple, and iron loss of the original motor and the final improved motor are compared separately, as shown in Table 14.
It can be seen from the calculation results of iron loss that, compared with the original motor, the iron loss of the final improved motor is reduced by 32.12%. The torque waveforms of the original motor and the final improved motor are shown in Figure 13. According to the finite element simulation results, compared with the original motor, the torque ripple of the final improved motor is reduced by 25.09%, and the average torque of the motor is only reduced by 0.77%, which meets the requirements of the constraints. Therefore, the optimized unequal piecewise CP structure can effectively improve the overall performance of the motor.

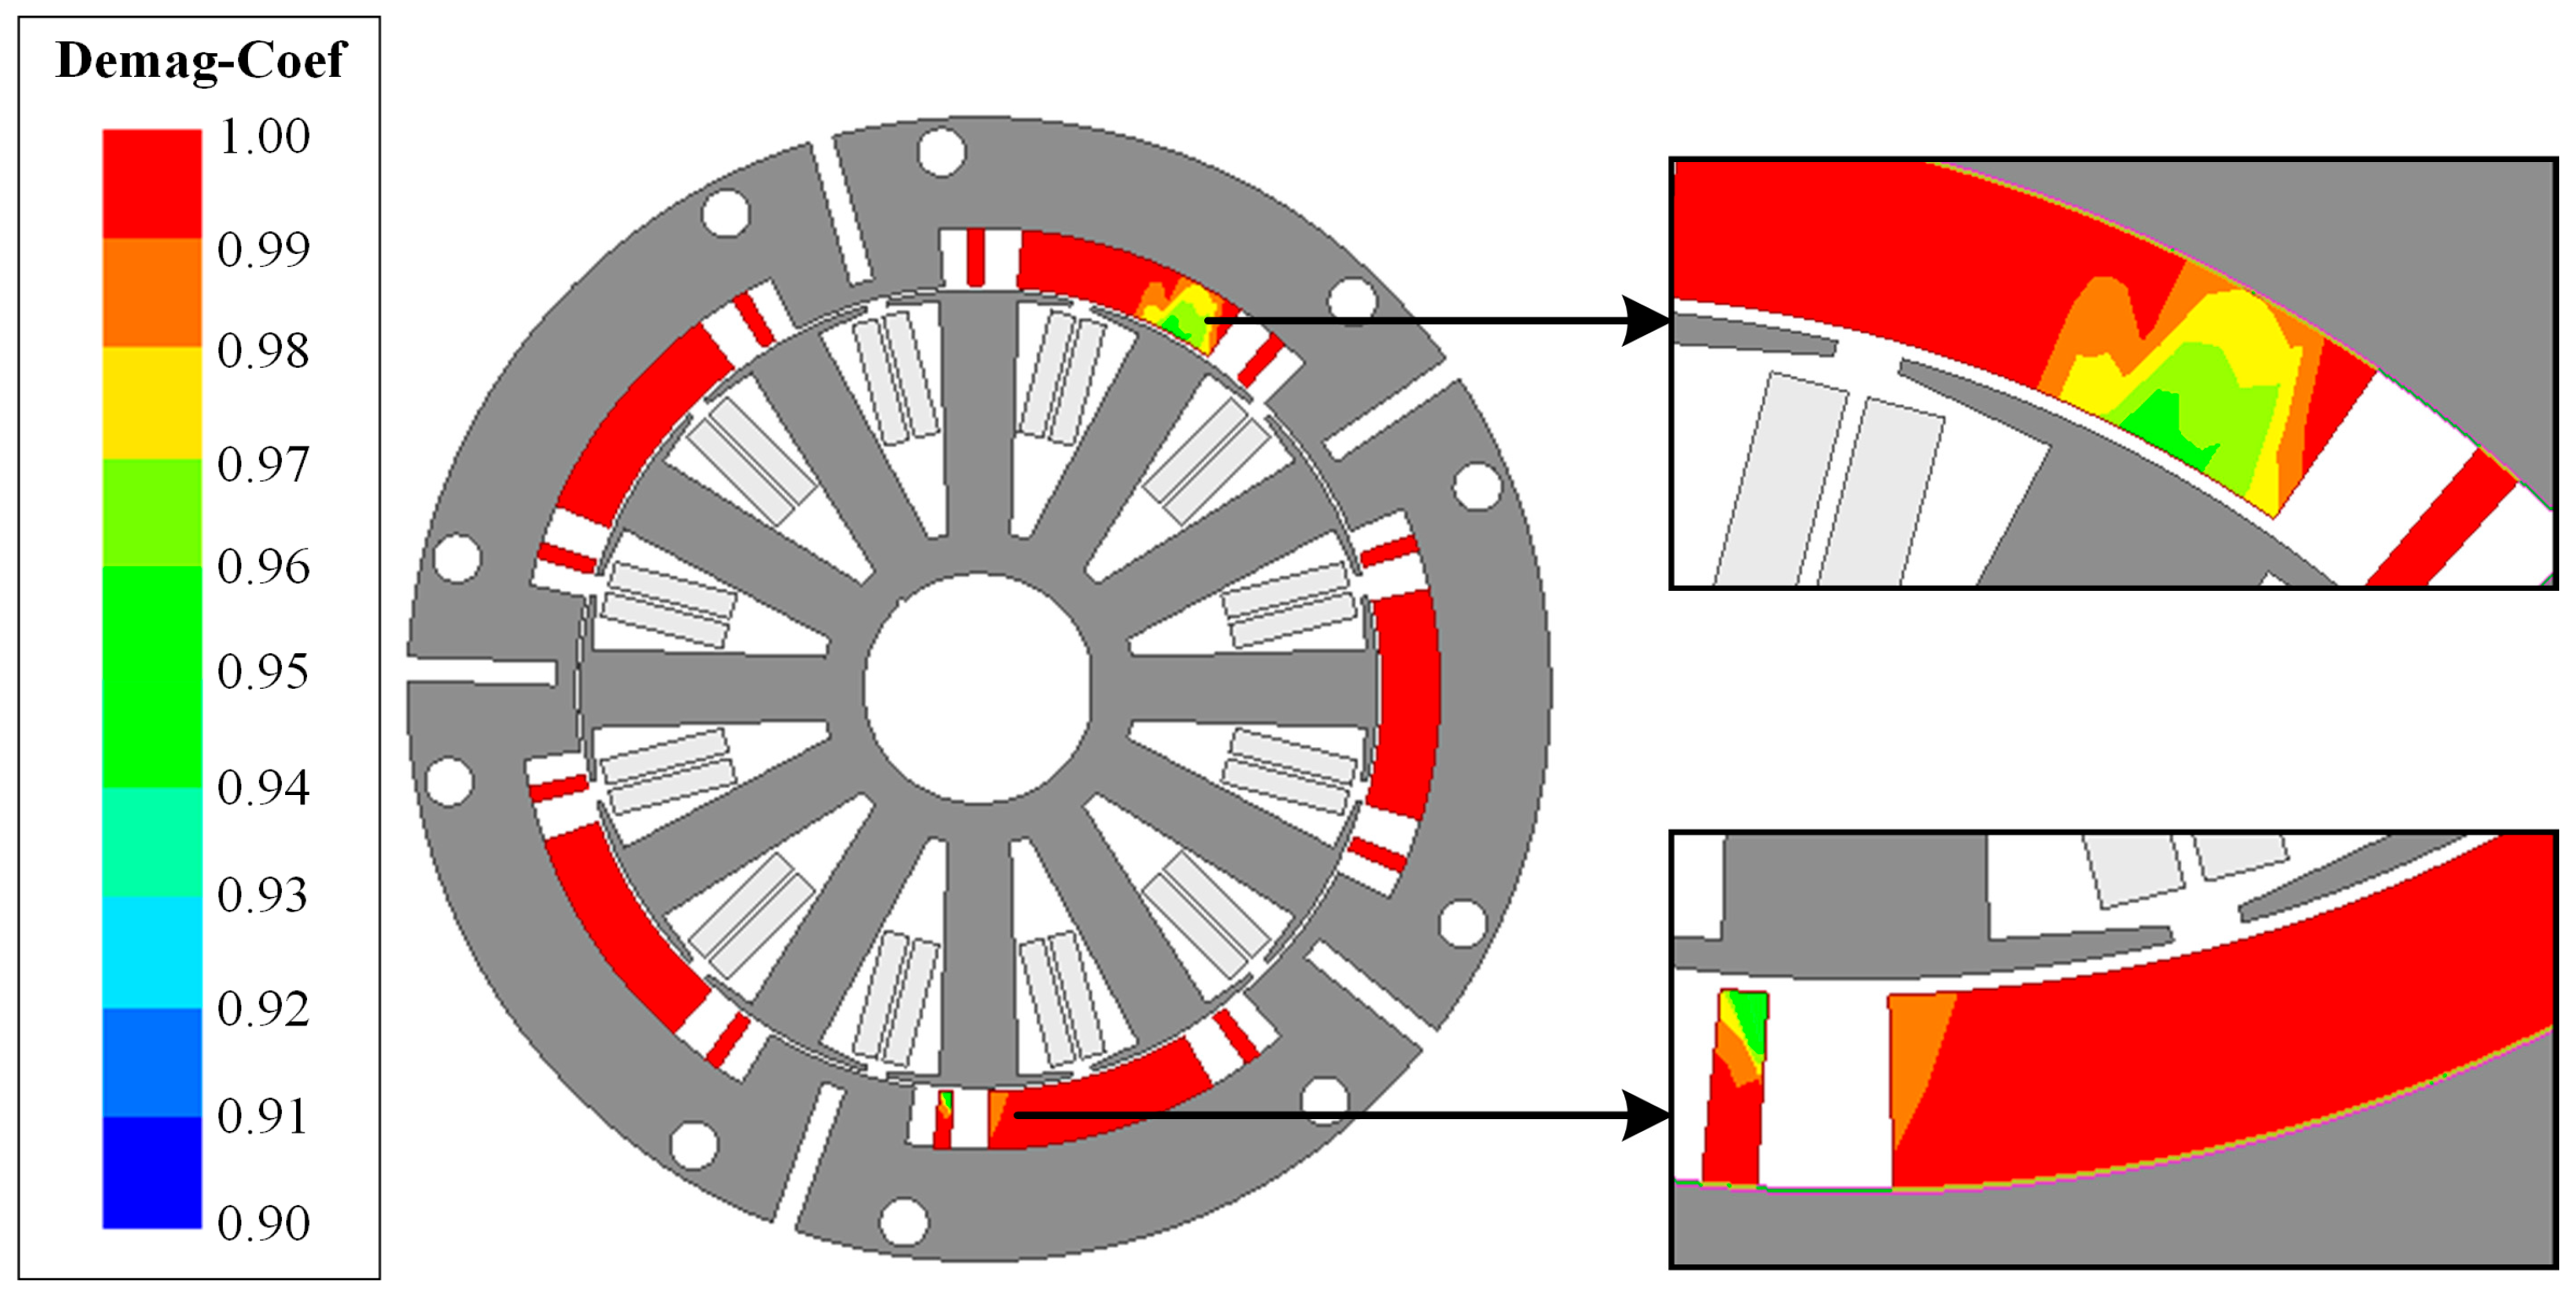
4.3. Demagnetization Analysis of the Final Improved Motor

To verify the practical feasibility of the unequal piecewise CP structure, the demagnetization analysis of the permanent magnet at 100 °C and 150 °C was carried out with Maxwell finite element software. The results of the demagnetization analysis are represented by the demag-Coef in the finite element software. When demag-Coef = 0, it means that the permanent magnet is completely demagnetized, and when demag-Coef = 1, it means that the permanent magnet has no demagnetization at all. The demagnetization analysis results of the permanent magnet at 100 °C and 150 °C are shown in Figure 14. The permanent magnet demagnetization simulation is carried out after the large current of 800 A is introduced, and the results are shown in Figure 15. It can be seen from Figure 15 that the permanent magnet begins to demagnetize locally at this time. The demagnetization analysis has verified that the proposed unequal piecewise consequent pole structure under normal operation will not demagnetize, which has practical feasibility.

5. Conclusions

In this paper, based on a 10-pole 12-slot ERCP-PMM applied to the air-conditioning compressor of electric vehicles, the optimization design is carried out. The magnetic pole structure of the motor is improved, and an unequal piecewise CP structure is proposed to reduce the iron loss and torque ripple of the motor. The magnetic pole structure of the original motor is improved to a CP structure with one long and two shorts, symmetrically distributed in the circumferential direction. The arc length of the rotor slot is reduced, and the width of the iron pole is increased. The N pole is equivalently replaced by the iron pole designed on both sides of the magnet. Under the condition that the average torque of the motor is almost unchanged, the amount of permanent magnet is reduced, and the iron loss and torque ripple of the motor are obviously reduced. In the optimization design, the average torque and torque ripple of the motor are obtained via finite element simulation. The iron loss of the motor is calculated using the high-precision piecewise variable coefficient two-term iron loss model. The results show the following:
  • Compared with the original motor, the iron loss of the motor with the final optimization scheme is reduced from 54.834 W to 37.22 W, which is a reduction of 32.12%;
  • Compared with the original motor, the average torque of the motor with the final optimization scheme is reduced from 13.05 Nm to 12.95 Nm, which is only 0.77% lower than that of the original motor. The torque ripple is reduced from 5.5% to 3.89%, which is a reduction of 25.09%.

Author Contributions

Conceptualization, L.G.; methodology, L.G. and H.Y.; software, H.Y.; validation, H.Y.; formal analysis, H.Y.; investigation, H.W.; resources, L.G.; data curation, H.W.; writing—original draft, H.Y.; writing—review and editing, L.G.; visualization, L.G.; supervision, L.G.; project administration, L.G.; funding acquisition, H.W. All authors have read and agreed to the published version of the manuscript.

Funding

This research was funded by National Natural Science Foundation of China, grant number 52277064.

Data Availability Statement

The original contributions presented in the study are included in the article, further inquiries can be directed to the corresponding author.

Conflicts of Interest

The authors declare no conflicts of interest.

References

  1. Wang, X.; Li, B.; Gerada, D.; Huang, K.; Stone, I.; Worrall, S.; Yan, Y. A critical review on thermal management technologies for motors in electric cars. Appl. Therm. Eng. 2022, 201, 117758. [Google Scholar] [CrossRef]
  2. Jiang, Y.; Ji, B.; Zhang, J.; Yan, J.; Li, W. An Overview of Diagnosis Methods of Stator Winding Inter-Turn Short Faults in Permanent-Magnet Synchronous Motors for Electric Vehicles. World Electr. Veh. J. 2024, 15, 165. [Google Scholar] [CrossRef]
  3. Wang, P.; Wang, X.; Wang, Y. End-to-End Differentiable Physics Temperature Estimation for Permanent Magnet Synchronous Motor. World Electr. Veh. J. 2024, 15, 174. [Google Scholar] [CrossRef]
  4. Ruoho, S.; Kolehmainen, J.; Ikaheimo, J.; Arkkio, A. Interdependence of demagnetization, loading, and temperature rise in a permanent-magnet synchronous motor. IEEE Trans. Magn. 2009, 46, 949–953. [Google Scholar] [CrossRef]
  5. Chung, S.U.; Kim, J.W.; Chun, Y.D.; Woo, B.C.; Hong, D.K. Fractional slot concentrated winding PMSM with consequent pole rotor for a low-speed direct drive: Reduction of rare earth permanent magnet. IEEE Trans. Energy Convers. 2015, 30, 103–109. [Google Scholar] [CrossRef]
  6. Li, J.; Wang, K. A parallel hybrid excited machine using consequent pole rotor and AC field winding. IEEE Trans. Magn. 2019, 55, 8101605. [Google Scholar] [CrossRef]
  7. Li, J.; Wang, K.; Liu, C.; Xu, B.F. Elimination of unipolar leakage flux in consequent-pole PM machines by employing novel pole sequence. IEEE Trans. Magn. 2018, 54, 8106105. [Google Scholar] [CrossRef]
  8. Huang, X.; Liang, J.; Zhou, B.; Zhang, C.; Li, L.; Gerada, D. Suppressing the thrust ripple of the consequent-pole permanent magnet linear synchronous motor by two-step design. IEEE Access 2018, 6, 32935–32944. [Google Scholar] [CrossRef]
  9. Li, J.; Wang, K.; Zhang, H. Comparative analysis of spoke-type, consequent-pole and hybrid-pole permanent magnet machines. IET Electr. Power Appl. 2020, 14, 648–657. [Google Scholar] [CrossRef]
  10. Zhao, H.; Liu, C.; Song, Z.; Liu, S. A consequent-pole PM magnetic-geared double-rotor machine with flux-weakening ability for hybrid electric vehicle application. IEEE Trans. Magn. 2019, 55, 8202507. [Google Scholar] [CrossRef]
  11. Ueda, Y.; Takahashi, H.; Ogawa, A.; Akiba, T.; Yoshida, M. Cogging-torque reduction of transverse-flux motor by skewing stator poles. IEEE Trans. Magn. 2016, 52, 8203504. [Google Scholar] [CrossRef]
  12. Chung, S.U.; Kim, J.W.; Woo, B.C.; Hong, D.K.; Lee, J.Y.; Koo, D.H. A novel design of modular three-phase permanent magnet vernier machine with consequent pole rotor. IEEE Trans. Magn. 2011, 47, 4215–4218. [Google Scholar] [CrossRef]
  13. Zivotic-Kukolj, V.; Soong, W.L.; Ertugrul, N. Iron loss reduction in an interior PM automotive alternator. IEEE Trans. Ind. Appl. 2006, 42, 1478–1486. [Google Scholar] [CrossRef]
  14. Yamazaki, K.; Ohki, S.; Nezu, A.; Ikemi, T. Development of interior permanent magnet motors reduction of harmonic iron losses by optimizing rotor structures. In Proceedings of the 2007 IEEE International Electric Machines & Drives Conference, Antalya, Turkey, 3–5 May 2007; pp. 489–494. [Google Scholar]
  15. Yamazaki, K.; Ishigami, H. Rotor-shape optimization of interior-permanent-magnet motors to reduce harmonic iron losses. IEEE Trans. Ind. Electron. 2010, 57, 61–69. [Google Scholar] [CrossRef]
  16. Zhiyong, M.; Hu, Y.; Can, C. Reduction of iron loss in a V-shaped IPM machine for traction applications. In Proceedings of the 2019 22nd International Conference on Electrical Machines and Systems (ICEMS), Harbin, China, 11–14 August 2019; pp. 1–6. [Google Scholar]
  17. Barcaro, M.; Bianchi, N.; Magnussen, F. Rotor flux-barrier geometry design to reduce stator iron losses in synchronous IPM motors under FW operations. IEEE Trans. Ind. Appl. 2010, 46, 1950–1958. [Google Scholar] [CrossRef]
  18. Frias, A.; Pellerey, P.; Lebouc, A.K.; Chillet, C.; Lanfranchi, V.; Friedrich, G.; Albert, L.; Humbert, L. Rotor and stator shape optimization of a synchronous machine to reduce iron losses and acoustic noise. In Proceedings of the 2012 IEEE Vehicle Power and Propulsion Conference, Seoul, Republic of Korea, 9–12 October 2012; pp. 98–103. [Google Scholar]
  19. Li, F.; Wang, K.; Li, J.; Zhang, H.J. Suppression of Even-Order Harmonics and Torque Ripple in Outer Rotor Consequent-Pole PM Machine by Multilayer Winding. IEEE Trans. Magn. 2018, 54, 8108605. [Google Scholar] [CrossRef]
  20. Xu, L.; Fan, W.; Zheng, S.; Wu, J.; Hua, Y.; Zhou, S. Investigation of a Partitioned-stator Hybrid-excited Flux-switching Permanent Magnet Machine with Consequent Poles. In Proceedings of the 2019 22nd International Conference on Electrical Machines and Systems (ICEMS), Harbin, China, 11–14 August 2019; pp. 1–5. [Google Scholar]
  21. Jian, L.; Kai, W.; Chuang, L. Torque Improvement and Cost Reduction of Permanent Magnet Machines with Dovetailed Consequent-Pole Rotor. IEEE Trans. Energy Convers. 2018, 33, 1628–1640. [Google Scholar]
  22. Chung, S.U.; Moon, S.H.; Kim, D.J.; Kim, J.M. Development of a 20Pole-24Slot SPMSM with Consequent Pole Rotor for In-Wheel Direct Drive. IEEE Trans. Ind. Electron. 2015, 63, 302–309. [Google Scholar] [CrossRef]
  23. Wu, Z.Z.; Zhu, Z.Q. Partitioned Stator Flux Reversal Machine with Consequent-Pole PM Stator. IEEE Trans. Energy Convers. 2015, 30, 1472–1482. [Google Scholar] [CrossRef]
  24. Guo, L.; Xiao, S.; Wu, S.; Wang, H. Optimal design of hybrid consequent-pole permanent magnet motor to reduce torque ripple. Int. J. Appl. Electromagn. Mech. 2022, 70, 149–174. [Google Scholar] [CrossRef]
  25. Rens, J.; Vandenbossche, L.; Dorez, O. Iron Loss Modelling of Electrical Traction Motors for Improved Prediction of Higher Harmonic Losses. World Electr. Veh. J. 2020, 11, 24. [Google Scholar] [CrossRef]
Figure 1. Physical model of the original motor.
Wevj 15 00232 g001
Figure 2. Physical model of the motor with unequal piecewise CP structure.
Wevj 15 00232 g002
Figure 3. The iron loss model calculation results and the test results at low frequency.
Wevj 15 00232 g003
Figure 4. The iron loss model calculation results and the test results at high frequency.
Wevj 15 00232 g004
Figure 5. The relative error between the iron loss model calculation results and the test results at low frequency.
Wevj 15 00232 g005
Figure 6. The relative error between the iron loss model calculation results and the test results at high frequency.
Wevj 15 00232 g006
Figure 7. The magnetic density distribution diagram of the original motor.
Wevj 15 00232 g007
Figure 8. The magnetic density distribution diagram of the preliminary improved motor.
Wevj 15 00232 g008
Figure 9. The flux density of the original motor and the preliminary improved motor at different positions.
Wevj 15 00232 g009
Figure 10. The unequal piecewise CP structure optimization variable diagram.
Wevj 15 00232 g010
Figure 11. Physical model of the final improved motor.
Wevj 15 00232 g011
Figure 12. FFT analysis of the no-load phase voltage of the original motor and the final improved motor.
Wevj 15 00232 g012
Figure 13. The torque diagram of the original motor and the final improved motor.
Wevj 15 00232 g013
Figure 14. The demagnetization analysis at different temperatures. (a) The demagnetization analysis of the motor at 100 °C. (b) The demagnetization analysis of the motor at 150 °C.
Wevj 15 00232 g014
Figure 15. The demagnetization analysis after 800A large current is introduced.
Wevj 15 00232 g015
Table 1. Main parameters of the original motor.
ParametersValueUnit
Rotor inner diameter84mm
Rotor cooling diameter119mm
Stator inner diameter24mm
Stator cooling diameter83mm
Magnet thickness5.95mm
N-pole total arc length9.92°
S-pole total arc length37.2°
Rotor slot arc length57.12°
Iron pole total arc length9.25°
Rated speed2500r/min
Rated current16.33A
Table 2. Main performance of the original motor.
PerformanceValueUnit
Rated power3.5kW
Current density5.35A/mm2
Torque ripple5.5%
Average torque13.05Nm
Iron loss54.834W
Copper loss160W
Eddy current loss9.26W
Efficiency93.79%
No-load phase voltage106V
No-load phase voltage THD12.45%
Table 3. Main parameters of the preliminary improved motor.
ParametersValueUnit
Rotor inner diameter84mm
Rotor cooling diameter119mm
Stator inner diameter24mm
Stator cooling diameter83mm
Magnet thickness5.95mm
Long S-pole arc length29.12°
Short S-pole arc length3.0°
Magnet interval4.0°
Rotor slot arc length50.12°
Iron pole arc length18.5°
Table 4. The fundamental amplitude and harmonic amplitude of the motor.
Harmonic
Number
Harmonic Amplitude
(Original Motor)
Harmonic Amplitude
(Preliminary Improved Motor)
11.010.96
20.230.14
30.240.16
40.200.09
50.030.08
60.070.05
THD49.62%45.32%
Table 5. The finite element simulation and calculation results of the original motor and the preliminary improved motor.
ParametersOriginal MotorPreliminary Improved Motor
Average torque13.05 Nm13.03 Nm
Torque ripple5.50%7.53%
Iron loss54.834 W39.75 W
Table 6. Factor level table.
Factor
Level
ABC
I21.12°
II23.12°
III25.12°10°
IV27.12°12°
V29.12°14°
Table 7. L25 (53) orthogonal list.
Test
Times
ABC
1III
2IIIIII
3IIIIV
4IIVII
5IVIV
6IIIV
7IIIIII
8IIIIIIV
9IIIVI
10IIVIII
11IIIIIV
12IIIIII
13IIIIIIIII
14IIIIVV
15IIIVII
16IVIIII
17IVIIV
18IVIIIII
19IVIVIV
20IVVI
21VIII
22VIIIV
23VIIII
24VIVIII
25VVV
Table 8. Orthogonal table results of each test.
Test
Times
Iron Loss
(W)
Average Torque
(Nm)
Torque Ripple
(%)
131.7411.8811.78%
232.1211.4611.12%
332.6811.475.45%
432.6911.724.15%
534.3812.449.4%
633.0811.856.98%
734.3812.039.19%
834.8611.735.85%
936.7711.877.9%
1036.8112.695.08%
1137.1412.638.42%
1236.8412.048.31%
1338.7912.752.67%
1436.2913.287.33%
1539.3312.906.45%
1637.3112.883.95%
1736.7112.918.97%
1839.5612.724.76%
1937.4414.0810.17%
2041.8113.949.82%
2139.7513.037.53%
2238.8213.043.06%
2342.2412.694.26%
2440.2714.246.22%
2537.59814.526.51%
Table 9. The overall average value of the test results.
Iron Loss
(W)
Average Torque
(Nm)
Torque Ripple
(%)
Overall
average value
36.7812.677.01
Table 10. The average value calculation results at each level.
FactorLevelIron Loss
(W)
Average Torque
(Nm)
Torque Ripple
(%)
AI32.72211.7948.38
II35.18012.0347.00
III37.67812.7206.64
IV38.56613.3067.53
V39.73613.5045.52
BI35.80412.4547.73
II35.77412.2968.13
III37.62612.2724.60
IV36.69213.0387.15
V37.98613.2987.45
CI37.88012.4848.41
II37.14212.4806.42
III37.06012.8045.81
IV36.52812.7847.38
V35.27212.8067.05
Table 11. The variance calculation results at each factor.
FactorIron LossAverage TorqueTorque Ripple
A6.3520.45490.9
B0.82840.17491.5588
C0.75160.0240.7772
Table 12. Main parameters of the final improved motor.
ParametersValueUnit
Rotor inner diameter84mm
Rotor cooling diameter119mm
Stator inner diameter24mm
Stator cooling diameter83mm
Magnet thickness5.95mm
Long S-pole arc length29.12°
Short S-pole arc length4.0°
Magnet interval5.0°
Rotor slot arc length50.12°
Iron pole arc length18.5°
Table 13. Main performance of the final motor.
PerformanceValueUnit
Average torque12.95Nm
Torque ripple3.89%
Iron loss37.22W
Copper loss160W
Eddy current loss8.64W
Efficiency94.29%
No-load phase voltage104V
No-load phase voltage THD11.36%
Table 14. Performance comparison of motor before and after optimization.
Iron Loss
(W)
Average Torque
(Nm)
Torque Ripple
(%)
Original motor54.83413.055.50
Final improved motor37.2212.953.89
Disclaimer/Publisher’s Note: The statements, opinions and data contained in all publications are solely those of the individual author(s) and contributor(s) and not of MDPI and/or the editor(s). MDPI and/or the editor(s) disclaim responsibility for any injury to people or property resulting from any ideas, methods, instructions or products referred to in the content.

