Abstract
As augmented reality (AR) technology is increasingly permeating the automotive industry, this study investigates users’ attitudes towards AR automotive assistants and their impact on usage behavior. Using the theory of reasoned action (TRA) and integrating insights from the Kano model, critical factors driving user acceptance and engagement were identified. The research reveals that trust in AR technology, perceived utility, and ease of interaction are prioritized by users. Clustering analysis identified three distinct user groups: a ‘Safety-Conscious Group’, a ‘Technology Enthusiast Group’, and an ‘Experience-Seeking Group’, each displaying unique preferences towards AR features. Additionally, a support vector machine (SVM) model effectively predicted user behavior with a training set accuracy of 89.96%. These findings provide valuable insights for the design and marketing of AR automotive assistants, acknowledging both essential features and delighters identified through the Kano model. By understanding user preferences and expectations, tailored AR solutions can be developed to enhance user satisfaction and adoption rates in the automotive sector. Moreover, this research contributes to the sustainable development goals related to the automotive industry by fostering innovation in vehicle technology, promoting eco-friendly driving practices, and enhancing overall mobility efficiency.
1. Introduction
In recent years, the rapid advancement of augmented reality (AR) technology, especially in the automotive industry, has attracted significant attention due to its potential to enhance the driving experience and improve safety features [1]. AR automotive assistants, which overlay digital information onto the real-world driving environment, represent a groundbreaking integration of digital and physical realms, offering drivers real-time information and assistance [2]. This technological evolution aligns with the broader aim of enhancing user interaction with technology, thereby influencing user behavior towards smarter, safer, and more interactive driving experiences. The application of AR technology in automotive assistants has the potential to redefine traditional driving paradigms, shifting the focus towards more engaged and informed driving practices [3]. The integration of AR in vehicles can provide drivers with crucial information about their surroundings, navigation aids, and even safety alerts without diverting their attention from the road [4,5,6]. Augmented reality (AR) technology in the automotive industry has significantly advanced since its initial exploration in the 1990s. At CES 2024, BMW demonstrated AR glasses that enhance driving by integrating navigation, hazard warnings, and entertainment into the driver’s view, seamlessly blending digital information with the real world. Similarly, Audi and Nio have utilized AR to enrich passenger experiences and align virtual content with vehicle dynamics, improving engagement and reducing motion sickness [7]. These developments underline AR’s potential to transform automotive experiences, emphasizing safety, efficiency, and entertainment. By 2025, the market for AR-assisted driving technology in China is expected to see substantial growth, with an anticipated overall penetration rate of 48%. It is predicted that the total market value of the industry is expected to break through the CNY 26 billion mark, and its annual growth rate is even more astonishing, which is expected to exceed 65%. This prosperity is mainly due to the steady increase in the sales of the automobile industry; experts predict that by 2025, China’s passenger car sales are expected to break through the 25.26 million mark. In the application level of autonomous driver assistance systems (AR) alone, the penetration rate is forecast to climb to a significant 19%, which highlights the depth of the automotive industry’s adoption of advanced technologies and the gradual maturity of the market [8]. The close integration of digital information with the physical environment creates unprecedented opportunities to create highly immersive and accessible user experiences. Given the innovative nature and high complexity of augmented reality automotive assistance systems, a deep understanding of how users interact with their real-world applications is critical to their widespread adoption and effective implementation. The theory of reasoned action (TRA) provides a strong theoretical basis for the in-depth exploration of users’ cognitive attitudes toward augmented reality (AR) automotive assistance systems and how their subjective norms potentially shape behavioral intentions and actual adoption behaviors [9,10,11,12]. From this theoretical perspective, we can delve into the core elements that drive user adoption and active participation in augmented reality vehicle technology.
Further, the integration of augmented reality (AR) technology into automotive assistance systems is of strategic value to drive green and sustainable development in the automotive industry. Augmented reality technology plays an important role in modern transportation by not only significantly improving driving safety but also providing drivers with instant critical information by reducing visual and cognitive distractions. This technology has a positive impact on the health and well-being of individuals and plays an integral role in promoting green and sustainable development of cities and communities. Further, the application of augmented reality technology is not limited to improving the driving experience; it also optimizes driving strategies, improves vehicle energy efficiency, reduces environmental burden, actively participates in action against climate change, and promotes innovation in the industry as well as the development and upgrading of infrastructure. Therefore, in-depth research into user acceptance and usage patterns of augmented reality (AR) automotive assistance systems is not only decisive for technological innovation but also important for shaping a green and sustainable future for the automotive industry.
However, despite the burgeoning interest in AR technology, research focusing on user behavior towards AR automotive assistants, especially through the lens of TRA, remains sparse [12]. This gap in the literature underscores the necessity to explore this domain further, emphasizing the need to understand how attitudes, subjective norms, and perceived behavioral control influence users’ adoption and usage of AR automotive assistants [13]. Such insights are essential for designing and marketing AR automotive technology that aligns with users’ expectations and preferences.
2. Literature Review
The integration of augmented reality (AR) into automotive assistants has been increasingly recognized for its potential to transform the driving experience by enhancing safety, navigation, and vehicle control features. Several studies have explored the benefits and challenges of AR in automotive applications. Charissis et al., 2021; Pusda et al., 2019; and Chouchene et al., 2022, found that AR technology enables the overlay of digital information onto drivers’ real-world view, providing them with timely, context-sensitive information without diverting their attention from driving [6,14,15]. Capallera et al., 2022, and Gabbard et al., 2014, emphasized that the adoption of AR automotive assistants aims not only to improve user interaction with vehicular systems but also to promote safer driving behaviors by reducing distractions [4,5]. Charissis et al., 2021, pointed out that there are concerns about the potential cognitive overload that AR systems might impose on drivers. While AR aims to enhance situational awareness, there is a risk that too much information could overwhelm drivers, leading to distraction rather than improved safety. This balance between providing helpful information and avoiding cognitive overload is a critical challenge that needs careful consideration in the design of AR automotive assistants [6].
Despite the significant potential of AR technology, it is essential to acknowledge the limitations and challenges faced in its application within the automotive industry. Stavros et al., 2019, and Wang et al., 2020, emphasized that technical challenges related to the accuracy and reliability of AR systems are significant, particularly in dynamically changing driving environments where real-time data processing is crucial. Existing studies often overlook the technological constraints and the potential for system failures, which can undermine user trust and safety [16,17]. Firu et al., 2021, and Detjen et al., 2021, highlighted that user acceptance and trust of AR technology are crucial for its success. Although some users may be enthusiastic about the integration of AR in their vehicles, others may be skeptical about its benefits and reliability. Factors such as ease of use, perceived utility, and trust in the technology play significant roles in user acceptance. Current research often assumes a homogeneous user base, neglecting the diverse attitudes and levels of technological comfort among potential users [7,18]. Wang et al., 2021, and De Pinaga and Van Eweyk, 2023, noted that environmental factors also play a role in the adoption of AR technology in vehicles. For instance, the energy consumption of AR systems can be significant, which might affect the overall efficiency of the vehicle. Furthermore, environmental conditions such as lighting and weather can impact the performance of AR displays, necessitating robust design solutions to maintain visibility and usability in various conditions [19,20].
Based on the aforementioned analysis, this study aims to investigate several hypotheses concerning user attitudes towards AR automotive assistants. In terms of the functional features of AR automotive assistants, Panagiotopoulos and Dimitrakopoulos, 2018, and Capallera et al., 2022, emphasized that the utility of AR automotive assistants is often gauged by their functional features, such as real-time navigation, safety alerts, and vehicle diagnostics [3,4]. These features are crucial for enhancing the driving experience and fostering user trust in AR technology [10,17]. Ensuring that AR automotive assistants possess these capabilities is essential for their acceptance and widespread use. The derived hypotheses are therefore as follows: PF1. How would you feel if the AR automotive assistant provided real-time navigation assistance? PF2. How would you feel if the AR automotive assistant could alert you to potential hazards?
In terms of the integration and connectivity of AR automotive assistants, Fishbein and Ajzen, 2011, and Li et al., 2022, highlighted that seamless integration with vehicle systems, minimal manual input requirements, and enhanced connectivity with external devices are essential factors that influence user acceptance and satisfaction [9,21]. These elements contribute to a more efficient, user-friendly, and interconnected driving experience. The derived hypotheses from this perspective are as follows: EI1. How would you feel if the AR automotive assistant was seamlessly integrated with your vehicle’s systems? EI2. How would you feel if the AR automotive assistant required minimal manual input? EI3. How would you feel if the AR automotive assistant enhanced the connectivity with external devices and services?
Regarding social influences on user behavior, Fishbein and Ajzen, 2011, and Li et al., 2022, highlighted that according to the theory of reasoned action, social norms and perceived social pressure significantly influence user behavior towards adopting new technologies such as AR automotive assistants [9,21]. Recommendations from peers and the portrayal of AR technology in the media can impact users’ attitudes and their willingness to adopt AR automotive assistants [10,13]. The related derived hypotheses are as follows: SI1. How would you feel if your social circle recommended using AR automotive assistants? SI2. How would you feel if the AR automotive assistant contributed to a more engaging driving experience?
As for personal attitudes and values, Firu et al., 2021, and Detjen et al., 2021, stressed that personal attitudes towards technology and values regarding safety and innovation play a crucial role in shaping user acceptance of AR automotive assistants [7,18]. Users who prioritize technological innovation and safety are more likely to be receptive to AR automotive assistants [22]. The derived hypotheses are as follows: PA1. How would you feel if the AR automotive assistant significantly enhanced driving safety? PA2. How would you feel if the AR automotive assistant provided emergency assistance features?
Despite the burgeoning interest in AR technology, research focusing on user behavior towards AR automotive assistants, especially through the lens of TRA, remains sparse [11,12]. This gap in the literature underscores the necessity to explore this domain further, emphasizing the need to understand how attitudes, subjective norms, and perceived behavioral control influence users’ adoption and usage of AR automotive assistants [9,13]. Such insights are essential for designing and marketing AR automotive technology that aligns with users’ expectations and preferences.
3. Research Method
A mixed-methods approach was utilized to study the factors influencing users’ attitudes, subjective norms, and behavioral intentions towards AR automotive assistants. The research design involved four stages: system design, questionnaire survey, cluster analysis, and SVM analysis.
At the critical stage of system design, this research innovatively constructed an AR vehicle-aided prototype with integrated real-time navigation, a safety early warning system, and an intuitive user interface, aiming at improving the convenience and safety of vehicle-aided services. In the questionnaire survey stage, this study was devoted to a comprehensive survey of huge user groups, with the goal of deeply understanding their expectations and personalized preferences for augmented reality car assistance systems. In the data analysis stage, the survey data were used to finely divide the respondents with common tendencies. In the process of in-depth analysis of support vector machine, firstly, the collected data were fully mined through detailed investigation and detailed cluster analysis, and an accurate model was constructed on this basis, with the goal of effectively predicting the evolution of users’ attitudes towards AR car assistants and their potential behavioral intentions.
By using qualitative and quantitative methods, this study deeply analyzes how augmented reality automobile technology affects users’ attitudes, perceived social expectations, and the dynamic relationship between them and their behavioral intentions. In the initial design stage of the system, an advanced augmented reality (AR) car-aided application was carefully constructed with the core goal to significantly improve driving safety and user experience. In the questionnaire survey, large amounts of data about users’ expectations and personal preferences for technology were collected, and then in the subsequent cluster analysis stage, respondents with similar preferences and opinions were carefully classified into corresponding groups. After completing the detailed analysis of support vector machine, an accurate prediction model was set up with the goal of effectively dividing users’ emotional tendencies towards AR car assistants and their preset behavioral intentions.
This is a four-stage process which is suitable for hybrid method research, as shown in Figure 1. The goal was to find out the factors that affect users’ perception of AR vehicle auxiliary systems.
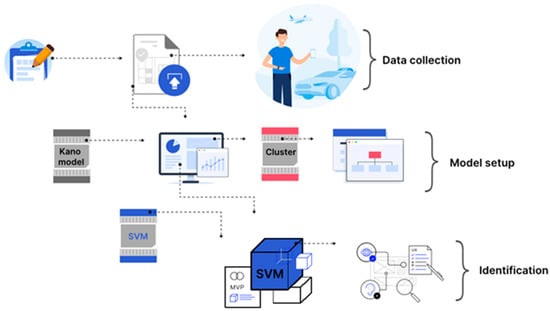
Figure 1.
The mixed-methods research design for investigating factors influencing users’ attitudes towards AR automotive assistants: a four-stage approach.
At the initial stage of system design, an AR vehicle auxiliary system was specially customized to improve driving safety and operation convenience. In the design process, an iterative method was adopted to continuously create prototypes and frequently organize user feedback meetings to optimize the product. Modern augmented reality technology innovatively integrates navigation and key safety tips into the vehicle windshield, realizing a function through which drivers can obtain important information in real time without distracting driving attention. In the design process, we adhered to the user-centered concept, carefully constructed an intuitive and barrier-free interface, and constantly optimized the interaction process and visual elements with the help of detailed usability testing to enhance the user experience.
In the preliminary research stage, a detailed questionnaire survey was carefully constructed, aiming to deeply explore users’ attitudes and preferences and obstacles that may affect their acceptance of the augmented reality (AR) car assistance system. This survey covered a wide range of topics, including detailed demographic information. The Lecktor scale was used to measure the public’s trust and perceived utility, and open questions were specially designed to obtain in-depth user feedback. In order to ensure the comprehensiveness of the research, diversified contact methods were adopted in automobile activities, including online questionnaires and offline interviews, to attract participants from different backgrounds. Statistical software, such as SPSS, played a key role, and its main function was to deeply analyze the data and reveal the laws and correlations among them, thus providing a valuable basis for optimizing and upgrading the existing system.
In the data cluster analysis stage, using a cutting-edge data mining strategy, based on the in-depth investigation and feedback of users, they were finely divided into multiple groups with commonalities. Using the K-means cluster analysis method, data on the age, driving behavior frequency, technical level tendency, and safety-related factors of individuals were deeply and carefully divided and studied. Through this strategy, users with common views and needs could be effectively divided, thus promoting more targeted design optimization. In order to deeply analyze users’ preferences, multi-dimensional visualization of the clustering results was adopted by combining a heat map and a tree map, so as to more intuitively interpret the characteristics and distribution of each group.
When analyzing the users’ behavior, the support vector machine (SVM) model was used to predict each user’s potential reaction and behavior intention to the advanced automation (AR) car assistant. A support vector machine based on a kernel function performs well in dealing with multi-dimensional nonlinear datasets, especially for scenes containing user questionnaire data and complex cluster analysis tasks. In the process of machine learning, the original data are usually divided into training sets and independent test sets, so that the model parameters can be finely adjusted by implementing a cross-validation strategy, which can not only improve the prediction accuracy of the model but also effectively prevent over-fitting and enhance its generalization ability on unknown data. The model performs in-depth evaluation by rigorously applying key performance indicators such as accuracy, precision, recall, and score so as to continuously optimize and improve the forecasting efficiency of the system.
3.1. Case Study
An AR automotive assistant was chosen as the research object for this paper due to its innovative application of AR technology in enhancing driving experiences by providing drivers with real-time information and assistance. Key features of the AR automotive assistant include real-time navigation overlays, safety alerts, and vehicle diagnostics, leveraging AR to seamlessly integrate digital information with the real-world driving environment [14]. The design points, functions, and usage of the AR automotive assistant are as follows: Firstly, in terms of design features, the AR automotive assistant is designed to enhance driving safety and efficiency. Using AR technology, it projects important information such as navigation paths and safety warnings directly into the driver’s field of view. Secondly, with regard to functions, the real-time navigation function provides drivers with augmented reality navigation cues, improving route visibility and comprehension; the safety alerts function alerts drivers to potential hazards on the road, including pedestrian crossings and sudden traffic changes; and the vehicle diagnostics function displays real-time vehicle diagnostics, including fuel levels and maintenance warnings. Lastly, in terms of usage, the AR automotive assistant is integrated into the vehicle’s dashboard or head-up display. Drivers can interact with the system through voice commands and steering wheel controls, allowing for hands-free operation. The system is designed to be intuitive, requiring minimal setup and offering a seamless satisfaction improvement.
In summary, the AR automotive assistant represents a significant advancement in vehicle technology, aiming to make driving safer, more efficient, and more enjoyable. By leveraging AR technology, it addresses the challenges of modern driving and aligns with the goals of improving road safety and enhancing the driver experience.
3.2. Data Collection
The Kano survey was adapted to investigate users’ attitudes towards AR automotive assistants, targeting a diverse demographic of drivers with varying driving experiences and technological familiarity. The survey was structured into three stages: functional (desired attributes), dysfunctional (perceived drawbacks), and neutral (basic expectations). The functionalities and potential uses of AR automotive assistants were clearly explained to respondents during the survey.
Data were collected through an online survey to reach a wider audience, using a combination of convenience and stratified sampling methods. Initial participants were recruited via social media, automotive forums, and university mailing lists through convenience sampling. To ensure representativeness, stratified sampling was employed by dividing the population based on age, gender, and driving experience and selecting participants proportionally from each stratum.
A total of 500 questionnaires were distributed, with 432 returned (86.4% response rate). Participants ranged in age from 18 to 65 years (52% male, 48% female), encompassing both younger drivers likely to adopt new technologies and older drivers who prioritize safety and reliability. The sample also varied in driving experience, from novice to seasoned drivers. Technological familiarity was measured, including both tech-savvy individuals and those less familiar with AR technology.
Kano Questionnaire
The Kano questionnaire was tailored to assess the impact of different factors associated with AR automotive assistants on the attitudes, subjective norms, and behavioral intentions of users, in alignment with the theory of reasoned action. This analysis helps businesses identify critical factors that boost user satisfaction and pinpoint areas for enhancement in the design and marketing of AR automotive assistants. The questionnaire included 4 first-level factors and 9 second-level Kano questions, as illustrated in Table 1.

Table 1.
Kano questionnaire on the factors influencing users’ attitudes towards AR automotive assistants.
3.3. Validity and Reliability of Survey Instruments
To establish content validity, the survey items were developed based on an extensive review of the literature and existing validated scales. Experts in the field of AR technology and automotive systems were consulted to ensure that the survey items accurately captured the constructs of interest. This expert review process helped refine the survey questions to ensure they were comprehensive and relevant to the study’s objectives. The reliability of the survey instruments was evaluated using Cronbach’s alpha to measure internal consistency. In this study, The Cronbach’s alpha value reached more than 0.70, indicating that the survey project always measured the same structure. The reliability analysis was conducted for each of the main constructs in the survey, such as attitudes towards AR automotive assistants, perceived ease of use, and perceived usefulness. During the survey administration, standardized instructions were provided to ensure that all participants received the same information and understood how to complete the survey. Additionally, the survey was distributed online, which allowed for consistent administration and minimized interviewer bias.
4. Results
4.1. Kano Model Analysis
The Kano model analysis aimed to assess the impact of various factors associated with AR automotive assistants on users’ attitudes, according to Table 2, as detailed below.
Table 2.
Summary of Kano model analysis results.
Product features (PF). PF1 (real-time navigation assistance): This feature fell predominantly in the Indifferent category (48.8%), indicating that users generally do not have strong feelings about it. However, a notable percentage placed it in the Must-be (M) category (15.9%), suggesting that a subset of users consider it essential. The result suggests room for improvement in enhancing user perception of this feature. PF2 (alerts for potential hazards): This feature was largely placed in the Attractive (A) category (41.3%), indicating that users perceive it positively and consider it desirable for AR automotive assistants. It is a significant finding, suggesting that integrating hazard alerts can significantly enhance user satisfaction.
Electronic integration (EI). EI1 (seamless integration with vehicle systems): This feature was predominantly marked in the Attractive (A) category (39.1%), indicating that users find seamless integration desirable and see it as a positive aspect of AR automotive assistants. It is an essential feature for enhancing user experience and satisfaction. EI2 (minimal manual input): Users overwhelmingly perceived minimal manual input as an essential feature, with a large percentage putting in the Attractive (A) category (48.5%). This underscores the importance of designing AR automotive assistants with minimal user input requirements to improve usability and user satisfaction. EI3 (enhanced connectivity with external devices): Similar to other electronic integration features, enhanced connectivity with external devices was predominantly placed in the Attractive (A) category (43.5%), indicating its importance for users.
Satisfaction improvement (SI). SI1 (customizable interfaces): Users largely perceived customizable interfaces as Attractive (45.9%), suggesting that providing users with options to personalize their experience can significantly enhance satisfaction and engagement. SI2 (contribution to more engaging driving experience): Similar to SI1, this feature was perceived positively by users, with a large percentage placing it in the Attractive (A) category (45.3%). It indicates that users value features that contribute to a more engaging driving experience.
Passive safety (PA). PA1 (significantly enhanced driving safety): Users perceived significantly enhanced driving safety as an essential feature, with a significant percentage marking it in the Attractive (A) category (38.5%). It highlights the importance of safety features in AR automotive assistants. PA2 (emergency assistance features): Similar to PA1, emergency assistance features were perceived positively by users, with a large percentage placing it in the Attractive (A) category (39.1%).
Overall, the analysis reveals that users prioritize features related to safety, ease of use, seamless integration, and customization in AR automotive assistants. Integrating these features effectively can significantly enhance user satisfaction and drive adoption rates in the automotive sector.
Based on Figure 2, the Kano Better–Worse coefficient chart for AR automotive assistants, the study identified that features such as seamless electronic integration (EI1), high user satisfaction with safety alerts (PF2), and personalization options (SI1) fall into quadrant 1, marking them as expected attributes. These attributes exhibit high values for Better and a higher absolute value for Worse, signifying their essential role in user satisfaction and the imperative need for their inclusion in AR automotive assistant designs.
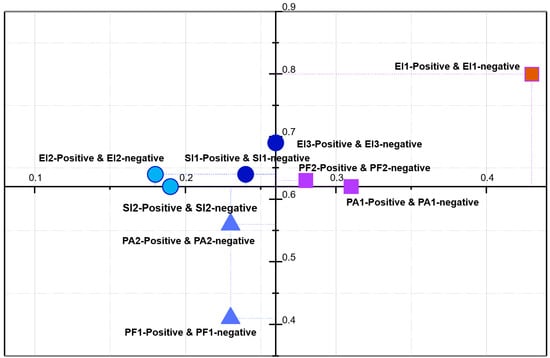
Figure 2.
Better–Worse four-quadrant matrix analysis diagram.
Quadrant 2 encompasses charm attributes such as real-time navigation assistance (PF1) and emergency assistance features (SI2), which, despite being less crucial than expected attributes, significantly enhance user satisfaction with high Better values and low Worse values in absolute terms. Therefore, these attributes, while not essential, greatly contribute to the positive satisfaction improvement and should be considered in the development process.
Quadrant 3 represents the indifference attribute, indicating features that users are neutral about. These include advanced customization options beyond the basic user interface (SI2), suggesting that while these features are nice to have, they do not significantly impact user satisfaction.
Contrastingly, quadrant 4 includes necessary attributes that, despite having lower Better values, possess higher absolute Worse values, such as reliable vehicle diagnostics (PA1). Although these attributes might not directly enhance user satisfaction, their absence could lead to user dissatisfaction and should thus be adequately addressed.
The analysis indicates that users place a high value on passive safety, electronic integration, and satisfaction improvement enhancements in AR automotive assistants. By prioritizing functions/services in quadrants 1 and 2, the design and marketing strategies for AR automotive assistants can be optimized to meet user expectations and charm preferences. This approach underscores the importance of focusing on both essential and desirable attributes to align AR automotive assistants with user preferences and improve market competitiveness.
Overall, this study provides critical insights for companies and designers in developing AR automotive assistants that cater to users’ needs for safety, convenience, and personalized driving experiences. Emphasizing the expected and charm attributes can help in better aligning these products with user preferences, thereby enhancing user acceptance and competitive edge in the market.
4.2. Correlation Analysis
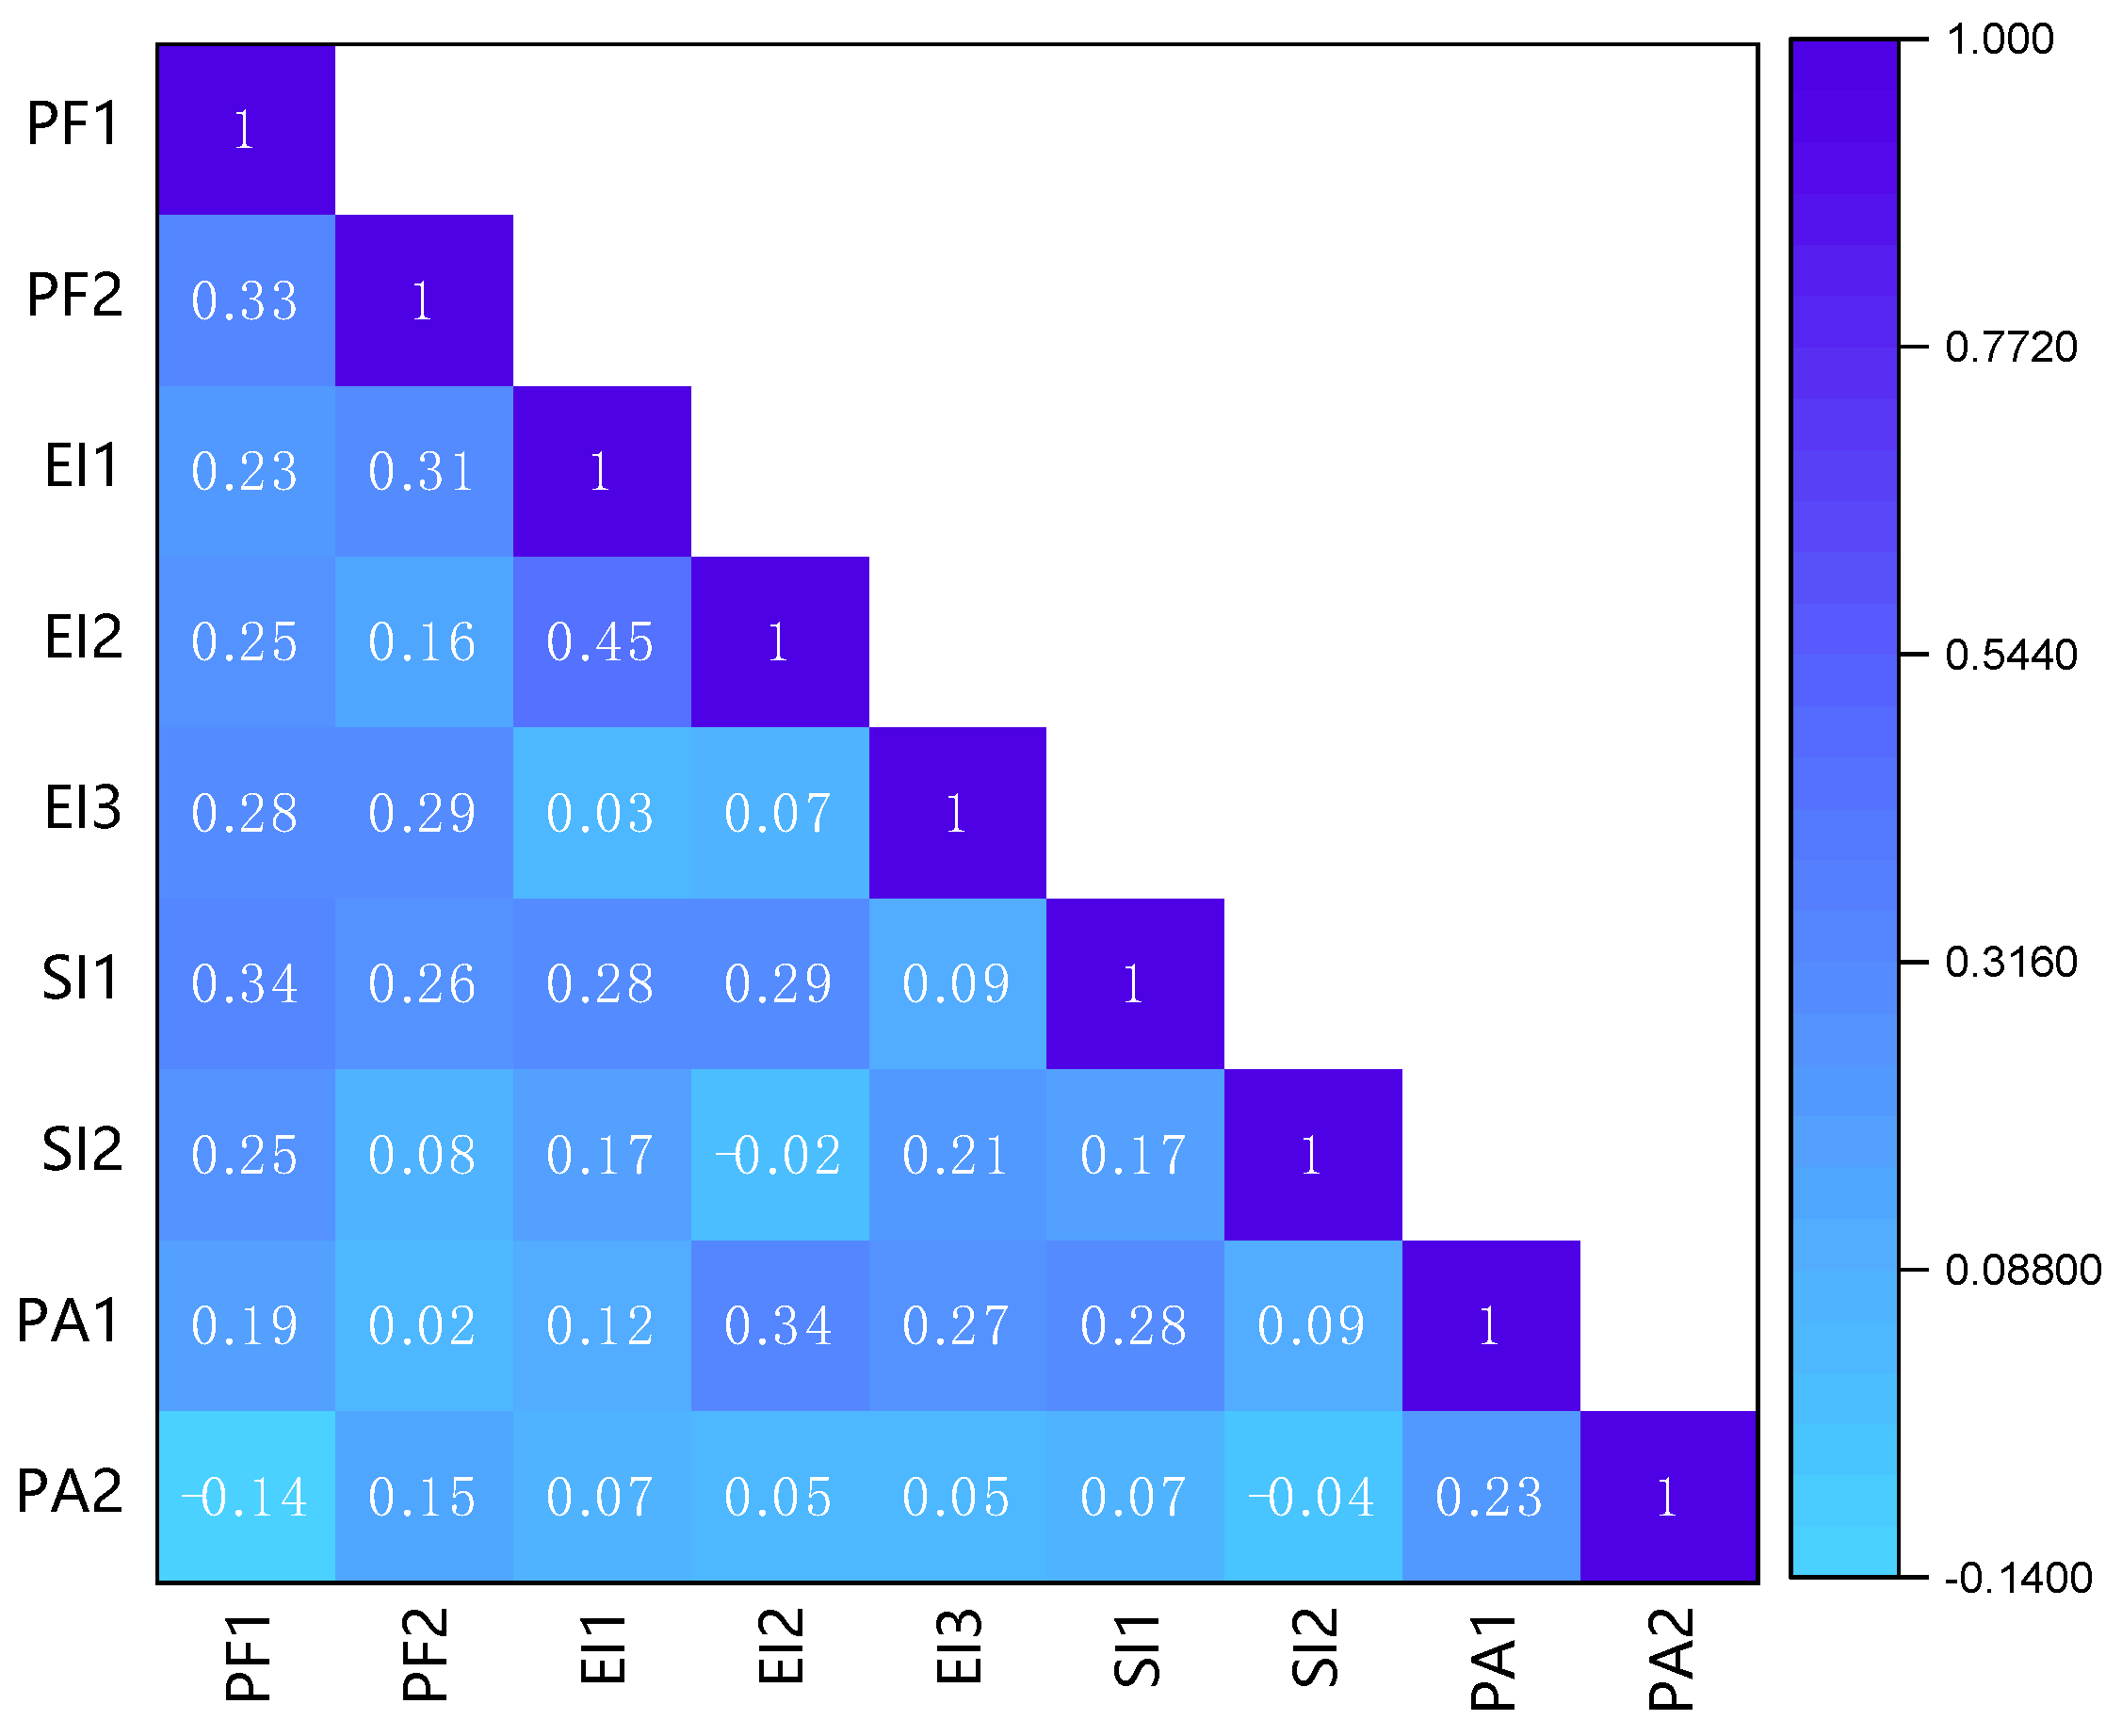
The positive correlations between different aspects of user attitudes towards AR automotive assistants suggest interconnected preferences, as shown in Figure 3. The three pairs of variables with the highest correlations were analyzed as follows: A notable correlation was found between customizable interfaces (SI1) and real-time navigation assistance (PF1), with a value of 0.34, indicating that users who value the ability to tailor their interaction with technology also appreciate the functionality of being guided in real-time while driving. These users likely favor a driving experience that can be personalized to their needs and may be more inclined to adopt AR automotive assistants that offer high customization and practical navigation aids. Similarly, a strong relationship was observed between the desire for enhanced driving safety (PA1) and the preference for minimal manual input (EI2), also with a correlation of 0.34. This suggests that users who prioritize safety also value features that minimize distractions, enabling them to maintain focus on the road. These users are probably pragmatic about AR technology, gravitating towards functionalities that have a direct safety benefit rather than those that provide entertainment. Moreover, the correlation of 0.33 between alerts for potential hazards (PF2) and real-time navigation assistance (PF1) indicates that users who are concerned about being informed of potential dangers while driving also value being provided with navigation information in real time. This shared preference points to users who seek technologies that enhance situational awareness and driving safety, which are the primary tasks that AR automotive assistants are expected to support.
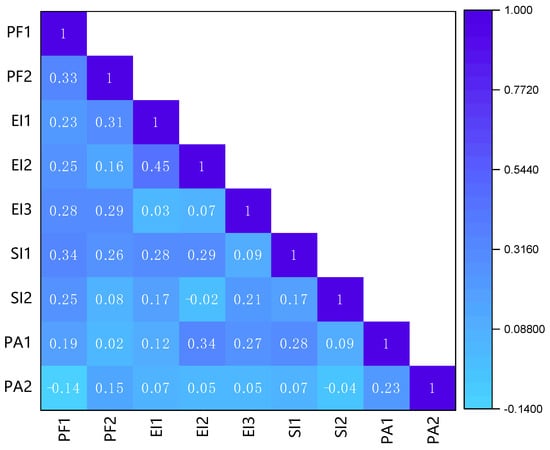
Figure 3.
Pearson correlation coefficients of factors in relation to attitudes, subjective norms, and behavioral intentions towards AR automotive assistants.
In contrast, only three pairs of negatively correlated variables appeared. There was a slight negative correlation of −0.14 between emergency assistance features (PA2) and real-time navigation assistance (PF1), indicating a user segment that places a higher value on emergency support over the convenience of navigation assistance. These users are possibly more risk-averse, seeking a safety net from their technology rather than enhancements to everyday driving tasks. Even weaker negative correlations were observed with emergency assistance features (PA2) and the contribution to a more engaging driving experience (SI2), as well as between SI2 and minimal manual input (EI2), with correlations of −0.04 and −0.02, respectively. These suggest that users focused on emergency assistance may not have a strong inclination towards features that make driving more enjoyable or engaging, implying a conservative approach to technology adoption that prioritizes essential safety functions. Additionally, the weak negative correlation between an engaging driving experience and minimal manual input may point to users who derive engagement from active interaction with their vehicle’s systems and may view too much automation as a reduction in their driving enjoyment. These users likely see driving as a hands-on, active experience and prefer features that facilitate this approach.
4.3. Cluster Analysis
Cluster analysis was conducted to discern patterns within user data regarding AR automotive assistants. This analytical technique enables the identification of user segments based on similarities in their responses, aiding in understanding user preferences and behaviors. The hierarchical clustering method was employed for this study due to its ability to handle various types of data and provide a clear visual representation of clusters through dendrograms. Hierarchical clustering is particularly effective for exploring the structure of data when the number of clusters is not predetermined. This method does not require the number of clusters to be specified in advance and allows for the examination of data at different levels of granularity, providing a comprehensive view of how clusters are formed [23]. The results of cluster analysis are shown in Table 3.
Table 3.
User groups cluster item description analysis for AR automotive assistants.
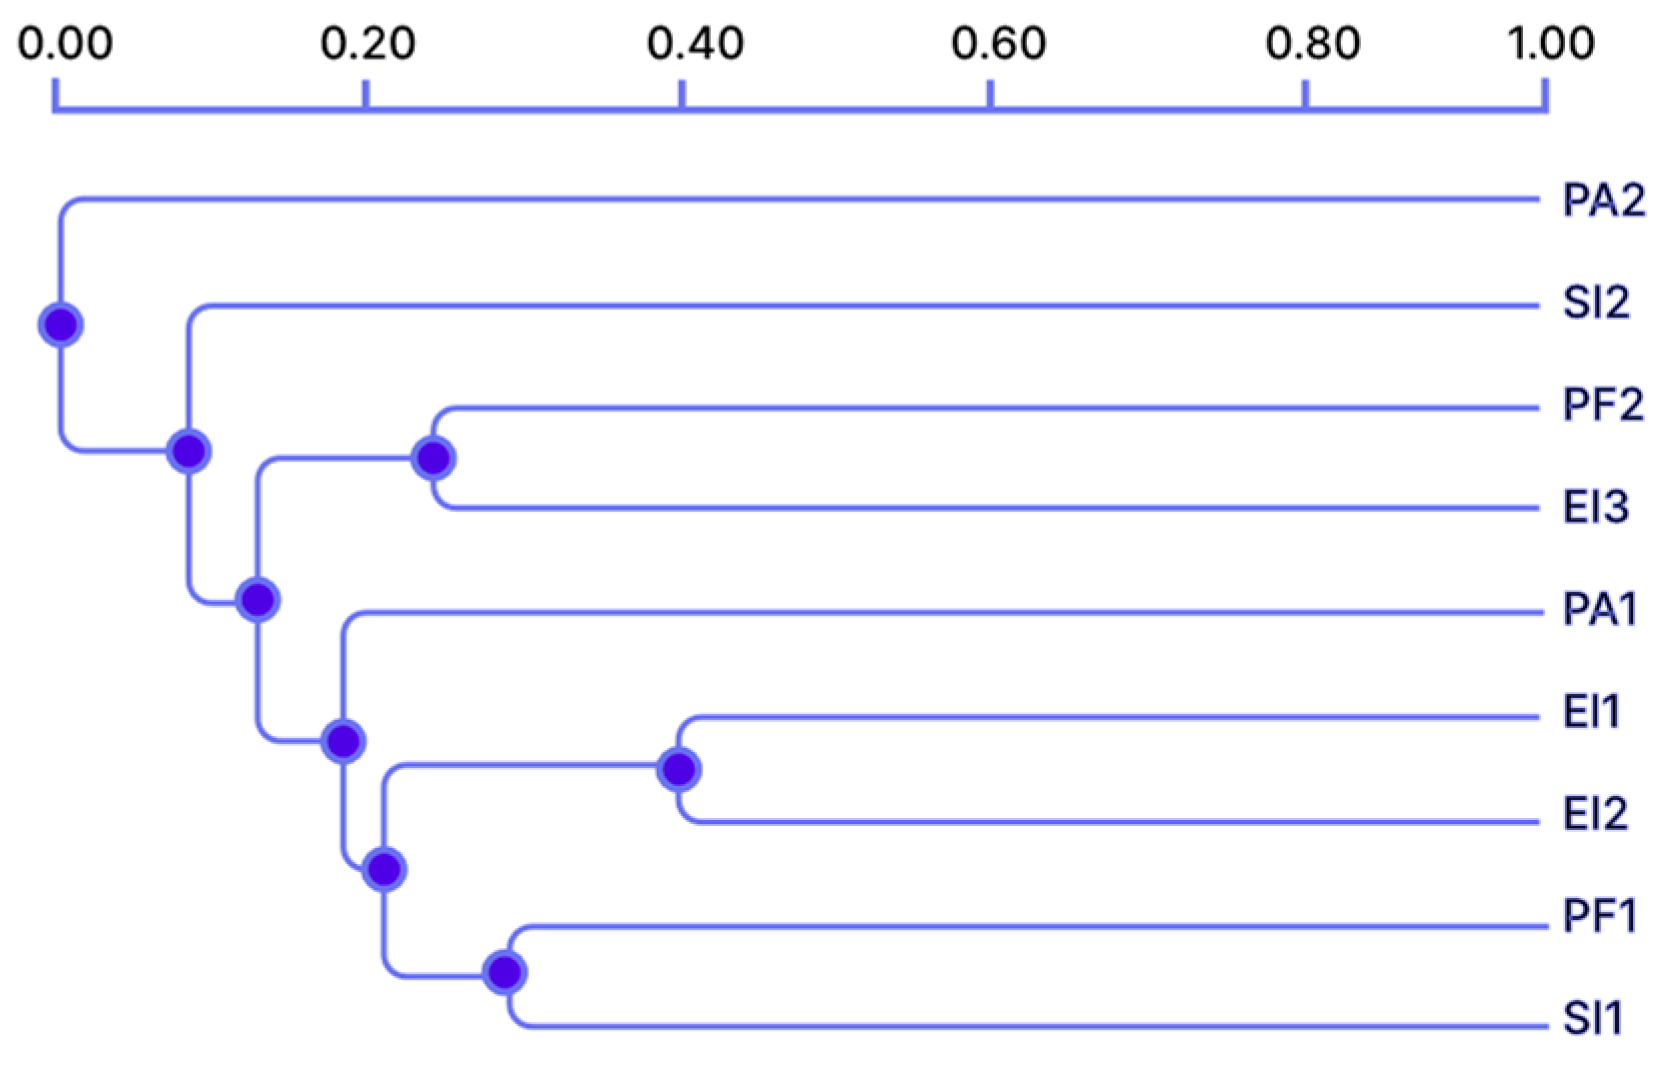
The criteria for forming clusters were based on respondents’ attitudes, preferences, and perceptions of AR automotive assistants. Key variables included functional features (e.g., real-time navigation, safety alerts), ease of integration and use (e.g., minimal manual input, connectivity), perceived benefits and drawbacks (e.g., enhanced driving experience, potential distractions), and demographic factors (e.g., age, gender, driving experience, technological familiarity). The hierarchical clustering results are shown in Figure 4.
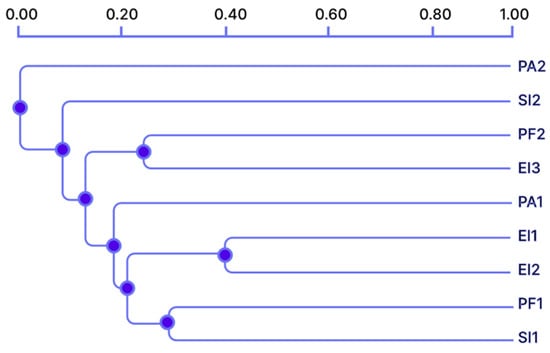
Figure 4.
Hierarchical clustering of consumers.
Users were divided into three groups according to the average value of each attribute as follows:
Cluster 1: In the Safety-Conscious Group, its distinguishing feature is the high rating of emergency assistance (PA2-Positive), which highlights the indispensability of augmented reality (AR) automotive assistants in passive safety strategies.
Cluster 2: In the Technology Enthusiast Group, there is a significant preference for advanced electronic integration (EI1-Positive) and the pursuit of minimal manual operation (EI2-Positive) and, in particular, a deep interest and passion for enabling traceless interaction with AR technology.
Cluster 3: The Experience-Seeking Group is passionate about real-time navigation (PF1-Positive) and seeking engaging interactive experiences (SI2-Positive), with a high demand for experiences that are comprehensive and deeply immersed in augmented reality (AR) environments.
The results show that the user base of AR automotive assistance systems presents a subtle diversity, and their unique preferences provide important implications for the design and promotion of such systems. The Safety-Conscious Group highlighted that in order to improve the safety of vehicles, the application of enhanced real-world technologies is particularly critical. In contrast, the Technology Enthusiast Group tends to pursue products that have innovative technical features to improve their usefulness, and the Experience-Seeking Group pays more attention to immersive and interactive driving enjoyment.
4.4. Support Vector Machine Classification
In this study, support vector machine (SVM) technology was applied to analyze the results of the Kano model and predict users’ emotional responses and behavioral expectations relating to AR car assistants. The SVM (support vector machine) used the analysis results of the Kano model to accurately classify consumers’ emotional attitudes and behavioral expectations toward AR automotive assistants, providing key insights for optimizing product design and formulating marketing strategies.
The specific steps to use SVM to analyze the Kano results were as follows:
1. Data preprocessing: Nine indicators (PF1, PF2, EI1, EI2, EI3, SI1, SI2, PA1, and PA2) were selected as inputs and categorized into four types of output: expected attributes, charm attributes, undifferentiated properties, and necessary attributes [24].
2. Data splitting: The data were split into two sets: as training set, which was used to train the SVM model, and a testing set, which was used to evaluate the model’s performance [25].
3. Feature scaling: The input features were scaled to a standard range to avoid bias due to different scales of input features [26]. This was performed using formula (1):
where x is the original value of the feature, is the minimum value of the feature, is the maximum value of the feature, and is the scaled value of the feature.
4. SVM training: The SVM model was trained using the training set, with the input features and output categories [27,28]. The SVM model used formula (2) to find the decision boundary between the different categories:
where is the weight assigned to the input feature, is the kernel function that measures the similarity between the i-th data point and the test data point x, and b is the bias term.
5. SVM testing: The trained SVM model was tested using the testing set to evaluate its performance [29]. The performance of the SVM model was evaluated using metrics such as accuracy, precision, recall, F1 score, etc.
6. Model tuning: The model parameters were tuned to improve its performance if needed [30]. The parameters that were tuned included the kernel function, the regularization parameter, and the kernel coefficient.
7. Model evaluation: The performance of the SVM model was evaluated using various evaluation metrics such as accuracy, precision, recall, F1 score, etc. These metrics were calculated using formulas (3)–(6) [31]:
where TP is the number of true positives, TN is the number of true negatives, FP is the number of false positives, and FN is the number of false negatives.
8. Prediction: The trained SVM model was used to predict the output categories for new input data 52. The prediction was performed using formula (7) [32]:
where y is the predicted output category for the input data x.
In SVM classification, the focus is on predicting the target variable based on the input variables. The target variable can only take on a limited number of discrete values, such as “satisfied” or “unsatisfied” [33,34]. Therefore, the concept of a reverse attribute, which is a negative aspect of a product or service, is not relevant in this context. SVM classification is primarily concerned with identifying the key attributes that influence the target variable, rather than identifying the presence of negative attributes [35]. As a result, the absence of a reverse attribute in SVM classification is not a limitation, but rather a reflection of the method’s focus on predicting positive outcomes [36].
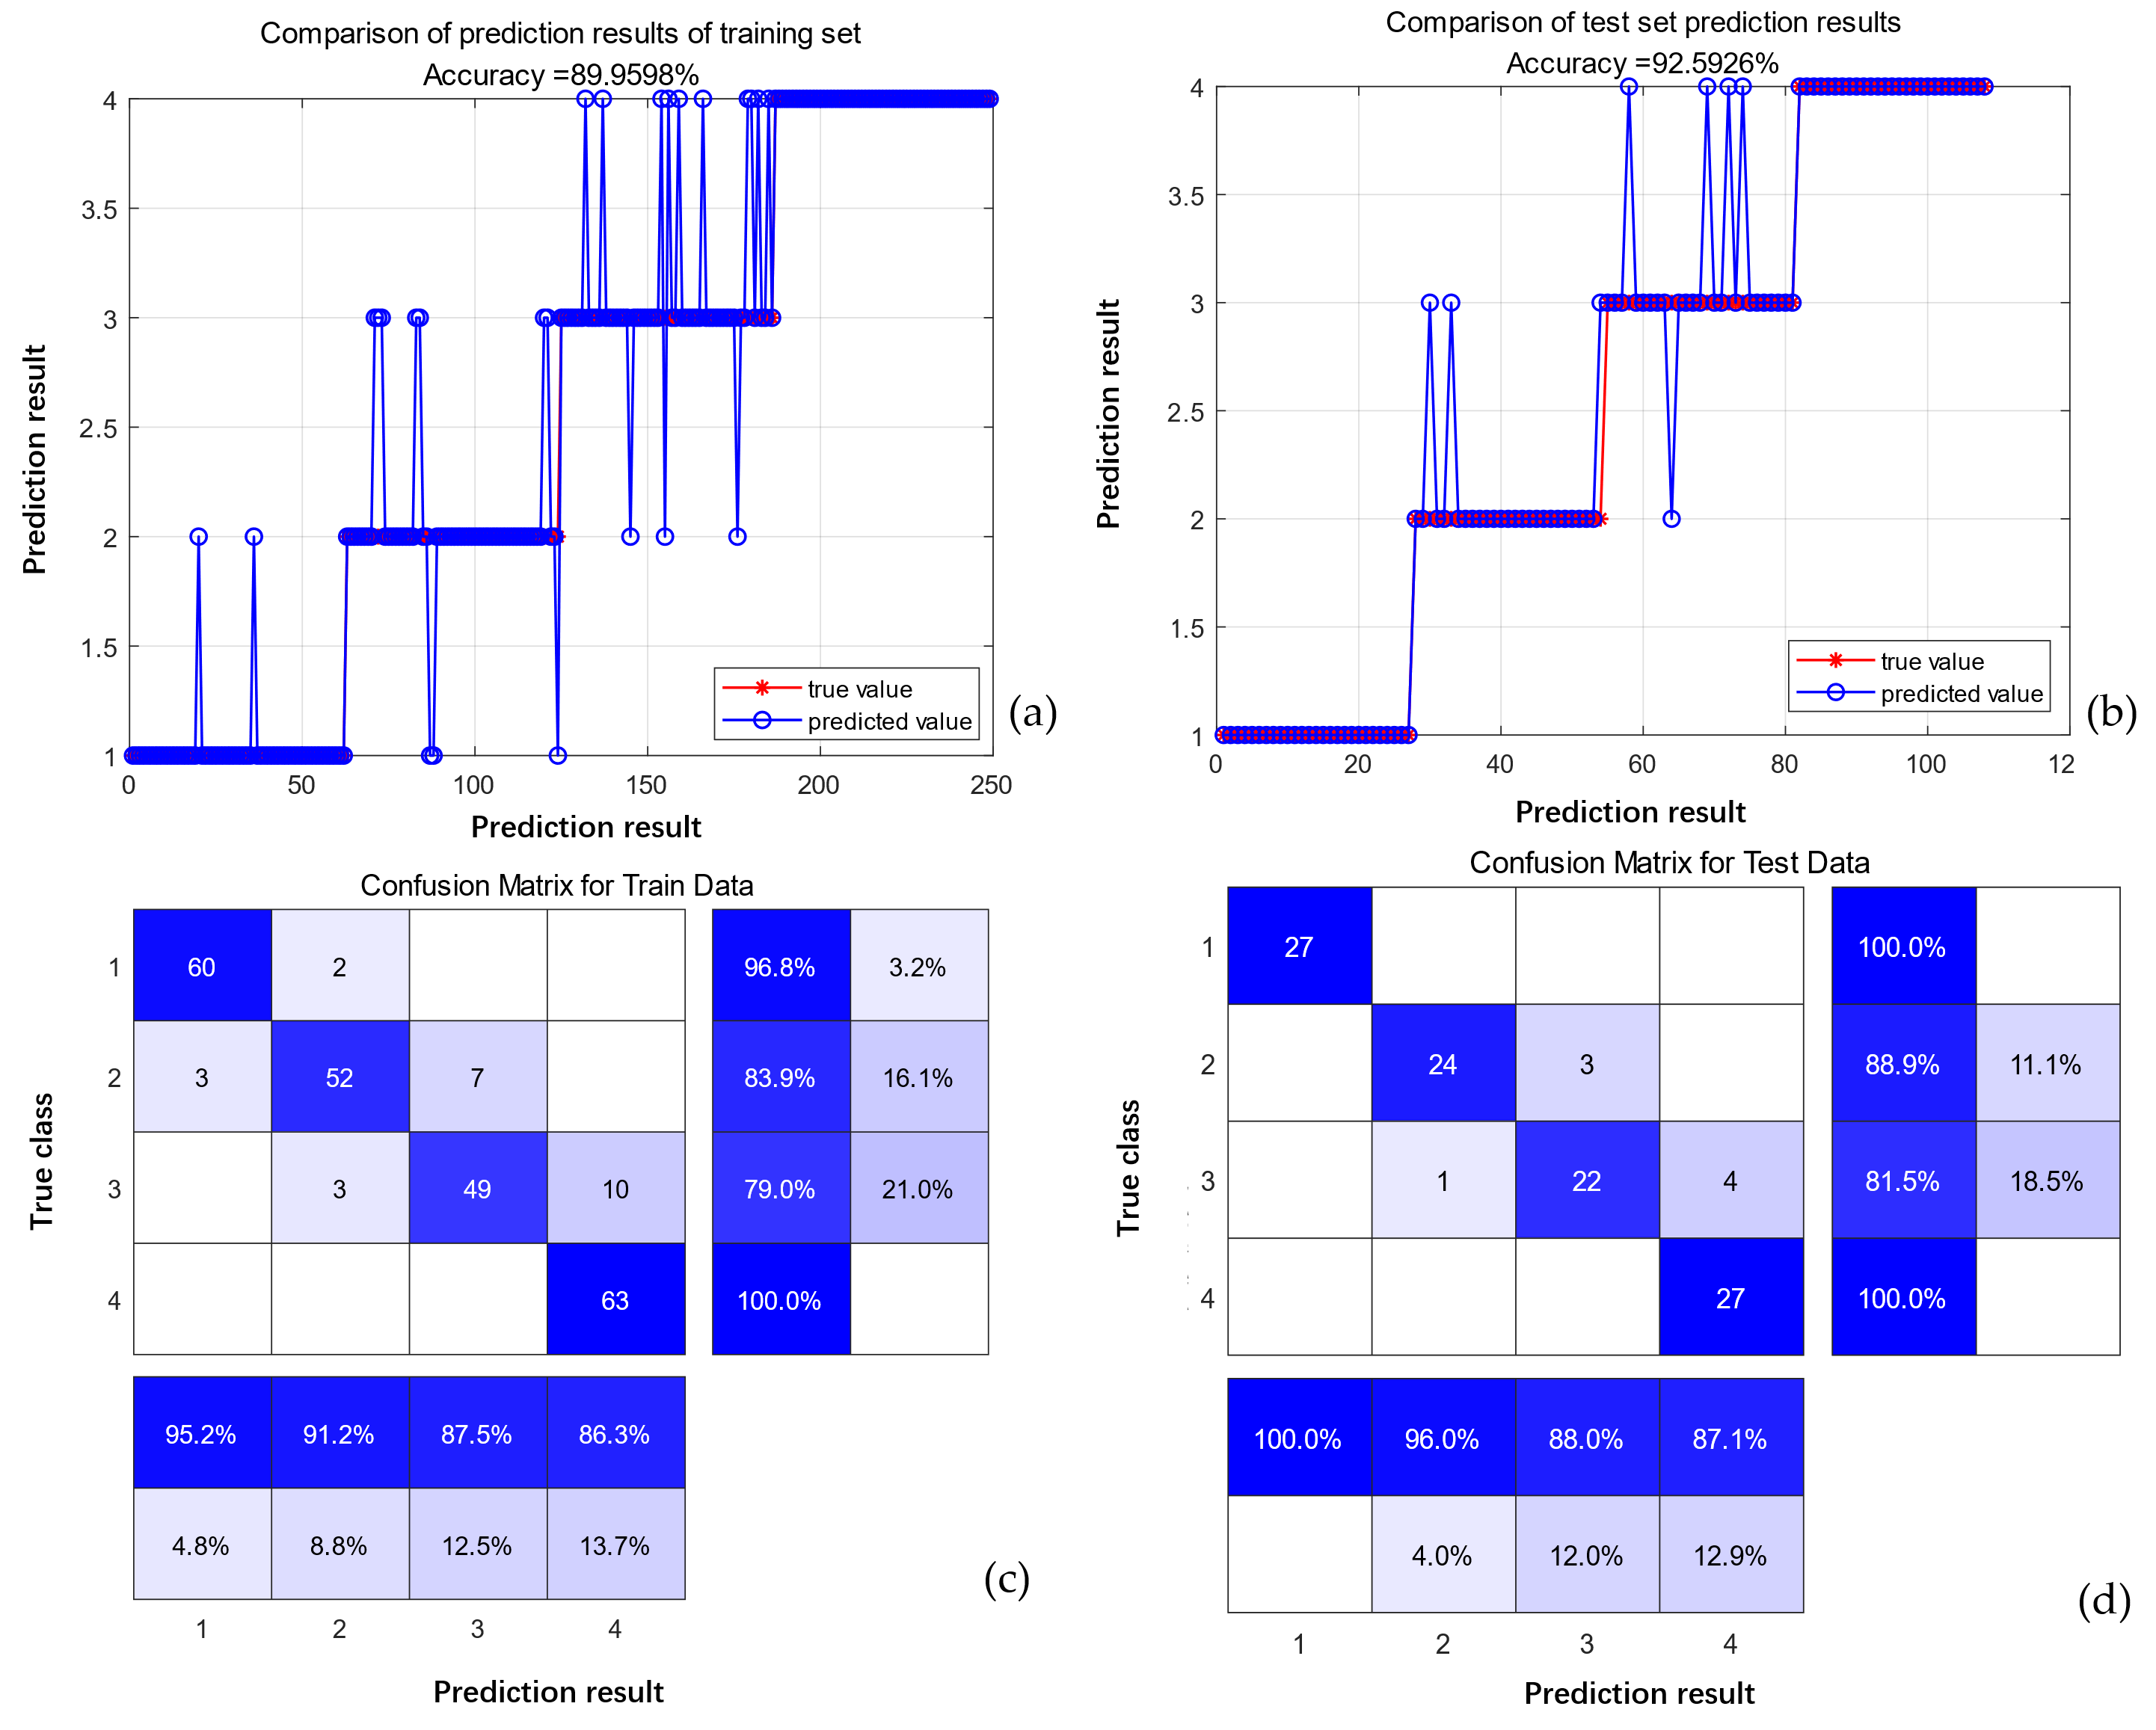
The prediction results of the training set showed an accuracy of 89.9598%, as illustrated in Figure 5a, demonstrating that the SVM model is proficient in accurately predicting users’ attitudes and behavioral intentions towards AR automotive assistants based on the Kano model results. This high level of accuracy suggests that the model effectively captured the intricate relationships between various features of AR automotive assistants and users’ responses to them.
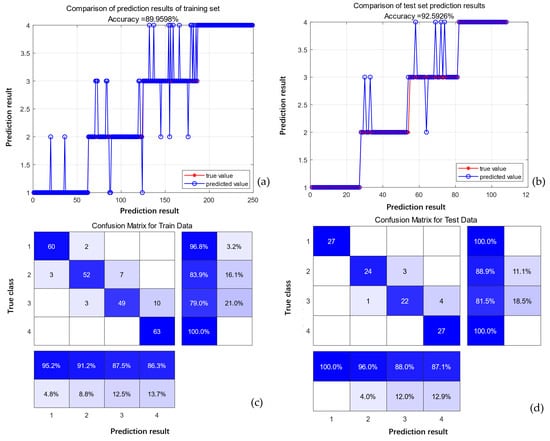
Figure 5.
SVM prediction results: (a) accuracy of comparison of prediction results of the training set; (b) accuracy of comparison of prediction results of the test set; (c) confusion matrix for training data; (d) confusion matrix for test data.
The test set prediction results showed an accuracy of 92.5926%, shown in Figure 5b, revealing that the SVM model has a strong ability to generalize to new, unseen data. Although there was a slight decrease in accuracy compared to the training set, this minor variation does not significantly impact the model’s overall predictive capability, indicating robustness against overfitting.
The confusion matrix for training data, depicted in Figure 5c, offers an in-depth evaluation of the SVM model’s performance on the training dataset. It visualizes the actual versus predicted categories of user attitudes towards AR automotive assistants, with diagonal elements highlighting correct predictions and off-diagonal elements indicating misclassifications. This analysis underscores the model’s proficiency in identifying features classified as charm attributes, where it showcases a high number of accurate predictions.
Similarly, the confusion matrix for the test data, shown in Figure 5d, parallels the insights gained from the training data’s confusion matrix. It confirms the model’s effectiveness in distinguishing between different user attitudes towards AR automotive assistants, particularly excelling in predicting charm attributes followed by expected attributes and undefined property categories.
4.5. Comparison of Predictive Models
To compare the support vector machine (SVM) model with other predictive models for ensuring robustness, an experiment was designed to evaluate the performance of several machine learning techniques and traditional statistical methods. The models included in this comparison are support vector machine (SVM), random forest (RF), K-nearest neighbors (KNN), and logistic regression (LR). The dataset used for the initial SVM analysis, consisting of responses from users regarding their attitudes and preferences for AR automotive assistants, was employed for this experiment. Each model was trained on the training dataset (70%) and tested on the testing dataset (30%), with performance metrics including accuracy, precision, recall, and F1 score. The selection of these models was based on their established effectiveness and diverse methodological approaches in predictive analytics. Random forest was included due to its versatility and high performance in various classification problems, as it builds multiple decision trees and merges them to provide accurate and stable predictions [37]. K-nearest neighbors was selected for its simplicity and effectiveness, making predictions based on the closest training examples in the feature space [38]. Logistic regression was chosen for its interpretability and efficiency in binary and multiclass classification problems, serving as a benchmark to evaluate the added value of more sophisticated models [39]. The comprehensive comparison across these methodologies ensures a robust validation framework for the findings. The results of the experiment are presented in the table below.
According to the results in Table 4, the SVM model outperformed the other models in terms of accuracy, precision, recall, and F1 score. The random forest model showed a comparable performance, slightly poorer than that of the SVM but still robust. The K-nearest neighbors and logistic regression models, while performing well, had lower metrics compared to the SVM and random forest. These results suggest that the SVM is a reliable and robust model for predicting user preferences and attitudes towards AR automotive assistants. The random forest model provides additional validation with its high performance. The comparative analysis confirms the robustness of the SVM findings, ensuring that the conclusions drawn are based on solid evidence.
Table 4.
The results of the vector machine (SVM) model compared with other forecasting models.
5. Discussion
The outcomes of this study reveal that users display a favorable attitude towards AR automotive assistants, and that personal attitudes and beliefs regarding safety, technological advancement, and driving experience significantly influence their behavioral intentions towards these technologies. This aligns with prior research (Braun, Weber, and Alt, 2021) in the realms of automotive innovation and satisfaction improvement, indicating a growing preference among consumers for products that resonate with their values related to safety and modernity [40].
The Kano survey findings underscore the importance of performance features such as real-time navigation and safety alerts for users, alongside the demand for seamless electronic integration and minimal manual input. These insights echo past studies (Krishnadas, 2021) highlighting the evolving consumer demand for more intelligent, user-friendly automotive solutions that enhance driving safety and convenience [41].
The cluster analysis delineated distinct user segments with varying preferences for AR automotive assistant features. It suggests that product developers and marketers need to address these diverse preferences in their strategies. For instance, the Safety-Conscious Group emphasized the importance of safety enhancements, advocating for a design focus on safety-related features. In contrast, the Technology Enthusiast Group and the Experience-Seeking Group highlighted a demand for advanced electronic integration and enriched driving experiences, respectively. This is similar to the results of Bilgram et al. [42].
The SVM classification system’s efficacy in distinguishing between preferred and less preferred features based on users’ responses further illustrates the potential of using such methodologies to refine AR automotive assistant offerings. This approach can guide the development and marketing efforts towards features that significantly influence user satisfaction and adoption intentions.
The study’s findings extend the theory of reasoned action (TRA) by incorporating additional factors specific to AR automotive assistants. While the TRA traditionally focuses on attitudes and subjective norms, this research highlights the importance of perceived ease of use and perceived usefulness, as seen in technology acceptance models. This suggests that the TRA can be expanded to better predict user behavior in contexts involving advanced technologies. Additionally, the cognitive load associated with AR interfaces emerged as a critical factor, suggesting that the TRA should consider cognitive factors alongside social and attitudinal ones, particularly in high-stakes environments such as driving.
Regarding the Kano model, the findings introduced nuances specific to AR automotive assistants. Traditional Kano model assumptions are somewhat static, positing that user expectations remain relatively stable over time. However, the study revealed that user expectations for AR features are dynamic and evolve with increasing technological familiarity and exposure. This suggests that the Kano model should account for the evolving nature of user expectations in rapidly advancing technological fields. Furthermore, the results indicate a complex interplay between different types of features. For example, seamless integration (a basic feature) significantly enhances the perceived value of advanced connectivity (an excitement feature). This interplay suggests that the Kano model could be extended to consider how the presence or quality of one type of feature influences the perceived importance and satisfaction of another.
By integrating these additional technological factors into the TRA and accounting for the dynamic and interdependent nature of user expectations in the Kano model, the study provides a more nuanced understanding of user behavior and satisfaction in the context of AR automotive assistants. These theoretical extensions not only enhance the predictive power of existing models but also offer a framework for future research to explore the complex interactions between user expectations, technological advancements, and behavioral intentions.
6. Conclusions
The study concludes with several potential applications for designing AR automotive assistants. To enhance the practical value of these recommendations, more specific guidelines and actionable steps are provided based on the findings. Prioritizing safety features is crucial, emphasizing the development of safety-related functionalities such as real-time hazard alerts and emergency assistance. This can be achieved by integrating advanced sensor technologies and AI algorithms to provide real-time alerts for potential hazards, ensuring these features are prominently accessible to the driver. Enhancing the user experience with seamless integration is another key recommendation. Ensuring that AR systems are seamlessly integrated with existing vehicle systems to minimize manual input and enhance user convenience is vital. This can be accomplished by developing intuitive user interfaces that allow voice commands and automated system adjustments, reducing the need for manual intervention and ensuring a smooth user experience.
Addressing cognitive load concerns is essential to prevent overwhelming drivers with excessive information. Implementing adaptive display systems that prioritize critical information based on the driving context and providing options for users to customize the amount and type of information displayed can help balance the information presented. Catering to diverse user preferences is also important. Developing features that cater to the different user segments identified in the cluster analysis, namely the Safety-Conscious, Technology Enthusiast, and Experience-Seeking Groups, can enhance user satisfaction. Offering customizable AR packages that allow users to choose and personalize features based on their preferences ensures that the system meets the specific needs of various user groups.
Incorporating user feedback mechanisms is also recommended to continuously improve AR features and user satisfaction. Implementing in-vehicle feedback systems that allow users to rate their experience and suggest improvements in real time can facilitate iterative design improvements. Promoting technological familiarity and trust is necessary to encourage adoption. Educating users about the benefits and functionalities of AR automotive assistants through comprehensive user manuals, tutorial videos, and in-vehicle demonstrations can build trust and highlight safety benefits and ease of use. Optimizing AR displays for various environmental conditions is another critical guideline. Using high-contrast, adaptive display technologies that automatically adjust brightness and contrast levels based on ambient conditions ensures clear visibility at all times. Ensuring data privacy and security is also crucial to build trust and comply with regulations. Implementing robust data encryption methods and providing transparent privacy policies that inform users about data collection, usage, and protection measures can help achieve this.
By following these specific guidelines and actionable steps, developers and marketers can create AR automotive assistants that are not only technologically advanced but also user-friendly, safe, and tailored to meet diverse user needs. These recommendations aim to bridge the gap between theoretical findings and practical applications, ensuring that the benefits of AR technology are fully realized in the automotive industry.
Author Contributions
Conceptualization, F.W. and L.F.; methodology, F.W.; software, J.T.; validation, J.T.; resources, F.W.; writing—original draft preparation, F.W.; writing—review and editing, L.F.; visualization, J.T.; project administration, F.W. All authors have read and agreed to the published version of the manuscript.
Funding
This research was funded by the 2023 Ministry of Education Collaborative Education Project of China (230703711174142), the 2023 Zhanjiang Non-funded Science and Technology Tackling Plan Project (2023B01064), the 2023 Zhanjiang Philosophy and Social Science Planning Project (ZJ23YB45).
Data Availability Statement
The original contributions presented in the study are included in the article, further inquiries can be directed to the corresponding author.
Conflicts of Interest
The authors declare no conflicts of interest.
References
- Boboc, R.G.; Gîrbacia, F.; Butilă, E.V. The application of augmented reality in the automotive industry: A systematic literature review. Appl. Sci. 2020, 10, 4259. [Google Scholar] [CrossRef]
- Marr, B. Extended Reality in Practice: 100+ Amazing Ways Virtual, Augmented and Mixed Reality Are Changing Business and Society; John Wiley & Sons: Hoboken, NJ, USA, 2021. [Google Scholar]
- Panagiotopoulos, I.; Dimitrakopoulos, G. An empirical investigation on consumers’ intentions towards autonomous driving. Transp. Res. Part C Emerg. Technol. 2018, 95, 773–784. [Google Scholar] [CrossRef]
- Capallera, M.; Angelini, L.; Meteier, Q.; Abou Khaled, O.; Mugellini, E. Human-vehicle interaction to support driver’s situation awareness in automated vehicles: A systematic review. IEEE Trans. Intell. Veh. 2022, 8, 2551–2567. [Google Scholar] [CrossRef]
- Gabbard, J.L.; Fitch, G.M.; Kim, H. Behind the glass: Driver challenges and opportunities for AR automotive applications. Proc. IEEE 2014, 102, 124–136. [Google Scholar] [CrossRef]
- Charissis, V.; Falah, J.; Lagoo, R.; Alfalah, S.F.; Khan, S.; Wang, S.; Altarteer, S.; Larbi, K.B.; Drikakis, D. Employing emerging technologies to develop and evaluate in-vehicle intelligent systems for driver support: Infotainment AR HUD case study. Appl. Sci. 2021, 11, 1397. [Google Scholar] [CrossRef]
- Firu, A.C.; Tapîrdea, A.I.; Feier, A.I.; Drăghici, G. Virtual reality in the automotive field in industry 4.0. Mater. Today Proc. 2021, 45, 4177–4182. [Google Scholar] [CrossRef]
- Prospective Industry Research Institute. Report of Market Prospective and Investment Strategy Planning on China Head Up Display Industry (2024–2029); 2024; Available online: https://bg.qianzhan.com/report/detail/15194af7b1374b2b.html (accessed on 19 May 2024).
- Fishbein, M.; Ajzen, I. Predicting and Changing Behavior: The Reasoned Action Approach; Psychology Press: East Sussex, UK, 2011. [Google Scholar]
- Rahman, M.M.; Lesch, M.F.; Horrey, W.J.; Strawderman, L. Assessing the utility of TAM, TPB, and UTAUT for advanced driver assistance systems. Accid. Anal. Prev. 2017, 108, 361–373. [Google Scholar] [CrossRef]
- Alrowaily, M.A. Augmented Reality and Behavioural Change: A Technology Acceptance Study. Ph.D. Thesis, Macquarie University, Macquarie Park, Australia, 2022. [Google Scholar]
- Xia, T.; Lin, X.; Sun, Y.; Liu, T. An Empirical Study of the Factors Influencing Users’ Intention to Use Automotive AR-HUD. Sustainability 2023, 15, 5028. [Google Scholar] [CrossRef]
- Yim, M.Y.-C.; Park, S.-Y. “I am not satisfied with my body, so I like augmented reality (AR)”: Consumer responses to AR-based product presentations. J. Bus. Res. 2019, 100, 581–589. [Google Scholar] [CrossRef]
- Pusda, F.R.; Valencia, F.F.; Andaluz, V.H.; Zambrano, V.D. Training Assistant for Automotive Engineering Through Augmented Reality. In Proceedings of the Augmented Reality, Virtual Reality, and Computer Graphics: 6th International Conference, AVR 2019, Santa Maria al Bagno, Italy, 24–27 June 2019; Proceedings, Part II 6, 2019. pp. 146–160. [Google Scholar]
- Chouchene, A.; Ventura Carvalho, A.; Charrua-Santos, F.; Barhoumi, W. Augmented reality-based framework supporting visual inspection for automotive industry. Appl. Syst. Innov. 2022, 5, 48. [Google Scholar] [CrossRef]
- Stavros, N.; Lalos, A.S.; Tselios, C.; Bitzas, D.; Amaxilatis, D.; Chatzigiannakis, I.; Gerasimos, A.; Moustakas, K. Gamification of EcoDriving Behaviours through Intelligent Management of dynamic car and driver information. In OPPORTUNITIES AND CHALLENGES for European Projects; 2019; pp. 100–123. Available online: https://www.scitepress.org/Papers/2017/88623/88623.pdf (accessed on 19 May 2024).
- Wang, Z.; Han, K.; Tiwari, P. Augmented reality-based advanced driver-assistance system for connected vehicles. In Proceedings of the 2020 IEEE International Conference on Systems, Man, and Cybernetics (SMC), Toronto, ON, Canada, 11–14 October 2020; pp. 752–759. [Google Scholar]
- Detjen, H.; Faltaous, S.; Pfleging, B.; Geisler, S.; Schneegass, S. How to increase automated vehicles’ acceptance through in-vehicle interaction design: A review. Int. J. Hum.—Comput. Interact. 2021, 37, 308–330. [Google Scholar] [CrossRef]
- Wang, J.; Zhu, K.; Hossain, E. Green Internet of Vehicles (IoV) in the 6G era: Toward sustainable vehicular communications and networking. IEEE Trans. Green Commun. Netw. 2021, 6, 391–423. [Google Scholar] [CrossRef]
- De Pinaga, C.B.; Van Eweyk, A.R. A Review of Green Technology and its Effects in the Auto Industry. J. Enterp. Bus. Intell. 2023, 3, 169–178. [Google Scholar] [CrossRef]
- Li, X.; Rong, J.; Li, Z.; Zhao, X.; Zhang, Y. Modeling drivers’ acceptance of augmented reality head-up display in connected environment. Displays 2022, 75, 102307. [Google Scholar] [CrossRef]
- Tabone, W.; De Winter, J.; Ackermann, C.; Bärgman, J.; Baumann, M.; Deb, S.; Emmenegger, C.; Habibovic, A.; Hagenzieker, M.; Hancock, P.A. Vulnerable road users and the coming wave of automated vehicles: Expert perspectives. Transp. Res. Interdiscip. Perspect. 2021, 9, 100293. [Google Scholar] [CrossRef]
- Wang, X.; He, J.; Curry, D.J.; Ryoo, J.H. Attribute embedding: Learning hierarchical representations of product attributes from consumer reviews. J. Mark. 2022, 86, 155–175. [Google Scholar] [CrossRef]
- Tayibnapis, I.R.; Choi, M.-K.; Kwon, S. Driver’s gaze zone estimation by transfer learning. In Proceedings of the 2018 IEEE International Conference on Consumer Electronics (ICCE), Las Vegas, NV, USA, 12–14 January 2018; pp. 1–5. [Google Scholar]
- Zepf, S.; Stracke, T.; Schmitt, A.; van de Camp, F.; Beyerer, J. Towards real-time detection and mitigation of driver frustration using SVM. In Proceedings of the 2019 18th IEEE International Conference on Machine Learning and Applications (ICMLA), Boca Raton, FL, USA, 16–19 December 2019; pp. 202–209. [Google Scholar]
- Schmidt, M.; Bhandare, O.; Prabhune, A.; Minker, W.; Werner, S. Classifying cognitive load for a proactive in-car voice assistant. In Proceedings of the 2020 IEEE Sixth International Conference on Big Data Computing Service and Applications (BigDataService), Oxford, UK, 3–6 August 2020; pp. 9–16. [Google Scholar]
- Sakhare, K.V.; Tewari, T.; Vyas, V. Review of vehicle detection systems in advanced driver assistant systems. Arch. Comput. Methods Eng. 2020, 27, 591–610. [Google Scholar] [CrossRef]
- Nalepa, J.; Kawulok, M. Selecting training sets for support vector machines: A review. Artif. Intell. Rev. 2019, 52, 857–900. [Google Scholar] [CrossRef]
- Chauhan, V.K.; Dahiya, K.; Sharma, A. Problem formulations and solvers in linear SVM: A review. Artif. Intell. Rev. 2019, 52, 803–855. [Google Scholar] [CrossRef]
- Cervantes, J.; Garcia-Lamont, F.; Rodríguez-Mazahua, L.; Lopez, A. A comprehensive survey on support vector machine classification: Applications, challenges and trends. Neurocomputing 2020, 408, 189–215. [Google Scholar] [CrossRef]
- Pisner, D.A.; Schnyer, D.M. Support vector machine. In Machine Learning; Elsevier: Amsterdam, The Netherlands, 2020; pp. 101–121. [Google Scholar]
- Ghosh, S.; Dasgupta, A.; Swetapadma, A. A study on support vector machine based linear and non-linear pattern classification. In Proceedings of the 2019 International Conference on Intelligent Sustainable Systems (ICISS), Palladam, India, 21–22 February 2019; pp. 24–28. [Google Scholar]
- Vapnik, V.; Izmailov, R. Reinforced SVM method and memorization mechanisms. Pattern Recognit. 2021, 119, 108018. [Google Scholar] [CrossRef]
- Chandra, M.A.; Bedi, S. Survey on SVM and their application in image classification. Int. J. Inf. Technol. 2021, 13, 1–11. [Google Scholar] [CrossRef]
- Goudjil, M.; Koudil, M.; Bedda, M.; Ghoggali, N. A novel active learning method using SVM for text classification. Int. J. Autom. Comput. 2018, 15, 290–298. [Google Scholar] [CrossRef]
- Campbell, C.; Ying, Y. Learning with Support Vector Machines; Springer Nature: Singapore, 2022. [Google Scholar]
- Breiman, L. Random forests. Mach. Learn. 2001, 45, 5–32. [Google Scholar] [CrossRef]
- Isnain, A.R.; Supriyanto, J.; Kharisma, M.P. Implementation of K-Nearest Neighbor (K-NN) Algorithm For Public Sentiment Analysis of Online Learning. IJCCS (Indones. J. Comput. Cybern. Syst.) 2021, 15, 121–130. [Google Scholar] [CrossRef]
- Connelly, L. Logistic regression. MedSurg Nurs. 2020, 29, 353–354. [Google Scholar]
- Braun, M.; Weber, F.; Alt, F. Affective automotive user interfaces–reviewing the state of driver affect research and emotion regulation in the car. ACM Comput. Surv. (CSUR) 2021, 54, 1–26. [Google Scholar] [CrossRef]
- Krishnadas, R. Understanding Customer Engagement and Purchase Behavior in Automobiles: The Role of Digital Technology. In Handbook of Research on Technology Applications for Effective Customer Engagement; IGI Global: Hershey, PA, USA, 2021; pp. 1–13. [Google Scholar]
- Bilgram, V.; Laarmann, F. Accelerating innovation with generative AI: AI-augmented digital prototyping and innovation methods. IEEE Eng. Manag. Rev. 2023, 51, 18–25. [Google Scholar] [CrossRef]


Disclaimer/Publisher’s Note: The statements, opinions and data contained in all publications are solely those of the individual author(s) and contributor(s) and not of MDPI and/or the editor(s). MDPI and/or the editor(s) disclaim responsibility for any injury to people or property resulting from any ideas, methods, instructions or products referred to in the content. |
© 2024 by the authors. Licensee MDPI, Basel, Switzerland. This article is an open access article distributed under the terms and conditions of the Creative Commons Attribution (CC BY) license (https://creativecommons.org/licenses/by/4.0/).