Abstract
The power battery is a key component of electric vehicles and its performance is greatly affected by temperature. Battery thermal management systems based on phase change materials can effectively control the battery temperature and at the same time have the advantages of simple structures, energy savings, and good temperature uniformity, and has broad development prospects. In this paper, expanded graphite–paraffin composite phase change materials were prepared, phase change material cooling experiments were carried out, and a phase change material cooling simulation model was also established using the Fluent software to study the influence of phase change material thermophysical parameters on thermal management performance. The results show that the phase change material thermal management method has excellent cooling performance. The best thermal management performance is achieved at the 3C discharge rate, with a phase change material filling thickness of 4 mm, a melting point of 40 °C above ambient temperature, and a thermal conductivity of 3 W/(m·K). When the phase change latent heat was increased from 150 J/g to 250 J/g, the liquid phase ratio decreased from 0.84 to 0.51, and the subsequent cooling performance was greatly improved, so the phase change latent heat should be increased as much as possible.
1. Introduction
With the rapid development of new energy vehicles, the power battery, as one of the core components, has become the focus of research and attention. The range and safety of power batteries have also become the main problems limiting the development of new energy vehicles. Currently, lithium-ion power batteries are widely used in electric vehicles, and compared with other rechargeable batteries, lithium-ion batteries have the advantages of high energy density, low self-discharge rate, low maintenance requirements, long cycle life, light weight, and high compactness [,,]. However, the operating performance of lithium-ion batteries is greatly affected by the ambient temperature, and safe and efficient battery operation can only be achieved within a relatively narrow temperature interval. At low temperatures, the internal resistance of lithium-ion batteries will increase rapidly, the charge and discharge capacity will be significantly reduced, and the number of charge and discharge cycles will also be greatly reduced. High-rate charging and discharging of the battery at too low a temperature can also create safety issues such as internal short circuits. In a high-temperature environment, if the battery temperature is not effectively controlled, the high temperature will cause the internal SEI film and positive and negative active materials to decompose sequentially, and the diaphragm will melt, which will lead to internal chain chemical reactions and generate a large amount of heat, resulting in safety accidents such as the thermal runaway of the battery [,,].
Therefore, in order to ensure the working performance and thermal safety of lithium-ion batteries, the battery should be maintained at a temperature of 20~45 °C. In addition, the performance of the battery not only needs to meet the reasonable temperature range, but also to ensure that the temperature difference between the battery cells is less than 5 °C [,,]. Leaving the above operating conditions will lead to battery performance degradation, shorten the life span, and even lead to thermal runaway and other safety issues. The main role of the battery thermal management system is to cool or heat the battery to make it work in the optimal temperature range. Therefore, it is crucial to design a high-performance battery thermal management system (BTMS) to ensure the safe and efficient operation of Li-ion power batteries. With the increasing research on phase change materials (PCMs), BTMSs based on PCMs have received widespread attention due to their simple structure, shape adaptability, and no extra energy consumption [,,,].
Bais et al. [] conducted a numerical study using RT-42 paraffin wax as a working material for controlling battery temperature. The effect of PCM thickness from 1 to 7 mm around the battery cells was investigated. The results showed that the optimum PCM thickness for effective temperature control is 4 mm, beyond which the performance gain is almost negligible. However, the low thermal conductivity of pure RT-42 paraffin limits its thermal transfer efficiency. Lee et al. [] used three different PCMs, n-octadecane, n-octacosane, and n-docosane, with melting temperatures of 27.7 °C, 36.1 °C, and 44 °C, respectively, in a BTMS. It was found that during 3C charging, the maximum cell temperature of n-docosane was 45.6 °C, which already exceeded the optimal operating temperature; n-octadecane undergoes the phase transition process too quickly and has weak subsequent thermal management performance; and n-octadecane has a melting temperature of 36.1 °C, which is suitable for BTMS.
Wang [] et al. used phase change materials consisting of paraffin wax and expanded graphite with different melting points in order to investigate the effect of composite phase change materials (CPCM) with different phase change temperatures on the thermal management performance of batteries. It was found that paraffin with a phase change temperature of 48 °C was the most suitable, and the use of parameters with a cell spacing of 4.4 mm, a convective heat transfer coefficient of 0.8 W/(m-K), and a mass fraction of 10.9% not only meets the temperature requirement, but also reduces the volume fraction of the phase change material by 18.4%. Xin et al. [] used a paraffin-expanded graphite composite PCM to numerically and experimentally investigate the performance of a passive BTMS of a 5000 mAh cylindrical Li-ion battery. The results show that the maximum temperature of the battery can be controlled at 48.26 °C at 2C multiplicity when the thickness of the composite phase change material is 4 mm. Malik et al. [] designed, developed, and experimentally tested a composite phase change material cooling system for battery packs. The addition of graphene improves the thermal performance of the PCM, and the coefficient of thermal expansion of the composite PCM is significantly higher than that of the pure PCM. A 6 mm thick composite PCM reduces the temperature of the battery pack from 56.5 °C to 36.5 °C at a discharge rate of 4C. Hussain et al. [] conducted thermal management performance experiments using a nickel foam–paraffin composite PCM on a Li-ion 18,650 cell with a capacity of 3.14 Ah. The composite PCM reduced the surface temperature of the battery by 31% and 24% compared to natural air convection and pure PCM, respectively, at 2C magnification.
Li et al. [] proposed a novel petal-type battery thermal management system (BTMS) with a double-layer phase change material. The results showed that the dual-layer phase change material BTMS had the best thermal performance and environmental adaptability at three typical ambient temperatures compared to other conventional BTMSs with a single-phase change material. In addition, the above BTMS was optimised by using fin-enhanced heat transfer technology. At ambient temperatures of 30 °C and 40 °C, the maximum temperature difference was reduced by 5.53% and 29.19%, and the maximum temperature rise was reduced by 36.15% and 42.76%, respectively, for the optimised scheme with asymmetric fin arrangement compared to the BTMS without fins. Du et al. [] comprehensively investigated, for the first time, the effect of mechanical vibration on the thermal management module of PCM lithium-ion batteries at high ambient temperatures. The influence patterns of parameters such as phase change material thickness, vibration amplitude and vibration frequency on the thermal management performance were discussed in detail. The results show that under mechanical vibration conditions, the maximum temperature rise is reduced by 31%, 45%, 48%, and 24% for PCM thicknesses of 3 mm, 7 mm, 9 mm, and 12 mm, respectively, and that increasing the vibration amplitude and vibration frequency improve the thermal management performance of the battery module.
In summary, it can be seen that the current research direction of phase change cooling thermal management is mainly in the type of phase change materials and the arrangement of phase change materials and battery packs; however, the composite phase change materials have complex thermophysical parameters and a wide range of thermophysical parameters, so this paper will mainly use a combination of experimental and simulation research methods to explore the thermal management performance of phase change material cooling, revealing the influence of the thermophysical parameters of the phase change materials on the cooling performance. Therefore, this paper mainly investigates the thermal management performance of phase change material cooling by combining experiments and simulations, reveals the influence of the thermal property parameters of phase change materials on the cooling performance, and provides guidance for the selection and preparation of composite phase change materials in phase change cooling thermal management.
2. Experimental Test Systems and Model Validation
2.1. Subjects of Experiment
Currently, the widely used lithium-ion power batteries are mainly lithium iron phosphate batteries and lithium ternary batteries, of which lithium ternary batteries have the advantages of high energy density and excellent performance in low-temperature environments compared with lithium iron phosphate batteries. At the same time, the cylindrical lithium-ion battery is smaller in size and larger in surface area than the square battery, which is more suitable for the research of thermal management performance of phase change material cooling. Therefore, the 18650 ternary lithium-ion battery is selected as the research object, and its shape, specific specifications, and performance parameters are shown in Figure 1 and Table 1.
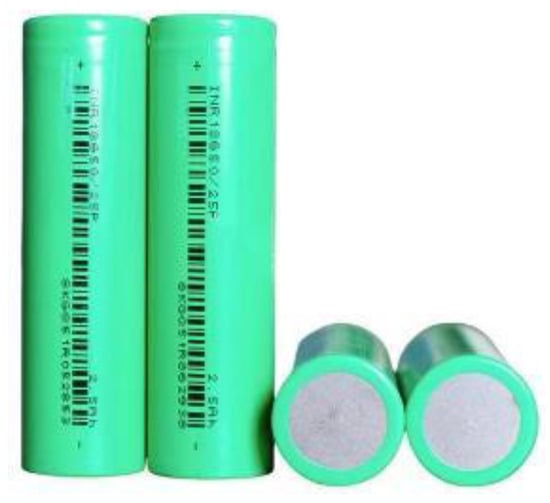
Figure 1.
An 18650 lithium-ion battery.

Table 1.
Specification parameters of 18650 lithium-ion battery.
2.2. Preparation of Composite Phase Change Materials
The expanded graphite–paraffin composite phase change material is selected for the battery thermal management system according to the selection requirements of composite phase change materials. The composite phase change material is mainly prepared by taking industrial paraffin as the phase change matrix and adding a certain mass fraction of expanded graphite into the matrix by the melt blending method. The specification parameters of paraffin and expanded graphite are shown in Table 2, the specific preparation process is shown in Figure 2, and the parameters of the prepared composite phase change material are shown in Table 3.
Table 2.
Paraffin and expandable graphite specifications.
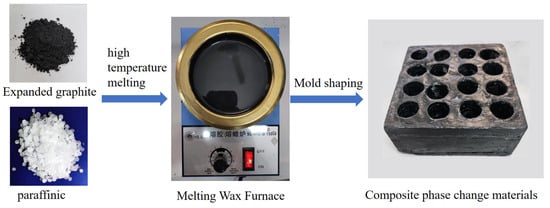
Figure 2.
Composite phase change material preparation process.
Table 3.
Thermophysical parameters of composite phase change materials.
Expandable graphite is firstly dried and expanded at high temperature to obtain expanded graphite, and solid paraffin is placed in a wax melting furnace and melted at high temperature to obtain liquid paraffin. Using a balance, a specific mass of expanded graphite is weighed and added to the liquid paraffin. Then, the paraffin and expanded graphite are mixed evenly through high-speed stirring to obtain the liquid composite phase change material. A specific mould is made according to the placement and distance of the battery, and the liquid composite phase change material is poured into the mould and cooled to obtain the composite phase change material module.
2.3. Experimental Test Systems and Programmes
The composite phase change material module made in the previous section has been reserved for the battery holes. A total of 16 18650 lithium battery monomers are sequentially placed in the holes and a hand-held welding machine is used to connect the battery monomers into the battery pack in the form of “four series connection and four parallel connection”. According to the law of conservation of energy on the overall heat generation of the battery and the heat storage capacity of the phase change material for the initial estimation, the distance between the battery cells is set to 4 mm, and the total size of the battery module is 92 mm × 92 mm × 65 mm. In order to accurately monitor the temperature changes of the lithium-ion battery in the working process, according to the principle of symmetry, six of the lithium-ion batteries are installed with K-type thermocouple temperature sensors on the surface of the batteries, and a temperature data acquisition instrument is used to record the temperature data in real time. The maximum temperature of the entire battery pack is taken as the maximum value of the six monitoring points, and the maximum temperature difference is taken as the difference between the maximum and minimum values of the six monitoring points. The whole battery module is placed in a heat preservation box to simulate the external constant temperature environment, and all wires are connected. The experimental platform adopts the experimental device shown in Figure 3, and the phase change material cooling module is connected to the battery charge/discharge tester and temperature sensor and placed in the battery high and low temperature experimental box, as shown in Figure 3.
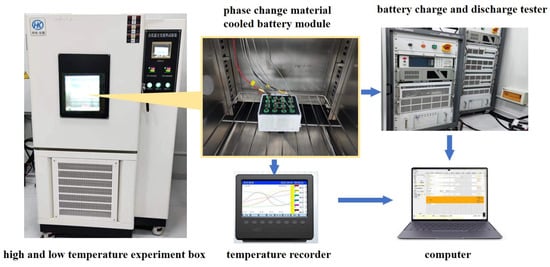
Figure 3.
Systems for experimental testing of phase change material cooling.
The lithium-ion power battery in normal use, using the 3C discharge multiplier, is already a discharge multiplier discharge. This time, the battery heat production is huge; if the thermal management system cooling performance is not enough, there will appear to be a thermal runaway risk. Therefore, this experiment adopts an ambient temperature of 25 °C and an initial discharge rate of 3C to monitor the cooling performance of phase change materials for power batteries. The specific experimental steps are as follows:
(1) Place the fully charged battery module in a constant temperature box, set the temperature to 25 °C, and leave it for 2 h so that the initial temperature of the battery module is the same as the ambient temperature.
(2) Turn on the temperature data collector, start the charge/discharge tester, set the discharge current to 3C constant multiplier, and set the discharge time to 1200 s or reach the battery protection cut-off voltage to stop automatically.
(3) Collect the temperature data monitored by the temperature collector and sort and analyse them.
In order to reduce the measurement error in the experimental process, repeat the above experiments three times, record the temperature monitoring point values under the same working conditions, and take the average value of the three experimental data points as the final experimental results.
2.4. Experimental Results and Discussion
When the initial ambient temperature is 25 °C, the maximum temperature and the maximum temperature difference of the battery pack under the 3C discharge rate condition with the discharge time are shown in Figure 4. As can be seen from the figure, in the pre-discharge phase change material using phase change sensible heat to absorb the heat generated by the battery pack, the temperatures of the phase change material and the battery pack continue to rise. In the discharge time of about 600 s, the battery pack temperature reaches the melting point of the phase change material. At this time, the phase change material uses the phase change reaction to absorb the heat of the battery pack, and the temperature of the battery pack maintains in the vicinity of the melting point of the phase change. At the end of the discharge, the maximum temperature of the battery pack is 41.4 °C. The phase change material cooling has excellent thermal management performance. As can be seen from the curve of the maximum temperature difference of the battery pack, the addition of the phase change material also significantly improves the temperature uniformity of the battery pack throughout the discharge cycle of the battery pack. In the pre-discharge period, the maximum temperature of the battery pack gradually increases because the phase change material does not undergo a phase change reaction. The temperature difference of the battery pack is similar to that of the maximum temperature of the battery pack, and the phase change reaction of the phase change material starts to occur when the discharge time is about 600 s. Under the action of the phase change material, the maximum temperature difference of the battery pack decreases, and the temperature difference of the battery pack is maintained at about 0.4 °C in the late stage of the discharge. During the whole discharge process, the maximum temperature difference of the battery pack occurs at the moment before the phase change reaction occurs, which is 1.6 °C, much lower than the requirement of the maximum temperature difference of the battery pack of less than 5 °C.
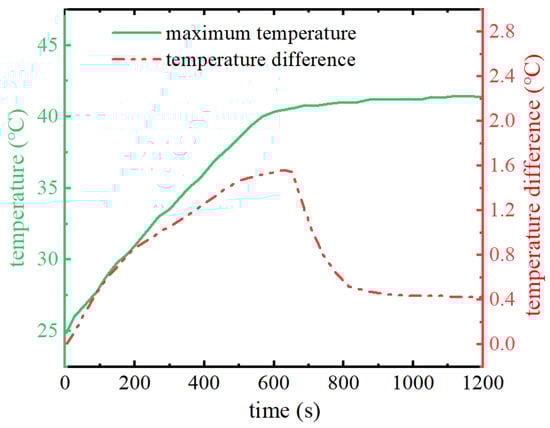
Figure 4.
Battery pack maximum temperature and temperature difference change curve.
In summary, it can be seen that the cooling of the phase change material can meet the thermal management performance requirements at high discharge multiples of the battery pack. However, the energy density of the battery pack will decrease after adding the phase change material, so the filling thickness of the phase change material has a great influence on the improvement of the energy density of the battery pack. Therefore, it is necessary to study the influence of the filling thickness of phase change materials on the thermal management performance. At the same time, the composite phase change material has a wide range of thermophysical parameters; how to select the appropriate phase change material parameters needs to be further studied.
2.5. Simulation Model Building and Verification
2.5.1. Simulation Modelling
SolidWorks by Dassault Systemes (Concord, MA, USA) is a Windows-based mechanical design software launched by Solid Works, Inc., focusing on providing fully parametric feature modelling technology to make complex 3D parts solid modelling, complex assembly, and generating engineering drawings easy and fast. The software is known to be powerful, easy to learn, and easy to use, and for its technological innovation of the three major features, to become the leading, mainstream three-dimensional CAD solution. With the rapid development of computer science and technology comes the realization of solutions for discrete specific problems, such as the finite element method numerical simulation of computational fluid dynamics and other related scientific problems. Such methods are called computational fluid dynamics (computational fluid dynamic, CFD), and they analyse the system of fluid flow, heat transfer, and other related physical phenomena in space and time through computer calculations and image display. The CFD numerical simulation software used in this paper is Fluent. Fluent by Ansys (Canonsburg, PA, USA) is one of the widely used computational fluid dynamics software in the international arena, and is developed and held by Ansys in the U.S.A. Fluent is equipped with powerful modelling, solving, and post-processing capabilities, which provide engineers and researchers with a way to efficiently and accurately simulate and analyse a wide range of fluid dynamics problems. Therefore, by referring to the battery module of the phase change material cooling experiment, the SolidWorks software is used to establish a 3D solid model. The whole battery module is divided into a lithium battery module and a composite phase change material module. Among them, the battery module consists of an 18650 Li-ion ternary battery monomer, and the number and connection of the battery are consistent with the experimental part. The size of the composite phase change material module is related to the filling thickness of the phase change material, and the filling thickness of the phase change material determines the spacing between the battery monomers d. Figure 5a demonstrates the 3D model of this phase change cooling structure, which is pre-processed and meshed to obtain the mesh used for the simulation calculations, as shown in Figure 5b. The mesh type is a polyhedral mesh. The mesh includes 2,895,027 nodes and 560,690 cells. At the same time, in order to improve the calculation accuracy of the contact position between the battery model and the phase change material model, a boundary layer mesh is added around the battery monomer model, and this mesh is imported into the Fluent 2021 R2 software for simulation calculations.
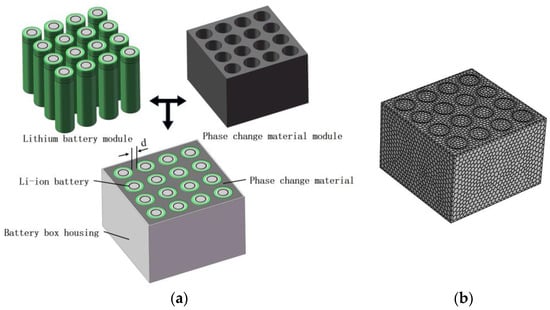
Figure 5.
Cooling structure and mesh modelling of composite phase change materials. (a) Structural model for phase change cooling. (b) Mesh.
2.5.2. Simulation Model Verification
In order to verify the accuracy of the simulation model, according to the experimental battery pack model, the distance d between the battery cells was set to 4 mm, and the overall dimensions of the simulation model and the experimental model were the same as those of the simulation model, which were 92 mm × 92 mm × 65 mm. The initial temperature was set to be 25 °C, convective heat transfer coefficients were set to be 5 W/(m2·K) for the part in contact with the outside world in the simulation model, and parameters such as density and specific heat capacity were used. In the initial conditions, the density and specific heat capacity of the lithium battery are used, the thermal properties of the composite phase change material are consistent with those of the expanded graphite–paraffin composite phase change material prepared by the experimental values, the heating power of the battery is set to be that of the 3C discharge rate, and the simulation time is set to be 1200 s. Figure 6 shows the comparison curves of the maximum temperature of the battery pack with the discharge time under the ambient temperature of 25 °C and the comparison curves between the experimental and simulated values.
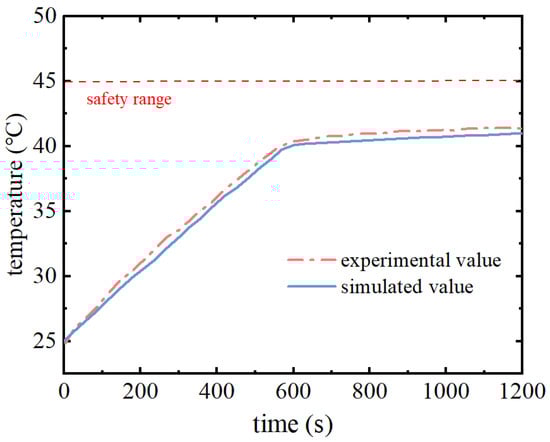
Figure 6.
Model validation.
As can be seen from Figure 6, the simulation value of the maximum temperature of the battery pack in the working process is consistent with the overall trend of the experimental value. In the early stage, the maximum temperature is increasing, due to the contact thermal resistance between the phase change material and the battery pack in the experimental process and the error in the measurement process of the sensor, so the experimental value is higher compared with the simulation value. However, the overall trend of the two remains the same. In the discharge time of about 600 s, the phase change material undergoes a phase change reaction and the maximum temperature of the battery pack is maintained near the melting point of the phase change. During the whole battery pack discharge process, the maximum error between the simulation value and the experimental value is 0.5 °C, which is within a reasonable range, so the phase change material cooling model established in this paper can accurately calculate the cooling performance of the battery thermal management system.
The simulation study not only monitors the overall temperature change of the battery pack, but also monitors the degree of melting of the phase change material, i.e., the liquid phase rate. The liquid phase rate can reflect the degree of utilization of the latent heat of the phase change and at the same time can evaluate the subsequent thermal management performance of the phase change material. Figure 7 shows the overall temperature distribution of the battery module at the end of discharge. As can be seen from the figure, the highest temperature of the battery module is located in the centre of the battery, and the surrounding heat is absorbed by the phase change material quickly, so the surface temperature is lower. Due to the existence of the phase change material, the overall temperature uniformity is good and the maximum temperature difference is within 2 °C. Figure 8 shows a cloud view of the liquid phase rate distribution of the phase change module at the moment of the end of the discharge. From this figure, it can be seen that the overall distribution of the phase change module liquid phase rate is relatively uniform and the liquid phase rate of the local phase change material around the cell is higher, but the overall liquid phase rate of the phase change material is lower, which is sufficient for subsequent thermal management performance. Therefore, further research can be carried out through this simulation model.
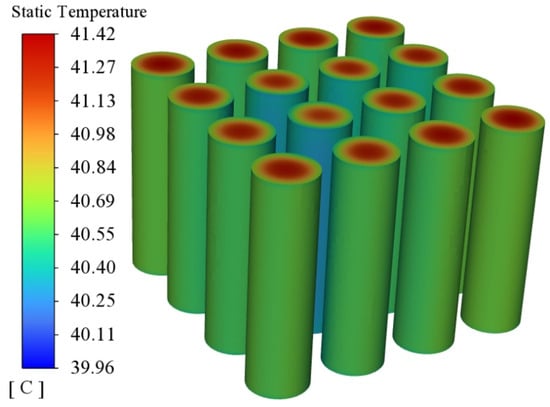
Figure 7.
Temperature distribution of battery pack.
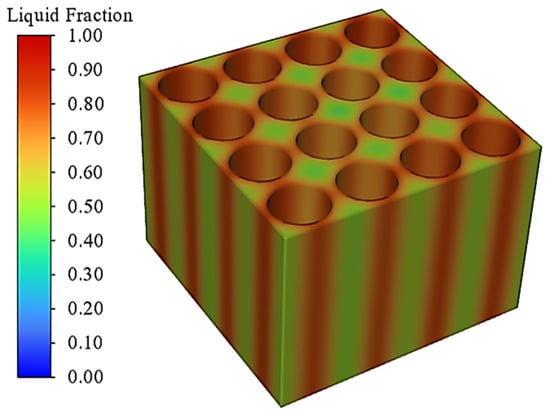
Figure 8.
Liquid phase volume fraction distribution of phase change module.
3. Results and Discussion
3.1. Impact of Fill Thickness on Thermal Management Performance
In the composite phase change material battery thermal management module, the phase change material is filled around the battery monomer, and the thickness of the filling determines the quality of the phase change material used for the thermal management system, thus affecting the performance of the thermal management system. Too little phase change material will cause the heat generated by the battery pack to be unable to be fully absorbed, which will reduce the cooling performance; too much filling thickness will take up the space of the battery pack, which will reduce the overall energy density of the battery pack. In order to investigate the most suitable composite phase change material thickness, after a preliminary calculation of the phase change material filling amount, phase change cooling thermal management structures with 2 mm, 4 mm, and 6 mm phase change material filling thickness were designed for the simulation study.
Figure 9 shows the maximum temperature change curve of the battery pack under different phase change material filling thicknesses. From the figure, it can be seen that the maximum temperature of the battery pack is increasing in the pre-discharge period, and with the increase of the filler thickness, the rate of increase of the temperature of the battery pack decreases and the time for the phase change material to start the phase change process is delayed. The increase in the filling mass of the phase change material will use sensible heat to absorb more heat from the battery pack in the early stage, delaying the time to reach the melting point of phase change. At different filling thicknesses, the cell temperature reaches the phase transition melting point at 400 s, 550 s, and 680 s, respectively. Since the melting points of the phase change materials are the same, the latent heat of phase change continues to be used to absorb the heat generated by the battery pack after the phase change occurs, maintaining the maximum temperature of the battery pack unchanged. However, at the end of the discharge period, when the thickness of the phase change material is 2 mm, due to the insufficient filling quality of the phase change material, the phase change material completely melts and the latent heat of phase change is exhausted, so it cannot continue to absorb the heat from the battery pack, resulting in a rapid increase in the temperature of the battery pack. When the thickness of phase change material is 2 mm, 4 mm, and 6 mm, the maximum temperatures of the battery pack are 46.26 °C, 40.98 °C, and 40.67 °C, respectively.
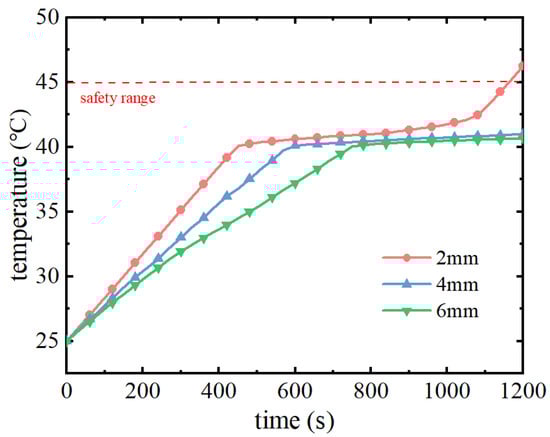
Figure 9.
Maximum battery pack temperature with time for different PCM thicknesses.
Figure 10 and Figure 11 show the cloud diagrams of the maximum temperature difference of the battery pack and the overall temperature distribution of the battery module, respectively. From Figure 10, it can be seen that in the pre-discharge period of the battery pack, the maximum temperature difference increases continuously with the discharge time, and when the phase change melting point is reached, the phase change process makes the maximum temperature difference start to decrease rapidly. As the filling thickness of the phase change material decreases, the time to reach the melting point of the phase change is also accelerated and the start time of the phase change process is advanced, so the maximum temperature difference also decreases. When the filling thickness is 2 mm, 4 mm, and 6 mm, the maximum temperature difference is 0.57 °C, 1.39 °C, and 2.19 °C. As can be seen in Figure 11, the overall temperature distribution of the battery pack is basically the same under the different filling thicknesses of the phase change materials, with the highest temperature in the middle of the battery pack, and then decreasing to the surrounding area. With the increase of the filling thickness of the phase change material, the overall temperature of the battery pack also decreases; the maximum temperature decreases by 5.28 °C when the filling thickness is increased from 2 mm to 4 mm; the maximum temperature decreases by only 0.69 °C when the filling thickness is increased from 4 mm to 6 mm.
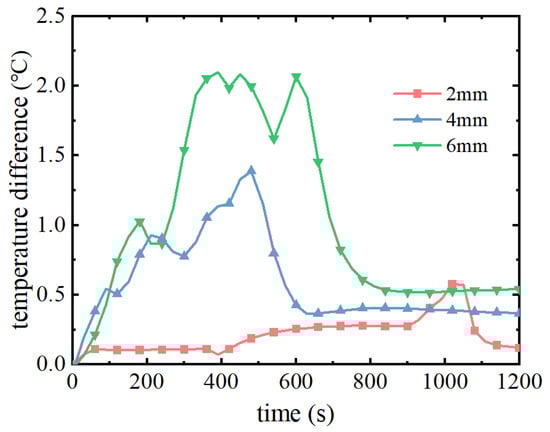
Figure 10.
Maximum temperature difference of battery pack with time for different PCM thicknesses.
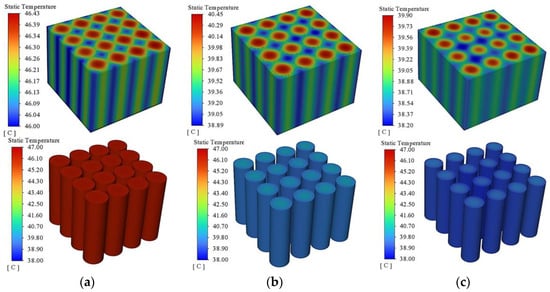
Figure 11.
Temperature distribution of battery pack with different PCM thickness. (a) 2 mm. (b) 4 mm. (c) 6 mm.
Figure 12 shows the liquid phase rate distribution of the phase change module at the end of the discharge, from which it can be seen that the liquid phase rate of the phase change module with a filling thickness of 2 mm is already all 1, indicating that at this time, the phase change material has been completely melted and cannot continue to use latent heat to absorb the heat of the battery pack and loses its cooling performance, which leads to a rapid increase in the temperature of the battery pack at the end of the discharge. When the thickness of the phase change material is 4 mm, only part of the phase change material around the battery is completely melted and the phase change material far away from the battery pack has not melted, and at this time, there is still a large amount of latent heat of phase change to continue to absorb the heat of the battery pack. When the thickness is 6 mm, the overall distribution of the liquid phase rate is more uniform, only a small amount of the phase change material is melting, and the phase change latent heat utilisation is low, although the subsequent thermal management performance is strong. However, if the phase change material filling amount is too high, it will lead to an increase in the overall mass of the battery pack and a decrease in energy density. Comprehensive research shows that in the actual battery module placement space, a phase change material filling thickness of 4 mm results in the better overall performance of thermal management.
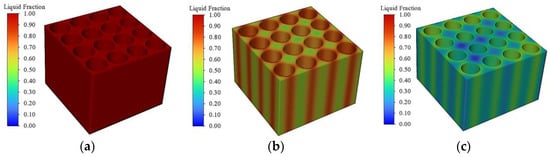
Figure 12.
PCM liquid volume fraction distribution. (a) 2 mm. (b) 4 mm. (c) 6 mm.
3.2. Thermal Conductivity Impact on Thermal Management Performance
The thermal conductivity of the phase change material determines the speed of heat diffusion from the battery pack to the surrounding area, which has a great influence on the phase change cooling performance. A single paraffin wax has a very low thermal conductivity, and the thermal conductivity of the phase change material can be improved by adding expanded graphite to the paraffin wax to prepare a composite phase change material, but the increase in the mass fraction of expanded graphite will also inevitably reduce the latent heat of the composite phase change material. Therefore, in order to investigate the effect of the thermal conductivity of composite phase change materials on the thermal performance and select the optimal range of thermal conductivity, six groups of composite phase change materials with thermal conductivities of 0.2 W/(m·K), 0.5 W/(m·K), 1 W/(m·K), 3 W/(m·K), 5 W/(m·K), and 10 W/(m·K) are selected in this paper for the simulation and calculation of phase change cooling performance. The evaluation and monitoring indexes of the thermal management performance are mainly the maximum temperature of the battery pack, the maximum temperature difference, and the average liquid phase rate of the phase change material, in which the liquid phase rate of the phase change material is mainly used to evaluate the subsequent thermal management performance.
Figure 13 shows the maximum temperature change of the battery pack under different thermal conductivities. From Figure 13a, it can be seen that before the discharge time of 500 s, the maximum temperature of the battery pack gradually increases with the discharge time: with the increase of thermal conductivity, the rate of increase of the maximum temperature decreases. When the discharge time is about 500 s, the maximum temperature of the battery pack reaches 42 °C and basically remains unchanged, indicating that the phase change material mainly relies on the phase change sensible heat to absorb part of the heat of the battery pack in the early stage to make the temperature of the battery rise slowly; when the phase change material reaches the melting point of the phase change, the phase change process absorbs all the heat of the battery pack, and the temperature of the battery pack stays unchanged. However, in the late stage of discharge, the degree of consumption of the latent heat of phase change is different, and the maximum temperature of the battery pack under different thermal conductivities changes more obviously. When the thermal conductivity is 0.2 W/(m·K), the maximum temperature of the battery pack increases slowly. This is due to the low thermal conductivity of the phase change material, resulting in the slow diffusion of heat generated by the battery pack; the heat is all gathered around the battery pack, so that the phase change material around the battery pack is in a state of complete melting and cannot continue to cool the battery. As the temperature of the battery pack continues to rise, the phase change material away from the battery pack is in an unmelted state, unable to play a cooling effect, resulting in the low utilisation of the phase change material. When the thermal conductivity is 1 W/(m·K) and above, the maximum temperature of the battery pack remains basically unchanged after reaching the melting point of the phase change, and the maximum temperature decreases slightly as the thermal conductivity increases. As shown in Figure 13b, when the thermal conductivity of the phase change material is increased from 0.2 W/(m·K) to 3 W/(m·K), the maximum temperature of the battery pack decreases by 2.8 °C, and when the thermal conductivity is increased from 3 W/(m·K) to 10 W/(m·K), the maximum temperature decreases by only 0.2 °C. Phase change materials with a high thermal conductivity can quickly diffuse heat generated by the battery pack to the surrounding area, thus effectively reducing the temperature of the battery pack. The higher thermal conductivity of the phase change material can quickly diffuse the heat generated by the battery pack to the surrounding area, thus effectively reducing the temperature of the battery pack and improving the cooling performance. However, too large a thermal conductivity has little effect on improving the performance of the thermal management system, and for composite phase change materials, increasing the thermal conductivity will inevitably lead to an increase in the cost of the material and a decrease in the latent heat of the phase change, so it is not necessary to increase the thermal conductivity to too high a level in the actual production of composite phase change materials.
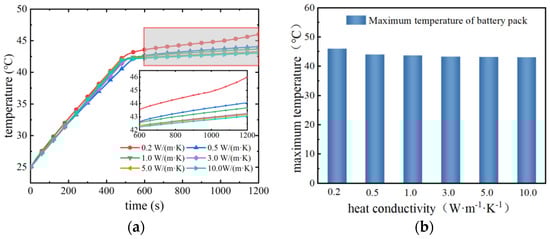
Figure 13.
Variation of maximum temperature of battery pack with different thermal conductivities. (a) Variation of maximum temperature with discharge time. (b) Maximum temperature with different thermal conductivities.
Figure 14 shows the liquid phase rate distribution of the phase change material at different thermal conductivities at the end of the discharge. From the figure, it can be seen that with the increase of thermal conductivity, the phase change material liquid phase rate distribution is more uniform. When the thermal conductivity is 0.2 W/(m·K), all the phase change materials around the battery pack have completed the phase change process, and the liquid phase rate is 1. The liquid phase rate of the phase change materials in the periphery can all be 0, and only the phase change materials around the battery play a role. This is due to the low thermal conductivity of the phase change material, which leads to the heat generated by the battery pack only being accumulated around the battery pack and not being transferred to the peripheral phase change material. The PCM around the battery pack quickly completes the phase change process, and the phase change material thermal management system fails. This is also the reason why the temperature of the battery pack rises significantly at the end of discharge when the thermal conductivity is 0.2 W/(m·K). Although the overall liquid phase ratio of the phase change material is only about 0.4, the low thermal conductivity of the phase change material prevents the remaining latent heat of phase change from being utilised. At a thermal conductivity of 10 W/(m·K), the melting degree of the phase change material is very uniformly distributed and the overall liquid phase rate is around 0.4, with all phase change materials in a semi-molten state, none of them completing the phase change process, and still having good thermal management performance. With the increase of thermal conductivity, the liquid phase rate of the phase change materials gradually increases, and the melting rate is gradually accelerated, so that the heat generated by the battery pack can be quickly transferred to the peripheral phase change materials to reduce the temperature of the battery pack. It can also be seen from the figure, in the thermal conductivity from 3 W/(m·K) to 10 W/(m·K), that the phase change module liquid phase rate distribution is uniform, at this time continues to increase the thermal conductivity of the battery pack, and the heat diffusion impact is small.
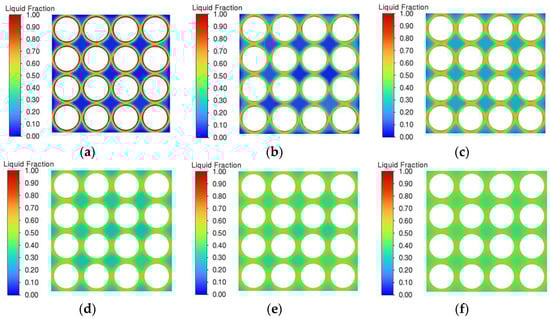
Figure 14.
Liquid phase ratio distribution with different thermal conductivities at the end of discharge. (a) 0.2 W/(m·K). (b) 0.5 W/(m·K). (c) 1 W/(m·K). (d) 3 W/(m·K).(e) 5 W/(m·K). (f) 10 W/(m·K).
The maximum temperature difference of the battery pack is also an important indicator for evaluating the cooling performance of the thermal management system, and the temperature difference is too large to make the performance difference between the battery monomers obvious, thus affecting the discharge performance of the whole battery pack. Figure 15 shows the maximum temperature difference of the battery pack under different thermal conductivities. As can be seen from the figure, in the pre-discharge period of the battery pack, the maximum temperature difference gradually increases with the increase of the discharge time, at which time the phase change material absorbs the heat of the battery pack using sensible heat. In the discharge time of 500 s or so, the maximum temperature difference is suddenly decreased; at this time, it is the phase change material that reaches the melting point and starts the phase change process. The phase change material quickly absorbs the heat generated by the battery so as to improve the temperature uniformity of the battery pack. When the thermal conductivity of the phase change material is too low, the heat of the battery pack cannot be exported quickly and the maximum temperature difference of the battery pack increases. As the thermal conductivity of the phase change material increases from 0.2 W/(m·K) to 10 W/(m·K), the maximum temperature difference of the battery pack decreases from 2.1 °C to 0.5 °C. The temperature difference of the phase change material decreases from 2.1 °C to 0.5 °C and the thermal conductivity of the phase change material increases from 0.2 W/(m·K) to 10 W/(m·K).
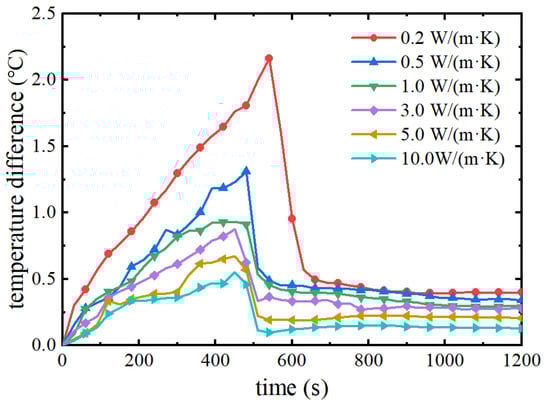
Figure 15.
Maximum temperature difference of battery pack with different thermal conductivities.
Figure 16 shows the temperature distribution of the phase change material cooling module, and it can be seen that when the thermal conductivity is 0.2 W/(m·K), the heat generated by the battery pack cannot be absorbed by the peripheral phase change material due to the thermal conductivity being too low, and the temperature difference between the temperature of the battery pack and the external phase change material reaches 5 °C. The lower the thermal conductivity of the phase change material, the slower the heat transfer between the battery and the phase change material and inside the phase change material, which leads to the accumulation of heat in the battery pack and more uneven temperature distribution. As the thermal conductivity increases, the temperature difference between the battery pack and the phase change material decreases. At a thermal conductivity of 3.0 W/(m·K), the temperature difference between the battery pack and the phase change material decreases to 0.5 °C, at which time the heat from the battery pack can be quickly transferred to the phase change material, giving rise to thermal management performance.
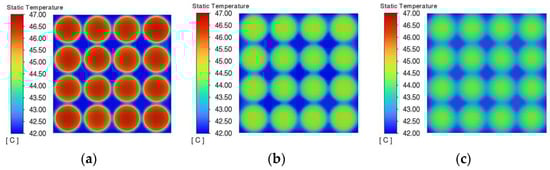
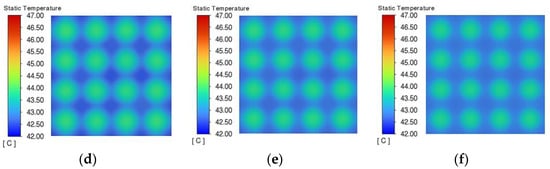
Figure 16.
Temperature distribution at the end of discharge with different thermal conductivities. (a) 0.2 W/(m·K). (b) 0.5 W/(m·K). (c) 1 W/(m·K). (d) 3 W/(m·K). (e) 5 W/(m·K). (f) 10 W/(m·K).
Through the above study, it can be seen that the thermal conductivity of the phase change material in the range of 0.2~10 W/(m·K) can control the maximum temperature difference of the battery pack within 2.5 °C, and the cooling of the phase change material has a significant advantage in improving the temperature uniformity of the battery pack. However, too low a thermal conductivity will limit the thermal management performance of phase change materials, and too high a thermal conductivity is not very effective in improving thermal management performance. Therefore, considering the cooling performance of phase change materials, a composite phase change material with a thermal conductivity of about 3.0 W/(m·K) is selected as the best thermal management system.
3.3. Effect of Phase Change Melting Point on Thermal Management Performance
The melting point of composite phase change materials is an important parameter in determining the thermal management performance. In order to investigate the effect of the melting point of phase change materials on the thermal management performance, a group of composite phase change materials with different melting points were designed by selecting different grades of paraffin waxes for the simulation study. The thermal conductivity of this group of composite phase change materials was set to 3.0 W/(m·K) and the melting points were 32 °C, 34 °C, 36 °C, 38 °C, 40 °C, 42 °C, and 44 °C.
The melting point of the phase change material determines the time at which the phase change cooling takes effect and the maximum temperature of the battery pack: the lower the melting point of the phase change material, the earlier the phase change begins to occur. Figure 17 shows the variation curve of the maximum temperature of the battery pack with the discharge time under different melting points. As shown in the figure, with the increase of discharge time, the maximum temperature of the battery pack increases continuously, and when the maximum temperature reaches the melting point of the phase change, the temperature of the battery pack stays near the melting point to maintain the same. The higher the phase change melting point, the longer it takes for the phase change process to begin, and the corresponding maximum battery temperature increases. At an ambient temperature of 25 °C, the melting point of the phase change material increases from 32 °C to 44 °C and the maximum temperature of the battery pack increases from 31.7 °C to 43.3 °C. Therefore, the lower the melting point of the phase change material, the lower the maximum temperature of the battery pack, and the maximum temperature remains essentially near the melting point of the phase change.
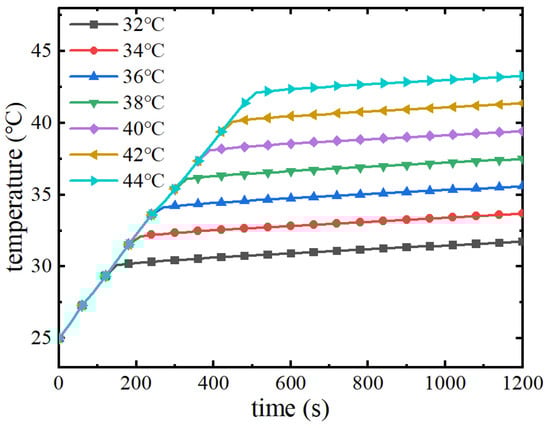
Figure 17.
Maximum battery pack temperature at different melting points.
Figure 18 demonstrates the variation curves of the maximum temperature difference of the battery pack with discharge time at different melting points. As can be seen from the figure, with the increase of discharge time, the maximum temperature difference of battery packs under different phase change melting points firstly increases gradually at the same rate. Then, the temperature difference of the battery packs that first reach the phase change melting point decreases rapidly and basically remains unchanged, and the maximum temperature difference of the battery packs that have not reached the phase change melting point is still increasing. Therefore, the phase change materials with low melting points start the phase change process earlier, which will reduce the maximum temperature difference of the battery pack and improve the temperature uniformity of the battery pack. When the melting point of the phase change material is increased from 32 °C to 44 °C, the start of the phase change process is delayed by 200 s, and the maximum temperature difference of the battery pack increases from 0.39 °C to 1.15 °C. The thermal management system requires that the maximum temperature difference of the battery pack should not be more than 5 °C, and in the melting point ranges of the phase change materials studied above, the cooling of the phase change materials shows good temperature uniformity.
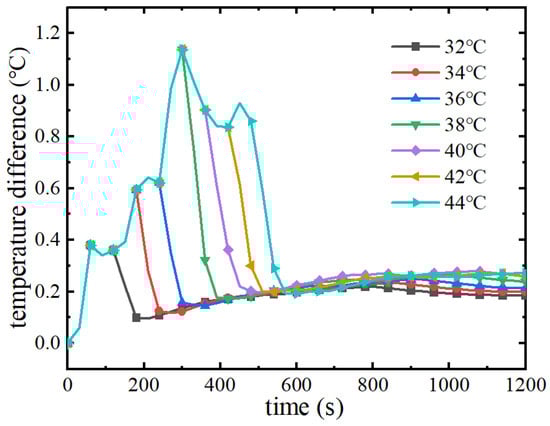
Figure 18.
Maximum temperature difference of battery packs at different melting points.
The melting point of phase change materials can significantly affect the maximum temperature of the battery pack. With the increase of the melting point of phase change materials, the maximum temperature of the battery pack increases, so the melting point of the phase change materials should not be higher than 45 °C. However, it is not true that the lower the melting point of the phase change materials, the better the performance of the phase change cooling, as when the melting point is too low, it will lead to the complete melting of the phase change materials prematurely and the loss of the thermal management performance in the late stage of the discharge of the battery pack. The lower limit of the melting point of the phase change material is also subject to the ambient temperature; in order to verify the thermal management performance of the phase change material in a high temperature environment, this simulation study selects a high temperature environment of 38 °C to explore the influence of different melting points on the thermal management performance.
As can be seen from Figure 19, when the ambient temperature is 38 °C, phase change materials with melting points of 38 °C and below have lost their thermal management performance, and the maximum temperature of the battery pack continues to rise with a consistent upward trend, with the maximum temperature at the end of the discharge reaching 72.5 °C. Phase change materials with melting points higher than 38 °C continue to utilise the latent heat of the phase change to play a role in thermal management performance after the temperature rises to the melting point of the phase change in the early stage of discharge, and the maximum temperature remains at the melting point of the phase change. The maximum temperature remains near the melting point. Figure 20 shows the liquid phase rate change curve of the phase change module, from which it can be seen that the liquid phase rate of phase change materials with a melting point of 38 °C and below has already reached 1 before the battery pack begins to discharge, indicating that at this time, due to the ambient temperature being higher than the melting point of the phase change, the phase change material has already completely melted and cannot absorb the heat of the battery pack, and also verifies the trend of the maximum temperature of the battery pack. When the melting point is 40 °C~44 °C, the liquid phase rate of the phase change material increases after reaching the melting point of the phase change. The higher the melting point of the phase change, the later the phase change starts, and the lower the liquid phase rate at the end of the discharge. Therefore, in a high temperature environment, when the ambient temperature exceeds the phase change melting point, the phase change material will be in a completely melted state and completely lose its thermal management performance. In summary, the melting point of phase change materials should not only consider the demand of battery pack temperature control but also need to be higher than the ambient temperature in order to give full play to the thermal management performance of the phase change material. So, when the melting point of the phase change material is higher than the ambient temperature of 40 °C, the thermal management performance is better.
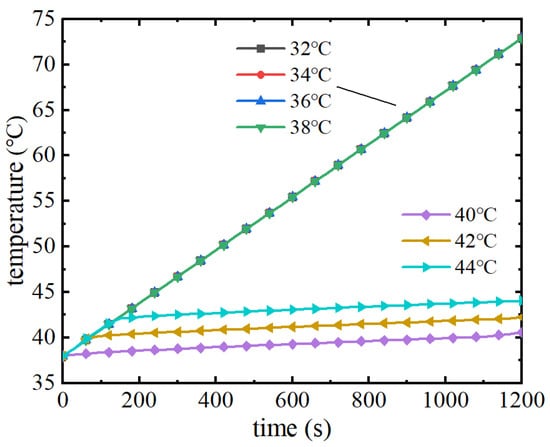
Figure 19.
Maximum temperature variation curve of battery pack under high temperature environment.
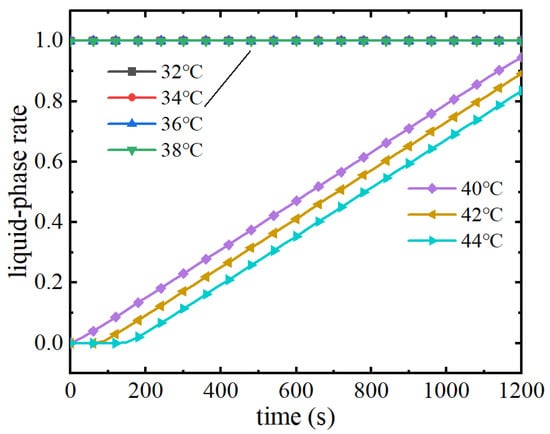
Figure 20.
Liquid phase rate change curve of phase change module under high temperature.
3.4. Influence of Latent Heat of Phase Change on Thermal Management Performance
The latent heat of the phase change material is the key to absorb the heat from the battery pack and keep the temperature constant after it reaches the melting point of the phase change, and the size of the latent heat also determines the amount of heat that can be absorbed. In order to investigate the influence of the latent heat of phase change on the performance of thermal management, a set of composite phase change materials with different latent heats of phase change were set up, with latent heat values of 150 J/g, 170 J/g, 190 J/g, 210 J/g, 230 J/g, and 250 J/g, thermal conductivity of 3.0 W/(m·K), and a melting point of 40 °C. The maximum temperature of the battery pack in the process of discharging was monitored, as were the temperature differences and the liquid phase rates of the phase change module.
As can be seen from Figure 21, in the pre-discharge period of the battery pack, the trend of the maximum temperature rise is consistent because the phase change materials in this group have the same thermal conductivity and melting point. When the phase change melting point is reached, the phase change material uses latent heat to continue to absorb the heat of the battery pack, and at this time there is a difference in the maximum temperature change of the battery pack. When the latent heat of phase change increases from 150 J/g to 250 J/g, the maximum temperature of the battery pack decreases by 0.5 °C. The higher the latent heat of phase change, the longer the time to maintain the temperature of the battery pack near the melting point of the phase change, which improves the cooling performance of the phase change material. Figure 22 shows the variation of the maximum temperature difference of the battery pack. As can be seen from the figure, phase change materials with different latent heats of phase change in the pre-discharge period are basically the same in terms of their performance in improving the temperature uniformity of the battery pack. When the phase transition process starts, the maximum temperature difference of the battery pack decreases rapidly. The maximum temperature difference is 1.18 °C at the moment before the phase change occurs, and after the phase change starts, the maximum temperature difference of the battery pack decreases rapidly to about 0.3 °C, and then remains in a lower range. The thermal management performance of phase change materials with different latent heats of phase change is basically the same for the maximum temperature and maximum temperature difference of the battery pack.
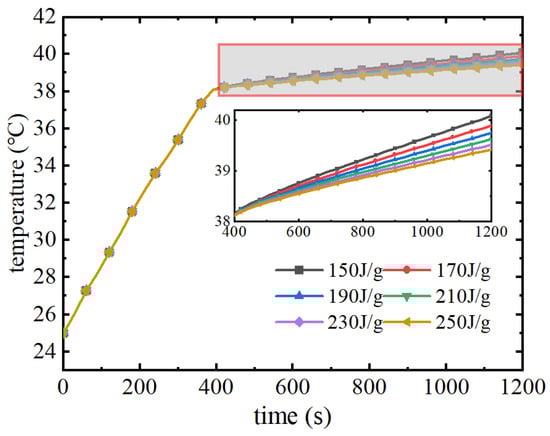
Figure 21.
Maximum temperature with different latent heats of phase transition.
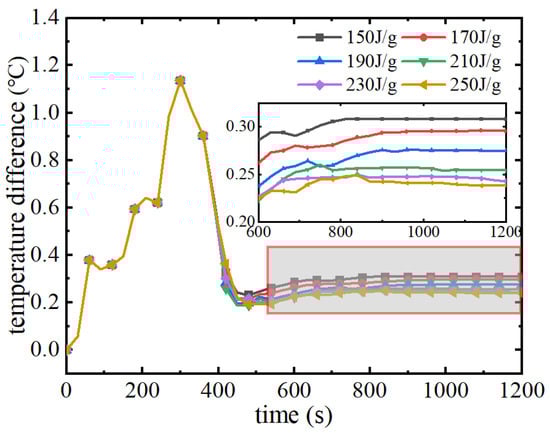
Figure 22.
Maximum temperature difference with different latent heats of phase transition.
Figure 23 shows the liquid phase rate changes of phase change material modules with different phase change latent heats during the discharge process. From the figure, it can be seen that phase change materials with different phase change latent heats reach the phase change melting point at the same time around 400 s, and thereafter the liquid phase rate of the phase change module increases continuously. The higher the phase transition latent heat, the more the phase change material absorbs the heat of the battery pack, and the growth rate of the liquid phase rate decreases. At the end of the discharge moment, when the phase change latent heat increases from 150 J/g to 250 J/g, the liquid phase rate decreases from 0.84 to 0.51, at which time the subsequent cooling performance of the thermal management system greatly increases. Figure 24 demonstrates the cloud diagram of the liquid phase rate of the phase change material at the end moment of discharge under different phase change latent heats. It can be seen that with the increase of the phase change latent heat, the liquid phase rate of the phase change material decreases continuously, and the distribution is more uniform. When the phase change latent heat is lower at 150 J/g, the liquid phase rate of the phase change module is basically 1, indicating that at this time, most of the phase change module is in a completely melted state and the phase change latent heat is basically exhausted. At this time, the phase change material can no longer continue to absorb the heat of the battery pack to play a thermal management role. If the battery pack continues to be discharged, the maximum temperature will rise rapidly, which will easily lead to the risk of thermal runaway. As the latent heat of phase change continues to increase, the subsequent thermal management performance of the phase change material will also increase. When the latent heat of phase transition is 210 J/g, the liquid phase rate of the phase change material is basically at a low level and the liquid phase rate is further reduced by continuing to increase the latent heat of phase transition. In the expanded graphite–paraffin composite phase change material, the mass fraction of expanded graphite and paraffin determines the thermal conductivity and the latent heat of phase change. So, the latent heat of phase change should be increased as much as possible to improve the subsequent thermal management performance under the circumstance of ensuring that the thermal conductivity of the phase change material meets the requirements.
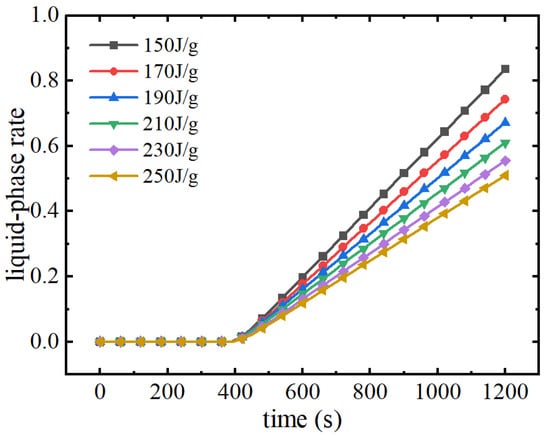
Figure 23.
Variation of liquid phase rate in phase change module with different latent heats of phase change.
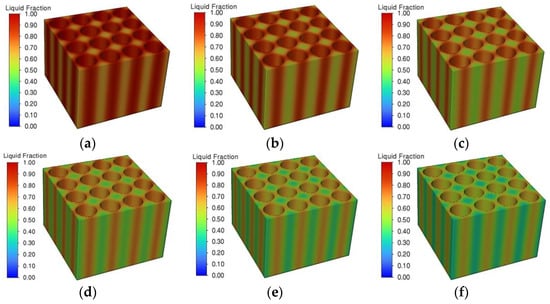
Figure 24.
Liquid phase rate distribution of phase change materials. (a) 150 J/g. (b) 170 J/g. (c) 190 J/g. (d) 210 J/g. (e) 230 J/g. (f) 250 J/g.
4. Conclusions
In this study, the cooling performance of phase change materials and the influence of thermophysical parameters of composite phase change materials on thermal management performance are investigated by experimental and simulation methods, and the main conclusions are as follows: The cooling of phase change materials can maintain the maximum temperature of the battery pack within 41.4 °C and the maximum temperature difference within 1.6 °C under the 3C discharge multiplier condition. The filling thickness, thermal conductivity, melting point, and latent heat of phase change of the composite phase change material have a great influence on the thermal management performance. If the composite phase change material filling thickness is too low, it will lead to too little heat absorption by the phase change material and insufficient thermal management performance; if the filling thickness is too large, it will lead to a reduction of the energy density of the battery pack and the waste of the latent heat of phase change. When the filling thicknesses are 2 mm, 4 mm, and 6 mm, the maximum temperatures of the battery pack are 46.26 °C, 40.98 °C, and 40.67 °C, respectively, of which 46.26 °C exceeds the optimal working temperature of the battery pack. The thermal conductivity of the phase change material determines the speed of heat dissipation from the battery, and low thermal conductivity will lead to the accumulation of heat inside the battery, exceeding the safe temperature range. When the thermal conductivity is increased from 0.2 W/(m·K) to 3.0 W/(m·K), the maximum temperature of the battery pack is reduced by 2.8 °C, and the maximum difference in temperature is reduced by 1.6 °C, but continuing to increase the thermal conductivity does not improve the thermal management performance much. The phase change melting point determines the maximum temperature of the battery after the phase change reaction occurs, while the phase change melting point needs to be chosen higher than the ambient temperature in order to avoid phase change cooling failure. The latent heat of phase change determines the subsequent thermal management performance of the phase change material—the higher the latent heat of phase change, the stronger the subsequent thermal management performance.
Author Contributions
Conceptualisation, Y.D. and X.M.; methodology, C.W.; software, Y.X.; validation, Y.D. and C.W.; formal analysis, C.W.; investigation, Y.X.; resources, X.M.; data curation, Y.D.; writing—original draft preparation, Y.D.; writing—review and editing, Y.D.; visualisation, C.W.; supervision, X.M.; project administration, X.M.; funding acquisition, X.M. All authors have read and agreed to the published version of the manuscript.
Funding
This research received no external funding.
Data Availability Statement
The original contributions presented in the study are included in the article, further inquiries can be directed to the corresponding author.
Conflicts of Interest
The authors declare no conflicts of interest.
References
- Khan, M.M.; Alkhedher, M.; Ramadan, M.; Ghazal, M. Hybrid PCM-based thermal management for lithium-ion batteries: Trends and challenges. J. Energy Storage 2023, 73, 108775. [Google Scholar] [CrossRef]
- Khan, F.M.N.U.; Rasul, M.G.; Sayem, A.S.M.; Mandal, N.K. Design and optimization of lithium-ion battery as an efficient energy storage device for electric vehicles: A comprehensive review. J. Energy Storage 2023, 71, 108033. [Google Scholar] [CrossRef]
- Kumar, R.; Goel, V. A study on thermal management system of lithium-ion batteries for electrical vehicles: A critical review. J. Energy Storage 2023, 71, 108025. [Google Scholar] [CrossRef]
- Bruchhausen, M.; Hildebrand, S.; Kriston, A.; Ruiz, V.; Podias, A.; Pfrang, A. Evaluation of detection criteria for thermal runaway experiments on commercial cells for electric vehicles. Energy Rep. 2023, 10, 510–519. [Google Scholar] [CrossRef]
- Jeon, C.H.; Lee, Y.; Kim, R.; Kim, S.; Kim, D.K. Development of equivalent circuit model for thermal runaway in lithium-ion batteries. J. Energy Storage 2023, 74, 109318. [Google Scholar] [CrossRef]
- Xu, C.; Fan, Z.; Zhang, M.; Wang, P.; Wang, H.; Jin, C.; Peng, Y.; Jiang, F.; Feng, X.; Ouyang, M. A comparative study of the venting gas of lithium-ion batteries during thermal runaway triggered by various methods. Cell Rep. Phys. Sci. 2023, 4, 101705. [Google Scholar] [CrossRef]
- Bamdezh, M.A.; Molaeimanesh, G.R. Impact of system structure on the performance of a hybrid thermal management system for a Li-ion battery module. J. Power Sources 2020, 457, 227993. [Google Scholar] [CrossRef]
- Kermani, M.; Houshfar, E.; Ashjaee, M. A novel hybrid thermal management for Li-ion batteries using phase change materials embedded in copper foams combined with forced-air convection. Int. J. Therm. Sci. 2019, 141, 47–61. [Google Scholar] [CrossRef]
- Behi, H.; Karimi, D.; Gandoman, F.H.; Akbarzadeh, M.; Khaleghi, S.; Kalogiannis, T.; Hosen, M.S.; Jaguemont, J.; Van, M.J.; Berecibar, M. PCM assisted heat pipe cooling system for the thermal management of an LTO cell for high-current profiles. Case Stud. Therm. Eng. 2021, 25, 100920. [Google Scholar] [CrossRef]
- Zhao, J.; Lv, P.; Rao, Z. Experimental study on the thermal management performance of phase change material coupled with heat pipe for cylindrical power battery pack. Exp. Therm. Fluid Sci. 2017, 82, 182–188. [Google Scholar] [CrossRef]
- Abbas, S.; Ramadan, Z.; Park, C.W. Thermal performance analysis of compact-type simulative battery module with paraffin as phase-change material and flat plate heat pipe. Int. J. Heat Mass Transf. 2021, 173, 121269. [Google Scholar] [CrossRef]
- Mousavi, S.; Siavashi, M.; Zadehkabir, A. A new design for hybrid cooling of Li-ion battery pack utilizing PCM and mini channel cold plates. Appl. Therm. Eng. 2021, 197, 117398. [Google Scholar] [CrossRef]
- Akbarzadeh, M.; Jaguemont, J.; Kalogiannis, T.; Karimi, D.; He, J.; Jin, L.; Xie, P.; Van, M.J.; Berecibar, M. A novel liquid cooling plate concept for thermal management of lithium-ion batteries in electric vehicles. Energy Convers. Manag. 2021, 231, 113862. [Google Scholar] [CrossRef]
- Bais, A.R.; Subhedar, D.G.; Panchal, S. Critical thickness of nano-enhanced RT-42 paraffin based battery thermal management system for electric vehicles: A numerical study. J. Energy Storage 2022, 52, 104757. [Google Scholar] [CrossRef]
- Lee, S.; Han, U.; Lee, H. Development of a hybrid battery thermal management system coupled with phase change material under fast charging conditions. Energy Convers. Manag. 2022, 268, 116015. [Google Scholar] [CrossRef]
- Wang, S.; Zhang, D.; Li, C.; Wang, J.; Zhang, J.; Cheng, Y.; Mei, W.; Cheng, S.; Qin, P.; Duan, Q.; et al. Numerical optimization for a phase change material based lithium-ion battery thermal management system. Appl. Therm. Eng. 2023, 222, 119839. [Google Scholar] [CrossRef]
- Xin, Q.; Yang, T.; Zhang, H.; Yang, J.; Zeng, J.; Xiao, J. Experimental and numerical study of lithium-ion battery thermal management system using composite phase change material and liquid cooling. J. Energy Storage 2023, 71, 108003. [Google Scholar] [CrossRef]
- Malik, M.; Dincer, I.; Rosen, M.; Fowler, M. Experimental Investigation of a New Passive Thermal Management System for a Li-Ion Battery Pack Using Phase Change Composite Material. Electrochim. Acta 2017, 257, 345–355. [Google Scholar] [CrossRef]
- Hussain, A.; Tso, C.Y.; Chao, C.Y.H. Experimental investigation of a passive thermal management system for high-powered lithium ion batteries using nickel foam-paraffin composite. Energy 2016, 115, 209–218. [Google Scholar] [CrossRef]
- Li, Y.; Chen, Z.; Feng, Y.; Liu, M.; Kang, C.; Yang, K.; Yuan, J.; Qiu, C.; Shi, H.; Jiang, Y. A novel petal-type battery thermal management system with dual phase change materials. Int. J. Heat Mass Transf. 2023, 207, 123989. [Google Scholar] [CrossRef]
- Du, W.; Chen, S. Effect of mechanical vibration on phase change material based thermal management module of a lithium-ion battery at high ambient temperature. J. Energy Storage 2023, 59, 106465. [Google Scholar] [CrossRef]
Disclaimer/Publisher’s Note: The statements, opinions and data contained in all publications are solely those of the individual author(s) and contributor(s) and not of MDPI and/or the editor(s). MDPI and/or the editor(s) disclaim responsibility for any injury to people or property resulting from any ideas, methods, instructions or products referred to in the content. |
© 2024 by the authors. Licensee MDPI, Basel, Switzerland. This article is an open access article distributed under the terms and conditions of the Creative Commons Attribution (CC BY) license (https://creativecommons.org/licenses/by/4.0/).