Abstract
In this paper, we propose a vehicle pedestrian detection and tracking method based on the improved YOLOv7 and DeepSort algorithms. We aim to improve the quality of vehicle pedestrian detection and tracking, addressing the challenges that current commercially available autonomous driving technologies face in complex and changing road traffic situations. First, the NMS (non-maximum suppression) algorithm in YOLOv7 is replaced with a modified Soft-NMS algorithm to ensure that targets can be accurately detected at high densities, and second, the CCBA (coordinate channel attention module) attention mechanism is incorporated to improve the feature extraction and perception capabilities of the network. Finally, a multi-scale feature network is introduced to extract features of small targets more accurately. Finally, the MobileNetV3 lightweight module is introduced into the feature extraction network of DeepSort, which not only reduces the number of model parameters and network complexity, but also improves the tracking performance of the target. The experimental results show that the improved YOLOv7 algorithm improves the average detection accuracy by 3.77% compared to that of the original algorithm; on the MOT20 dataset, the refined DeepSort model achieves a 1.6% increase in MOTA and a 1.9% improvement in MOTP; in addition, the model volume is one-eighth of the original algorithm. In summary, our model is able to achieve the desired real-time and accuracy, which is more suitable for autonomous driving.
1. Introduction
In recent years, we have found that with the increasing application of intelligent and unmanned driving in real life, the technology for vehicle pedestrian detection and tracking has rapidly advanced [1]. However, it is difficult for current vehicle pedestrian detection and tracking technology to take into account the practical needs of automatic driving in terms of detection, classification, and real-time tracking when faced with a variety of extreme complexities, such as dim lighting, misaligned shooting angles, and the occlusion of unknown objects. Vehicle pedestrian detection, as a basic task in computer vision, is of high practical value in driving autonomous vehicles and presents a technical challenge that must be solved to realize unmanned driving and traffic management. At present, target detection algorithms are mainly categorized into two types: traditional target detection algorithms and target detection algorithms based on deep learning.
- Traditional target detection algorithms, prior to the rise of deep learning techniques, relied heavily on hand-designed feature extraction methods and classical machine learning classifiers for target detection. The core of these methods lies in extracting features from images that contribute to target recognition, such as edges, textures, colors, and shapes. Sitaula C et al. [2] proposed a novel multi-scale deep visual bag-of-words (MBoDVW) feature extraction method, which extracts and fuses multi-scale deep features by applying different sizes of convolution kernels (one × one, two × two, and three × three) on the feature maps outputted from the fourth pooling layer of the VGG-16 model. Then, L2 normalization and k-means based clustering algorithms are utilized to generate more unique feature representations, which in turn are used to achieve accurate image classification using SVM (Support Vector Machine) classifiers. This method not only enhances the model’s ability to generalize CXR images at different resolutions but also significantly improves its diagnostic accuracy for COVID-19 and other similar diseases (such as pneumonia). Bilal et al. [3] proposed an improved SVM training method using a multi-round bootstrapping process that selects the most relevant negative samples for training instead of using a large number of random samples, thus improving the distinction ability of the model. A nonlinear quantization scheme is also proposed to speed up the evaluation of the kernel SVM while further reducing the false detection rate without increasing the computational cost. The improved model significantly improves the accuracy and efficiency of the pedestrian detector even with real-time processing constraints and limited embedded system capabilities.
- Deep-learning-based target detection algorithms, such as YOLO, Faster R-CNN, SSD, etc., employ convolutional neural networks for end-to-end feature extraction and detection, in which features of interest are learned automatically by the training and differentiable updating of the network layers. This allows deep learning target detection algorithms to be more robust to factors such as the shape, size, and attitude of the target, as well as to use more general and flexible features to improve detection performance. Zhai S et al. [4] designed a feature extraction network called DenseNet-S-32-1, which references the dense connectivity of DenseNet, replacing the original VGG-16 backbone network of the SSD. In addition, unlike most approaches that use pre-trained models, the DF-SSD model is trained from scratch, which avoids limitations on the design of the network structure. With these innovative points, DF-SSD improves the accuracy of target detection and reduces the number of model parameters. Masita K L et al. [5] proposed a pedestrian detection method based on deep learning techniques using R-CNN as a detector combined with AlexNet as a feature extraction model. The innovation of their method is the use of migration learning to fine-tune the AlexNet model to a specific pedestrian detection dataset and the Edge Boxes algorithm to extract key regions in the image to improve the accuracy of the detection.
However, the above methods cannot effectively solve the problems of detection errors and missed detections when vehicles and pedestrians are obstructed or overlapping on the road. They are also difficult to adapt to scale changes of traveling vehicle targets. As well as the large number of model parameters leads to poor real-time performance and cannot cope with the changing environment. For example, YOLOv5 fails to detect small-sized pedestrians at long distances or with a low image resolution; SSDs are computationally intensive in realizing multi-scale detection, which makes it difficult to achieve real-time detection on resource-constrained devices; SORT is unable to maintain tracking continuity when dealing with occlusions and is unable to re-assign the correct ID to the same pedestrian once the pedestrian has been occluded; and the MOTDT (Multi-Object Tracking with Deep Learning and Tracklet Confidence) and Tracktor algorithms are more dependent on the performance of the detector. In order to address the above challenges and solve the problems of target occlusion, overlapping, errors, and omissions for detection in high-density environments, we replace the NMS algorithm and incorporate the CCBA attention mechanism in YOLOv7, and we introduce a multi-scale feature network to more accurately extract the features of small targets. Then, the detection results of the improved YOLOv7 model are used as inputs to DeepSort, and the MobileNetV3 lightweight module [6] is introduced to DeepSort, which not only ensures the model tracking performance but also reduces the number of parameters. Our experiments show that our model can achieve the desired real-time detection and accuracy. The contributions of this study are summarized as follows:
- (1)
- A modified Soft-NMS algorithm, CCBA attention mechanism, and multi-scale feature network are used to optimize the YOLOv7 algorithm to enhance the feature extraction and perception capability of the network and to solve the problem of the omission and misidentification of pedestrians by vehicles for small targets or within high-density environments.
- (2)
- Introducing the MobileNetV3 lightweight module in the feature extraction network of DeepSort, the performance of the algorithm is further improved while reducing the number of model parameters and network complexity.
- (3)
- Based on the optimized YOLOv7 algorithm with DeepSort, the accurate detection and tracking of vehicles and pedestrians on the road are achieved, providing technical support for the realization of automatic driving.
2. Materials and Methods
2.1. Overview of YOLOv7
In response to the inefficiency of two-stage target detection algorithms, Redmon et al. [7] proposed a single-stage target detector, YOLO, in 2016. The YOLO architecture consists of 24 convolutional layers and 2 FC layers, using the top-level feature map to predict bounding boxes and directly evaluate the probability of each category. Subsequently, YOLOv3 and YOLOv5 [8] were developed. YOLOv7 [9], which we utilize herein, is currently one of the more practical versions available.
YOLOv7 is a high-performance real-time target detection model that includes a series of important modules, which are combined to achieve fast and accurate detection of targets. The following is a detailed introduction to each module in YOLOv7.
Backbone: YOLOv7 uses an improved backbone network, typically a convolutional neural network, to extract features from input images. The selection of backbone networks has a significant impact on the performance and speed of the model. YOLOv7 adopts some advanced backbone networks, such as CSPDarknet53 [10] and CSPResNeXt50 [11], to improve the performance of the model.
Neck: The neck structure is used to further process feature maps from the backbone network to extract higher-level semantic information for object detection. The neck structure in YOLOv7 typically includes additional convolutional layers, pooling layers, or attention mechanisms to enhance the abstraction and expressive power of features.
Head: The head structure is the most important part of the target detection model, responsible for target detection and position prediction of feature maps. The head structure in YOLOv7 adopts specific convolutional layers, activation functions, and loss functions to achieve prediction of target boxes and combines some techniques to handle multi-scale and multi-class object detection. The formulas for the CIoU loss function used are shown in Equations (1) and (2).
where IoU denotes the intersection and merger ratio between the prediction frame and the real frame, and denote the center points of the prediction frame and GT, respectively, is the Euclidean distance between the two center points, is the diagonal distance between the encompassing regions of the real frame and the prediction frame, α is a weight parameter, v is a parameter that measures the consistency of the aspect ratio, and denote the width and height of the real frame, respectively, and w and h denote the width and height of the prediction frame, respectively.
Self-Adversarial Training: Firstly, based on the original training data, the adversarial samples are generated by specific algorithms; then, the model receives both normal samples and adversarial samples during the training process, forcing the model to learn more robust feature representations to distinguish between the normal samples and adversarial samples. Finally, the robustness of the model in practical applications is improved. YOLOv7 introduces the technique of self-adversarial training, which can effectively improve the performance of the model.
Data Augmentation: First, according to the task requirements and data characteristics, choose the appropriate data augmentation methods. Common methods include image rotation, scaling, cropping, flipping, color adjustment, etc.; then, during the training process, these augmentation methods are applied to each sample of the original dataset to generate new data samples. In this way, the model can learn the features of the target under different transformation conditions, enhance its adaptability to new data, reduce over-fitting to specific training data, and ultimately improve the model’s generalization performance on unknown data.
Overall, these modules work together to achieve fast and accurate object detection. Through the combination and optimization of these modules, YOLOv7 has achieved high level of performance and represents an important technological breakthrough and innovation in the field of object detection.
2.2. DeepSort
The Sort algorithm is one of the classical algorithms in target tracking, which is mainly based on Kalman filtering for tracking, in which the detected object is used as a new trajectory, which is then matched by IoU. If the distance is less than a certain threshold, the detection is considered as a new frame of the predicted object and its state is updated, and if it is greater, it is considered as a new object and added to the new frame [12].
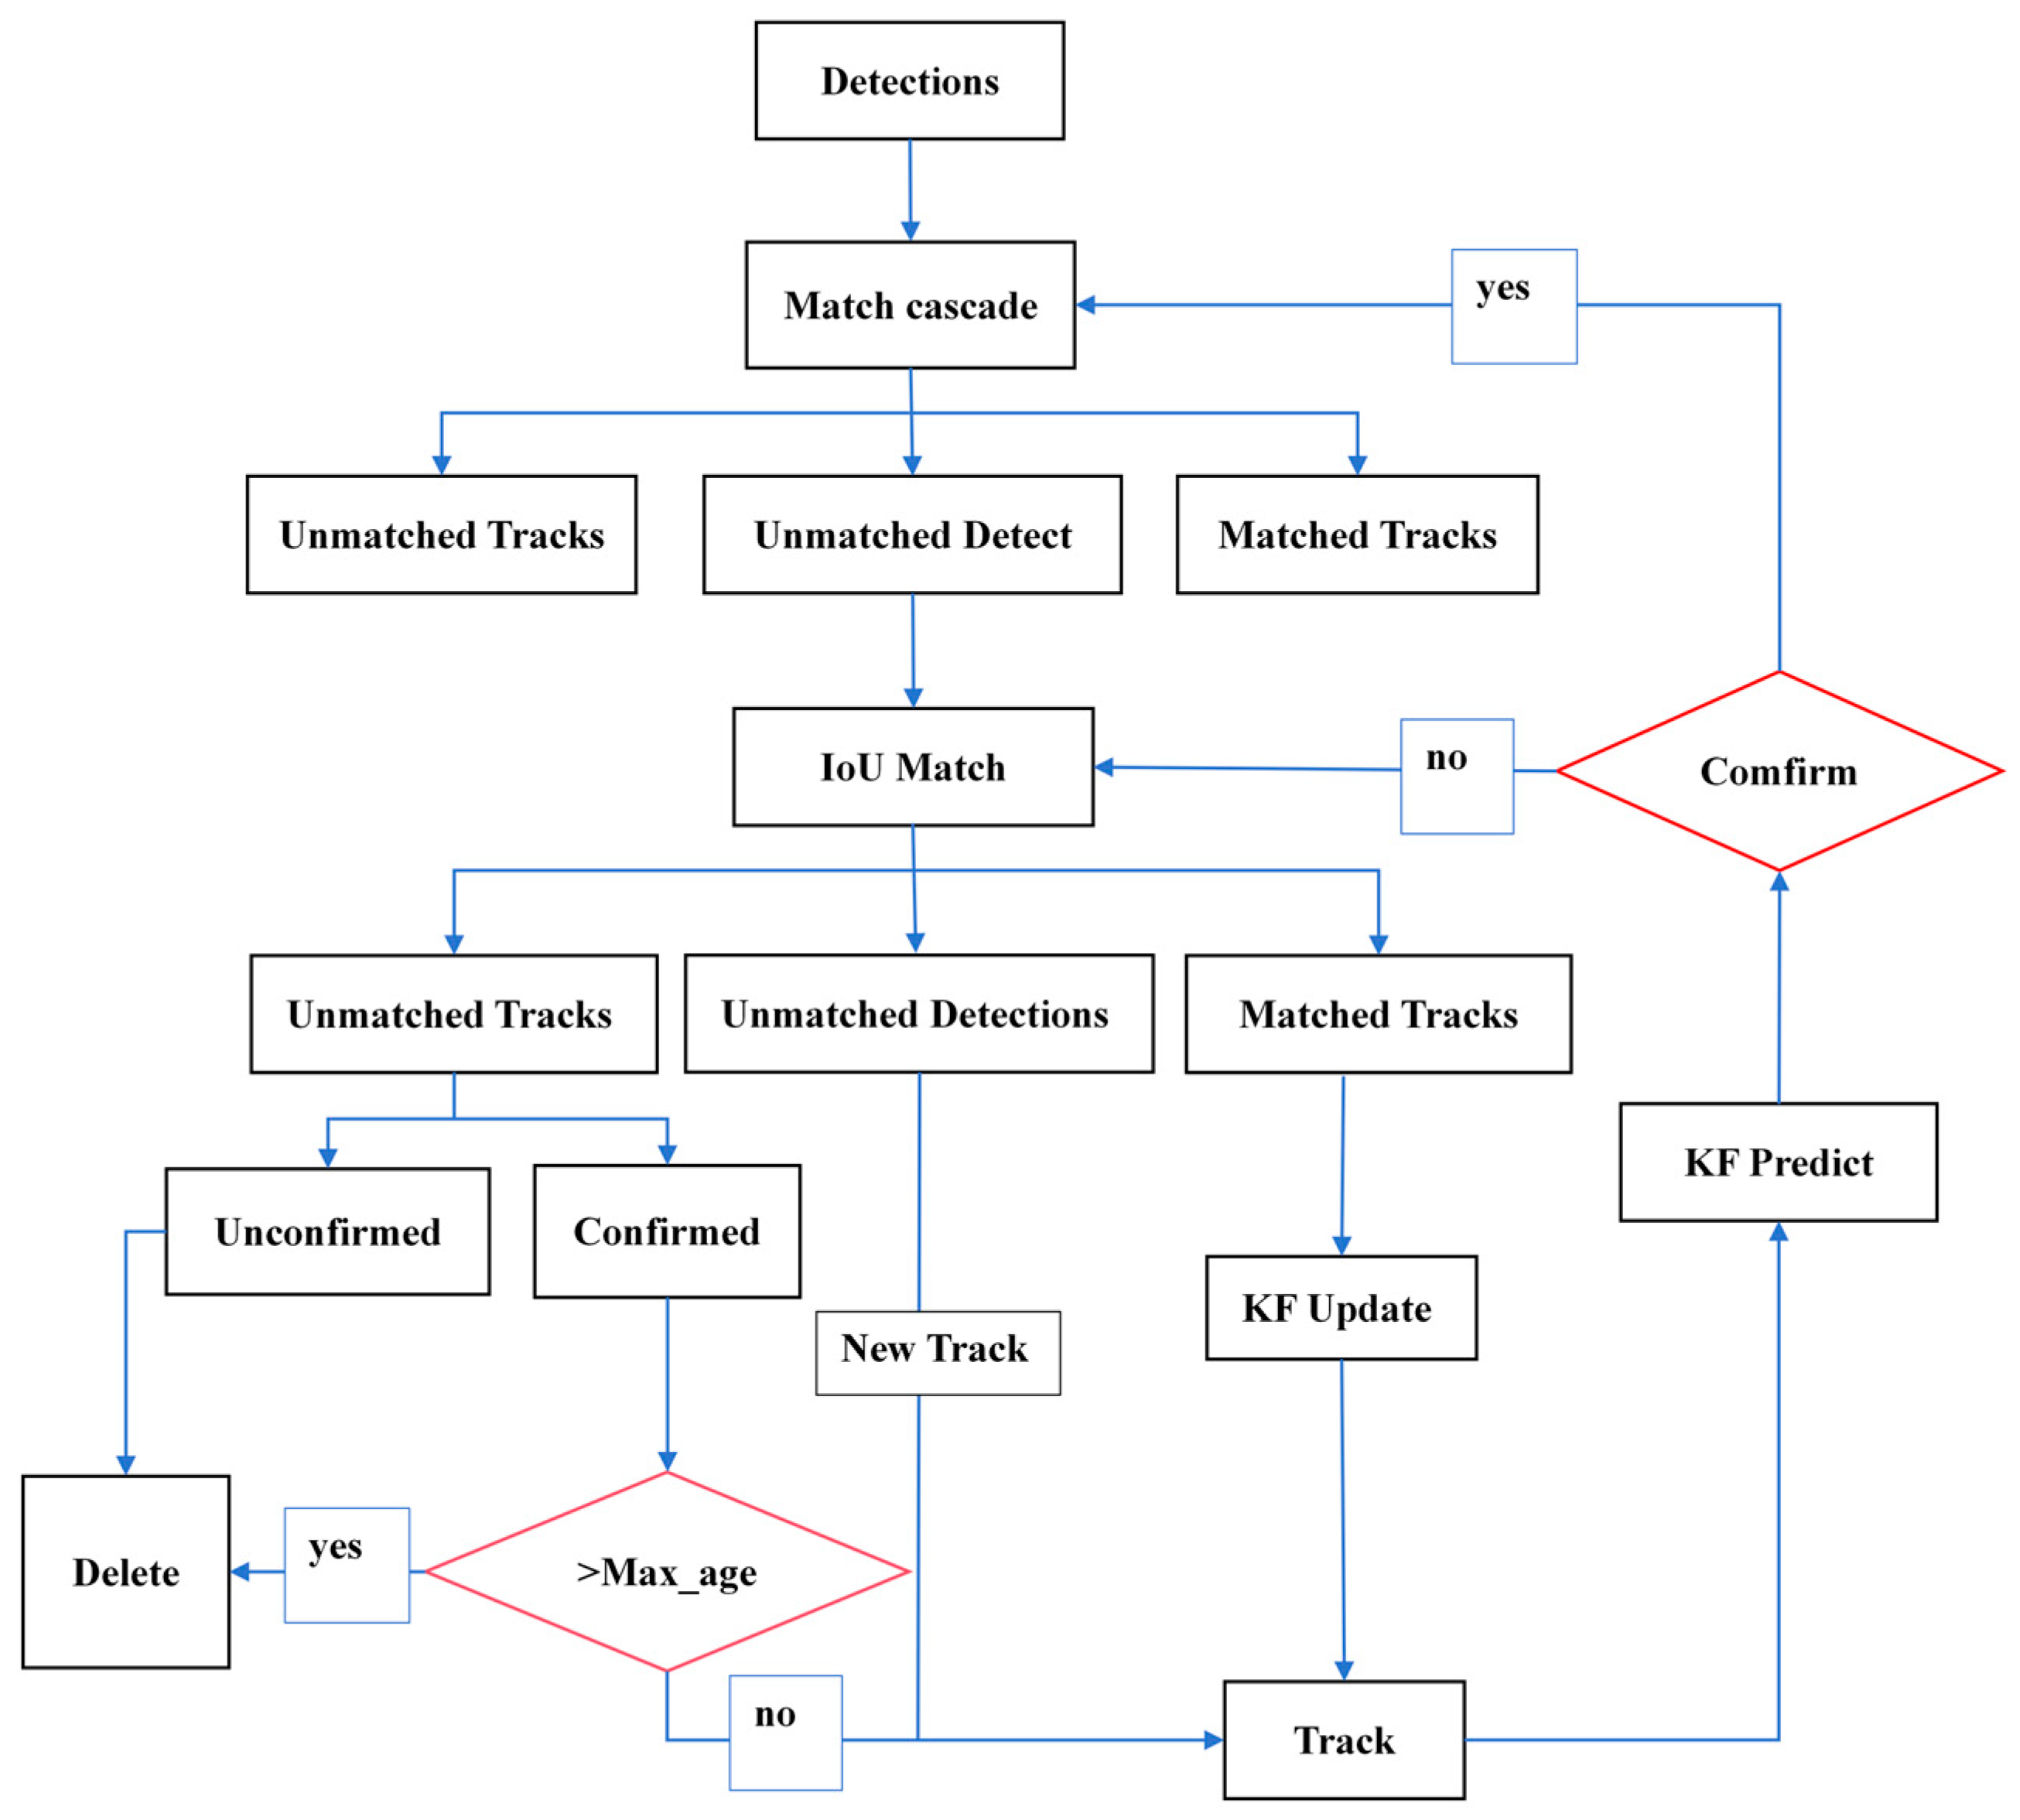
The DeepSort algorithm adds recognition and feature extraction to Sort. So, DeepSort can connect the previously tracked target with the new detection in the next frame one by one [13]. Algorithm 1 outlines our DeepSort algorithm. The DeepSort algorithm process is shown in Figure 1.
| Algorithm 1 DeepSort |
| Input: Frame sequence F = {F_1, F_2, ..., F_n} with detected bounding boxes B = {B_1, B_2, ..., B_m} |
| Output: Tracked objects T = {T_1, T_2, ..., T_o} with IDs |
| 1. for frame Є F do 2. Detect objects and obtain bounding boxes B |
| 3. Extract features X_i = {x_i1, x_i2, ..., x_in} for each B_ij using CNN |
4. Predict the next state S’ for each existing track T_k using Kalman filter 5. end for 6. for each detected bounding box B_ij in B_i do 7. Calculate the cosine distance d_ij between the feature x_ij and each track feature X_k 8. if d_ij ≤ θ_max then 9. Associate B_ij with the track T_k that has the minimum d_ij 10. end if 11. end for 12. for each unassociated B_ij do 13. Create a new track T_new with the bounding box B_ij and feature x_ij 14. end for 15. Apply non-max suppression to remove overlapping tracks 16. Assign new IDs to unmatched tracks 17. return the list of tracks T with their corresponding IDs |
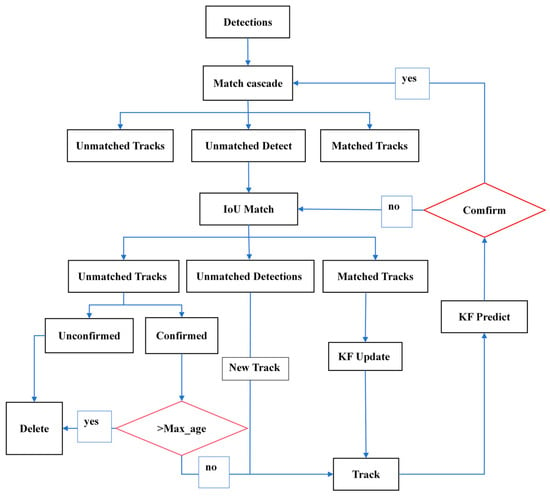
Figure 1.
Flowchart of the DeepSort algorithm.
The detailed working process and flowchart of DeepSort are shown below:
- Detection: Like Sort, first use an object detection algorithm (such as YOLOv7) to detect the target objects in the video frame and obtain the position information and feature vectors of each target object.
- Feature extraction: Use deep learning models to extract feature vectors for each target and store them in a feature vector library.
- Matching: In object detection, we use cosine similarity to measure the similarity between the newly detected bounding box and each previously tracked target and use cascaded matching algorithms for automatic matching to increase robustness.
- Filtering and updating: For target objects for which a match is found, Kalman filtering is used to adjust their state, and the smoothness of their routes is controlled using the Hungarian algorithm. For target objects that are not matched, they are considered as new target objects and added to the trajectory list.
- Clearing: Regularly clear invalid tracks and expired target objects.
3. Our Algorithm
Our algorithm implementation includes three parts: road video image input, vehicle pedestrian target detection, and vehicle pedestrian target tracking. The specific implementation steps are as follows:
- (1)
- Road Video Image Input: Road video images are first acquired as raw data for subsequent processing. This can be achieved by installing high-resolution cameras at strategic locations along the road or at intersections. The video stream is then transferred to a processing unit whereupon it is converted into a series of individual frames for further analysis.
- (2)
- Vehicle and Pedestrian Object Detection: In this phase, pre-processed frames from road videos are fed into the improved YOLOv7 model. The model combines optimized Soft-NMS, CCBA attention mechanism, and multi-scale feature fusion and is designed to accurately detect and identify vehicles and pedestrians in the scene, even under challenging conditions, such as dim lighting or high-density traffic. The output of this phase consists of a bounding box around the detected objects, as well as their respective category labels (detection categories are categorized as cars, buses, trucks, motorcycles, pedestrians, and bicycles) and confidence scores.
- (3)
- Vehicle and Pedestrian Target Tracking: The detection results are then passed to the lightweight DeepSort model, which recognizes the spatial information provided by the bounding box, taking into account the temporal information across frames, and tracks the movement of vehicles and pedestrians. The model assigns unique identifiers to each detected object and maintains their trajectories over time to provide a comprehensive view of the motion patterns.
3.1. Improvement of YOLOv7 Algorithm
3.1.1. Modification of NMS Algorithm
YOLOv7 uses the NMS algorithm by default. The core of the NMS algorithm is to iterate through the process of constantly selecting the box with the largest existing score to perform the IoU calculation with other boxes, and filtering out the boxes that are larger than their IoUs in order to filter out the best detection results [14].
However, the main problem with the NMS algorithm is that when the IoU between the detection frames exceeds a specific threshold, the confidence of all overlapping detection frames except the one with the highest confidence is set to zero, a practice that may result in different parts of the same object being incorrectly suppressed, which increases the risk of missed detections and reduces the accuracy of the detection. Setting the threshold for NMS is also a challenge; too low a threshold may suppress excessive valid detections, while too high a threshold may increase false detections [15].
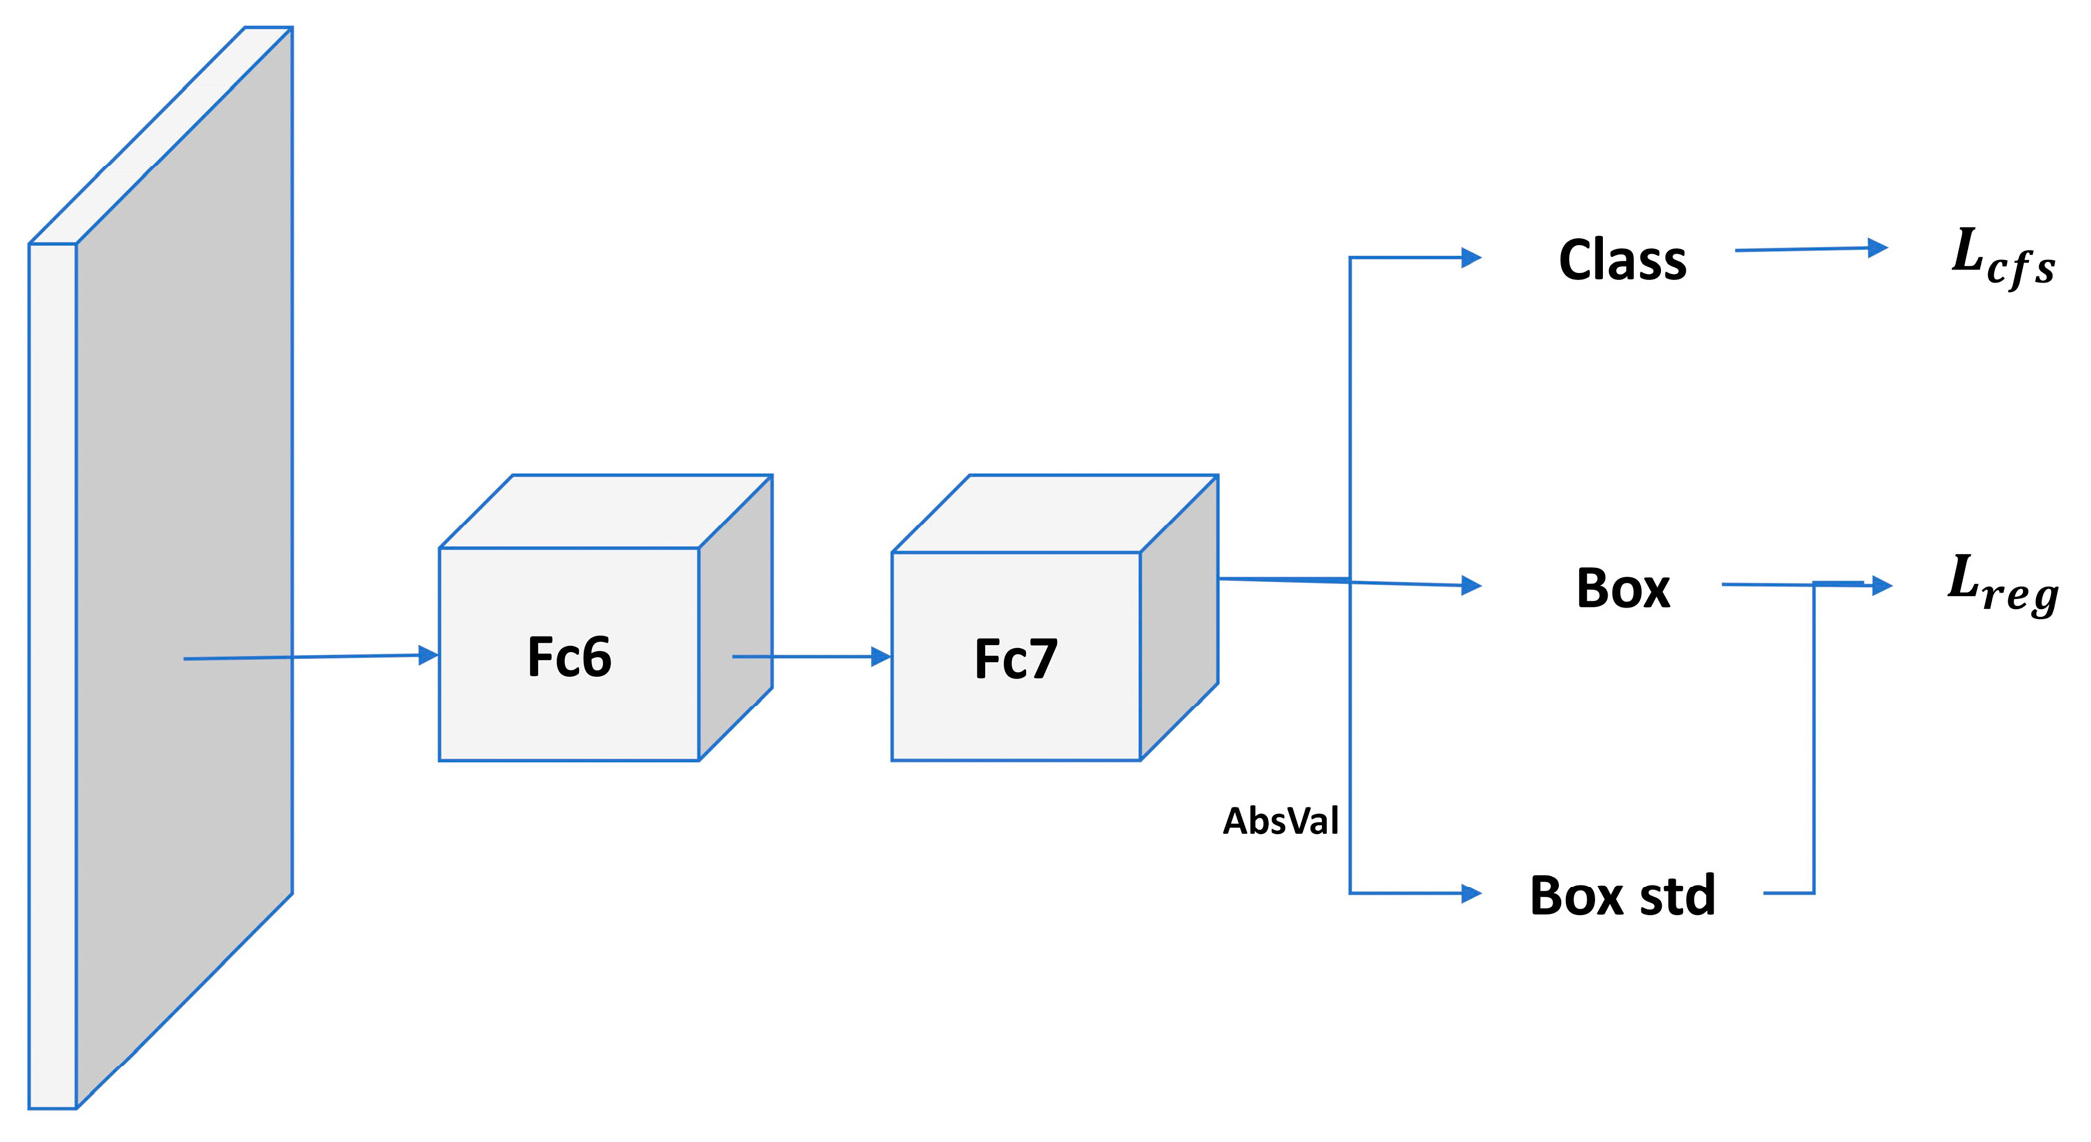
Therefore, we adopt Soft-NMS [16] to improve the performance of the algorithm. The Soft-NMS algorithm learns from the NMS algorithm, which does not simply remove the detection frames with IoUs greater than the threshold, as NMS does, but reduces their confidence scores. The specific network structure of the algorithm is shown in Figure 2, and the calculation formula is shown in Equation (3).
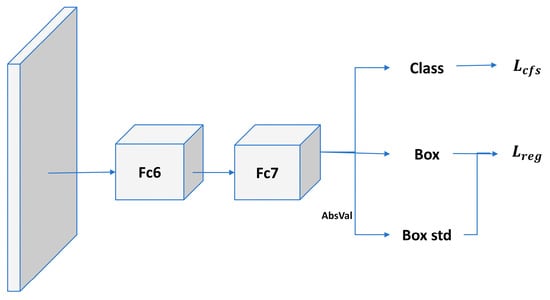
Figure 2.
Soft-NMS network diagram.
Among them, represents the score of each box, M is the box with the highest score currently, is one of the remaining boxes, and is the set threshold.
The core idea of Soft-NMS is to smoothly reduce the confidence score by an exponential decay formula, which retains a certain level of confidence in the detection frames that overlap with the target object, reduces false suppression, and improves the precision and recall of detection. However, using an exponential decay formula to adjust the confidence score may lead to a sharp decrease in the score at high IoU values, and this sharp decrease may over-suppress detection frames that actually still have high confidence levels, resulting in the loss of useful detection information. Instead of exponential decay, we use a linear decay formula to make the decrease in the score smoother and more controllable. This approach reduces the excessive suppression of the score at high IoU values and allows more overlapping detection frames to be retained with reduced scores, which retains more detection information and helps to improve the accuracy of the detection. The linear decay equation is shown in Equation (4) as follows:
is the original confidence score, is the intersection and concurrency ratio between the detection frame and the highest confidence detection frame , and γ is a hyperparameter between 0 and 1 to control the intensity of the attenuation. γ = 0 implies that there is no attenuation, whereas γ = 1 implies that there is complete attenuation.
The improved Soft-NMS is well positioned to strike a balance between precision and recall in object detection tasks, ensuring a more comprehensive and accurate rendering of the scene, which is critical for applications such as autonomous driving and intelligent video surveillance.
3.1.2. Improving Attention Mechanisms
Attention models are widely used in neural network structures and play an important role in the field of artificial intelligence, which, similar to human visual attention, can change the way resources are allocated based on the importance of the target [17].
We propose an attention module, CCBA, that combines the advantages of the CBAM [18] attention mechanism and the CA attention mechanism. CBAM is a powerful attention module that dynamically learns to weigh the importance of different locations (spatial or channel) in a feature graph, and it consists of two separate pathways: a channel attention pathway and a spatial attention pathway. The channel attention pathway identifies and highlights the most informative channels, while the spatial attention pathway focuses on the most relevant regions in the feature map. On the other hand, CA is designed to capture the spatial relationships between different coordinates in the feature map, which it achieves by learning spatial attention maps that emphasize the spatial context and relationships, which are particularly useful for understanding the relative positions and distances between objects. The channel attention of CBAM helps the network to focus on the most informative features, while the coordinate attention of CA ensures that the spatial relationships between these features are considered.
The feature maps inputted for this work are first subjected to global max pooling (GMP) and global average pooling (GAP) to aggregate the spatial information of the feature maps. Then, a bottleneck structure composed of two fully connected layers is used to model the correlation between channels. Finally, the weights of each channel are generated through a Sigmoid nonlinear activation function, which can effectively reduce dimensionality. However, two rounds of global max pooling will result in the loss of the spatial information of the object, leading to a decrease in accuracy. Based on the above analysis, we perform global average pooling on the input feature maps in the width and height directions, respectively, to obtain feature maps in the width and height directions. Then, we use 1 × 1 convolution to adjust the number of channels after taking Sigmoid to obtain the attention in width and height dimensions. The improved convolutional attention structure is shown in Figure 3.
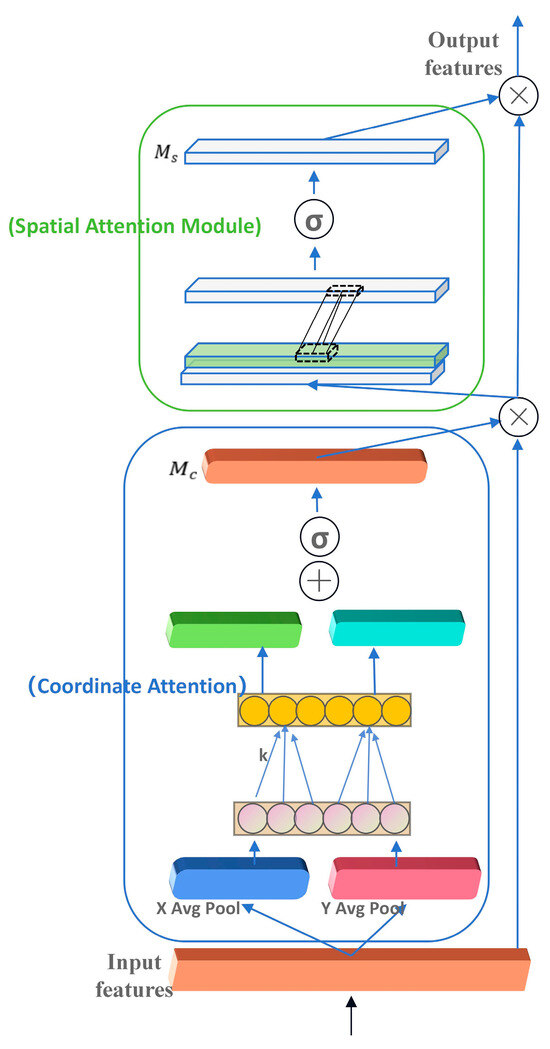
Figure 3.
Structure diagram of attention mechanism.
Firstly, for , we perform global average pooling on the input feature maps in both width and height directions, denoted as and ; then, we perform 1-dimensional convolution operations separately, with a kernel size of , denoted as ; finally, we use the Sigmoid function to output the final channel attention feature map, denoted as . The expression is as shown in Equation (5).
The feature map , obtained by multiplying the feature map output from the CA module with the original feature map , is inputted into the spatial attention module, and the channel information is compressed using two pooling operations to obtain two feature maps with the dimensions of H × W × 1, after which the obtained two dimensional feature maps are spliced together in the channel dimension. Then, it is reduced to a single channel by passing through a convolutional layer using a 7 × 7 convolutional kernel to generate the spatial attention feature . The calculation formula is as shown in Equation (6).
The CCBA module is a novel approach to attention that leverages the complementary strengths of CBAM and CA to provide a more comprehensive understanding of the input data, which is critical for accurate detection and tracking of vehicles and pedestrians. The CCBA attention mechanism functions by identifying and emphasizing key feature regions in the image and enhancing the model’s perception of these features, which significantly improves the accuracy and robustness of vehicle pedestrian classification, as well as helps to achieve efficient feature processing and decision making in resource-constrained environments.
3.1.3. Introduction of Multi-Scale Feature Network
The YOLOv7 algorithm uses a fixed-size standard deviation to calculate the size of the detection frame and derives the mean value by an adaptive method. However, this method ignores scale variations, resulting in error-prone estimations of vehicle or pedestrian targets. In order to improve the accuracy of vehicle target detection, we introduce a multi-scale feature network technique to deal with images of different scales, which solves the problem of target jitter that occurs during the detection process by employing various scaling and cropping strategies [19].
During the detection process, for images in which a large-scale target is being detected, the image can be appropriately reduced to avoid overlapping multiple detection boxes; for images in which a small-scale target is being detected, moderate cropping is performed to reduce the influence of background noise or invalid regions [20]. By incorporating scale adaptation techniques, our algorithm can dynamically adjust to the specific characteristics of each image and the objects within it. This is achieved by applying different scaling factors and cropping strategies to the input image, which allows the detection network to focus on the relevant features and contexts specific to the object’s scale.
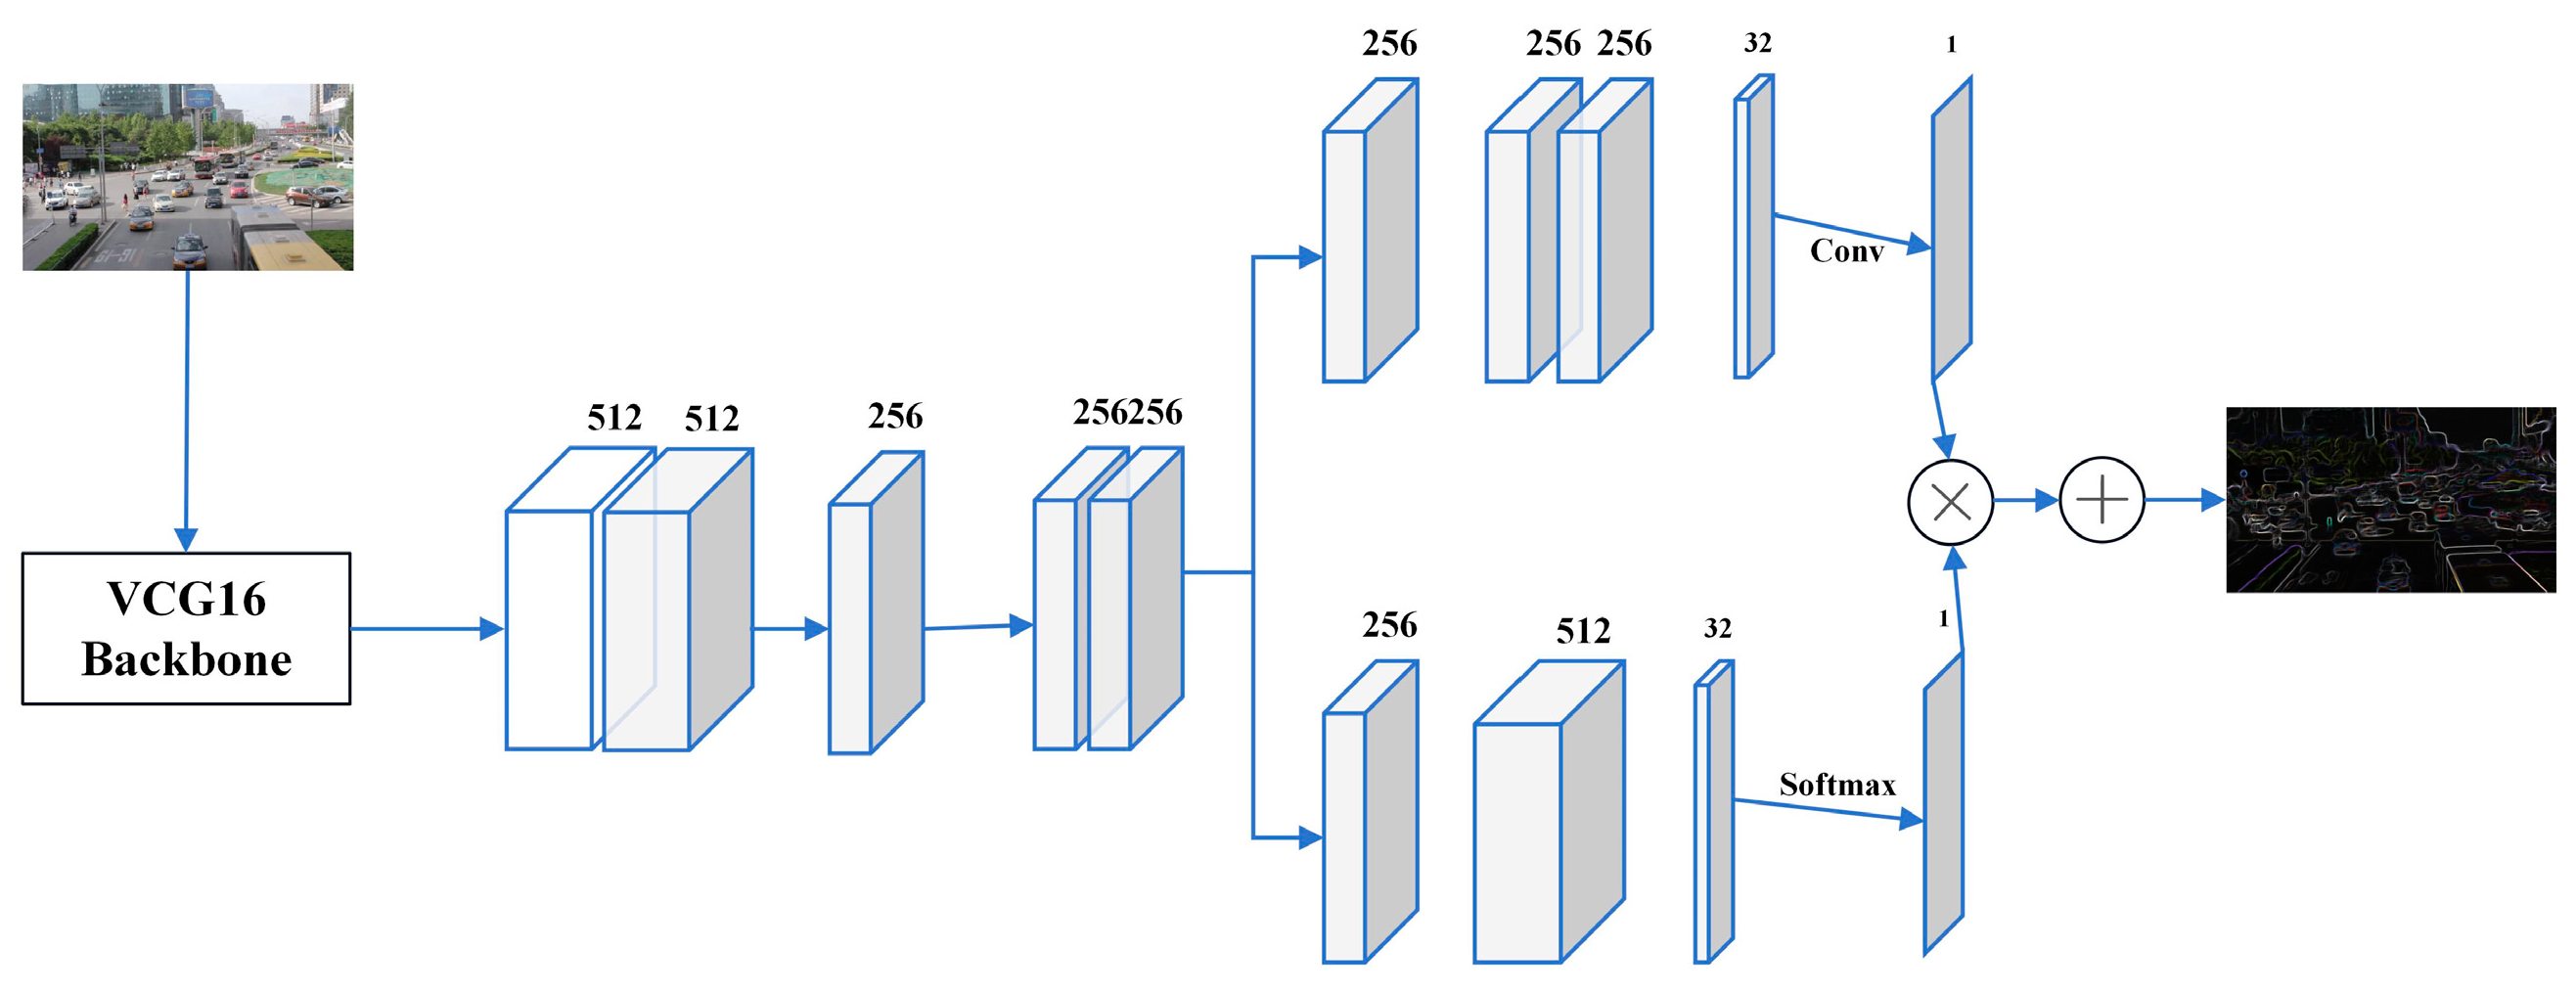
The structure of the multi-scale feature network in this paper is shown in Figure 4. Firstly, the VGG16 network is used to extract features from the picture; then, based on the idea of multi-column convolutional neural network, multi-scale features are extracted with multiple convolutional kernels, respectively; and finally, the feature maps obtained from the convolutional neural network of the feature attention module are evaluated, scored, and optimized by the Softmax layer to generate high-quality density maps [21].
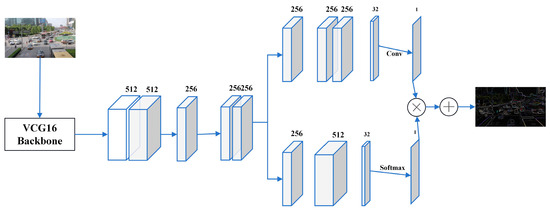
Figure 4.
Multi-scale feature network structure diagram.
By addressing the limitations of fixed-size standard deviation methods and integrating multi-scale feature network techniques into our YOLOv7 algorithm, the detection of vehicle and pedestrian targets is greatly improved. This approach ensures that our detection models remain accurate and reliable across a wide range of scales and scenarios, providing a solid foundation for applications such as autonomous driving and traffic monitoring systems.
Finally, after the optimization of the above three methods, the network structure of our YOLOv7 algorithm is shown in Figure 5.
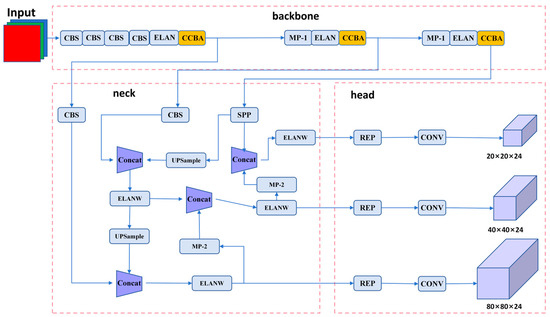
Figure 5.
Improved YOLOv7 workflow diagram.
3.2. DeepSort Algorithm Improvement
We improve the feature training network of DeepSORT and introduce the lightweight network MobileNetV3 to retrain the feature extraction model. In order to further improve the tracking speed and accuracy of the target tracking model, a new target tracking model, DeepSORT-MNV3, is constructed.
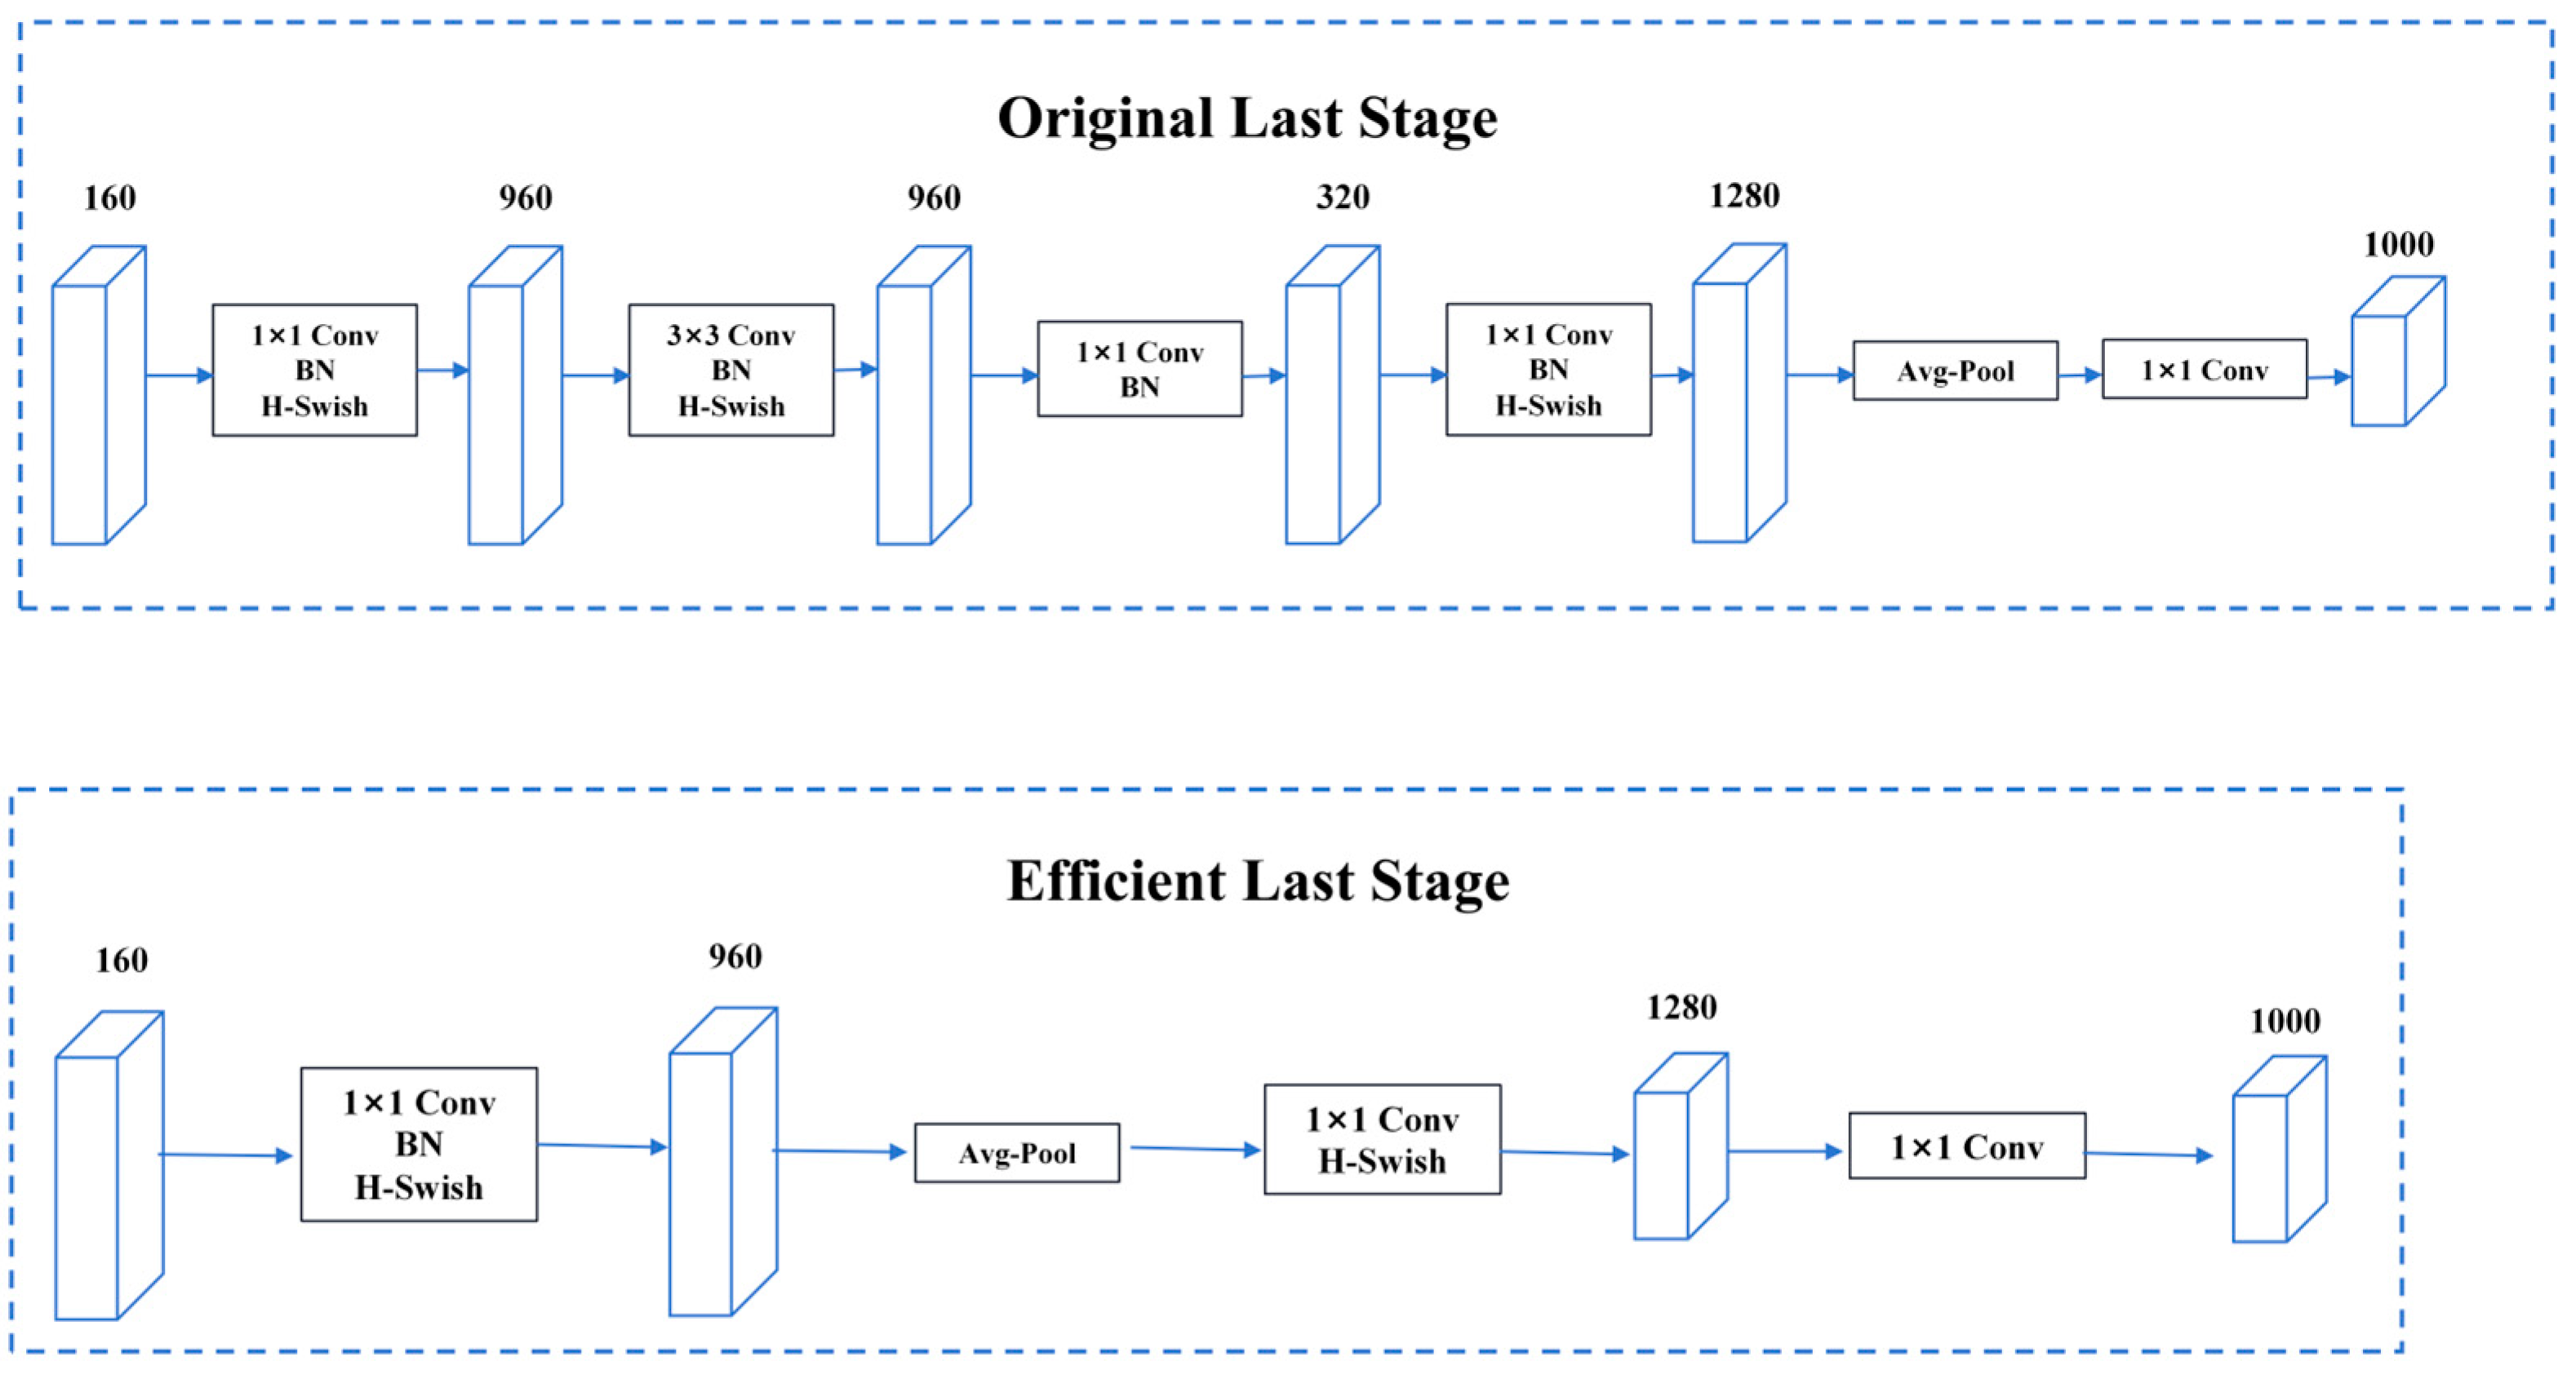
MobileNetV3 is a lightweight convolutional neural network designed to achieve efficient image classification and target detection tasks on mobile devices with limited computational resources. The backbone network of MobileNetV3 utilizes a design known as the “inverted residual structure”. This structure increases the receptive field by adding a dilated convolutional layer before a depth-separable convolutional layer to improve feature extraction. In addition, the inverted residual structure introduces a linear bottleneck layer to reduce the dimensionality of the feature map, thus reducing the computational effort [22]. The network structure is shown in Figure 6.
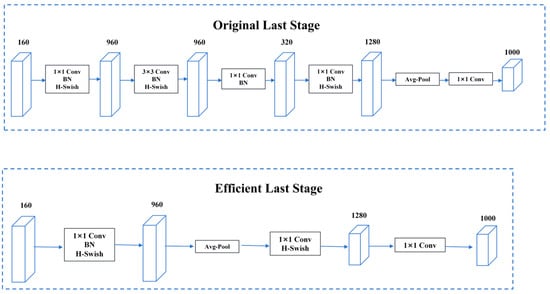
Figure 6.
MobileNetV3 network diagram.
Compared with other lightweight networks, MobileNetV3 introduces an adaptive-width polynomial activation function that automatically adjusts the width of the activation function according to the distribution of input features. The function is shown in Equation (7) as follows:
In this case, 3 is added to the input x by shifting the value field to the right to transform otherwise negative values into positive values, avoiding the ReLU6 function by setting some values directly to 0 at the output. The ReLU6 function is then used to ensure that the result is constrained to be in the range of 0 to 6. Finally, the output of ReLU6 is divided by 6 and multiplied by the original input x to ensure that the output of the h_swish function is consistent in scale with the original input. This activation function improves the nonlinear representation of the model and further improves its accuracy.
In the process of integrating MobileNetV3 with DeepSORT, the most important thing is to make sure that its output feature vectors are compatible with DeepSORT’s matchers. The last fully connected layer of MobileNetV3 was originally used for image categorization tasks, which output category probabilities, so it needs to be replaced with a fully connected layer that outputs a fixed-dimension feature vector for target re-identification (Re-ID).
The innovation of the DeepSORT-MNV3 network is its use of a depthwise separable convolution and a minimalistic residual module as the underlying architecture. These design choices significantly reduce the number of parameters in the model and increase its computational efficiency without decreasing its computational accuracy. Deep separable convolution decomposes the standard convolution operation into two steps: deep convolution and point-by-point convolution, reducing the computational effort and the number of parameters. The module for minimizing residuals, on the other hand, introduces a well-designed residual linking pattern, which effectively improves the information transfer efficiency.
4. Experiment
4.1. Experimental Environment
The specific details of the experimental environment are presented in Table 1.

Table 1.
Experimental environment.
4.2. Dataset Analysis
The datasets used in the experiments are vehicle detection dataset KITTI [23], UA_DETRAC, and pedestrian detection dataset Caltech Pedestrian Dataset. In order to match the environment of the experimental roads, our dataset is composed of a part of each of the above datasets. The statistical analysis of the dataset is shown in Figure 7 and Figure 8.
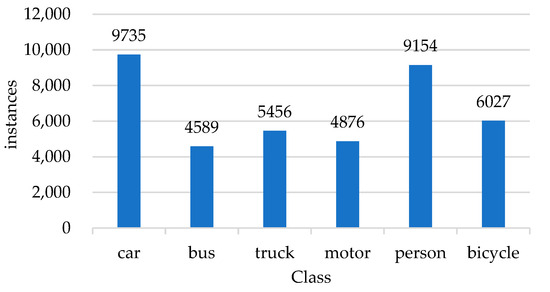
Figure 7.
Statistics of the number of classes in the dataset.
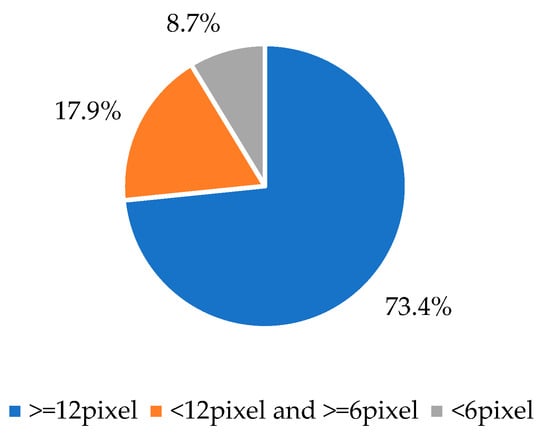
Figure 8.
Distribution of small targets in the dataset.
4.3. Evaluation Criterion
We evaluate performance in terms of both detection and tracking. The common criteria used to evaluate the performance of object detection algorithms include precision, mAP, recall, and IoU. Here, we use the mAP value to evaluate the detection performance of the algorithm.
AP (average precision) is a measure of the accuracy score at different thresholds on the precision–recall (PR) curve and is calculated as a weighted average. The AP values of all categories are then averaged to obtain mAP [24]. The calculation process for mAP is detailed in Equation (8).
where N denotes the number of categories in the sample, R denotes the rate of checking for completeness, and AP denotes the average accuracy.
For the testing of tracking performance, we select two indicators: MOTA and MOTP, where MOTA represents false positives, missed detections, and incidents of ID switching during the tracking process; and MOTP represents the degree of matching between the target prediction box and the true annotation of the dataset during the tracking process. The calculation process is shown in Equations (9) and (10).
where t is the tth frame; , , , , and are the number of missed targets, falsely detected targets, incidents of ID switching, the total number of targets that appear, and the number of successfully matched targets at the time of the tth frame, respectively; and is the spacing between the predicted position and the true position of target i at the time of the tth frame.
4.4. Ablation Experiment
In order to verify the effectiveness of each improvement point in our proposed algorithm and to improve the accuracy of vehicle pedestrian detection, ablation comparison experiments are carried out on the dataset of this experiment for the algorithm after each improvement point. The experiment verifies the effect of modifying the non-maximum value suppression algorithm, which improves the attention mechanism and increases the scale adaptive network in the experimental results. As shown in Table 2.
Table 2.
Results of ablation experiment (%).
In the above table, Base denotes the original YOLOv7 algorithm, √ denotes added, and × denotes not added. CCBA is added to the BackBone layer of YOLOv7, and the multi-scale feature network is added to the Neck layer.
As can be seen from Table 2, compared with the basic algorithm YOLOv7, the mAP value increases by 0.66% after modifying the non-extremely large value suppression mechanism; the mAP value increases by 1.05% after improving the attention mechanism; and the mAP value increases by 0.22% after adding the multi-scale feature network. After modifying the method of suppressing non-extremely large values and improving the attention mechanism, the mAP value increased by 2.46%; after modifying the method of suppressing non-extremely large values and adding multi-scale feature networks, the mAP value increased by 1.92%; after modifying the method of suppressing non-extremely large values and adding multi-scale feature networks, the mAP value increased by 3.05%. The improvement points proposed in this paper all have different degrees of impact in terms of improving the detection accuracy of the algorithm.
4.5. Comparative Experiments and Visualization
4.5.1. Target Detection Algorithm Comparison Experiment
In order to accurately evaluate the effectiveness of the improved algorithm in this article, YOLOv5, SSD, and other algorithm models were selected for comparison, among which W-YOLOv7 and YOLOv7-AC [25] were the YOLOv7 models optimized by other scholars. The final performance results of each model are shown in Table 3.
Table 3.
Comparison of different detection algorithms’ mAP@.5 values (%).
From the comparison experiments, it can be seen that the mAP values of our model are 7.75, 8.46, 6.88, 3.77, 0.95 and 1.87 percentage points higher than those of YOLOv5s, Faster-RCNN, SSD, YOLOv7, W-YOLOv7 and YOLOv7-AC, respectively, which proves that our model has a higher accuracy and is more valuable for practical application. Then, our improved model is compared with the original YOLOv7, W-YOLOv7, and YOLOv7-AC models in terms of object detection in the dataset for small targets and objects in dense environments. The specific situation is shown in Figure 9, Figure 10 and Figure 11.
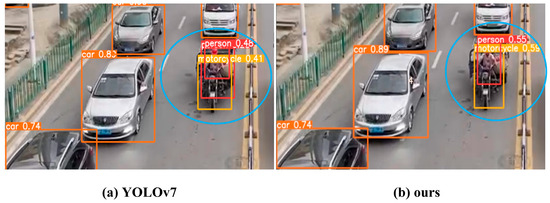
Figure 9.
Comparison of YOLOv7 with our model.

Figure 10.
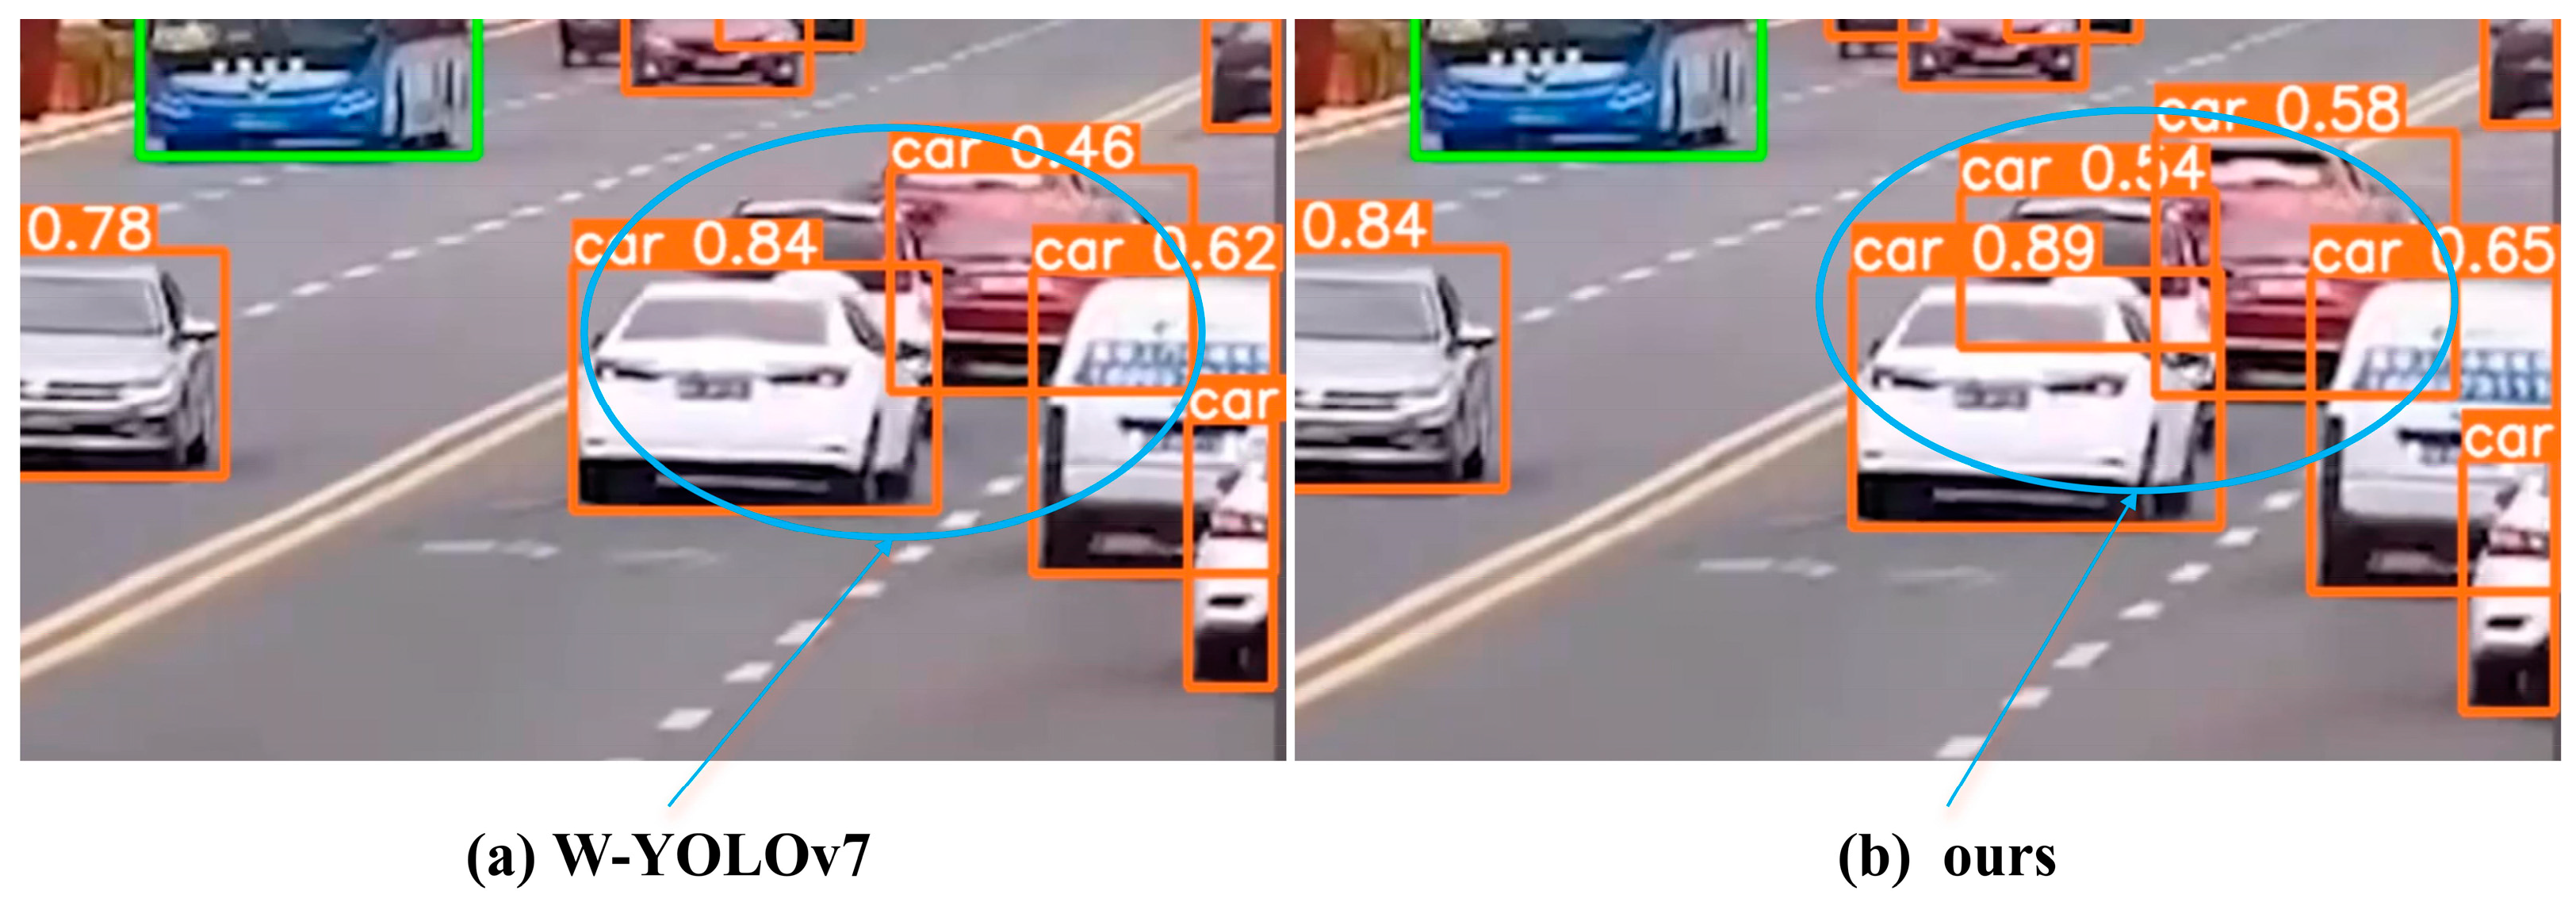
Comparison of W-YOLOv7 and our model.
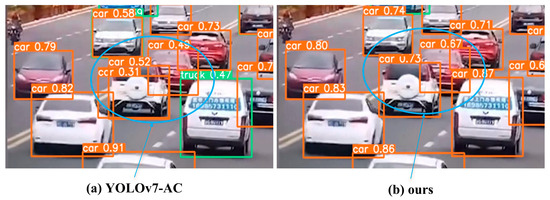
Figure 11.
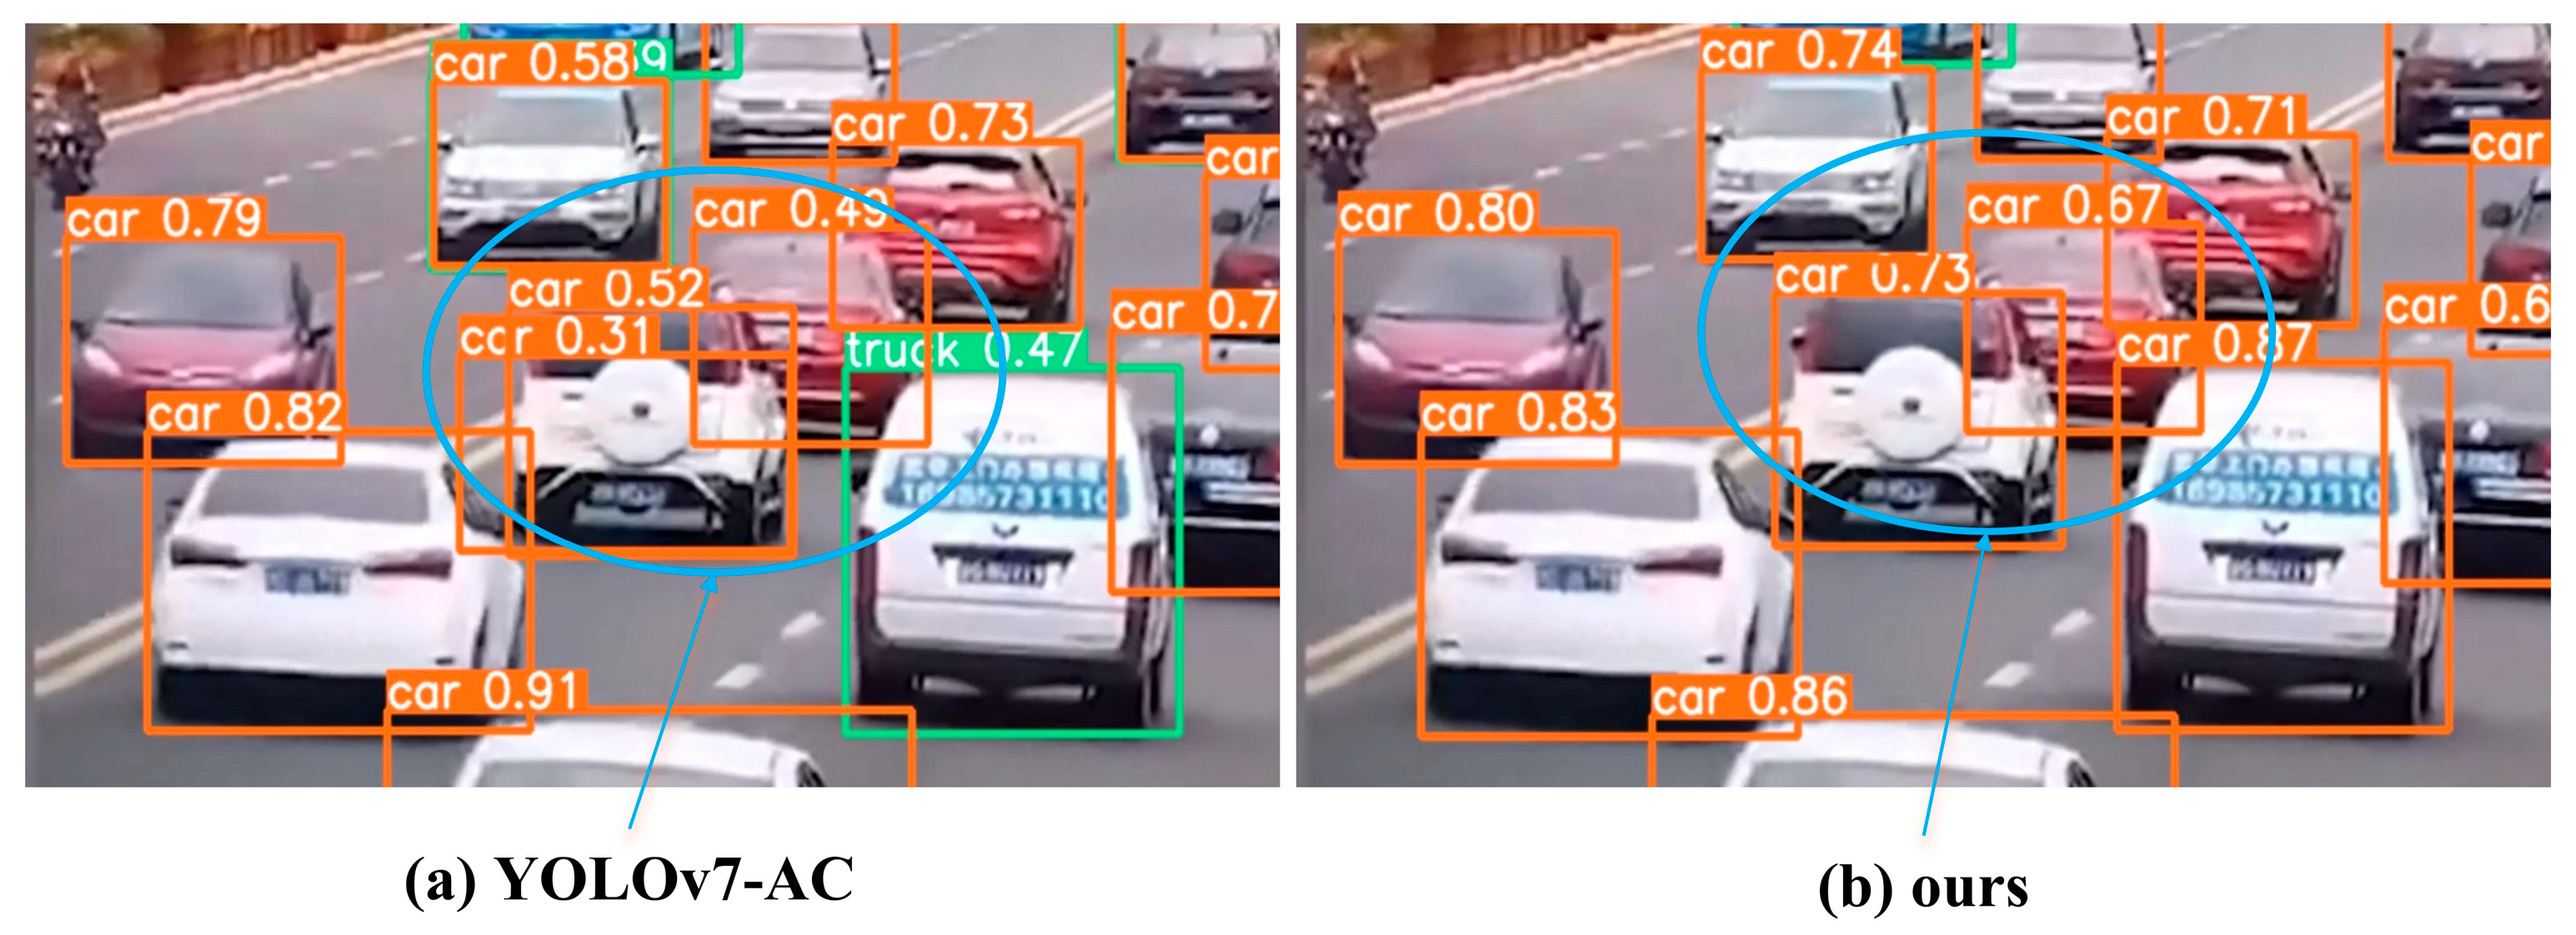
Comparison of YOLOv7-AC and our model.
The results of YOLOv7 have detection overlap, with a confidence of 0.48 for people and a confidence of 0.41 for motorcycles; the results of our model have no detection overlap, with a confidence of 0.55 for people and a confidence of 0.59 for motorcycles.
W-YOLOv7 did not detect all the vehicles in the high-density environment, with confidence levels of 0.46 and 0.84 for front and rear vehicles, respectively; our model detects all the vehicles in the high-density environment, and the confidence level of the three vehicles is 0.58, 0.54, and 0.89, respectively.
YOLOv7-AC has vehicle detection errors in high-density environments, detecting the same vehicle twice and with low confidence levels of 0.52 and 0.31; our model has no vehicle detection errors in high-density environments and has a confidence level of 0.73.
Through some visualization results in the test set, we can see that the algorithm performs well in detecting small objects, dense objects, and motion-blurred objects.
4.5.2. Comparative Experiment of Multi-Target Tracking Algorithms
The classical multi-target tracking algorithms SORT, StrongSORT, and DeepSORT are selected to conduct comparative experiments with our tracking algorithms on the MOT20 dataset, as well as to check whether our model satisfies the lightweighting requirement compared to the original DeepSORT model. The tracking results of each algorithm are shown in Table 4.
Table 4.
Experimental comparison results of different tracking algorithms.
From Table 4, it can be seen that compared with various tracking algorithms, the algorithm proposed in this paper performs better in both MOTA and MOTP metrics. Compared with SORT, StrongSORT, and DeepSORT algorithms, the MOTA metric of our algorithm improved by 7.7, 1.8, and 1.6 percentage points, while the MOTP metric improved by 1.8, 0.7, and 1.9 percentage points. More importantly, while still maintaining good level of accuracy, the model volume was eight times lower compared to that of the original DeepSORT model. Overall, it can be seen that the model proposed in this article meets the real-time and accuracy requirements for tracking, has a smaller model size and lower computational costs, and is more convenient to deploy on devices.
5. Conclusions
We combine vehicle pedestrian detection and tracking and propose to improve the YOLOv7 and DeepSort vehicle pedestrian detection and tracking algorithms. The algorithm model can track vehicles and pedestrians stably and continuously and can be applied in the field of autonomous driving and traffic management. By adding a scale adaptive network and attention mechanism and modifying the suppression of values that are not extremely large on YOLOv7, we are able to extract more feature information to improve the model’s accuracy and robustness in real-time vehicle pedestrian detection. The use of the MobileNetV3 lightweight module in the DeepSort model not only provides accurate tracking in real time but also reduces the number of parameters of the model.
As validated in various comparative experiments, our algorithmic model’s mAP value increases by 3.77 percentage points in the detection performance test; in the tracking performance test, the MOTA increases by 1.6 percentage points; the MOTP increases by 1.9 percentage points; and the model volume is eight times lower compared with that of the original model.
More accurate detection algorithms reduce false detections (misidentifying cars as buses) and missed detections (failing to detect pedestrians), which are critical in areas such as safety surveillance and traffic management; more accurate tracking algorithms help to better distinguish and track each pedestrian in multi-target tracking scenarios, avoiding ID-switching errors and target confusion. The improved efficiency enables the algorithms to satisfy real-time monitoring requirements, which are crucial for scenarios requiring swift responses, such as self-driving vehicles. And it can run on low-end hardware, which reduces the demand for computing resources and makes its large-scale deployment possible.
Despite the progress made, the challenges of vehicle pedestrian detection and tracking algorithms in complex lighting, occlusion, and dynamic scenarios remain. Future research needs to continue to improve the robustness and generalization of these algorithms. Techniques such as multi-modal data fusion, model compression, and hardware acceleration may be key to further improving their efficiency and accuracy.
Author Contributions
Z.Y.: conceptualization, methodology, software, writing—original draft preparation, writing—review and editing, data curation. Z.W.: supervision, project administration, funding acquisition, resource, validation. R.Z.: investigation. All authors have read and agreed to the published version of the manuscript.
Funding
This work was funded by the National Natural Science Foundation of China, grant numbers 61962007 and 62266009; the Key Project of Guangxi Natural Science Foundation, grant number 2018GXNSFDA294001; and Guangxi Key Laboratory of Big Data in Finance and Economics, grant number FEDOP2022A06.
Data Availability Statement
The dataset used in this study can be found at https://www.cvlibs.net/datasets/kitti/eval_odometry.php (accessed on 29 July 2015), http://detrac-db.rit.albany.edu/download (accessed on 27 January 2020), and http://www.vision.caltech.edu/Image_Datasets/CaltechPedestrians/ (accessed on 1 September 2009).
Conflicts of Interest
The authors declare no conflicts of interest.
References
- Li, F.; Zhang, R.; You, F. Fast pedestrian detection and dynamic tracking for intelligent vehicles within V2V cooperative environment. IET Image Process. 2017, 11, 833–840. [Google Scholar] [CrossRef]
- Sitaula, C.; Shahi, T.B.; Aryal, S.; Marzbanrad, F. Fusion of multi-scale bag of deep visual words features of chest X-ray images to detect COVID-19 infection. Sci. Rep. 2021, 11, 23914. [Google Scholar] [CrossRef] [PubMed]
- Bilal, M.; Hanif, M.S. Benchmark revision for HOG-SVM pedestrian detector through reinvigorated training and evaluation methodologies. IEEE Trans. Intell. Transp. Syst. 2019, 21, 1277–1287. [Google Scholar] [CrossRef]
- Zhai, S.; Shang, D.; Wang, S.; Dong, S. DF-SSD: An improved SSD object detection algorithm based on DenseNet and feature fusion. IEEE Access 2020, 8, 24344–24357. [Google Scholar] [CrossRef]
- Masita, K.L.; Hasan, A.N.; Paul, S. Pedestrian detection using R-CNN object detector. In Proceedings of the 2018 IEEE Latin American Conference on Computational Intelligence (LA-CCI), Gudalajara, Mexico, 7–9 November 2018; pp. 1–6. [Google Scholar]
- Koonce, B.; Koonce, B. MobileNetV3. In Convolutional Neural Networks with Swift for Tensorflow: Image Recognition and Dataset Categorization; Apress: Berkeley, CA, USA, 2021; pp. 125–144. [Google Scholar]
- Redmon, J.; Farhadi, A. YOLOv3: An incremental improvement. In Proceedings of the IEEE Conference on Computer Vision and Pattern Recognition, Salt Lake City, UT, USA, 18–23 June 2018. [Google Scholar]
- Jocher, G.; Chaurasia, A.; Stoken, A.; Borovec, J.; Kwon, Y.; Michael, K.; Fang, J.; Wong, C.; Zeng, Y.; Wang, Z.; et al. Classification Models, Apple M1, Reproducibility, Clearml and Deci.ai Integrations; Ultralytics/yolov5: v6. 2-yolov5; Zenodo: Geneva, Switzerland, 2022. [Google Scholar]
- Wang, C.Y.; Bochkovskiy, A.; Liao HY, M. YOLOv7: Trainable bag-of-freebies sets new state-of-the-art for real-time object detectors. In Proceedings of the IEEE/CVF Conference on Computer Vision and Pattern Recognition, Vancouver, BC, Canada, 18–22 June 2023; pp. 7464–7475. [Google Scholar]
- Mahasin, M.; Dewi, I.A. Comparison of cspdarknet53, cspresnext-50, and efficientnet-b0 backbones on yolo v4 as object detector. Int. J. Eng. Sci. Inf. Technol. 2022, 2, 64–72. [Google Scholar] [CrossRef]
- Wang, C.Y.; Liao HY, M.; Wu, Y.H.; Chen, P.-Y.; Hsieh, J.-W.; Yeh, I.-H. CSPNet: A new backbone that can enhance learning capability of CNN. In Proceedings of the IEEE/CVF Conference on Computer Vision and Pattern Recognition Workshops, Seattle, WA, USA, 14–19 June 2020; pp. 390–391. [Google Scholar]
- Zhao, Y.; Shan, Y.; Yuan, J. Wearing Mask Pedestrian Tracking Based on Improved YOLOv7 and DeepSORT. Comput. Eng. Appl. 2023, 59, 221–230. [Google Scholar]
- Jin, L.; Hua, Q.; Guo, B.; Xie, X.; Yan, F.-G.; Wu, B.-T. Multi-target tracking of vehicles based on optimized DeepSort. J. Zhejiang Univ. 2021, 55, 1056–1064. [Google Scholar]
- Zhang, T.; Li, R.; Lang, S.; Zeng, W. Underwater target acoustic image tracking method based on DeepSORT. Huazhong Univ. Sci. Technol. 2023, 51, 44–50. [Google Scholar] [CrossRef]
- Bodla, N.; Singh, B.; Chellappa, R.; Davis, L.S. Soft-NMS: Improving object detection with one line of code. In Proceedings of the 2017 IEEE International Conference on Computer Vision (ICCV), Venice, Italy, 22–29 October 2017; IEEE Press: New York, NY, USA, 2017; pp. 5562–5570. [Google Scholar]
- He, Y.; Zhang, X.; Savvides, M.; Kitani, K.M. Softer-NMS: Rethinking bounding box regression for accurate object detection. arXiv 2018, arXiv:1809.08545. [Google Scholar]
- Niu, Z.; Zhong, G.; Yu, H. A review on the attention mechanism of deep learning. Neurocomputing 2021, 452, 48–62. [Google Scholar] [CrossRef]
- Chen, B.; Dang, Z. Fast PCB defect detection method based on FasterNet backbone network and CBAM attention mechanism integrated with feature fusion module in improved YOLOv7. IEEE Access 2023, 11, 95092–95103. [Google Scholar] [CrossRef]
- Guo, K.; Li, X.; Zhang, M.; Bao, Q.; Yang, M. Real-time vehicle object detection method based on multi-scale feature fusion. IEEE Access 2021, 9, 115126–115134. [Google Scholar] [CrossRef]
- Ma, W.; Wu, Y.; Cen, F.; Wang, G. MDFN: Multi-scale deep feature learning network for object detection. Pattern Recognit. 2020, 100, 107149. [Google Scholar] [CrossRef]
- Multi-scale multi-patch person re-identification with exclusivity regularized softmax. Neurocomputing 2020, 382, 64–70. [CrossRef]
- Qian, S.; Ning, C.; Hu, Y. MobileNetV3 for image classification. In Proceedings of the 2021 IEEE 2nd International Conference on Big Data, Artificial Intelligence and Internet of Things Engineering (ICBAIE), Nanchang, China, 26–28 March 2021; pp. 490–497. [Google Scholar]
- Geiger, A.; Lenz, P.; Stiller, C.; Urtasun, R. Vision meets robotics: The KITTI dataset. Int. J. Robot. Res. 2013, 32, 1231–1237. [Google Scholar] [CrossRef]
- Padilla, R.; Netto, S.L.; Da Silva EA, B. A survey on performance metrics for object-detection algorithms. In Proceedings of the 2020 International Conference on Systems, Signals and Image Processing (IWSSIP), Graz, Austria, 9–11 July 2020; pp. 237–242. [Google Scholar]
- Liu, K.; Sun, Q.; Sun, D.; Peng, L.; Yang, M.; Wang, N. Underwater target detection based on improved YOLOv7. J. Mar. Sci. Eng. 2023, 11, 677. [Google Scholar] [CrossRef]


Disclaimer/Publisher’s Note: The statements, opinions and data contained in all publications are solely those of the individual author(s) and contributor(s) and not of MDPI and/or the editor(s). MDPI and/or the editor(s) disclaim responsibility for any injury to people or property resulting from any ideas, methods, instructions or products referred to in the content. |
© 2024 by the authors. Licensee MDPI, Basel, Switzerland. This article is an open access article distributed under the terms and conditions of the Creative Commons Attribution (CC BY) license (https://creativecommons.org/licenses/by/4.0/).