Article

YOLO-ADual: A Lightweight Traffic Sign Detection Model for a Mobile Driving System

College of Engineering Science and Technology, Shanghai Ocean University, Shanghai 201306, China
*
Author to whom correspondence should be addressed.
World Electr. Veh. J. 2024, 15(7), 323; https://doi.org/10.3390/wevj15070323 (registering DOI)
Submission received: 22 June 2024 / Revised: 12 July 2024 / Accepted: 13 July 2024 / Published: 21 July 2024
(This article belongs to the Special Issue Electric Vehicle Autonomous Driving Based on Image Recognition)

Abstract

:
Traffic sign detection plays a pivotal role in autonomous driving systems. The intricacy of the detection model necessitates high-performance hardware. Real-world traffic environments exhibit considerable variability and diversity, posing challenges for effective feature extraction by the model. Therefore, it is imperative to develop a detection model that is not only highly accurate but also lightweight. In this paper, we proposed YOLO-ADual, a novel lightweight model. Our method leverages the C3Dual and Adown lightweight modules as replacements for CPS and CBL modules in YOLOv5. The Adown module effectively mitigates feature loss during downsampling while reducing computational costs. Meanwhile, C3Dual optimizes the processing power for kernel feature extraction, enhancing computation efficiency while preserving network depth and feature extraction capability. Furthermore, the inclusion of the CBAM module enables the network to focus on salient information within the image, thus augmenting its feature representation capability. Our proposed algorithm achieves a [email protected] of 70.1% while significantly reducing the number of parameters and computational requirements to 51.83% and 64.73% of the original model, respectively. Compared to various lightweight models, our approach demonstrates competitive performance in terms of both computational efficiency and accuracy.

1. Introduction

With the rapid advancement of artificial intelligence and computer hardware, autonomous driving has become an essential feature in contemporary intelligent vehicles (IVs). This technology allows vehicles to transport passengers to their destinations safely without human intervention, significantly enhancing both comfort and safety. A crucial component of autonomous driving systems is traffic sign detection (TSD), which ensures safe operation through precise recognition of traffic signs. Any inaccuracies in TSD can jeopardize driver safety [1]. Various sophisticated high-precision base networks have been proposed, including VGGNet [2], RetinaNet [3], and SSD [4]. However, these models are often complex, with a significant number of parameters and computations. For effective traffic sign recognition, TSD systems must be efficiently implementable in embedded vehicle devices. Large models frequently struggle to provide the real-time performance needed for industrial applications [5]. Thus, the target detection algorithm for autonomous driving must combine high accuracy with a lightweight structure and rapid detection speed.
Most contemporary traffic sign detection (TSD) algorithms can be categorized into two main groups: traditional approaches and deep learning techniques. Traditional algorithms [6] rely on shape, edge, and color characteristics, such as HSV, SIFT, and HOG, to identify traffic signs. However, they often underperform in complex backgrounds. Deep learning algorithms, in contrast, have gained popularity due to their robust feature extraction capabilities, enabling effective identification of small traffic signs even in intricate environments. Despite their advantages, deep learning models require substantial matrix operations and parallel processing, necessitating high-performance processors [7]. GPUs are commonly used in deep learning due to their superior parallel processing capabilities. Neural network models contain millions of parameters, leading to high memory requirements for both storage and processing of extensive intermediate data. To mitigate these demands, the storage space required for neural networks can be reduced by pruning unimportant weights or lowering the number of parameters.
The deep learning approach to object detection categorizes target detection algorithms into two main categories: one-stage and two-stage detection algorithms. Typical examples of two-stage detection algorithms include R-CNN [8], SPPNet [9], and Fast R-CNN [10]. The earliest model, R-CNN, employed a convolutional neural network for feature extraction and classification after using selective search to produce area recommendations. Despite the high level of accuracy, the model required a lot of computing power because so many region proposals needed to be handled separately. Later, SPPNe added spatial pyramid pooling to R-CNN, enabling the use of input images of varying sizes and cutting down on computational expenses. By removing the requirement for external region suggestion techniques and integrating the region of interest (RoI) pooling layer directly into the network design, Fast R-CNN increases accuracy and speed. Despite their excellent accuracy, these two-stage models lag in training time and detection speed. In contrast, one-stage detection algorithms offer high speed, making them particularly well-suited for mobile applications. Several lightweight one-stage detection algorithms have been developed, such as Xception [11], SqueezeNet [12], MobileNet [13], ShuffleNet [14], and You Only Look Once (YOLO) [15], have been proposed by researchers. Xception combines depth-wise convolution derived from Inception-V3 [16] with pointwise convolution so that the number of 3 × 3 convolutions is equal to the number of 1 × 1 convolution output channels, which reduces the amount of computation and parameters while maintaining high accuracy. SqueezeNet uses the VGG stacking concept and a compression method by substituting 3 × 3 convolutions with 1 × 1 convolutions, achieving only 2.14% of the parameters of AlexNet [17] while maintaining the same level of performance. While SqueezeNet reduces the network’s parameters by increasing depth and minimizing the number of parameters, this approach can impact the network’s parallel processing capabilities. This often results in slower convergence during training and heightened sensitivity to hyperparameter selection, complicating the tuning process. Additionally, SqueezeNet employs conventional convolution computation techniques.
In contrast, the subsequently introduced MobileNet model employs a more efficient, deeply separable convolutional computation method, effectively reducing computational effort and model size and thereby accelerating the implementation of convolutional networks on mobile devices. MobileNetV3 [18] incorporates the VGG concept along with additional components such as the Squeeze and Excitation (SE) module and the novel nonlinear h-swish activation function. The SE module dynamically adjusts the importance of the feature channels by learning the dependencies between the channels, which enhances the expressive power of the model. h-swish activation function, on the other hand, is an improvement from the traditional Swish function, which provides higher computational efficiency and is particularly suitable for environments with limited computational resources. MobileNet utilizes the depth separable convolution, which offers enhanced computational efficiency and compatibility with quantization techniques. However, this may lead to poor dissemination of information. To address this, ShuffleNet employs channel shuffling, allowing information exchange across different groups of feature channels, thus enhancing feature representation and reducing computation. Additionally, ShuffleNet introduces the ResNet concept, which accelerates the model training process and improves the training efficiency of deep networks, setting it apart from MobileNet and SqueezeNet.
In the end, we concentrate on the YOLOv family. YOLO’s core principle is to treat object detection as a single regression problem, directly converting image pixels into bounding box coordinates and class probabilities. YOLO partitions the input image into grids, each responsible for predicting objects whose centers are within that grid. By simplifying detection to a single network forward propagation, YOLO is particularly well-suited for real-time applications.YOLOv5 [19], the most classic and widely adopted single-stage algorithm in the YOLO family, excels in precision, accuracy, and confidence scores over other YOLO algorithms. Despite this, YOLOv5 lacks an effective attention mechanism, leading to suboptimal performance for small target detection. Furthermore, these algorithms do not fulfill the lightweight and high-accuracy requirements essential for mobile devices.
Within the limitations of YOLOv5, the primary aim of this study is to develop a traffic sign detection algorithm that combines lightweight design with high precision, ensuring a balance between accuracy and efficiency. Moreover, this research aims to improve the detection of smaller targets. We present a novel traffic sign detection method named YOLO-ADual, whose structure is shown in Figure 1.
  • The key contributions of our research are summarized below:
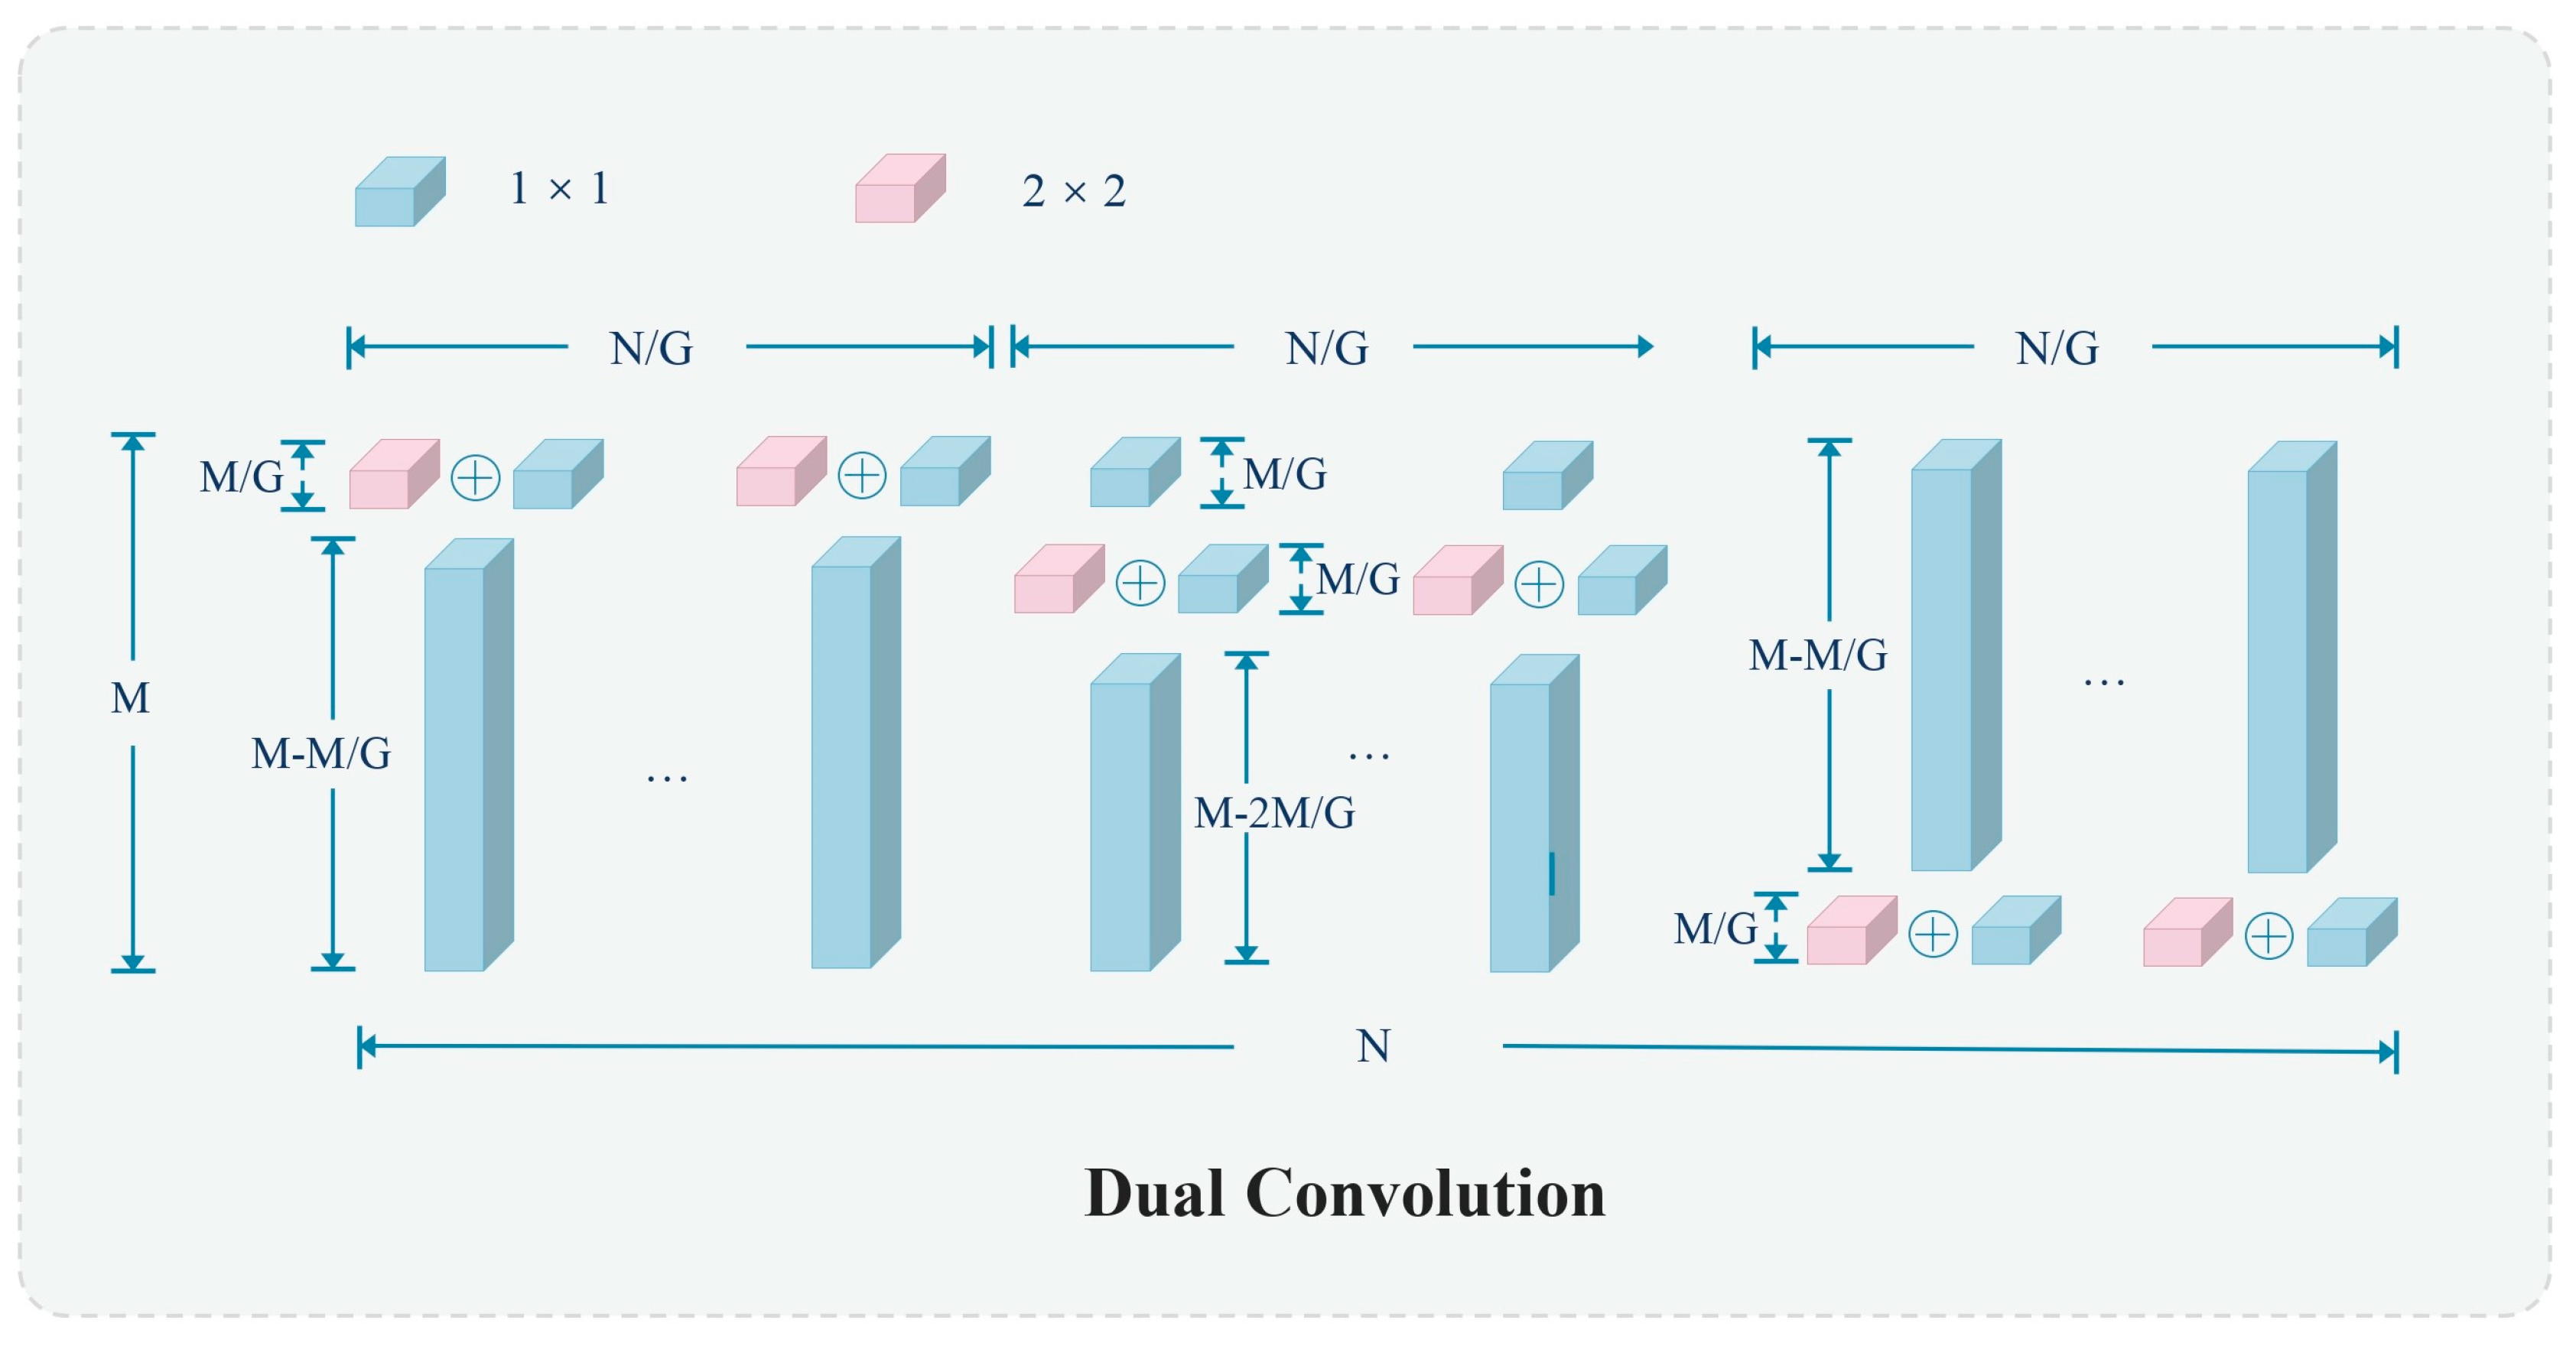
  • The YOLO5s-ADual model is introduced in this study. By utilizing DualConv and C3, we propose a more efficient C3Dual architecture to replace the CBL module in the backbone of the YOLOv5 object detection model. Additionally, this architecture incorporates ADown from YOLOv9 in place of the Conv module in both the head and backbone of YOLOv5s. As a result, the model becomes lightweight, enabling faster reasoning and reducing the need for hardware resources, thereby making it more suitable for mobile device deployment;
  • In the actual scenario of TSD, since there are more small objects for traffic sign detection, the CBAM attention mechanism is adopted to improve the small object detection performance;
  • The experimental outcomes on the TT100k dataset demonstrate that the proposed method halves the parameters of the original YOLOv5s model while enhancing the mAP by 5 points. Compared to several contemporary lightweight object detection methods, the model presented in this paper demonstrates superior accuracy and a more lightweight structure;
  • The structure of the remaining sections is as follows: Section 2 provides an overview of recent research on two-stage object detection and YOLOv5s. Section 3 details the design of the C3Dual module, the structure of the ADown module, the CBAM attention mechanism, and the overall model structure. Section 4 describes the dataset, experimental setup, and the results obtained from the experiments. Finally, Section 5 offers a summary and the paper’s conclusions.

2. Related Work

2.1. Research on Two-Stage Approaches in Object Detection

The two-stage object detection algorithm is acclaimed for its remarkable precision in detecting targets. Within this algorithm, the task of detecting targets is segregated into two fundamental components: proposing regions and classifying targets. These components are adept at handling complex scenarios and identifying diminutive objects. The initial deployment of the R-CNN (region-based convolutional neural network) model marked the introduction of employing convolutional neural networks (CNNs) for the recognition of objects. Notably, the deep features retrieved by this model supplanted the conventional HOG and SIFT features [20] and significantly enhanced the performance of detection. Nevertheless, due to up to 2000 candidate regions in the first image search, each candidate frame necessitates characterization by CNN and subsequent classification by SVM, leading to a substantial computational burden. The spatial pyramid pooling network (SPPNet) [21] employs a single convolutional neural network (CNN) operation on the entire image. It also utilizes a pyramid spatial pooling operation, significantly enhancing both speed and accuracy. Fast R-CNN incorporates an ROI pooling layer, using Sofmax for classification, and utilizes a multi-task loss function. However, it still employs a selective search to acquire 2000 candidate origins, which is very time-consuming. Consequently, the Faster R-CNN was later created, but the selective search was abandoned, and the region proposal network (RPN) was introduced instead. RPN generated region proposals and introduced the idea of an anchor, enabling the training of the entire object detection process from end to end. Region-based Fully Convolutional Networks (R-FCNs) [22] employ convolutional operations to produce position-sensitive score maps. These maps encode the positional information of the target, enabling all region proposals to share all parameters. This feature significantly enhances the efficiency of the detection. Feature Pyramid Networks for Object Detection (FPN) [23] introduce a feature pyramid network that emulates the down-top path of convolutional neural networks (CNNs). The system employs lateral connections and a top–down path to extract features from images of varying scales, generating multi-scale feature representations. Feature maps at all levels possess robust semantic information, including specific high-resolution feature maps.

2.2. Lightweight Traffic Sign Detection Network
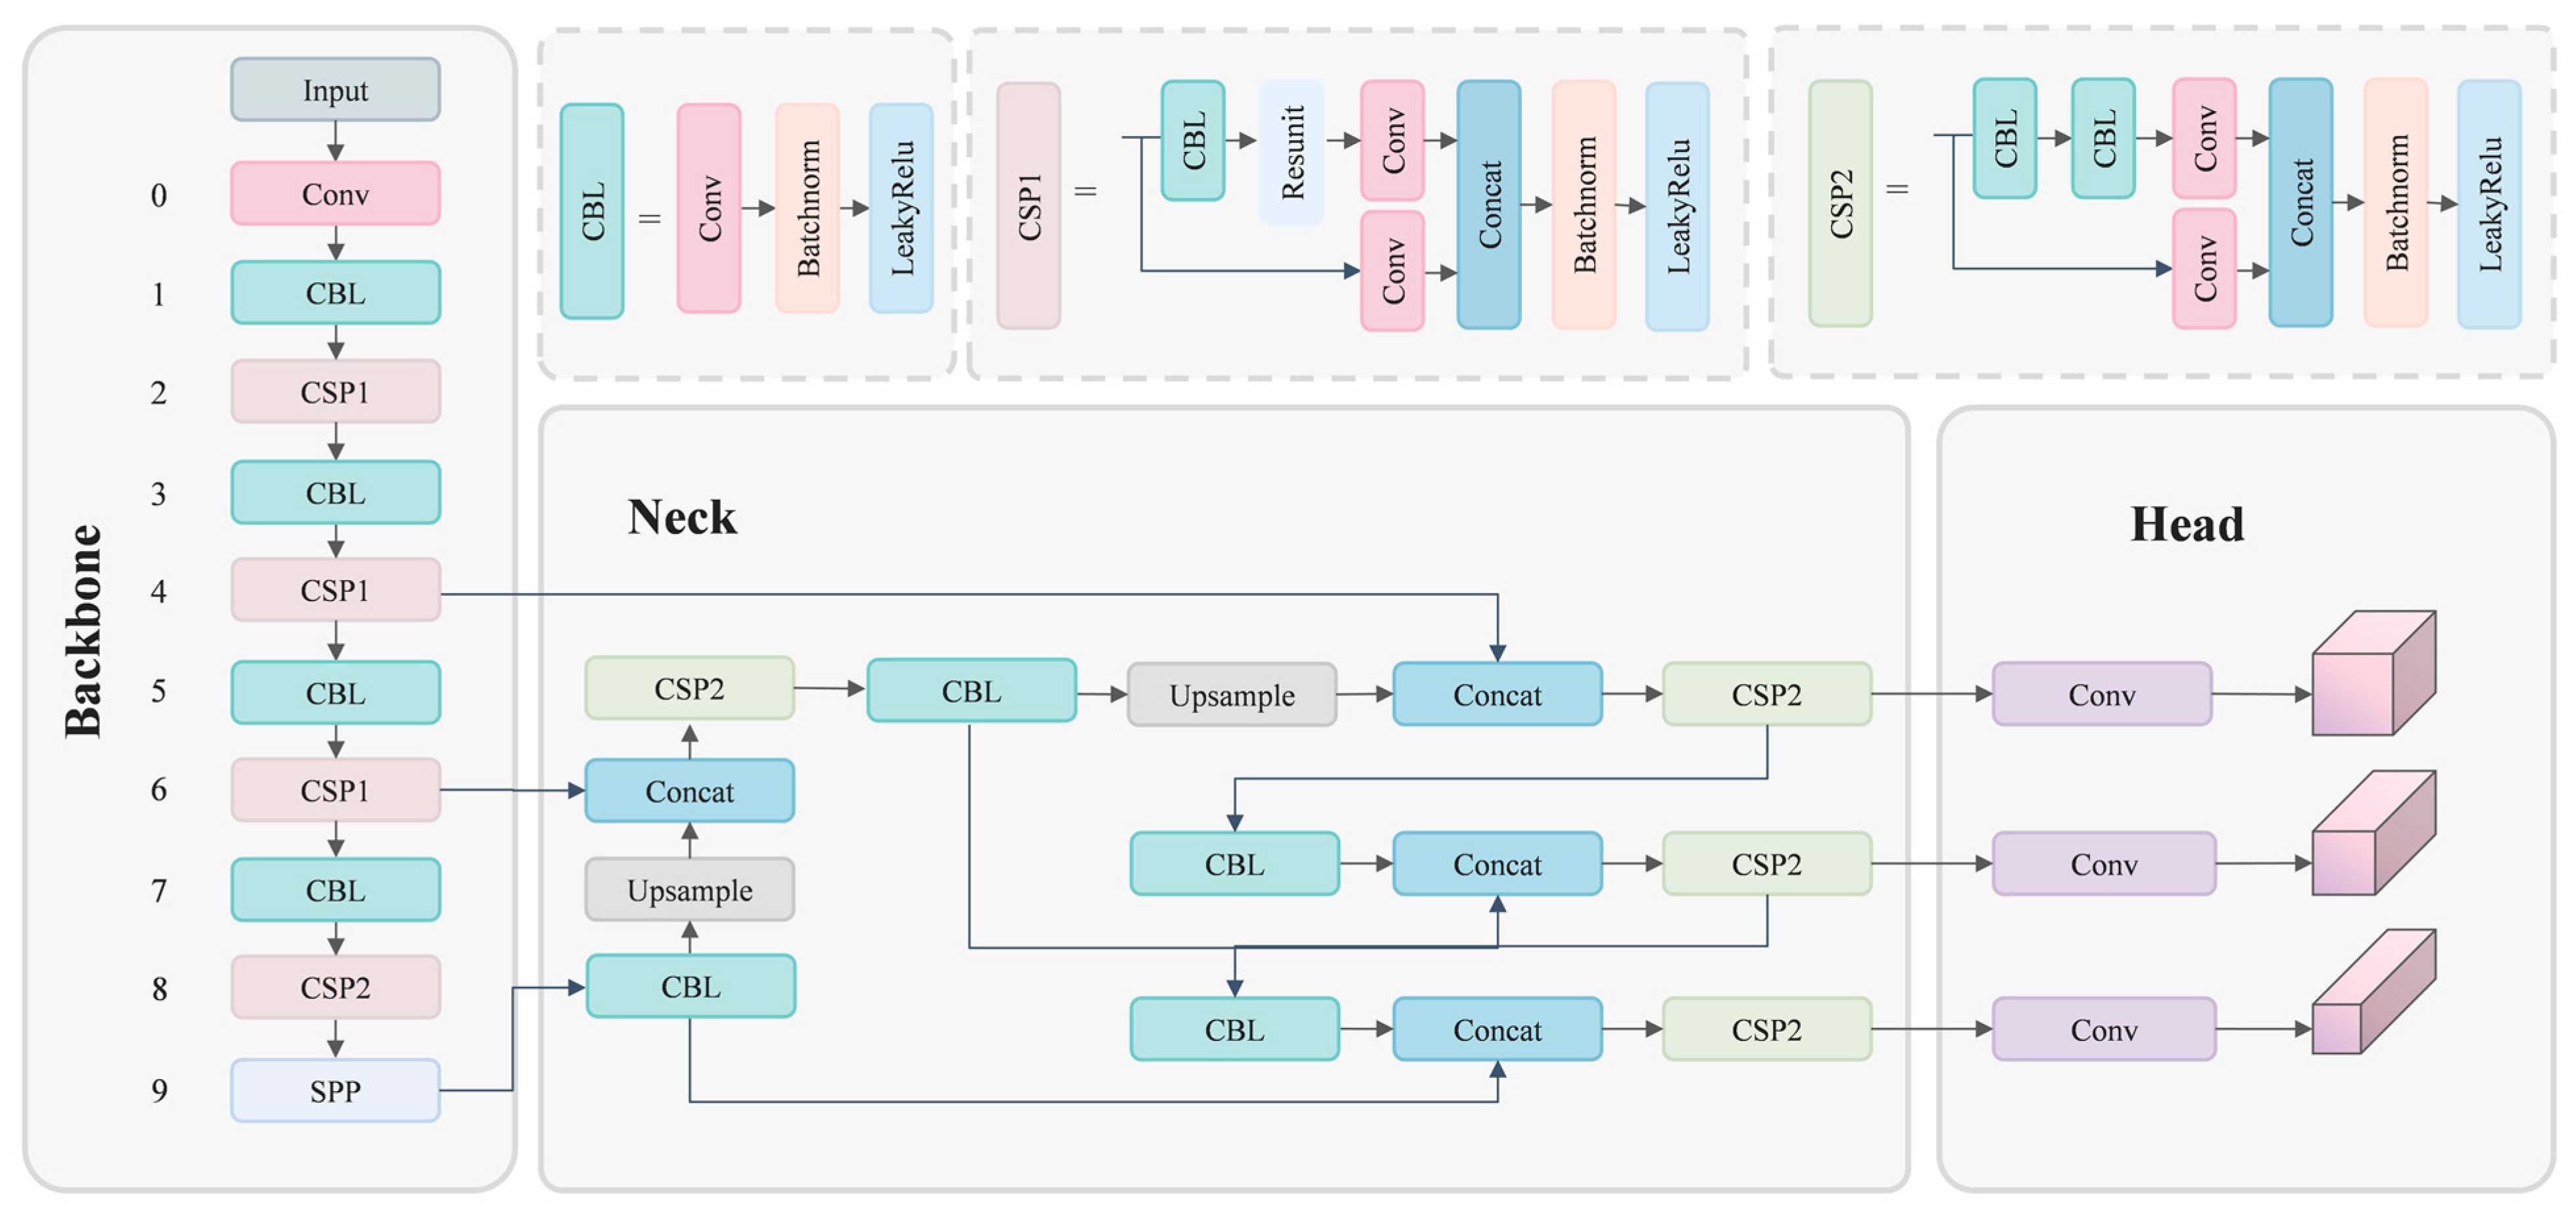
In real-world application settings, mobile devices often lack sufficient storage capacity to accommodate the extensive parameters of deep convolutional networks. Consequently, researchers have suggested viable methods. Zhang et al. [24] (2023) proposed a lightweight YOLO model called Ghost-YOLO. This model uses the Ghost module and C3Ghost to achieve a lightweight detection model. Liu et al. [25] (2023) integrated ConvNeXt-V2 to propose a module named C3_CN2. In the head section, the lightweight receptive field attention module, LPFAConv, is employed to enhance the detection capability. Li et al. [26] (2024) predict categories in the first stage of detection and fuse two-stage category prediction. An effective post-processing method, named SANMS, is also proposed for the first stage detection. The final results were obtained with high accuracy and inference speed. These studies show that the lightweight YOLO model performs better in detection and accuracy for mobile devices.

2.3. YOLOv5s

Before the introduction of YOLOv1 [27], the R-CNN series of algorithms held a prominent position in the domain of target detection. The R-CNN series exhibited a notable level of detection accuracy. Still, its detection speed fell short of real-time performance due to its two-stage detection network architecture, resulting in substantial criticism. YOLO’s core idea is to convert the target identification task into a regression issue. This transformation involves using the entire map as input to the neural network and only using a neural network to obtain the position of the bounding box and its corresponding class. YOLOv5 is an advancement iteration derived from YOLOv3 [28] and YOLOv4 [29]. The overall architecture of YOLOv5 is shown in Figure 2. The dataset comprises five distinct models, specifically YOLOv5n, YOLOv5s, YOLOv5m, YOLOv5l, and YOLO5x. Those YOLOv5 models exhibit a progressive enhancement in detection accuracy, accompanied by a gradual decline in detection speed. Individuals can select an appropriate model to attain an optimal balance between precision and efficiency. In contrast to its predecessors, YOLOv4 and YOLOv3, YOLOv5 employs the focus structure within its backbone component and incorporates three distinct output heads to facilitate multi-scale prediction. The same project team develops YOLOv8 [30] as YOLOv5. This model is advanced and currently at the forefront of technology. The general framework of this model bears resemblance to YOLOv5. YOLOv8 gave up the prior anchor-based approach and instead adopted the anchor-free concept. Moreover, YOLOv8 introduced the C2f module to replace the CBL module in YOLOv5. The architecture of C2f primarily draws inspiration from the ELAN concept in YOLOv7 [31] and C3 modules. This enables YOLOv8 to obtain ampler gradient flow information while maintaining a lightweight approach.
Selcuk et al. [32] conducted a mobile UI detection experiment. It was observed that YOLOv5 outperforms YOLOv8 when applied to smaller UI solid parts. For comparison, Bian et al. [33] employed three models in their UAV image detection experiment, namely YOLOv5, YOLOv7, and Roboflow 2.0. The findings revealed that the YOLOv5s model achieved the highest average precision. Yusof et al. [34] conducted a road detection experiment. It was observed that YOLOv5 exhibited the highest mean average precision (mAP) when compared to YOLOv7 and YOLOv6. While YOLOv5 and YOLOv7 demonstrated similar inference image capabilities, YOLOv5 outperformed YOLOv7 regarding confidence. Ultimately, the experiment concluded that YOLOv7 is twice as fast as YOLOv5, yet YOLOv5 outperformed YOLOv7 in accuracy and precision. Based on the three experiments above, it can be concluded that despite not being the most recent addition to the YOLO family, YOLOv5’s algorithm continues to exhibit superior precision compared to YOLOv6, YOLOv7, and YOLOv8. The YOLOv5 model remains highly valuable for further research and enhancement. Hence, we choose YOLOv5 as the foundation for enhancement to design a detection model that is simultaneously lightweight and highly accurate.

3. Method

3.1. Overview of YOLO-ADual
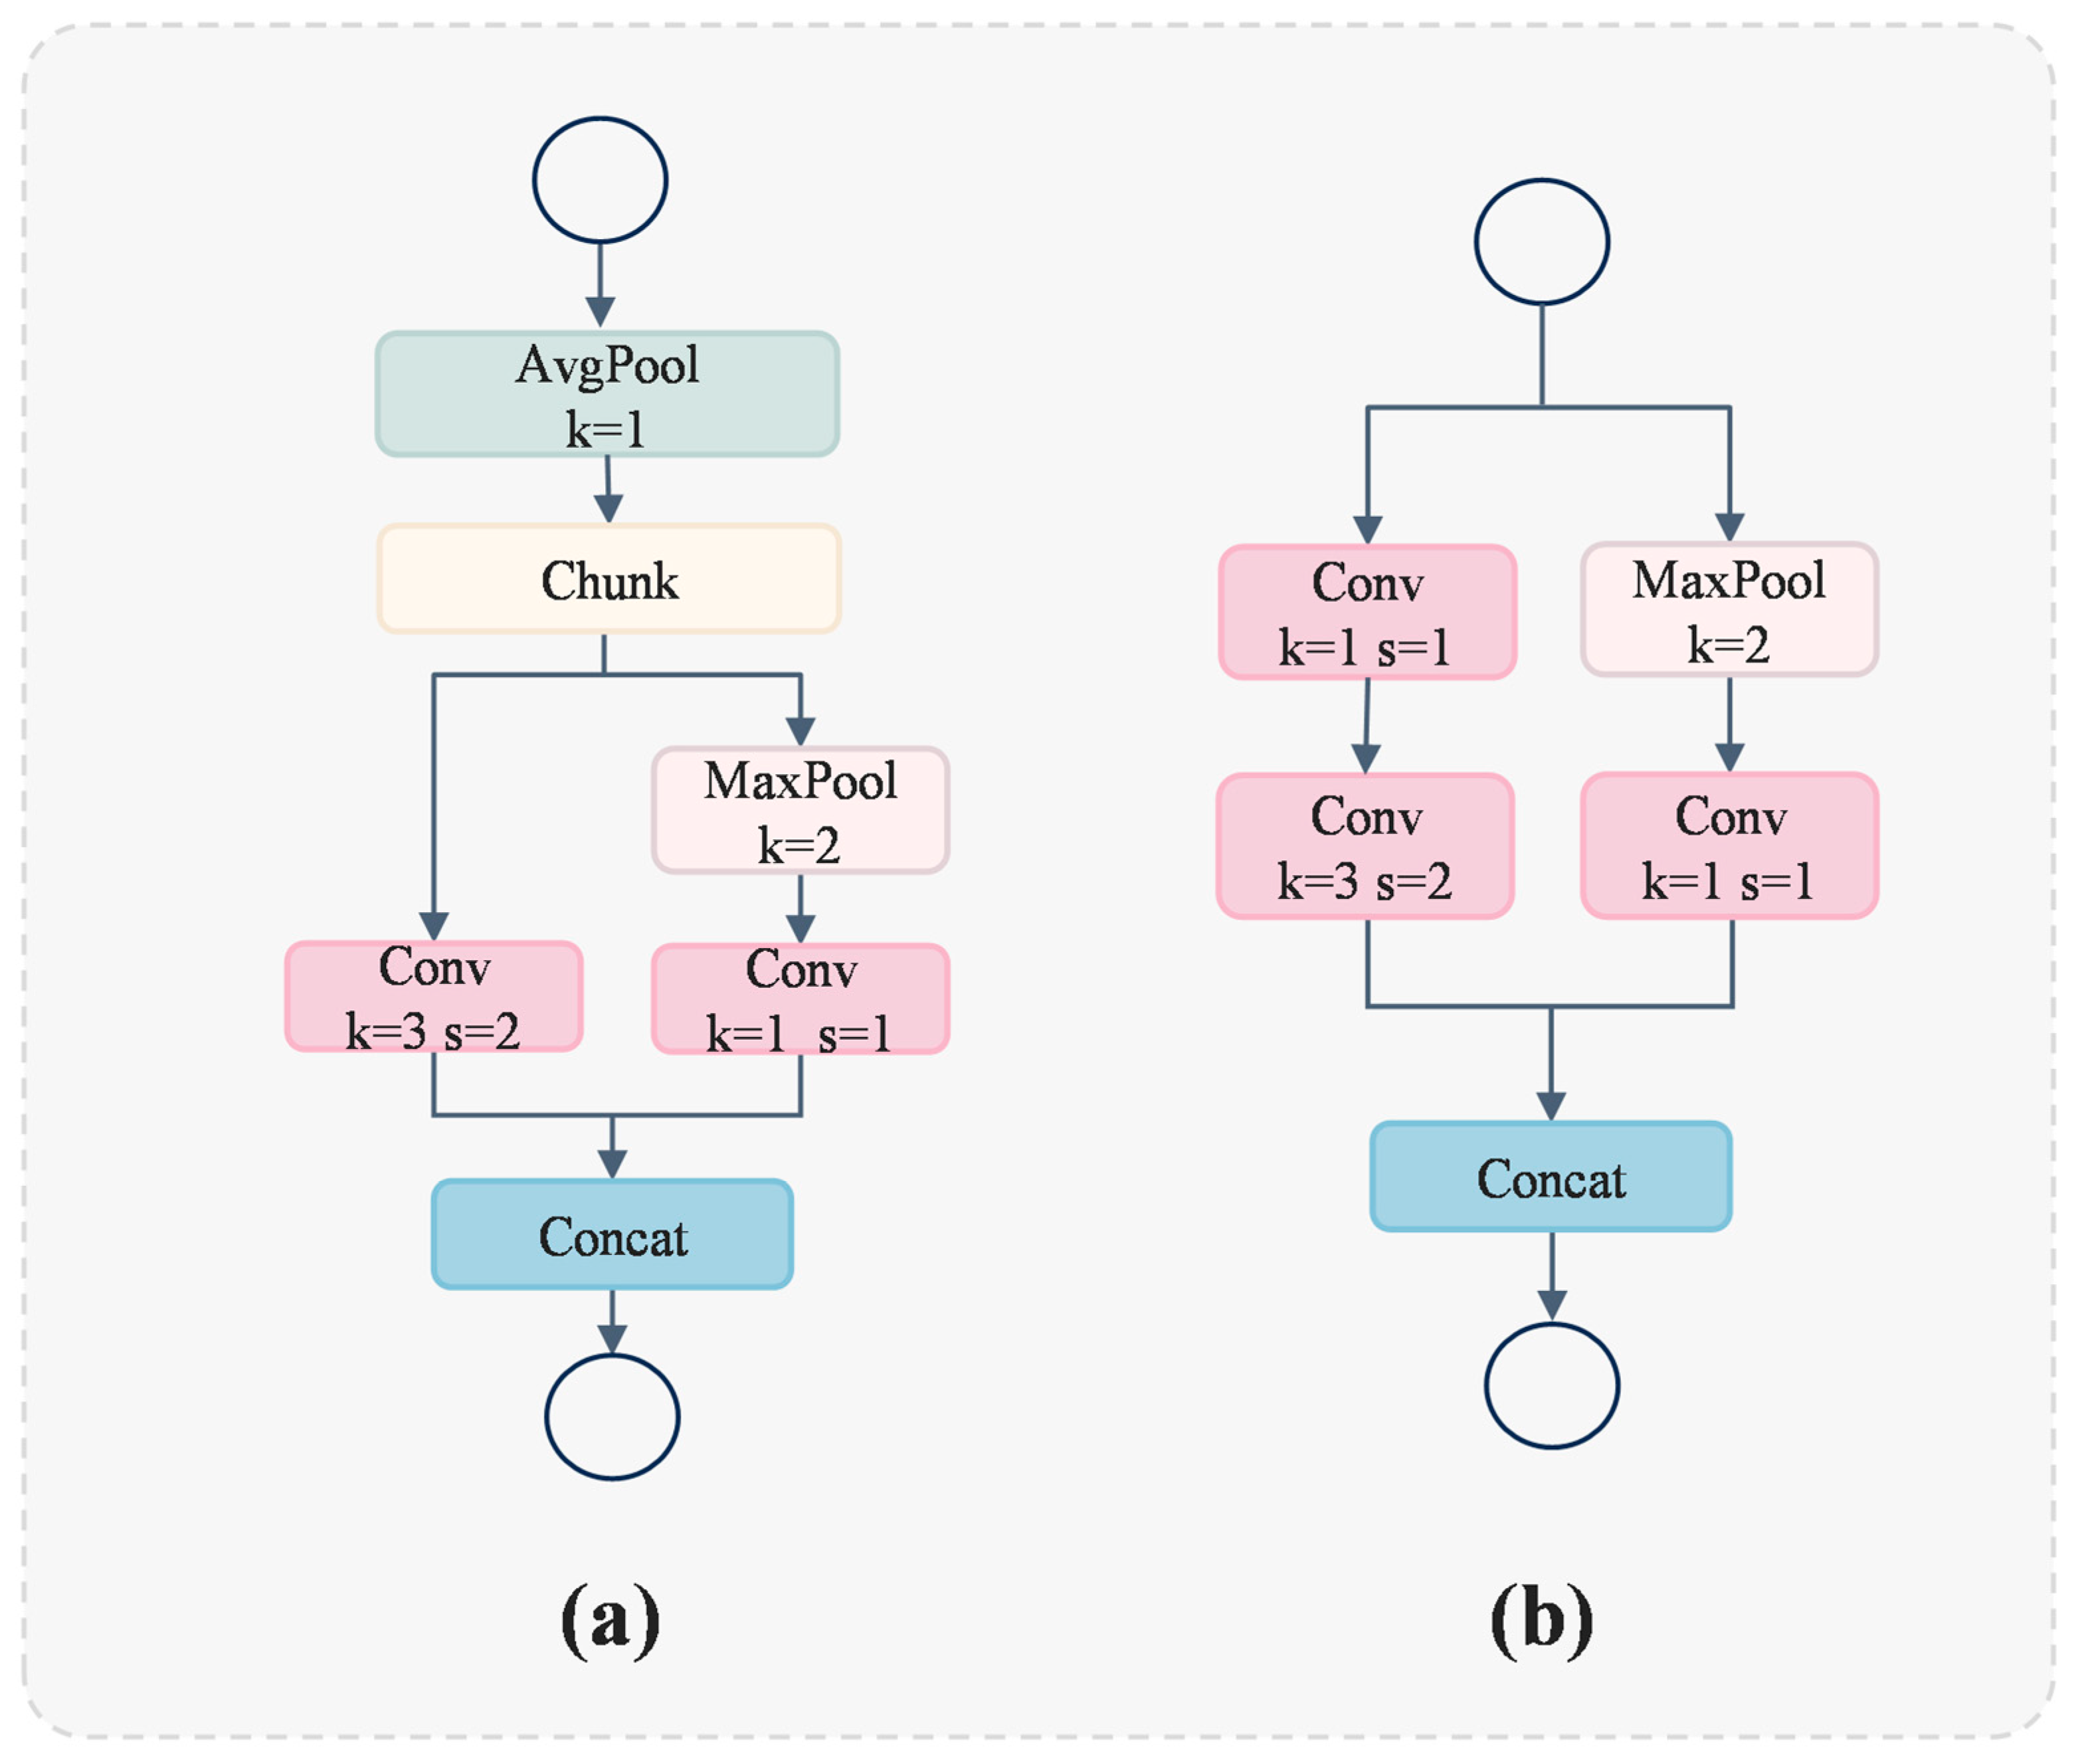
This paper introduces a novel and lightweight object detection method named YOLO-ADual, intended to overcome the challenges of integrating intelligent transportation systems on mobile devices. The method integrates three key components into the YOLOv5s framework.

3.2. Adown

Traditional convolutional neural networks (CNNs) often necessitate an extensive number of parameters and FLOPS to attain acceptable levels of accuracy. This is due to the significant redundancy present in the intermediate feature maps generated by prevalent CNN architectures. In this study, we utilize the Adown module introduced in YOLOv9 [35] to improve the Conv module of YOLOv5s. The Adown module is enhanced from the downsample network transition block in YOLOv7. A comparison of the structures of these two downsample networks is shown in Figure 3. The transition block module’s right section employs Maxpool and a convolution kernel with a stride of 1 for processing. Conversely, the branch’s left section utilizes convolution kernels of 1 × 1 and 3 × 3 for the convolution operation [36]. The Adown module performs the AvgPool operation before splitting, the right part of the branch retains the original transition block operation, and the other half only uses 3 × 3 convolution kernels for the convolution operation and deletes the 1 × 1 convolution. The Adown module has been improved to reduce the feature loss and enhance the feature learning efficiency.

3.3. C3Dual

DualConv is a lightweight deep neural network designed to optimize both spatial information capture and computational efficiency. As illustrated in Figure 4, DualConv combines 3 × 3 and 1 × 1 convolutional kernels [37]. The 3 × 3 convolutional kernel enhances spatial information extraction, while the 1 × 1 convolutional kernel facilitates interactions between feature channels and information integration, minimizing additional parameters and computational complexity. By integrating these two convolutional kernels, DualConv processes the same input feature mapping channels concurrently, with each group of convolutional kernels handling a subset of the input channels separately. The outputs are then merged, promoting efficient information flow and integration across different feature map channels. This structural design preserves the network depth and characterization capability, optimizing information processing for kernel feature extraction and reducing computational complexity and model size. Thus, DualConv is particularly suitable for resource-constrained environments.
Furthermore, DualConv employs group convolution to effectively reduce the number of parameter kernel computations. In group convolution, the input and output feature maps are divided into multiple groups, and each group of convolution filters processes only a portion of the corresponding input feature map. This reduces model complexity by allowing different convolutional kernels within a group (e.g., 3 × 3 and 1 × 1) to process the same set of input channels in parallel. This design leverages the spatial feature extraction capabilities of large-size convolutional kernels and the computational efficiency of small-size convolutional kernels, thereby lowering the parameter and computational costs of the model while maintaining accuracy.
In this study, we leverage the advantages of DualConv to introduce a compact feature extraction framework named C3Dual. The C3Dual architecture consists of three 1 × 1 convolutional layers and n sequentially arranged DualBottlenecks. The initial 1 × 1 convolutional layer halves the channel count relative to the output channels. Subsequent layers extract features through sequentially arranged DualBottlenecks and separate residual branches. This method captures deep semantic information from the input image through both branches, and the two feature sets are combined via the Contact module. The Contact operation fuses multiple feature maps based on channel count, enhancing semantic information utilization across various scales and improving performance through channel expansion. The combined features are processed through a BatchNorm module and activated using LeakyReLU. Each DualBottleneck comprises two 1 × 1 convolutional layers flanking a dual convolutional layer, with the 1 × 1 layers reducing and expanding dimensions and the dual convolutional layer serving as the bottleneck for smaller dimensions. By replacing all CSP modules in YOLOv5 with C3Dual modules, computational demand is significantly reduced, and the model size is compressed without compromising detection accuracy.

3.4. CBAM

Convolutional Block Attention Module (CBAM) focuses on essential features and screens out unnecessary features to enhance the network representation [38]. Figure 5a shows the schematic structure of CBAM. It contains a channel attention module (CAM) and a spatial attention module (SAM). Firstly, CBAM focuses on the important features through CAM and then focuses on the important locations of these features through SAM. This method can effectively help the network focus on the image’s key information and improve the features’ representation strength. Given the input feature F R C × H × W , first, perform the one-dimensional convolution M c     R C × 1 × 1   of the channel attention module, and then multiply the convolution result by the original image to obtain the CAM output result F , as shown in Equation (1):
F = M c F × F ,
Take the CAM output F as the input and perform the two-dimensional convolution M s     R 1 × H × W of spatial attention module and multiply the output result with the original image. As shown in Equation (2),
F   = M s F × F ,

3.4.1. Channel Attention Module

The channel attention module (CAM) is designed to enhance the feature representation of each channel. It maintains the channel dimension while compressing the spatial dimension. As illustrated in Figure 5b, the input feature F is processed through parallel MaxPool and AvgPool layers, transforming the feature map from a size of C × H × W to C × 1 × 1. Subsequently, it undergoes processing in the Shared M L P module, where it first reduces the channel count to 1/r of its initial value and then restores it to the original count. Finally, it generates two activated outputs using the ReLU activation function [39]. Element-wise summation is performed on the two output results, followed by the application of a sigmoid activation function to obtain the channel attention weight. This weight is then applied to each channel of the original feature map, resulting in a weighted feature map with dimensions C × H × W. By employing parallel MaxPool and AvgPool layers, a more diverse and comprehensive set of high-level features can be extracted. The weighting of the feature map serves to highlight channels beneficial for the current task while diminishing the impact of irrelevant channels. The formula for channel attention is
M C ( F ) = σ ( M L P A P F + M L P ( M P F ) )
where σ denotes the sigmoid function, M L P R C r × C , and A P R C × C / r . A P represents AvgPool, M P represents MaxPool, and M L P   represents the connect operation. Note that the M L P weights, M L P and A P , are shared for both inputs, and the ReLU activation function is followed by A P .

3.4.2. Spatial Attention Module

The spatial attention module (SAM) concentrates on the spatial information of the target without altering the spatial dimensions; it only compresses the channel dimensions. Figure 5c illustrates the schematic structure of SAM. The output F from the channel attention module (CAM) is processed through maximum and average pooling to generate two 1 × H × W feature maps. These maps are then concatenated and transformed into a single-channel feature map through a 7 × 7 convolution. Spatial attention weights are subsequently derived using a sigmoid function. These weights are applied to the original feature map to emphasize features at specific spatial locations, converting the map back to a C × H × W size. This process accentuates significant regions of the image while diminishing the impact of less important areas. The formula for spatial attention is
M S ( F ) = σ ( f 7 × 7 ( A P F + M P F ) )
where σ denotes the sigmoid function, and f 7 × 7 represents a convolution operation with the filter size of 7 × 7. A P R 1 × H × W ,   and M P R 1 × H × W . A P represents AvgPool, and M P represents MaxPool. Each denotes average-pooled features and max-pooled features across the channel.

3.5. Algorithm Implementation

Step 1 (data preprocessing): To comprehensively evaluate the performance of the target detection algorithm in traffic scenarios, we utilized the Tsinghua–Tencent 100K dataset. This dataset comprises 100,000 photos collected by Tencent Street View Map under various lighting and weather conditions, covering 221 categories of Chinese traffic signs and over 30,000 traffic signs labeled in 10,000 images. For the experiment’s accuracy, we selected 9457 images, using 6598 for training, 970 for testing, and 1889 for validation. To address issues of missing labels or incorrect annotations, we manually corrected and labeled them using the LabelImg tool.
Before formal model training, all images underwent a rigorous preprocessing step to optimize learning. Initially, images were normalized by scaling pixel values to the range [0, 1] to reduce pixel value differences. Subsequently, images were uniformly resized to the model’s required size, generally using bilinear interpolation to maintain quality and cropping or padding as necessary. Finally, image enhancement techniques were applied to overexposed or low-contrast images: exposure compensation restored details in overexposed images, while contrast stretching or histogram equalization enhanced low-contrast images. These enhancements improved image quality and, consequently, the model’s accuracy in recognizing traffic signs.
Step 2 (model selection): In the field of target detection technology, numerous advanced algorithms have been developed and applied to monitor the transportation environment. Each algorithm has specific design features and corresponding advantages and disadvantages. When selecting algorithms for our experiments, it was crucial to consider not only their inherent performance but also their adaptability to specific datasets. We explored seven cutting-edge target detection algorithms: YOLOv5n, YOLOv5s, SSD, YOLOv7-tiny, EfficientDet, YOLOX, Faster R-CNN, and Zhang et al. Additionally, we introduced and explored an innovative detection method, YOLO-ADual. Although these algorithms have demonstrated excellent performance in various application scenarios, our primary goal was to evaluate their performance differences in traffic sign detection. We benchmarked these algorithms on the same dataset to identify the most suitable model for traffic scene detection.
Step 3 (model training): In this study, we employed a transfer learning approach to rigorously train the YOLO-ADual model. Initially, the YOLO-ADual model was initialized using pre-trained weights on the COCO dataset. Then, it was carefully fine-tuned on specific datasets to meet our application requirements. During training, we set the batch size to 32 and the initial learning rate to 0.01 and performed 300 training cycles. The parameters related to the YOLO-ADual configuration are detailed in Table 1. We used PyTorch as the deep learning framework due to its comprehensive tools and libraries for building and training neural networks. Adam [40] was chosen as the initial optimizer for its combination of the momentum method and adaptive learning rate technique, which automatically adjusts each parameter’s learning rate. Unlike SGD [41], Adam simplifies the optimization process by not requiring manual learning rate adjustments, thereby finding the minimum value of the loss function faster and accelerating model convergence. Algorithm 1 in the article details the training process used. The CBL and Conv modules in the original model of Figure 2 are replaced with C3Dual and Adown modules, respectively, and the CBAM module is inserted in layer 8 to obtain the YOLO-Adual model of Figure 1. After improvement, the model follows the first step in the steps of Algorithm 1: Initialize YOLO-ADual neural network with COCO pre-trained weights.
Algorithm 1: YOLO-ADual training algorithm with transfer learning
Data: COCO Pretrained Weights, Specialized Datasets: TT100k
Result: Fine-tuned YOLO-ADual Model
Initialize YOLO-ADual neural network with COCO pre-trained weights;
Initialize training parameters: batch size = 32, initial learning rate = 0.01, total epochs = 300; Initialize loss function: Loss;
Initialize optimizer: Adam;
Initialize evaluation metrics: Recall, Precision;
for epoch ⟵ 1 to total_epochs do
  for batch ⟵ 1 to total_batches do
    // Load a batch of training data from TT100k
    image_batch, ground_truth_batch ⟵ LoadBatchFromDatasets(TT100k, batch_size);
    // Forward pass through the network
    predicted_boxes ⟵ YOLO-ADual(image_batch);
    // Calculate Loss
    loss ⟵ CalculateIoULoss(predicted_boxes, ground_truth_batch);
    // Backpropagation and weight update
    BackpropagateAndOptimize(loss);
  end
  // Adjust learning rate (e.g., learning rate decay)
  if epoch % learning_rate_decay_interval == 0 then
    AdjustLearningRate(optimizer, new_learning_rate);
  end
  // Evaluate the model on validation data
  recall, precision ⟵ EvaluateModel(YOLO-ADual, ValidationData);
  if recall > threshold_recall and precision > threshold_precision then
    // Save the model if recall and precision meet the criteria
    SaveModel(YOLO-ADual, ’trained_model_epoch_’ + epoch);
  end
end
Step 4 (model evaluation): For a comprehensive and systematic evaluation of the model’s performance in target detection for traffic scenes, we utilize standardized evaluation metrics such as precision, average precision (AP), mean average precision (mAP), recall, F1 score, and processing speed (fps). These metrics provide a quantitative overview of the model’s effectiveness in complex traffic environments. If the model underperforms in specific areas, optimizing hyperparameters or expanding the training dataset may enhance its capabilities. Ensuring a balance between overfitting and underfitting is essential for excellent generalization to unseen data. Precision, for instance, indicates the proportion of true positive ( T P ) samples out of all samples predicted as positive.
p r e c i s i o n = T P T P + F P
where TP denotes the number of images that have properly recognized items with an Intersection over Union (IoU) of more than 0.5. In other words, it refers to the count of images with correctly identified positive samples by the model. Conversely, FP represents the count of images where objects are detected with an IoU below 0.5, classified as false positives.
R e c a l l   the ratio of accurate predictions to the total number of positive samples, as follows:
r e c a l l = T P T P + F N ,
where F N (false negative) represents the number of pictures mistakenly classified as not containing things of interest.
The average precision ( A P ) is the measure of the area enclosed by the precision–recall curve and the X-axis, calculated as follows:
A P = 0 1 p r d r ,
where the precision function for a given recall is denoted by p r .
The F 1 score is calculated as the harmonic mean of precision and recall, with values ranging from 0 to 1, as follows:
F 1 = 2 · p r e c i s i o n · r e c a l l p r e c i s i o n + r e c a l l .
The mean average precision ( m A P ) is calculated as the average A P value across all object classes, as follows:
m A P = A P N c l a s s e s ,
where N c l a s s e s   denotes the number of classes.

4. Experimental Analysis
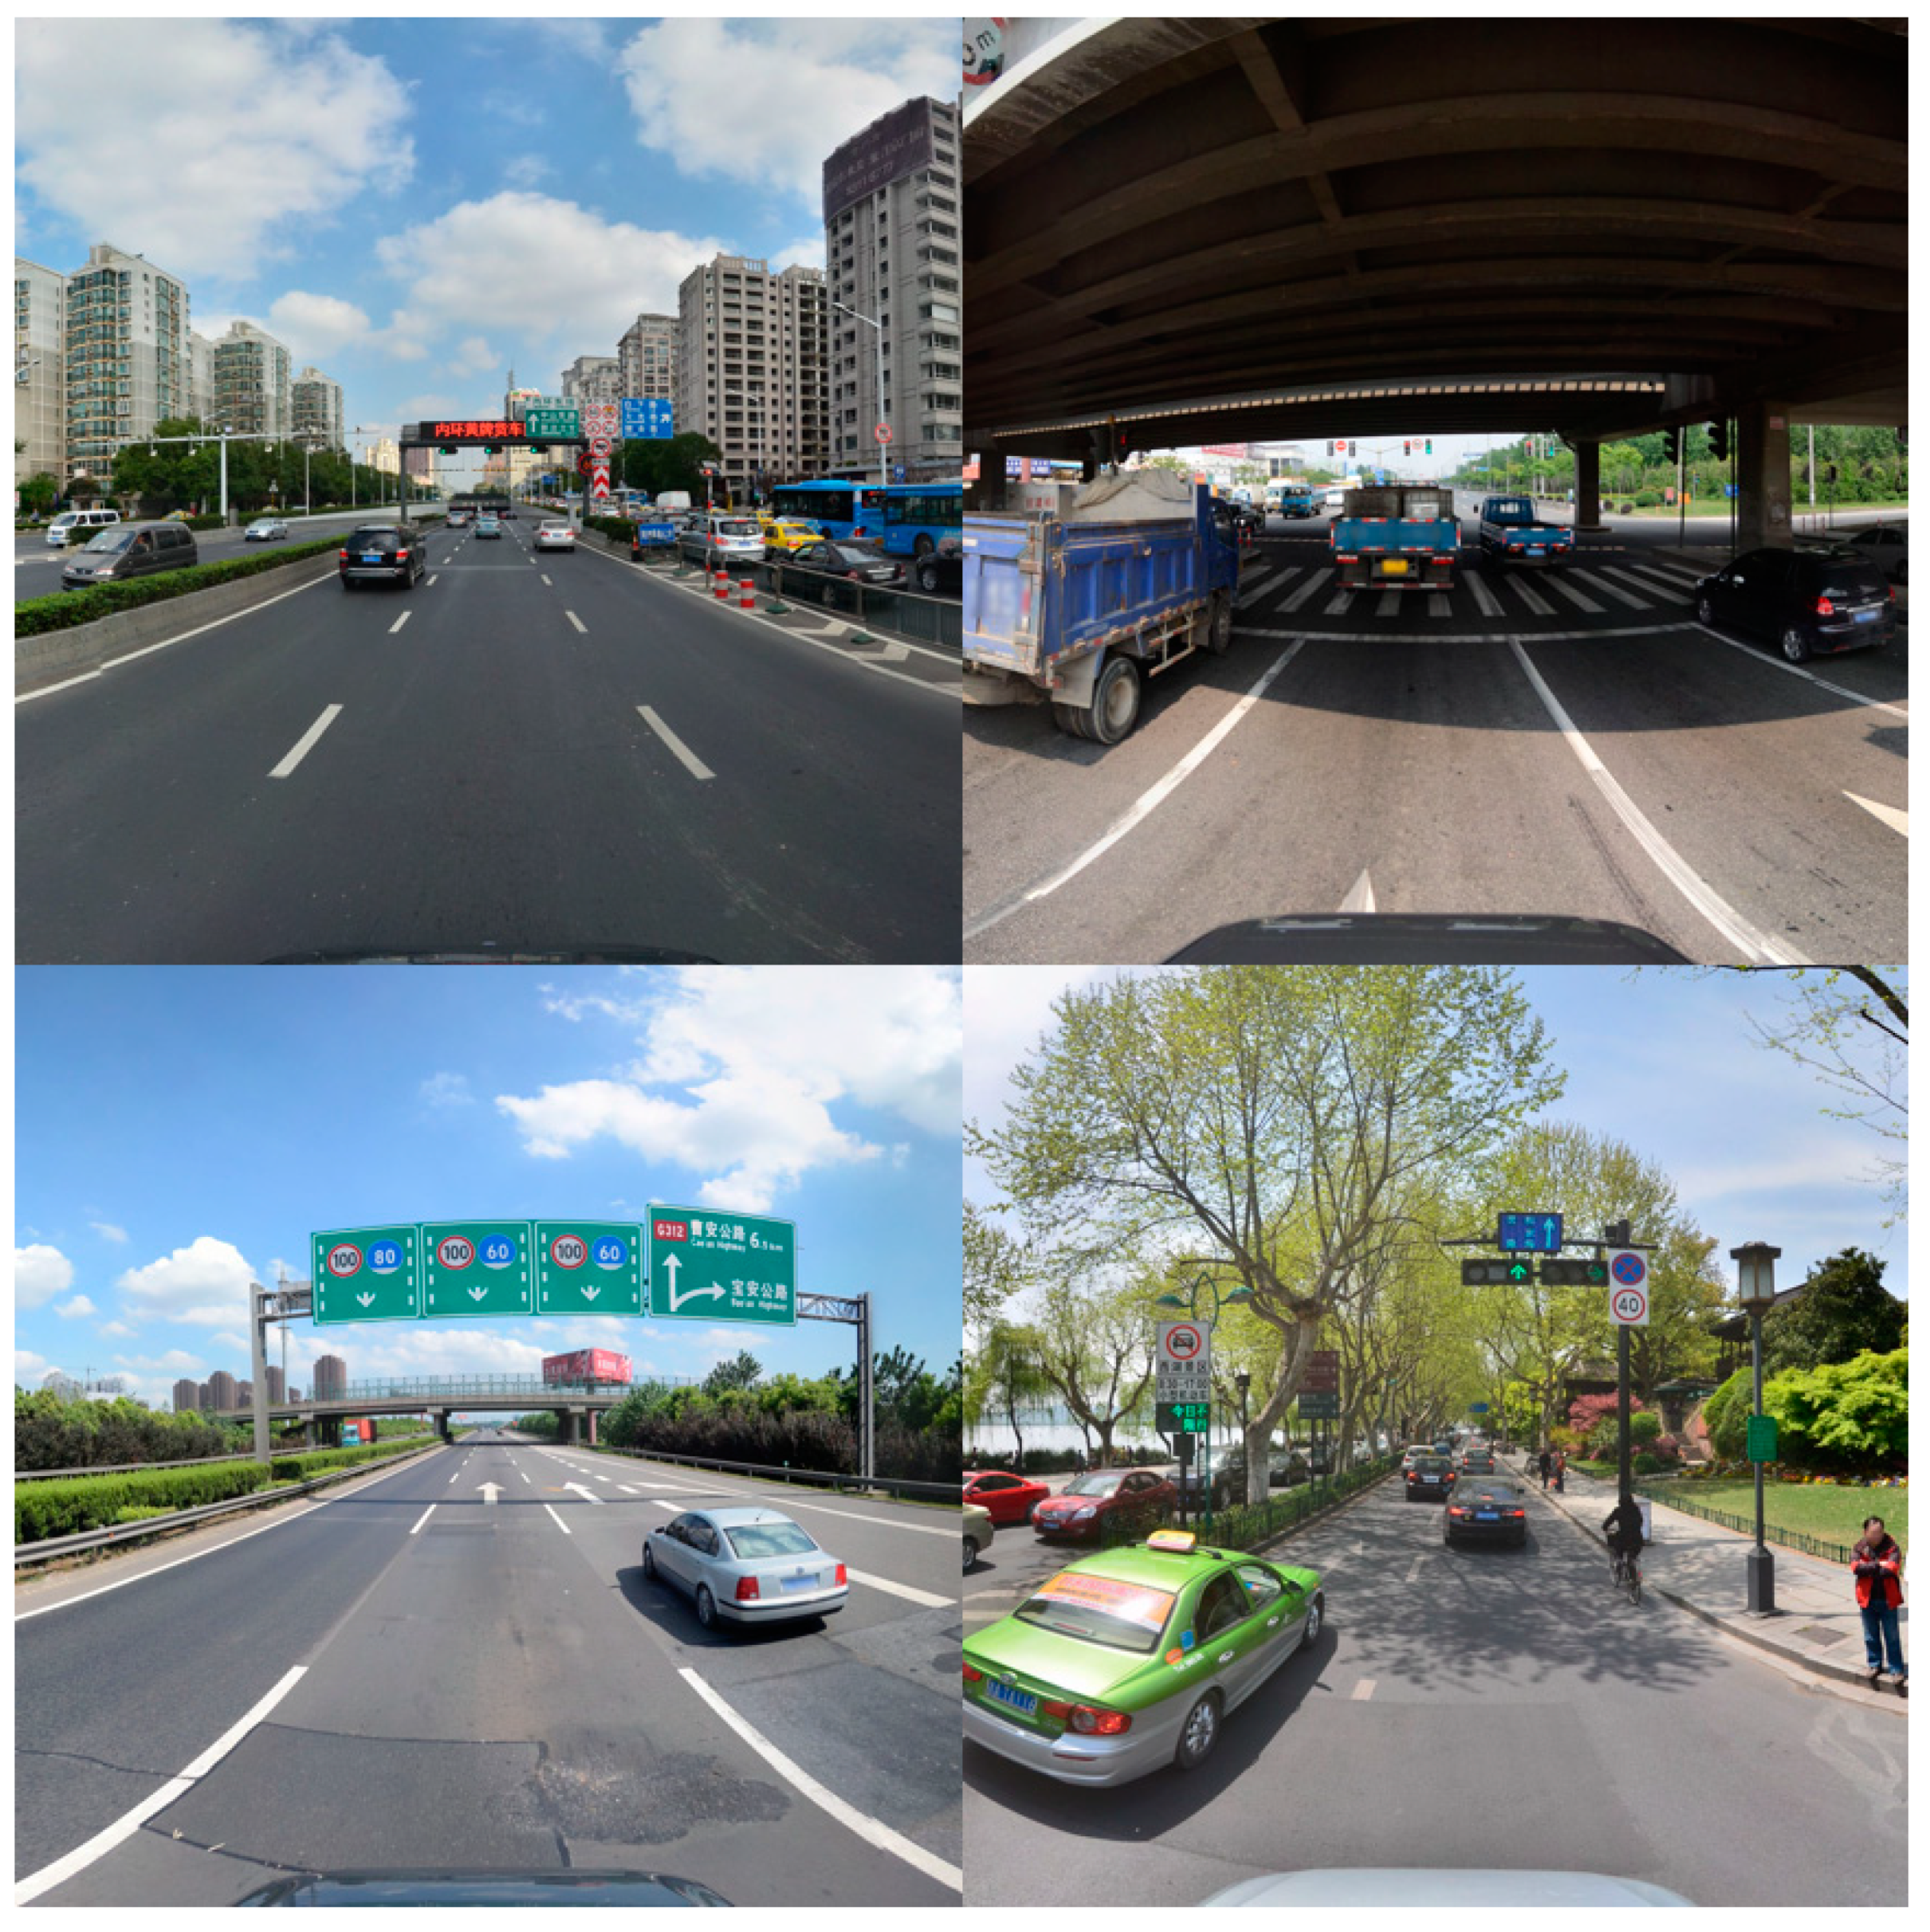
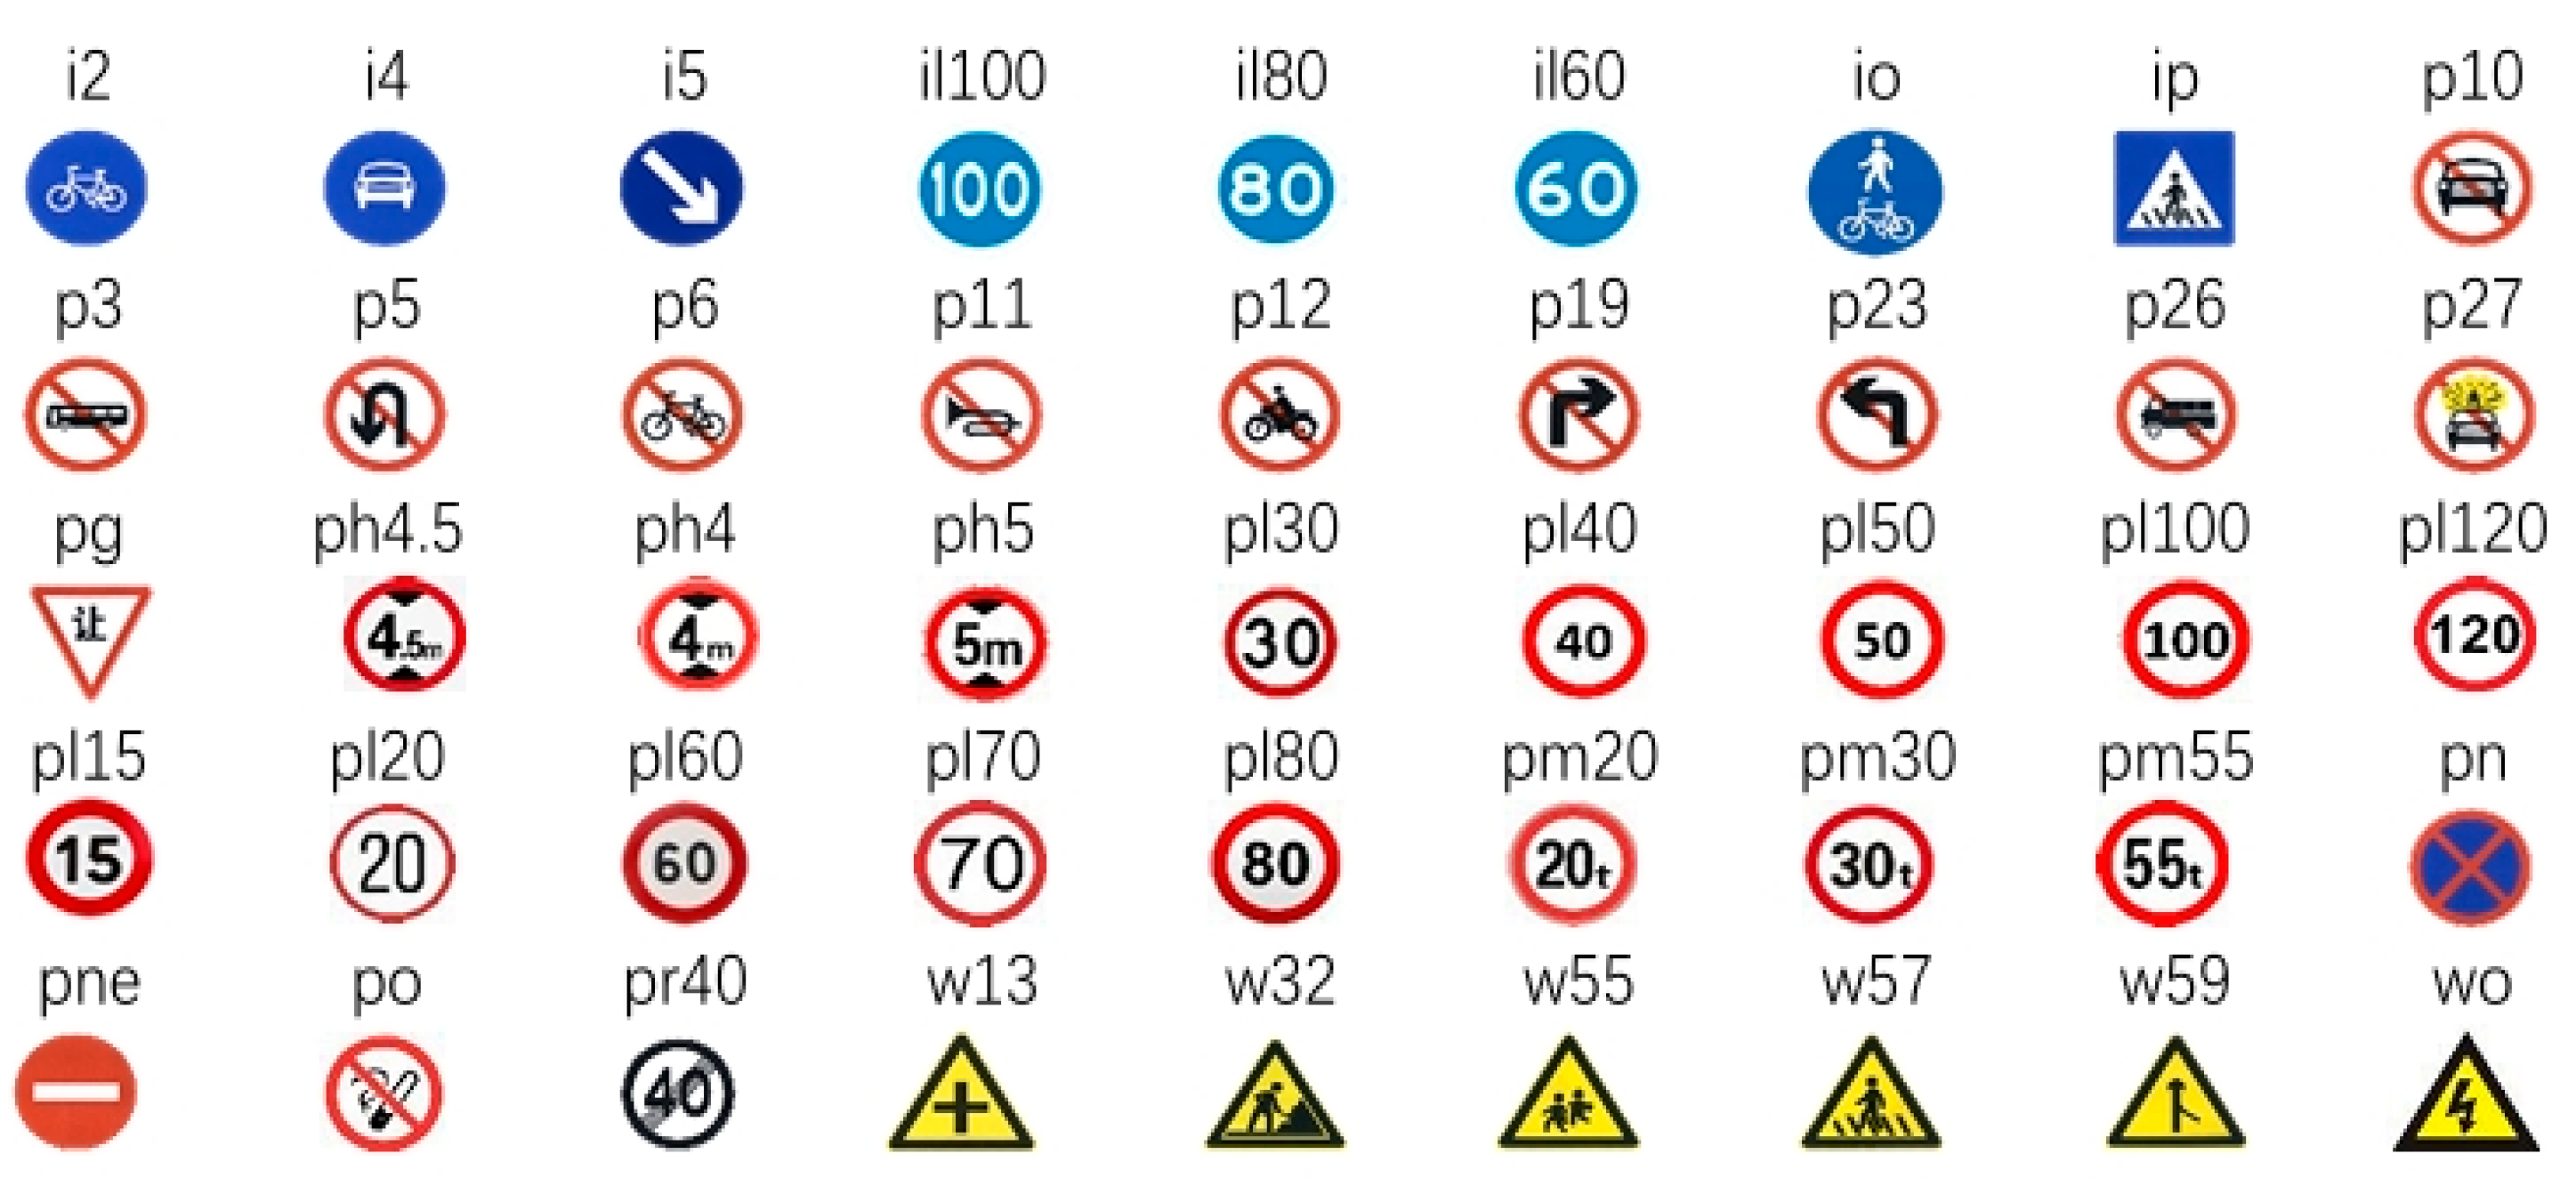
4.1. Datasets

The Tsinghua–Tencent 100K dataset is a massive, high-resolution dataset of traffic signs created by Tsinghua University and Tencent [42]. The collection comprises 100,000 photos with a resolution of 2048 × 2048, gathered from the Tencent Street View map under various lighting and weather situations. The TT100K dataset represents a practical scenario for traffic sign detection on mobile devices, containing 221 categories of Chinese traffic signs and includes over 30,000 annotated occurrences of traffic signs across 10,000 pictures. Sample images are shown in Figure 6. According to the experimental findings, the native dataset contains a substantial amount of traffic signs, with a small proportion that cannot be effectively learned. We analyzed the number of traffic signs in each dataset category to address this issue. To mitigate the sampling variations induced by the diverse categories of traffic signs in the dataset, we selected 45 categories with a count exceeding 100. The chosen images depict traffic signs of various sizes, ranging from 8 × 8 to 400 × 400 pixels. These signs constitute a small portion of the entire image, representing between 0.001% and 4% of the total area.
Figure 7 depicts a sample from the dataset. Signs prefixed with “w” denote warning signs, while those starting with “p” represent prohibition signs, and those beginning with “i” signify indication signs. Additionally, signs ending with an asterisk (*) signify numerical values, such as pl50, pl60, and pl100. The dataset comprises 9457 images, divided into three categories: 6598 for training, 970 for testing, and 1889 for validation.

4.2. Experimental Environment

Our experimental setup is detailed in Table 1. We used high-end hardware components, including an Intel i5-13490F CPU and an RTX 4070Ti GPU, complemented by 12 GB of VRAM and 16 GB of RAM. For software, we opted for Windows 11 as the operating system and Python 3.9.12 as our primary programming language. The deep learning framework employed is PyTorch 1.10.0, with CUDA 11.2 enhancing computational speed. The detailed configuration is essential for ensuring the accuracy and reproducibility of our results. We conducted 300 training epochs, and Table 2 summarizes the setup parameters for YOLO-ADual. PyTorch facilitates model training with its comprehensive suite of tools and libraries for constructing and training neural networks. Algorithm 1 outlines the training algorithm used in this study.

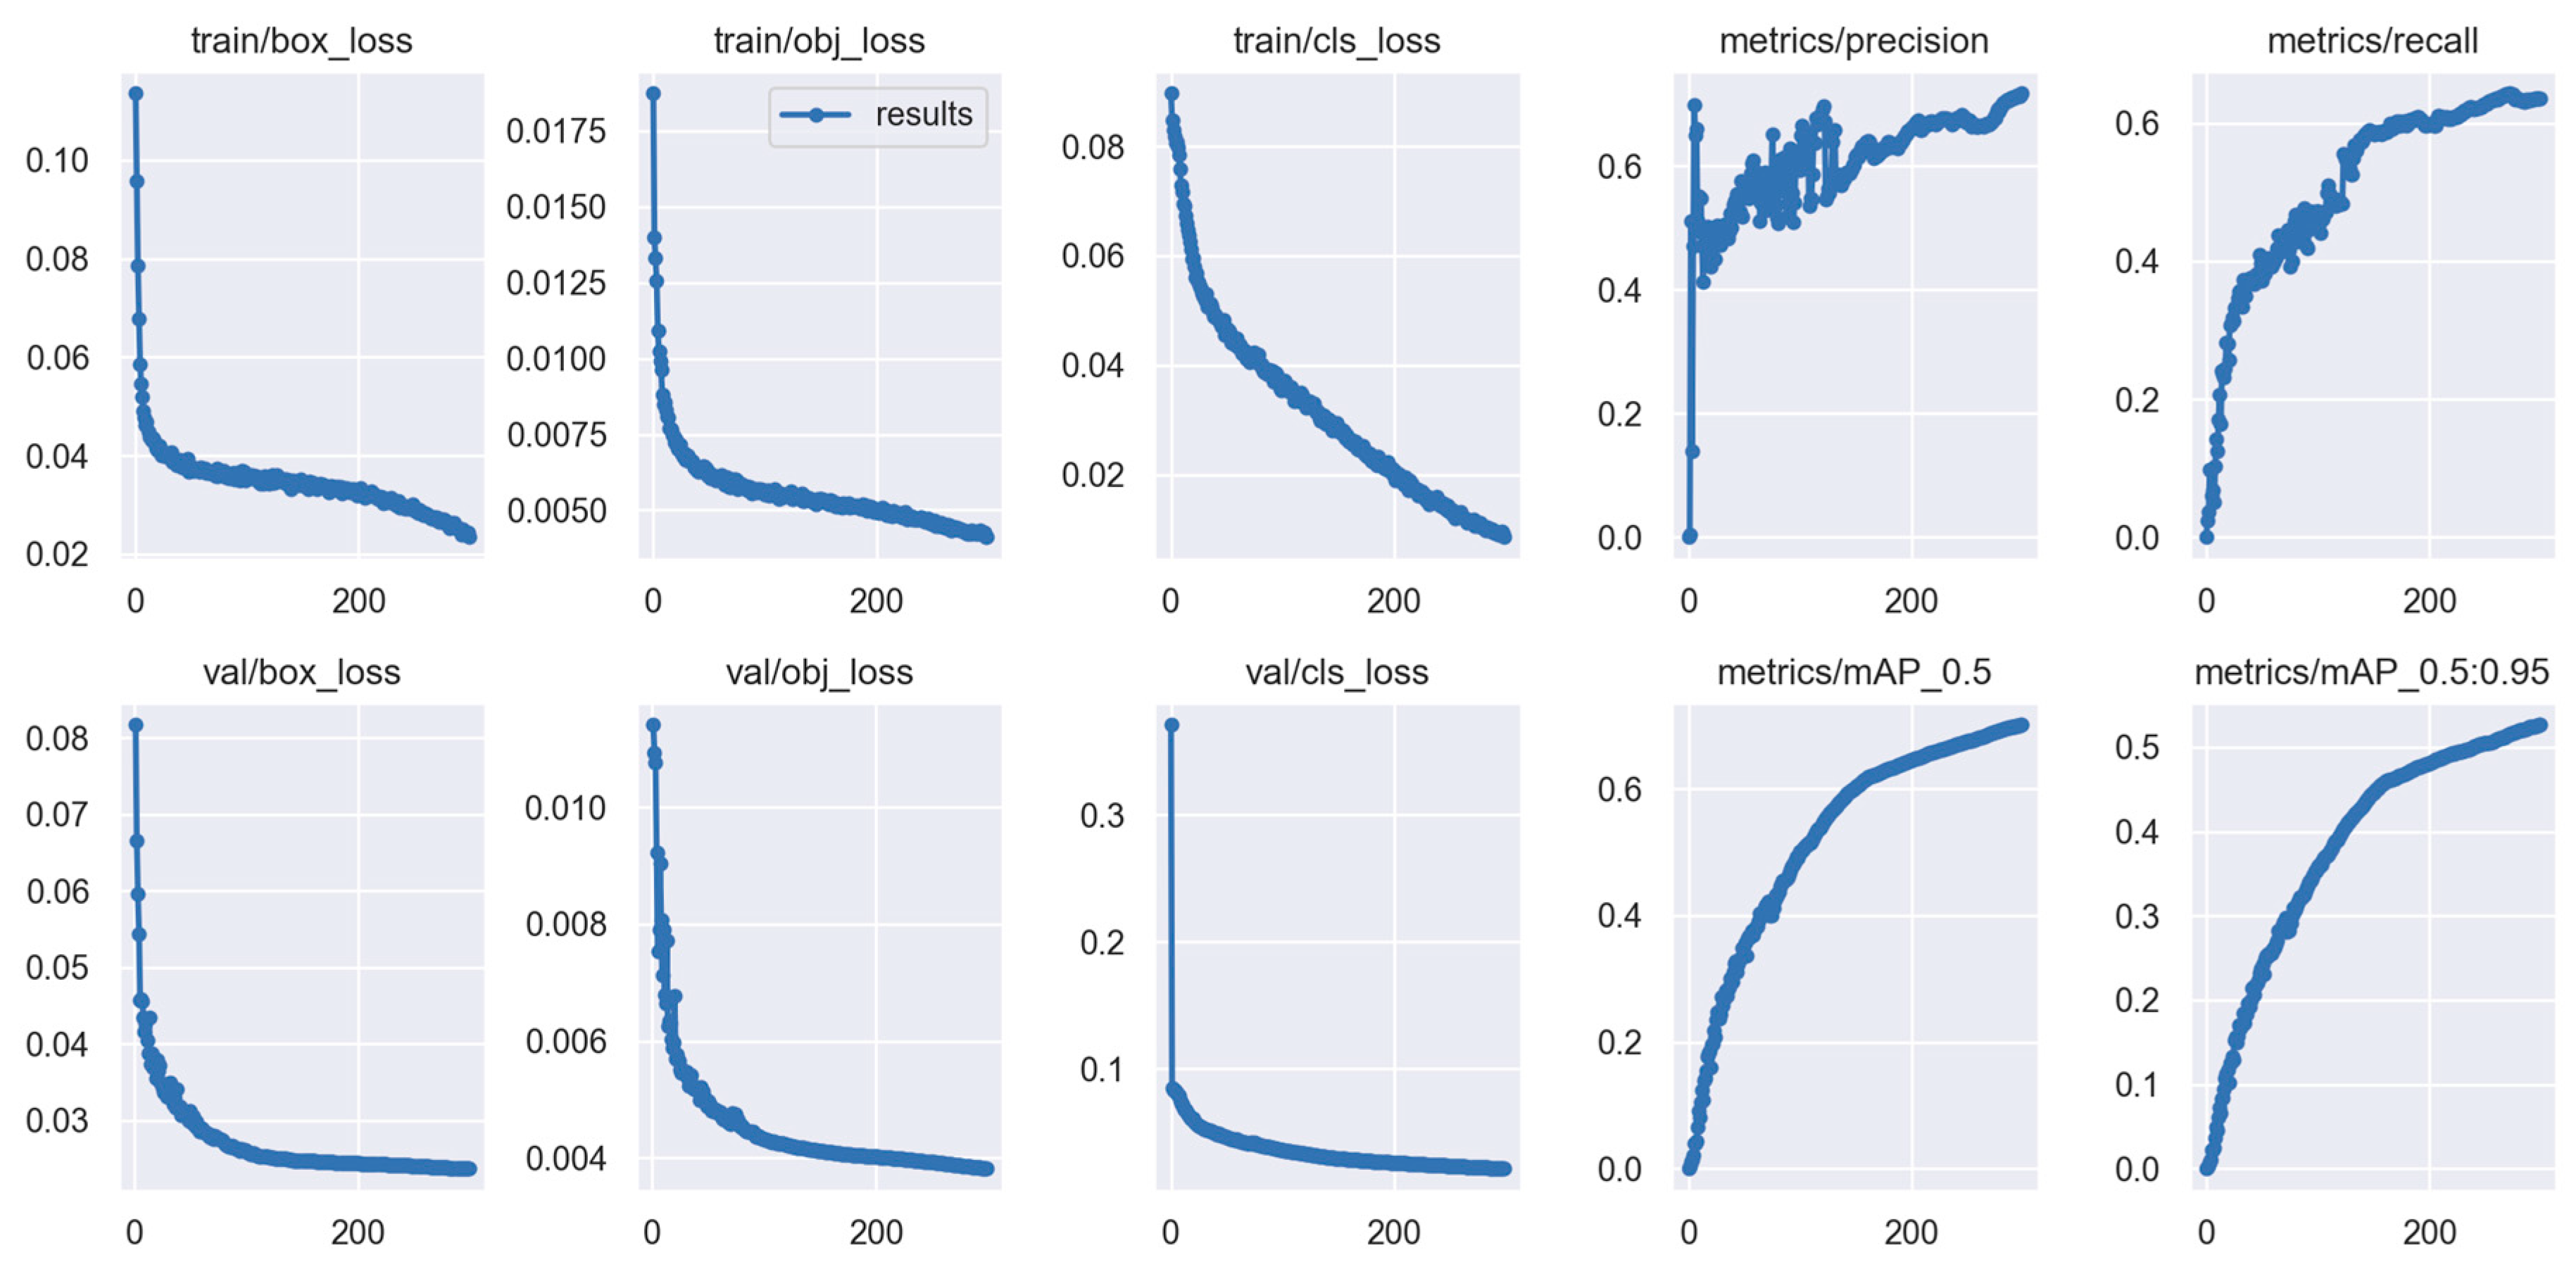
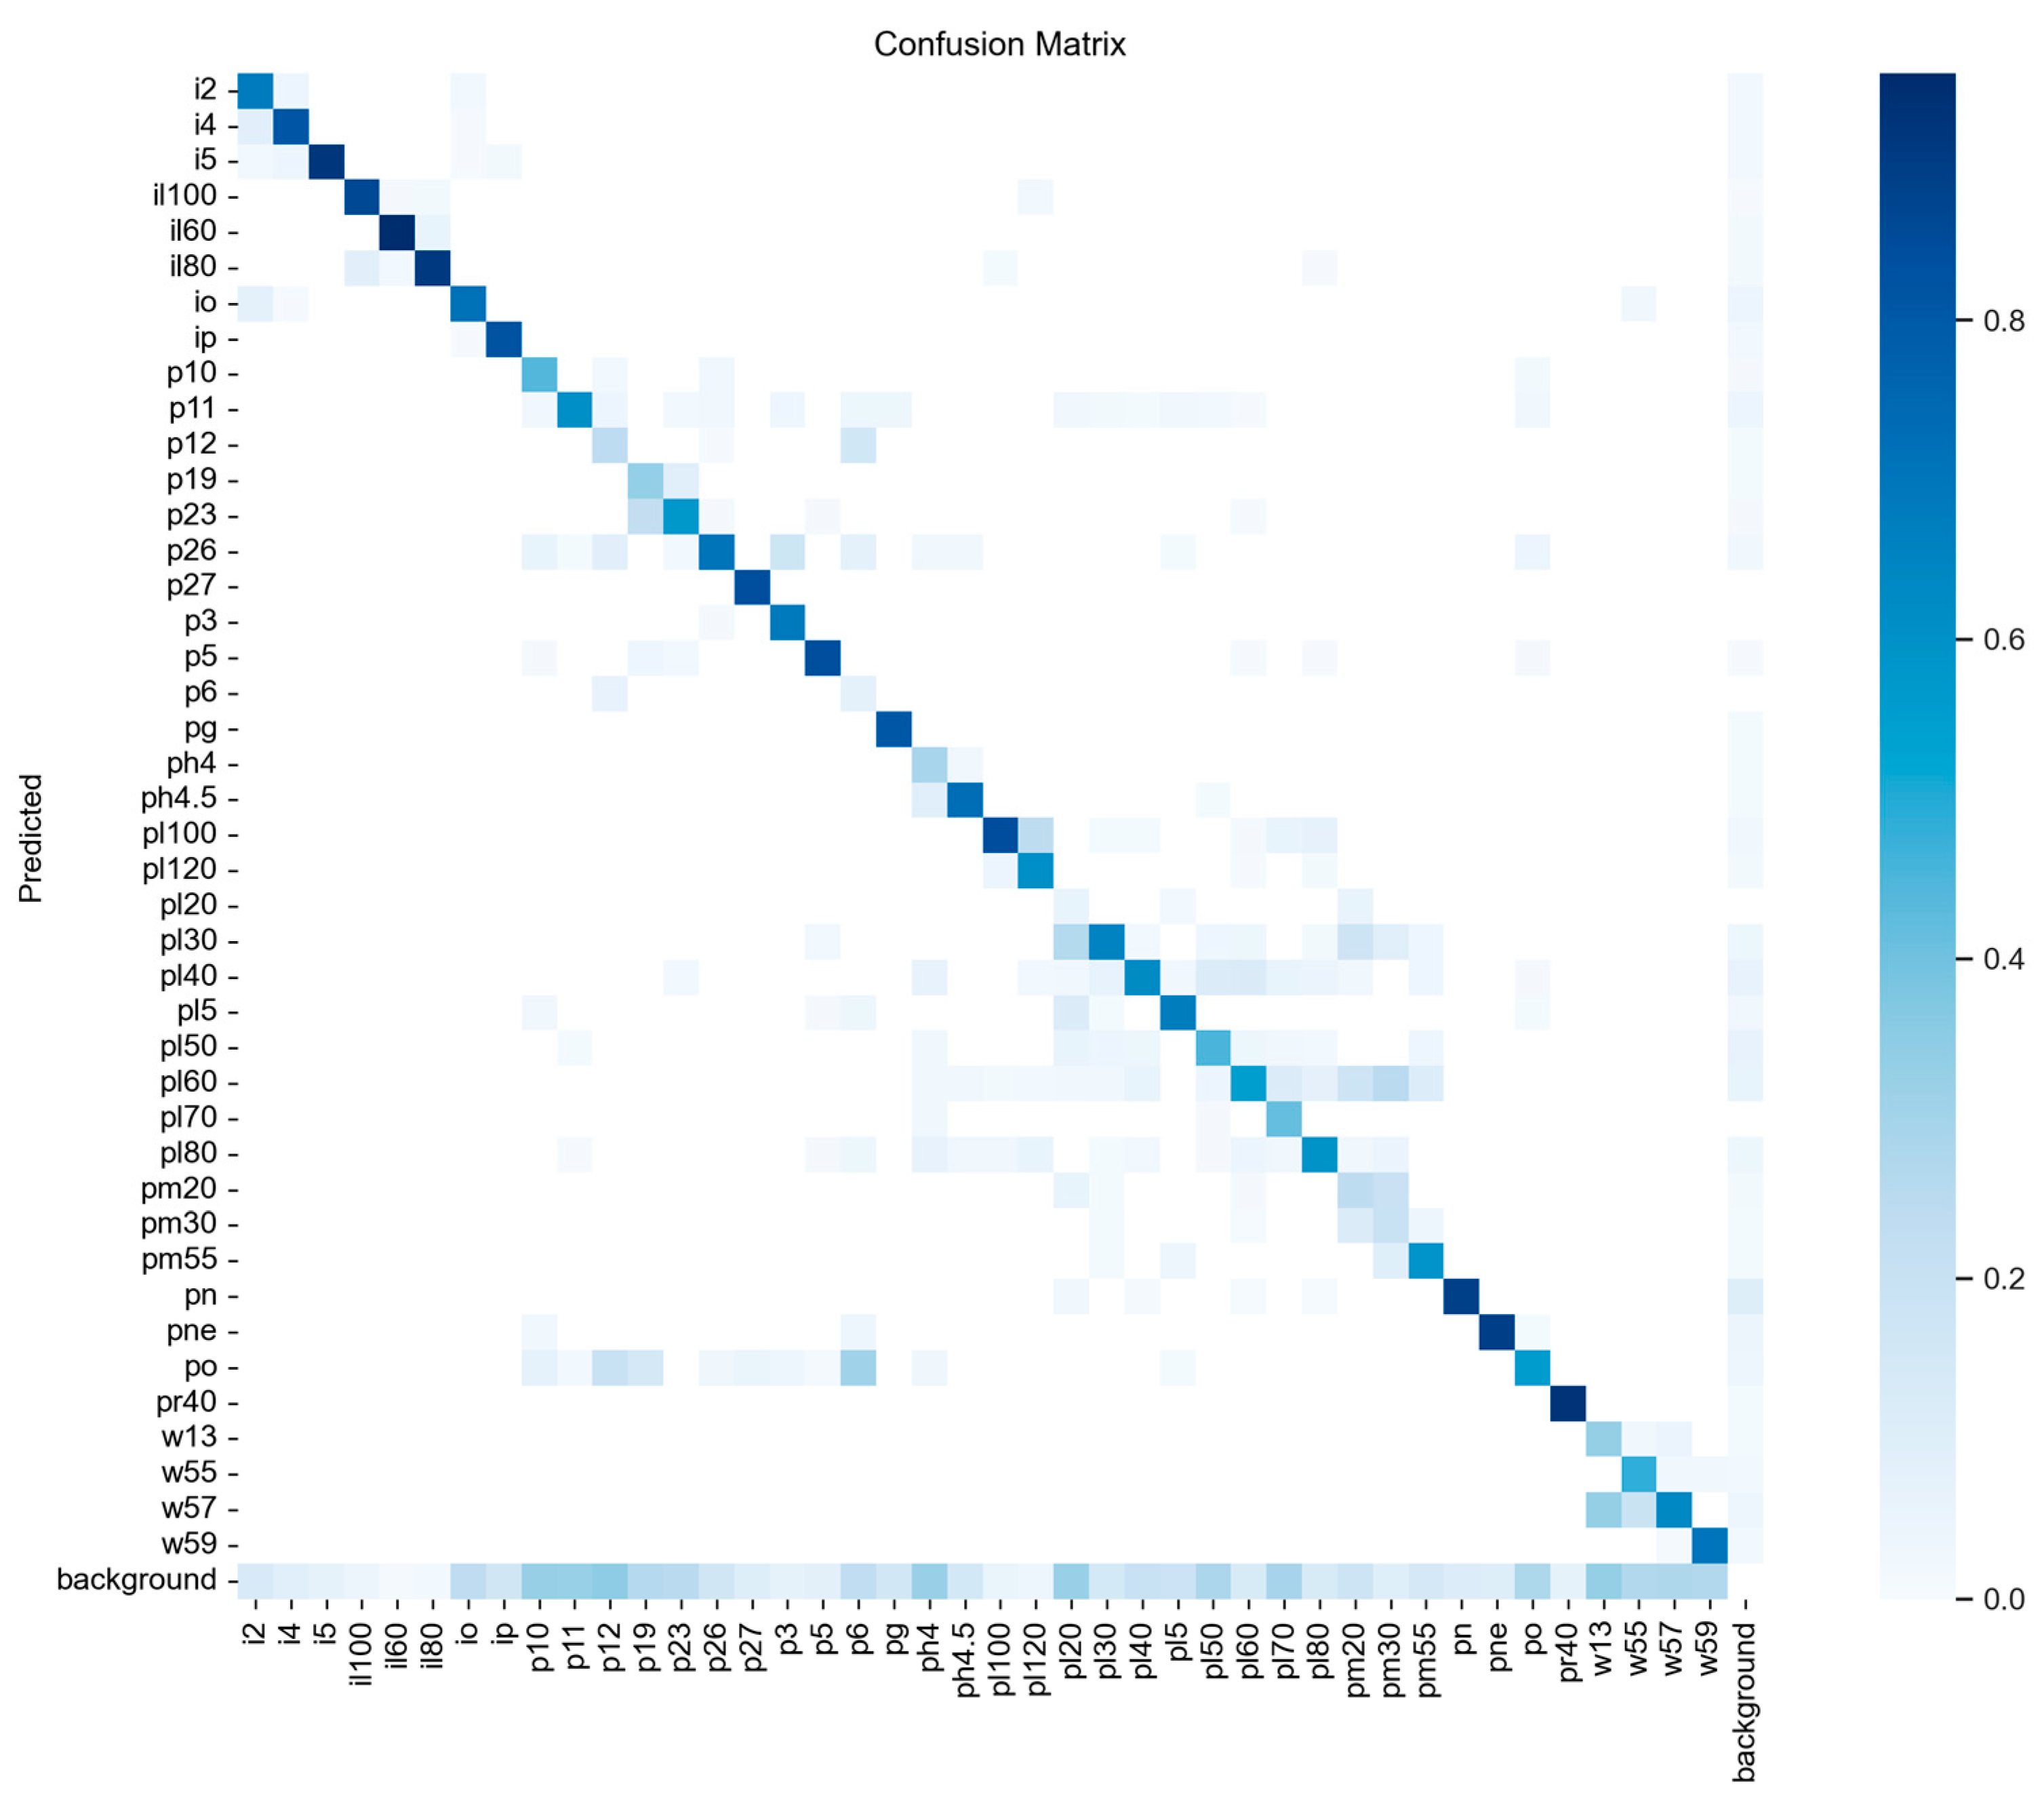
4.3. Result Analysis

Figure 8 displays the comprehensive results of the road detection model proposed in this study. Considering a range of performance metrics, our model demonstrates outstanding performance across all parameters. To illustrate the effectiveness of our proposed technique in traffic sign detection (TSD) tasks, we conducted a comparative analysis between our YOLO-ADual model and several other models, including Faster R-CNN, Zhang et al., YOLOv7-tiny, SSD, EfficientDet, YOLOX, YOLOv5n, and YOLOv5s. Among these, Faster R-CNN serves as a two-stage detector, whereas YOLO is the one-stage detector. As depicted in Table 3, Faster R-CNN exhibits suboptimal performance as a two-stage detector, achieving a [email protected] of merely 53.1%. Conversely, our YOLO-ADual model demonstrates commendable results on the TT100k dataset, with an accuracy of 71.8%, a recall of 63.23%, and a [email protected] of 70.1%. For two-stage detectors, our model’s [email protected] surpasses EfficientDet by 18.8%, Faster R-CNN by 17% and SSD by 16.84%. Moreover, relative to the YOLOv5-s model, our model shows an enhancement of 2.46% in accuracy, 0.27% in recall, and 2.5% in [email protected]. In comparison with other YOLO variants, YOLO-ADual exhibits competitive performance across all detection metrics. The improvements of YOLO-Adual over other models in key performance are shown in Table 4.
In terms of network size, the parameter count and computational requirements of YOLO-ADual are reduced to 51.83% and 64.73% of the original, respectively. YOLOv7-tiny, a notable lightweight model, has its parameters and computational load reduced by 37.68% and 17.03%, respectively, when compared to YOLO-ADual. Additionally, we compared our model with Zhang et al., a lightweight network optimized for traffic sign detection. YOLO-ADual outperforms Ghost-YOLO with a 37.68% reduction in parameters and a 14.6% improvement in [email protected]. YOLOX introduces an anchor-free approach divergent from the anchor-based method used in YOLOv3, YOLOv4, and YOLOv5. It has a parameter count and computational intensity that are comparable to YOLOv5s in terms of [email protected]. However, our YOLO-ADual model still achieves a 24% reduction in parameter count and a 4.7% higher [email protected] compared to YOLOX.
In addition to evaluating intuitive loss performance, this paper presents a classification confusion matrix, as illustrated in Figure 9. The confusion matrix summarizes the results of classification, serving as an accuracy assessment tool. Darker shades within the matrix indicate a higher recognition rate for the respective targets.

4.4. Ablation Study

To further validate the efficacy of our proposed YOLOv5s-ADual model, we conducted ablation experiments using the TT100K dataset, with the original YOLOv5s as the baseline model. The results, presented in Table 5, compare performance metrics, including [email protected], parameters, and GFLOPs. Each innovation demonstrates improvement over the baseline. Our implementation of the CBAM attention mechanism exhibits significant enhancements across all evaluation metrics, notably increasing [email protected] by 9.87% while simultaneously reducing both parameters and GFLOPs. This underscores the suitability of CBAM for detecting small traffic signs on mobile devices. Furthermore, employing solely the Adown module and C3Dual led to a reduction of approximately two million arithmetic parameters and GFLOPs, resulting in respective [email protected] improvements of 4.6% and 9.5%. The YOLO-ADual model, in contrast to the original, reduces approximately three and a half million parameters and 6.1 GFLOPs, significantly diminishing computational demands within the detection network. Notably, YOLO-ADual exhibits the lowest parameter count among the ablation experiments, demonstrating a 2.5% improvement in [email protected]. These findings affirm that YOLO-ADual not only reduces the number of operations and compresses model size but also achieves superior accuracy.

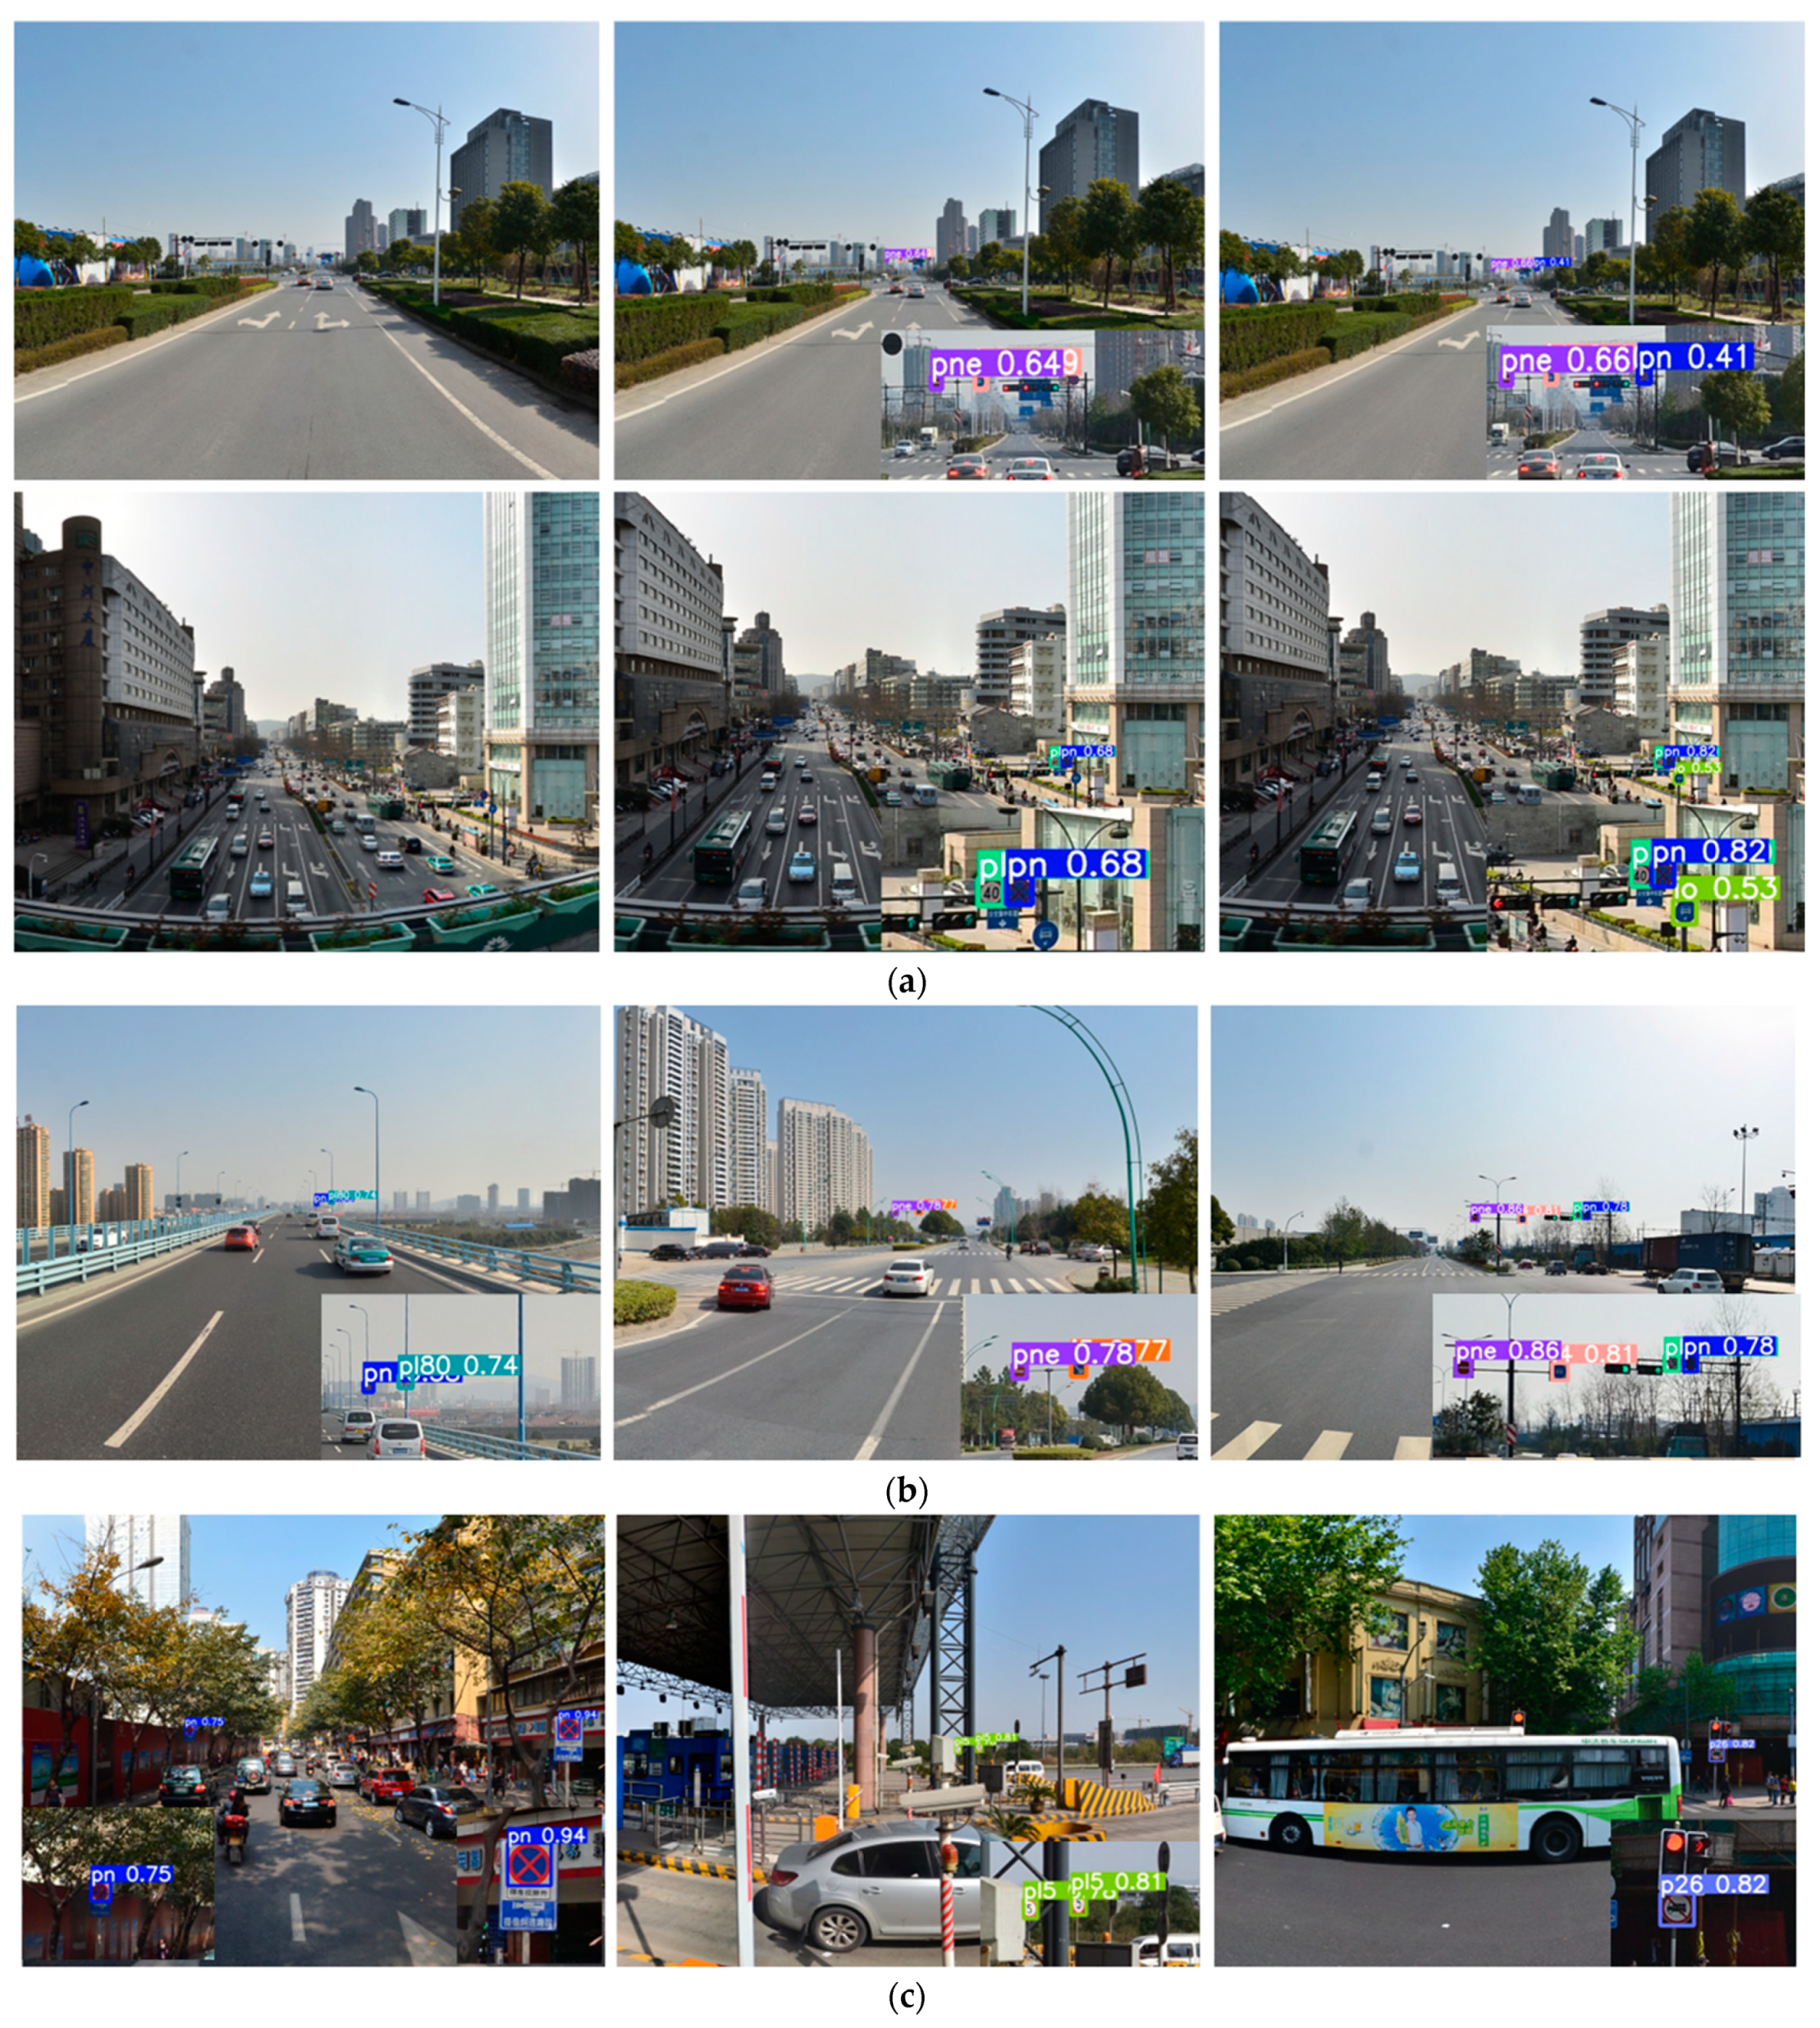
4.5. Visualization Result

To comprehensively evaluate the detection capabilities of our model, we have visualized its outputs. Figure 10a presents the detection results for both YOLOv5s and YOLO-ADual. Both models were initialized with the same learning rate and utilized the Adam optimizer. The original image is displayed in the first column, followed by the visual detection outcomes of YOLOv5s and YOLO-ADual in the second and third columns, respectively. Given the small size of the traffic sign in the original image, an enlarged version is provided in the corner to facilitate closer examination of the detection details. Upon inspecting the first comparison row in Figure 10a, it is evident that YOLO-ADual successfully detects the ‘pn’ traffic sign, whereas YOLOv5s does not. Similarly, in the second comparison row, YOLO-ADual detects the ‘io’ traffic sign, while YOLOv5s not only fails to detect ‘io’ traffic signs but also shows a significantly lower confidence level compared to our model. Figure 10b illustrates the detection results of YOLO-ADual on small targets, demonstrating the model’s proficiency in identifying distant and diminutive traffic signs with high confidence, which is crucial for traffic sign detection (TSD) tasks and the safety of autonomous vehicles. Additionally, as depicted in Figure 10c, the model showcases its capability to detect traffic signs under challenging conditions, including occlusion and shadows, and to accurately identify small targets. This highlights the model’s robustness in recognizing traffic signs amidst complex surroundings.

5. Conclusions

In this study, we present YOLO-ADual, an innovative and lightweight architecture based on the YOLOv5 framework, designed to overcome the challenges of traffic sign detection while addressing the limitations of the original YOLOv5. We enhance the model’s ability to detect smaller objects by integrating the channel attention mechanism (CBAM). Additionally, we replace the original model’s Cross-Stage Partial (CSP) module with Adown, a downsampling component adapted from YOLOv9. We also introduce the dual convolution technique within the C3 structure, creating a novel C3Dual module. This innovation not only improves the model’s precision in identifying small objects but also significantly reduces the computational and parameter requirements, achieving a lightweight configuration. Evaluation of the TT100K dataset demonstrates that YOLO-ADual strikes a commendable balance between accuracy and lightweight performance, showing resilience in detecting small targets in complex environments. Our model improves accuracy by 2.46%, recall by 0.27%, mAP by 2.5%, reduces parameters by 51.83%, and decreases computational load by 64.73%. In future research, we aim to develop even lighter models and enhance the model’s speed for mobile applications. To more closely match in-vehicle hardware configurations, we plan to experiment with lower configuration devices or vehicle-specific hardware, such as the NVIDIA Drive PX used by Tesla for the Autopilot system. We also intend to explore the impact of diverse autonomous driving conditions, including extreme weather scenarios (e.g., snow, fog, tornado) and varying levels of exposure or low light environments. These conditions may influence detection accuracy, necessitating future investigations into illumination invariant techniques and visual attention mechanisms. Overall, this study contributes to reducing hardware dependency for target detection algorithms designed for mobile devices, with significant implications for enhancing the safety of autonomous driving.

Author Contributions

Conceptualization, M.Z. and S.F.; Methodology, S.F.; Software, M.Z.; Validation S.F.; Resources, C.C. and Z.L.; Data Curation, M.Z.; Writing—Original Draft Preparation, S.F. and R.W.; Writing—Review and Editing, S.F. and C.C.; Visualization, S.F. and R.W.; Supervision, C.C. All authors have read and agreed to the published version of the manuscript.

Funding

This work was funded by the National Natural Science Foundation of China (Grant No. 62027810).

Institutional Review Board Statement

Not applicable.

Informed Consent Statement

Not applicable.

Data Availability Statement

The data presented in this study are available in TSINGHUA UNIVERSITY- TENCENT JOINT LABORATORY at https://cg.cs.tsinghua.edu.cn/traffic-sign/ (accessed on 21 June 2024). These data were derived from the following resources available in the public domain: https://cg.cs.tsinghua.edu.cn/traffic-sign/ (accessed on 21 June 2024).

Conflicts of Interest

The authors declare no conflicts of interest.

References

  1. Geiger, A.; Lenz, P.; Urtasun, R. Are We Ready for Autonomous Driving? The KITTI Vision Benchmark Suite. In Proceedings of the 2012 IEEE Conference on Computer Vision and Pattern Recognition, Providence, RI, USA, 16–21 June 2012; IEEE: Piscataway, NJ, USA, 2012; pp. 3354–3361. [Google Scholar]
  2. Simonyan, K.; Zisserman, A. Very Deep Convolutional Networks for Large-Scale Image Recognition. arXiv 2014, arXiv:14091556. [Google Scholar]
  3. Lin, T.-Y.; Goyal, P.; Girshick, R.; He, K.; Dollár, P. Focal Loss for Dense Object Detection. In Proceedings of the IEEE International Conference on Computer Vision, Venice, Italy, 22–29 October 2017; pp. 2980–2988. [Google Scholar]
  4. Liu, W.; Anguelov, D.; Erhan, D.; Szegedy, C.; Reed, S.; Fu, C.-Y.; Berg, A.C. SSD: Single Shot MultiBox Detector. In Computer Vision–ECCV 2016; Leibe, B., Matas, J., Sebe, N., Welling, M., Eds.; Lecture Notes in Computer Science; Springer International Publishing: Cham, Switzerland, 2016; Volume 9905, pp. 21–37. ISBN 978-3-319-46447-3. [Google Scholar]
  5. Lopez-Montiel, M.; Orozco-Rosas, U.; Sánchez-Adame, M.; Picos, K.; Ross, O.H.M. Evaluation Method of Deep Learning-Based Embedded Systems for Traffic Sign Detection. IEEE Access 2021, 9, 101217–101238. [Google Scholar] [CrossRef]
  6. Zhou, L.; Deng, Z. LIDAR and Vision-Based Real-Time Traffic Sign Detection and Recognition Algorithm for Intelligent Vehicle. In Proceedings of the 17th International IEEE Conference on Intelligent Transportation Systems (ITSC), Qingdao, China, 8–11 October 2014; IEEE: Piscataway, NJ, USA, 2014; pp. 578–583. [Google Scholar]
  7. Rajbhandari, S.; Ruwase, O.; Rasley, J.; Smith, S.; He, Y. Zero-Infinity: Breaking the Gpu Memory Wall for Extreme Scale Deep Learning. In Proceedings of the International Conference for High Performance Computing, Networking, Storage and Analysis, St. Louis, MO, USA, 14–19 November 2021; pp. 1–14. [Google Scholar]
  8. Mittal, U.; Chawla, P.; Tiwari, R. EnsembleNet: A Hybrid Approach for Vehicle Detection and Estimation of Traffic Density Based on Faster R-CNN and YOLO Models. Neural Comput. Appl. 2023, 35, 4755–4774. [Google Scholar] [CrossRef]
  9. Ghahremannezhad, H.; Shi, H.; Liu, C. Object Detection in Traffic Videos: A Survey. IEEE Trans. Intell. Transp. Syst. 2023, 24, 6780–6799. [Google Scholar] [CrossRef]
  10. Arora, N.; Kumar, Y.; Karkra, R.; Kumar, M. Automatic Vehicle Detection System in Different Environment Conditions Using Fast R-CNN. Multimed. Tools Appl. 2022, 81, 18715–18735. [Google Scholar] [CrossRef]
  11. Chollet, F. Xception: Deep Learning with Depthwise Separable Convolutions. In Proceedings of the IEEE Conference on Computer Vision and Pattern Recognition, Honolulu, HI, USA, 21–26 July 2017; pp. 1251–1258. [Google Scholar]
  12. Iandola, F.N.; Han, S.; Moskewicz, M.W.; Ashraf, K.; Dally, W.J.; Keutzer, K. SqueezeNet: AlexNet-Level Accuracy with 50x Fewer Parameters and <0.5 MB Model Size. arXiv 2016, arXiv:160207360. [Google Scholar]
  13. Howard, A.G.; Zhu, M.; Chen, B.; Kalenichenko, D.; Wang, W.; Weyand, T.; Andreetto, M.; Adam, H. Mobilenets: Efficient Convolutional Neural Networks for Mobile Vision Applications. arXiv 2017, arXiv:170404861. [Google Scholar]
  14. Zhang, X.; Zhou, X.; Lin, M.; Sun, J. Shufflenet: An Extremely Efficient Convolutional Neural Network for Mobile Devices. In Proceedings of the IEEE Conference on Computer Vision and Pattern Recognition, Salt Lake City, UT, USA, 18–23 June 2018; pp. 6848–6856. [Google Scholar]
  15. Redmon, J.; Divvala, S.; Girshick, R.; Farhadi, A. You Only Look Once: Unified, Real-Time Object Detection. In Proceedings of the IEEE Conference on Computer Vision and Pattern Recognition, Las Vegas, NV, USA, 27–30 June 2016; pp. 779–788. [Google Scholar]
  16. Xia, X.; Xu, C.; Nan, B. Inception-v3 for Flower Classification. In Proceedings of the 2017 2nd International Conference on Image, Vision and Computing (ICIVC), Chengdu, China, 2–4 June 2017; IEEE: Piscataway, NJ, USA, 2017; pp. 783–787. [Google Scholar]
  17. Krizhevsky, A.; Sutskever, I.; Hinton, G.E. ImageNet Classification with Deep Convolutional Neural Networks. In Proceedings of the Advances in Neural Information Processing Systems; Pereira, F., Burges, C.J., Bottou, L., Weinberger, K.Q., Eds.; Curran Associates, Inc.: Red Hook, NJ, USA, 2012; Volume 25. [Google Scholar]
  18. Koonce, B. MobileNetV3. In Convolutional Neural Networks with Swift for Tensorflow; Apress: Berkeley, CA, USA, 2021; pp. 125–144. ISBN 978-1-4842-6167-5. [Google Scholar]
  19. Liu, Y.; Lu, B.; Peng, J.; Zhang, Z. Research on the Use of YOLOv5 Object Detection Algorithm in Mask Wearing Recognition. World Sci. Res. J. 2020, 6, 276–284. [Google Scholar] [CrossRef]
  20. Liu, X.; Zhang, R.; Meng, Z.; Hong, R.; Liu, G. On Fusing the Latent Deep CNN Feature for Image Classification. World Wide Web 2019, 22, 423–436. [Google Scholar] [CrossRef]
  21. Purkait, P.; Zhao, C.; Zach, C. SPP-Net: Deep Absolute Pose Regression with Synthetic Views. arXiv 2017, arXiv:171203452. [Google Scholar]
  22. Dai, J.; Li, Y.; He, K.; Sun, J. R-FCN: Object Detection via Region-Based Fully Convolutional Networks. In Proceedings of the Advances in Neural Information Processing Systems; Lee, D., Sugiyama, M., Luxburg, U., Guyon, I., Garnett, R., Eds.; Curran Associates, Inc.: Red Hook, NJ, USA, 2016; Volume 29. [Google Scholar]
  23. Lin, T.-Y.; Dollár, P.; Girshick, R.; He, K.; Hariharan, B.; Belongie, S. Feature Pyramid Networks for Object Detection. In Proceedings of the IEEE Conference on Computer Vision and Pattern Recognition, Honolulu, HI, USA, 21–26 July 2017; pp. 2117–2125. [Google Scholar]
  24. Zhang, S.; Che, S.; Liu, Z.; Zhang, X. A Real-Time and Lightweight Traffic Sign Detection Method Based on Ghost-YOLO. Multimed. Tools Appl. 2023, 82, 26063–26087. [Google Scholar] [CrossRef]
  25. Liu, P.; Xie, Z.; Li, T. UCN-YOLOv5: Traffic Sign Object Detection Algorithm Based on Deep Learning. IEEE Access 2023, 11, 110039–110050. [Google Scholar] [CrossRef]
  26. Li, Z.; Chen, H.; Biggio, B.; He, Y.; Cai, H.; Roli, F.; Xie, L. Toward Effective Traffic Sign Detection via Two-Stage Fusion Neural Networks. IEEE Trans. Intell. Transp. Syst. 2024, 1–12, early access. [Google Scholar] [CrossRef]
  27. Ahmad, T.; Ma, Y.; Yahya, M.; Ahmad, B.; Nazir, S.; Haq, A. ul Object Detection through Modified YOLO Neural Network. Sci. Program. 2020, 2020, 8403262. [Google Scholar]
  28. Redmon, J.; Farhadi, A. Yolov3: An Incremental Improvement. arXiv 2018, arXiv:180402767. [Google Scholar]
  29. Bochkovskiy, A.; Wang, C.-Y.; Liao, H.-Y.M. Yolov4: Optimal Speed and Accuracy of Object Detection. arXiv 2020, arXiv:200410934. [Google Scholar]
  30. Sohan, M.; Sai Ram, T.; Reddy, R.; Venkata, C. A Review on Yolov8 and Its Advancements. In Proceedings of the International Conference on Data Intelligence and Cognitive Informatics; Springer: Singapore, 2024; pp. 529–545. [Google Scholar]
  31. Li, S.; Wang, S.; Wang, P. A Small Object Detection Algorithm for Traffic Signs Based on Improved YOLOv7. Sensors 2023, 23, 7145. [Google Scholar] [CrossRef]
  32. Selcuk, B.; Serif, T. A Comparison of YOLOv5 and YOLOv8 in the Context of Mobile UI Detection. In Mobile Web and Intelligent Information Systems; Younas, M., Awan, I., Grønli, T.-M., Eds.; Lecture Notes in Computer Science; Springer Nature Switzerland: Cham, Switzerland, 2023; Volume 13977, pp. 161–174. ISBN 978-3-031-39763-9. [Google Scholar]
  33. Bian, H.; Liu, Y.; Shi, L.; Lin, Z.; Huang, M.; Zhang, J.; Weng, G.; Zhang, C.; Gao, M. Detection Method of Helmet Wearing Based on UAV Images and Yolov7. In Proceedings of the 2023 IEEE 6th Information Technology, Networking, Electronic and Automation Control Conference (ITNEC), Chongqing, China, 24 February 2023; IEEE: Piscataway, NJ, USA, 2023; pp. 1633–1640. [Google Scholar]
  34. Yusof, N.I.M.; Sophian, A.; Zaki, H.F.M.; Bawono, A.A.; Ashraf, A. Assessing the Performance of YOLOv5, YOLOv6, and YOLOv7 in Road Defect Detection and Classification: A Comparative Study. Bull. Electr. Eng. Inform. 2024, 13, 350–360. [Google Scholar] [CrossRef]
  35. Wang, C.-Y.; Yeh, I.-H.; Liao, H.-Y.M. YOLOv9: Learning What You Want to Learn Using Programmable Gradient Information. arXiv 2024, arXiv:240213616. [Google Scholar]
  36. Zheng, Y.; Cui, Y.; Gao, X. An Infrared Dim-Small Target Detection Method Based on Improved YOLOv7. In Proceedings of the 2023 Asia Conference on Computer Vision, Image Processing and Pattern Recognition, Phuket, Thailand, 28 April 2023; ACM: New York, NY, USA; pp. 1–5. [Google Scholar]
  37. Zhong, J.; Chen, J.; Mian, A. DualConv: Dual Convolutional Kernels for Lightweight Deep Neural Networks. IEEE Trans. Neural Netw. Learn. Syst. 2022, 34, 9528–9535. [Google Scholar] [CrossRef]
  38. Woo, S.; Park, J.; Lee, J.-Y.; Kweon, I.S. Cbam: Convolutional Block Attention Module. In Proceedings of the European conference on computer vision (ECCV), Munich, Germany, 8–14 September 2018; pp. 3–19. [Google Scholar]
  39. Li, Y.; Gong, Z.; Zhou, Y.; He, Y.; Huang, R. Production Evaluation of Citrus Fruits Based on the YOLOv5 Compressed by Knowledge Distillation. In Proceedings of the 2023 26th International Conference on Computer Supported Cooperative Work in Design (CSCWD), Rio de Janeiro, Brazil, 24 May 2023; IEEE: Piscataway, NJ, USA, 2023; pp. 1938–1943. [Google Scholar]
  40. Kingma, D.P.; Ba, J. Adam: A Method for Stochastic Optimization. arXiv 2014, arXiv:1412.6980. [Google Scholar]
  41. Gower, R.M.; Loizou, N.; Qian, X.; Sailanbayev, A.; Shulgin, E.; Richtárik, P. SGD: General Analysis and Improved Rates. In Proceedings of the International Conference on Machine Learning, Long Beach, CA, USA, 9–15 June 2019; PMLR, 2019; Volume 97, pp. 5200–5209. [Google Scholar]
  42. Zhu, Z.; Liang, D.; Zhang, S.; Huang, X.; Li, B.; Hu, S. Traffic-Sign Detection and Classification in the Wild. In Proceedings of the IEEE Conference on Computer Vision and Pattern Recognition, Las Vegas, NV, USA, 27–30 June 2016; pp. 2110–2118. [Google Scholar]
  43. Ren, S.; He, K.; Girshick, R.; Sun, J. Faster R-CNN: Towards Real-Time Object Detection with Region Proposal Networks. IEEE Trans. Pattern Anal. Mach. Intell. 2017, 39, 1137–1149. [Google Scholar] [CrossRef] [PubMed]
  44. Liu, W.; Anguelov, D.; Erhan, D.; Szegedy, C.; Reed, S.; Fu, C.-Y.; Berg, A.C. Ssd: Single Shot Multibox Detector. In Proceedings of the Computer Vision–ECCV 2016: 14th European Conference, Amsterdam, The Netherlands, 11–14 October 2016; Proceedings, Part I 14. Springer: Berlin/Heidelberg, Germany, 2016; pp. 21–37. [Google Scholar]
  45. Tan, M.; Pang, R.; Le, Q.V. Efficientdet: Scalable and Efficient Object Detection. Proceedings of 2020 IEEE/CVF Conference on Computer Vision and Pattern Recognition (CVPR 2020), Seattle, WA, USA, 14–19 June 2020; pp. 10781–10790. [Google Scholar]
  46. Ge, Z.; Liu, S.; Wang, F.; Li, Z.; Sun, J. Yolox: Exceeding Yolo Series in 2021. arXiv 2021, arXiv:2107.08430. [Google Scholar]
Figure 1. The overall architecture of YOLO-ADual.
Wevj 15 00323 g001
Figure 2. The overall architecture of YOLOv5s.
Wevj 15 00323 g002
Figure 3. (a) The structure of the Adown module, which is used in YOLOv9 as a downsample network, and (b) the structure of transition block, which is used in YOLOv7 as a downsample network.
Wevj 15 00323 g003
Figure 4. Diagram of the structure of the group convolution technique utilized by DualConv.
Wevj 15 00323 g004
Figure 5. (a) The structure of the Convolutional Block Attention Module (CBAM); (b) the structure of the channel attention module (CAM); (c) the structure of the Spatial Attention Module (SAM).
Wevj 15 00323 g005
Figure 6. Sample images of the TT100k dataset.
Wevj 15 00323 g006
Figure 7. Forty-five categories of traffic signs selected from TT100k.
Wevj 15 00323 g007
Figure 8. The result of YOLO-ADual.
Wevj 15 00323 g008
Figure 9. YOLO-ADual confusion matrix on test set.
Wevj 15 00323 g009
Figure 10. Visualization outcomes on the TT100K dataset include (a) a comparative analysis of the results between YOLOv5s and YOLO-ADual, (b) detection outcomes for small targets, and (c) detection performance in challenging conditions such as shadows, occlusions, and cloudy weather.
Wevj 15 00323 g010
Table 1. YOLO-ADual configuration parameters.
ParametersSpecific Information
Epoch300
Image size640
Batch size32
Number of images9457
Parameters3,817,609
Layers246
Table 2. Experimental configuration environment.
ConfigurationNameSpecific Information
Hardware EnvironmentCPUIntel(R) core(TM)i5-13490F
GPUNVIDIA GeForce RTX4070Ti
VRAM12 GB
Memory16 GB
Software EnvironmentOperating SystemWindows 11
Python Version3.9.12
PyTorch Version2.0.0
CUDA Version11.8
Table 3. Comparative experimental results between YOLO-ADual and other object lightweight detection algorithms. Bold represents the best result.
MethodPrecisionRecall[email protected]ParamsGFLOPs
Faster R-CNN [43]47.9153.7953.1--
Zhang et al. [24]56.1052.1055.56,655,2328.6
SSD [44]51.4553.7653.26641,4733.1
EfficientDet [45]68.8046.4051.305,524,6839.4
YOLOv7-tiny [31]61.7057.2059.96,125,93413.5
YOLOX [46]64.4758.2765.45,044,79715.30
YOLOv5n67.9045.1048.81,820,7434.4
YOLOv5s69.3463.2367.67,365,67117.3
YOLO-ADual71.8063.5070.13,817,60911.2
Table 4. Percentage improvements of YOLO-ADual over other models in key performance metrics. The table only shows the percentage with a lift; the percentage without a lift is blank.
MethodPrecision ImprovementRecall Improvement[email protected] ImprovementParams ReductionGFLOPs Reduction
Faster R-CNN [43]49.88%18.05%32.0%
Zhang et al. [24]28.08%21.92%26.12%42.65%
SSD [44]39.50%17.87%31.59%
EfficientDet [45]4.36%36.68%36.61%30.91%
YOLOv7-tiny [31]16.30%11.03%17.07%37.68%17.03%
YOLOX [46]11.37%9.01%7.25%24.59%26.80%
YOLOv5n5.73%40.77%43.65%
YOLOv5s3.55%0.43%3.7%48.17%35.26%
Table 5. Comparison of ablation experiment results.
MethodCBAMADownC3Dual[email protected]ParamsGFLOPs
YOLOv5s 67.67,365,67117.3
YOLOv5s 77.477,156,26516.2
YOLOv5s 72.25,468,90312.9
YOLOv5s 77.15,828,90313.0
YOLOv5s 67.875,501,76912.9
YOLOv5s 69.64,163,7199.5
YOLOv5s70.13,817,60911.2
Disclaimer/Publisher’s Note: The statements, opinions and data contained in all publications are solely those of the individual author(s) and contributor(s) and not of MDPI and/or the editor(s). MDPI and/or the editor(s) disclaim responsibility for any injury to people or property resulting from any ideas, methods, instructions or products referred to in the content.

