Article

Experimental Investigation of a Distributed Architecture for EV Chargers Performing Frequency Control

by
Simone Striani
*,
Kristoffer Laust Pedersen
,
Jan Engelhardt
and
Mattia Marinelli
*
Department of Wind and Energy Systems, Technical University of Denmark, 4000 Roskilde, Denmark
*
Authors to whom correspondence should be addressed.
World Electr. Veh. J. 2024, 15(8), 361; https://doi.org/10.3390/wevj15080361
Submission received: 28 June 2024 / Revised: 4 August 2024 / Accepted: 8 August 2024 / Published: 11 August 2024

Abstract

:
The demand for electric vehicle supply equipment (EVSE) is increasing because of the rapid shift toward electric transport. Introducing EVSE on a large scale into the power grid can increase power demand volatility, negatively affecting frequency stability. A viable solution to this challenge is the development of smart charging technologies capable of performing frequency regulation. This paper presents an experimental proof of concept for a new frequency regulation method for EVSE utilizing a distributed control architecture. The architecture dynamically adjusts the contribution of electric vehicles (EVs) to frequency regulation response based on the charging urgency assigned by the EV users. The method is demonstrated with two Renault ZOEs responding to frequency fluctuation with a combined power range of 6 kW in the frequency range of 50.1 to 49.9 Hz. The results confirm consistent power sharing and effective frequency regulation, with the system controlling the engagement of the EVs in frequency regulation based on priority. The delay and accuracy analyses reveal a fast and accurate response, with the cross-correlation indicating an 8.48 s delay and an average undershoot of 0.17 kW. In the conclusions, the paper discusses prospective improvements and outlines future research directions for integrating EVs as service providers.

Graphical Abstract

1. Introduction

Smart EV charging technologies leverage the storage capabilities of EVs to make them controllable demand-side resources, crucial for the development of smart grids [1]. These technologies offer flexibility services beneficial to distribution and transmission system operators [2] and delay expensive grid upgrades required because of the growing demand from electric transportation [3]. Moreover, EVs can contribute to grid stability by offsetting power fluctuations from renewable energy sources [4]. This study presents an experimental demonstration for frequency regulation using smart chargers under a distributed control system, where each EV adjusts its charging power in response to grid frequency changes based on user input. Traditionally, frequency stability has relied on conventional power plants known for their quick responsiveness and high inertia [5]. However, the rise of renewable energy sources challenges this stability by reducing overall system inertia [6]. Commercializing frequency regulation through frequency flexibility markets allows power producers and consumers to offer balancing power services [7]. With their substantial storage capacity, EV fleets can significantly contribute to frequency regulation [8], offering benefits to the transmission system, charging point operators, and EV users [9]. These advantages include enhanced grid stability, potential revenue, and reduced charging costs [10].
Distributed architectures are mostly unexplored for smart charging applications. Previous research in EV charging infrastructure has predominantly focused on centralized control architectures involving a single central unit managing each charger. Centralized control offers operational transparency and optimal performance, yet it faces challenges with scalability, vulnerability to cyber-attacks, and privacy issues [11]. Decentralized control operates through local units, offering scalability and robustness with simpler communication and direct user control, but it lacks optimal performance because of the absence of global coordination [12]. Distributed control systems integrate centralized and decentralized approaches, using central and local components for comprehensive grid management. This hybrid approach harnesses the strengths of both systems, providing precise, scalable, and robust control solutions [13,14].
The experimental evidence of the technical feasibility of frequency regulation via EVSE provided in this study contributes to the research literature on the topic, where most existing studies rely on computational analyses and focus on its economic potential. In addition, current research on frequency regulation focuses on centralized and decentralized systems, often via vehicle-to-grid (V2G) approaches [15], despite most existing EVs only being capable of unidirectional charging. Indeed, although V2G technology has high economic potential, there remains a lack of standardization [16], as well as technological and regulatory readiness, for its full deployment [17]. Thingvad et al. [18] analyzed the economic viability of employing a fleet of 10 EVs for frequency regulation in the Danish grid, comparing the potential of unidirectional and V2G systems. Their findings indicated that while bidirectional systems can generate higher revenue for aggregators and EV owners, they also incur more significant energy losses and necessitate additional equipment. The authors proposed a novel scheduling strategy leveraging historical frequency data to optimize capacity and revenue for market actors. Regarding computational analysis, the research literature presents different methods for frequency regulation. Yao et al. [19] proposed a robust optimization framework for scheduling EV frequency regulation capacity under a performance-based compensation scheme to maximize user revenue. The study in [20] introduced a fuzzy control-based smart charging method for EVs, demonstrating its effectiveness in reducing frequency deviations in simulation tests. Orihara et al. [21] explored a decentralized V2G system contributing to frequency regulation and battery state-of-charge (SOC) synchronization, highlighting its potential for future research comparing it with centralized systems. Other authors explored the coordination of EV charging with large-scale heat pumps [22] or with local energy storage [23] for frequency regulation, both addressing battery degradation issues. Meng et al. [24] developed a strategy for dynamic frequency control using EV clusters, taking into account the travel behavior of EVs, focusing on stabilizing frequency fluctuations and improving economic operation. Experimental studies primarily conducted by the Technical University of Denmark with a centralized control architecture have provided insights into the practical application of frequency regulation. Marinelli et al. [25] tested the performance of commercial EVs in primary frequency control with a centralized control architecture, suggesting improvements for system response. A field test with a V2G EV fleet performing frequency normal reserve under a centralized control scheme was proposed in [26]. The experimental investigation, conducted over five years, provided significant insights into battery degradation. The study concluded that battery degradation from power cycling of the EVs is minimal compared to the calendar degradation.
This paper contributes to research on frequency regulation via EVSE with the following key innovations: Firstly, the paper introduces a distributed architecture approach to smart EV charging, offering a promising alternative to the commonly studied centralized and decentralized systems. Secondly, the designed system allows individual users to engage in frequency regulation to varying degrees based on their charging needs. Charging prioritization is unavailable in deployed chargers and is fundamental to smart charging development. Lastly, the paper provides a proof-of-concept demonstrating the technical feasibility of frequency regulation using EV chargers. This contribution is of utmost importance in the absence of literature presenting empirical evidence of frequency regulation using unidirectional EV chargers with distributed control architecture. Overall, this paper proves the technical feasibility of frequency regulation through an EV charging system with a lean yet robust system architecture, a first step toward integrating unidirectional EV clusters in frequency markets.
The remainder of this paper is organized as follows: Section 2 presents a theoretical overview of the control concept, including the control and communication system design. Section 3 details the physical implementation of the control concept, providing a clear guide for other researchers who wish to replicate the results. Section 4 presents and discusses the key findings. Finally, Section 5 offers conclusions and outlines perspectives on future work.

2. Methods

This chapter outlines the control concept deployed in this study. Section 2.1 presents a general introduction to the system components and the computational intelligence in the cloud server, named cloud aggregator (CA), and in the charger, named virtual aggregator (VA). This section then provides a mathematical description of CA control in Section 2.2 and VA control in Section 2.3.

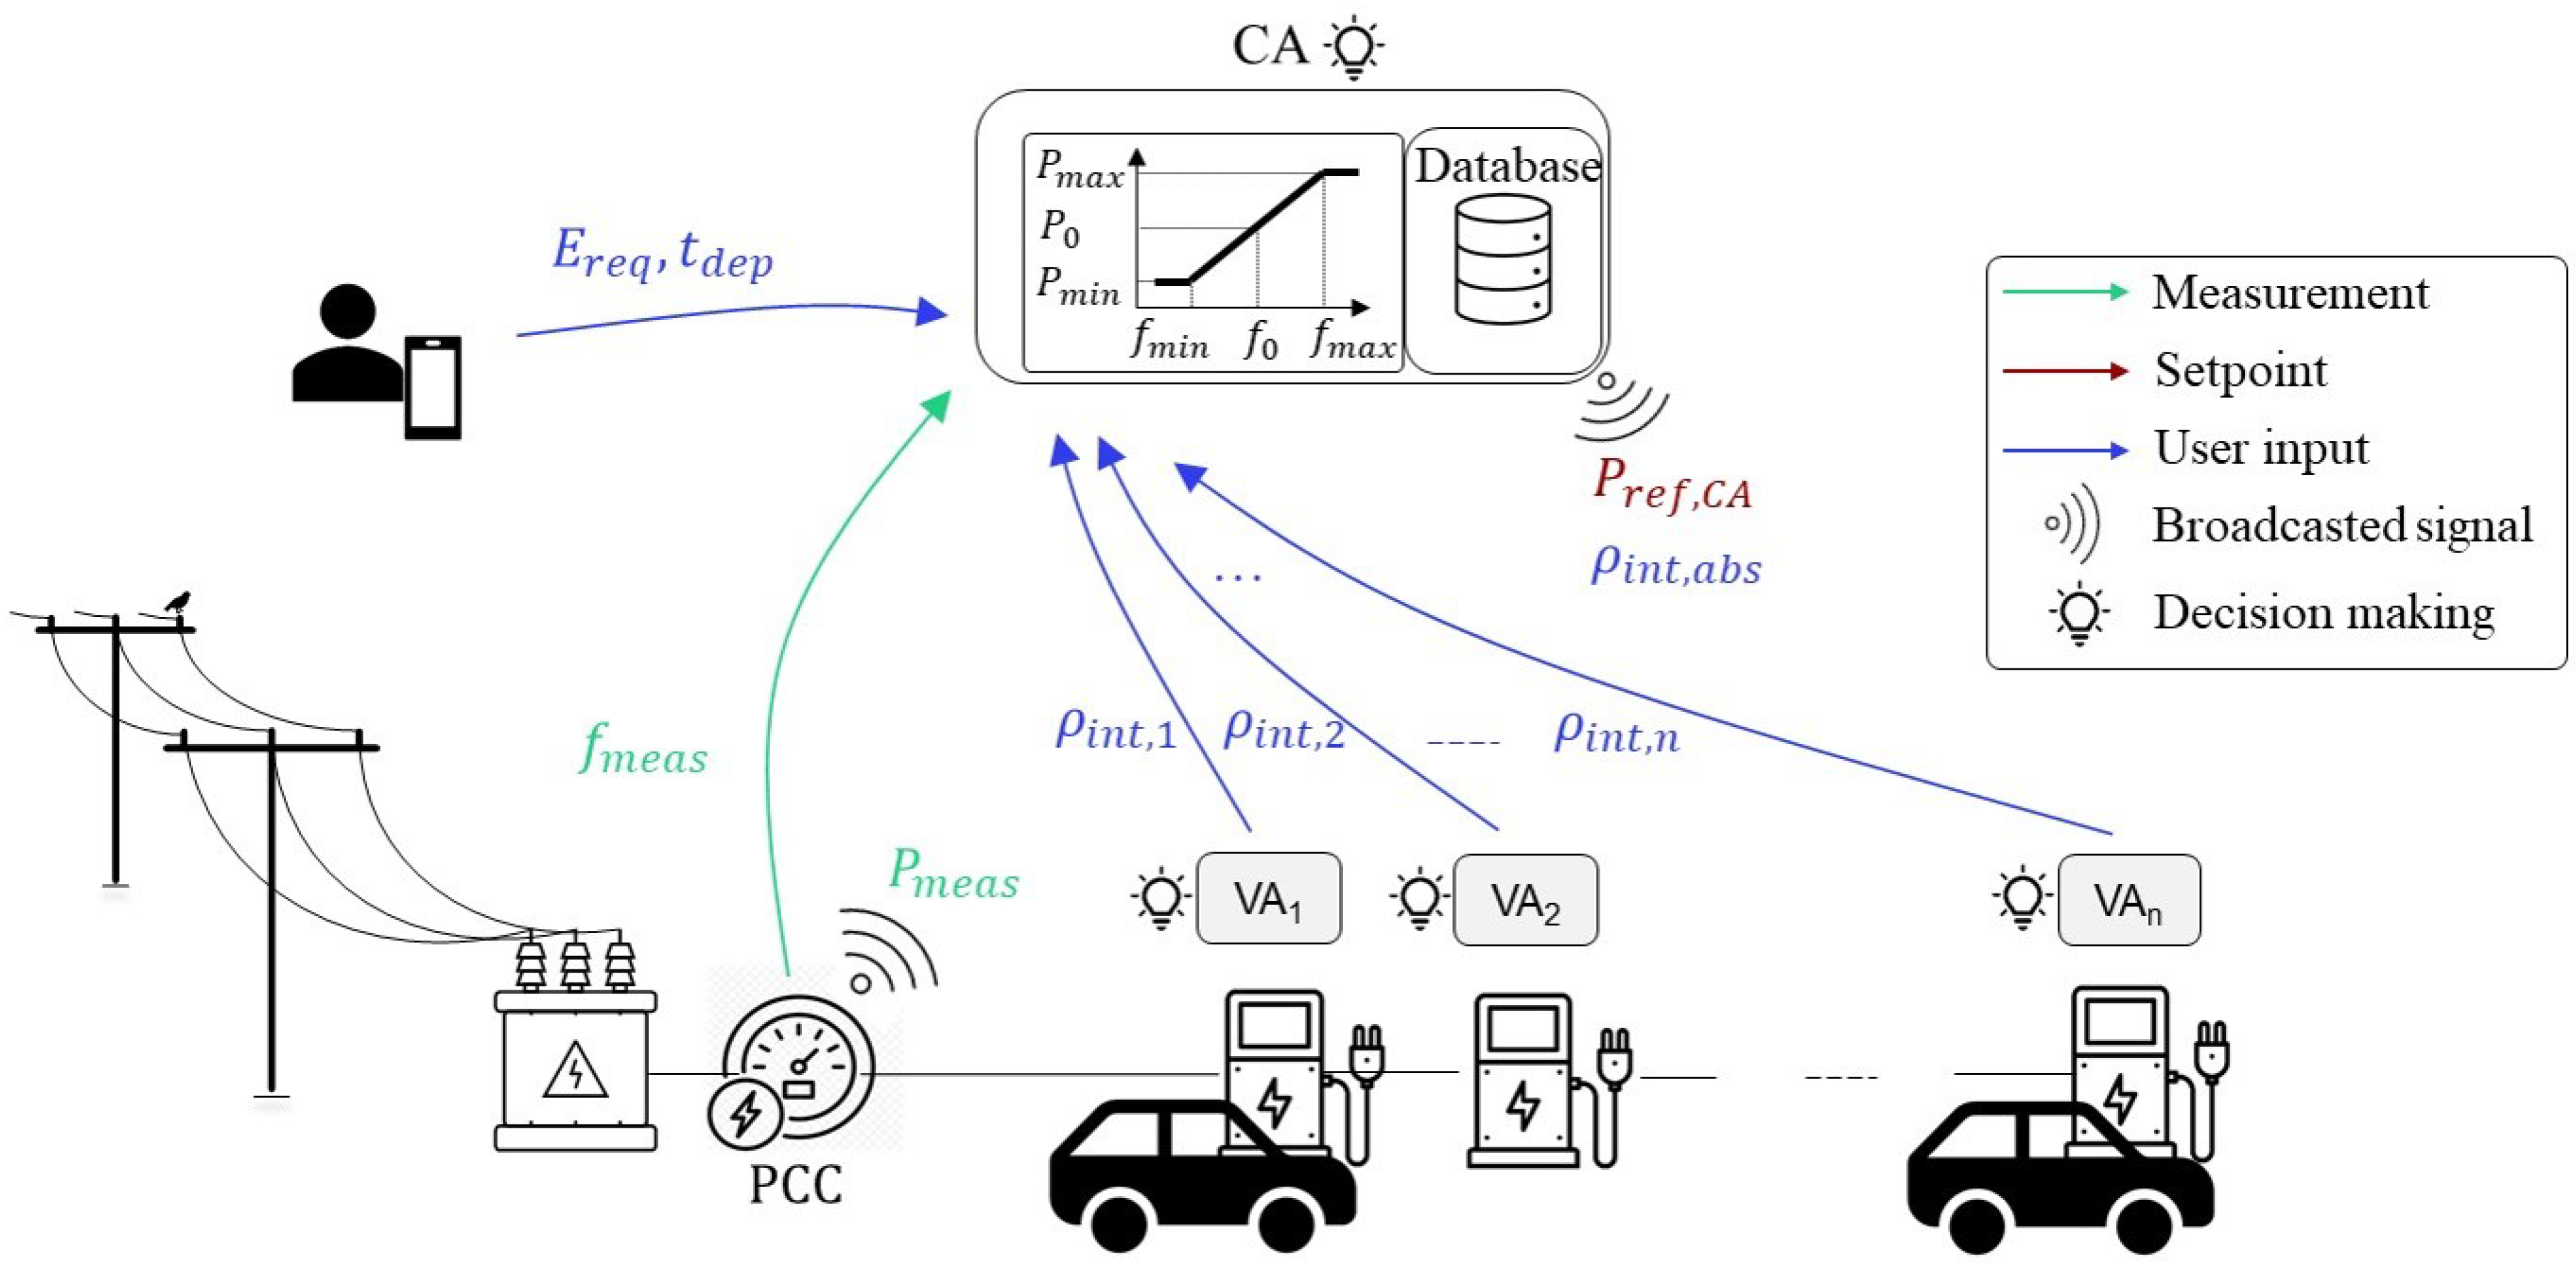
2.1. Description of the Control Concept: CA, VA, and Priority

The distributed control concept includes double-layer control: The control of the cluster as a whole is performed by the CA, a computational intelligence located in a cloud server. The autonomous control of each charger is managed by the VA embedded within each charger [27]. Figure 1 illustrates the communication architecture with a simplified block diagram. The cluster of chargers connects to the grid at the point of common coupling (PCC), where a smart meter reads their consumption and grid conditions. The meter provides frequency and consumed power measurements at the PCC and sends them to the CA and the VAs. A user interface allows users to input the energy requested and the departure time for the charging session. The inputs are directly communicated to the VA of the respective charger and are fundamental for the power-sharing among the VAs.

2.2. Controller in the CA

The CA is the global intelligence, and it has three main functions. Firstly, it receives frequency measurements f m e a s from the meter. Secondly, it translates these inputs into power set points ( P C A r e f ) based on the droop control characteristic. Thirdly, it broadcasts the power set points to the VAs of the cluster. The droop control in the CA is defined as
P C A r e f = P 0 + k d r o o p · ( f 0 f measured )
The power range allocated to frequency regulation, denoted as P b i d , is set to ± 3 kW in our demonstration. P b i d defines P m a x and P m i n , where P 0 is the power set point at 50 Hz ( f 0 ). P m a x and P m i n determine the controllable range of P C A r e f . The droop control coefficient k d r o o p is calculated as ( P m a x P m i n ) / Δ f . Each iteration of the CA ends with the broadcast of P C A r e f to the VAs.

2.3. Controller in the VA

The P C A r e f is retrieved by the VAs together with the power measurement P m e a s from the meter at the PCC. Each VA also stores the user inputs received by the user interface. The user inputs are the energy requested by the user E r e q and the departure time t d e p . The inputs are used to calculate the internal priority ρ i n t of each VA as
ρ i n t = E r e q E c h a r g e d ( t d e p t 0 ) · P r a t e d , E V S E
In the formula, E c h a r g e d is the energy charged by the EV, measured by the plug during the charging session, t 0 is the current time, and P r a t e d , E V S E is the rated power of the plug. ρ i n t is a value between 0 and 1.
ρ i n t is an intermediate step for the calculation of the relative priority ρ r , which is a control parameter of the VA. Indeed, each VA shares its ρ i n t with all the VAs through the CA. Then, each VA calculates its relative priority ρ r as:
ρ r = ρ i n t i = 1 N E V s ρ i n t , i
where i = 1 N E V s ρ i n t , i (denoted as ρ i n t , a b s in the figure) represents the summation of the internal priorities of all the chargers. While ρ i n t is shared among the VAs, ρ r is not shared among the chargers.
Knowing the power error for the whole cluster ( P e r r o r , P C C = P C A r e f P m e a s ) and ρ r , each VA can calculate the power reference as
P r e f , i = P r e f , i 1 + P e r r o r , P C C · ρ r P e r r o r , P C C > 0 P r e f , i 1 + P e r r o r , P C C · ( 1 ρ r ) P e r r o r , P C C < 0
In the formula, i corresponds to the current iteration of the controller, and i 1 corresponds to the previous iteration. Equation (4), applied in two different scenarios based on the sign of P e r r o r , P C C , outlines the operation of a PI controller with integral gain K i set to 1. The proportional gain K p varies, being directly proportional to ρ r when P e r r o r , P C C > 0 and to ( 1 ρ r ) when P e r r o r , P C C < 0 . This control approach ensures that EVs with higher priority will more readily increase their power demand in response to positive errors while reducing it less when the error is negative. In contrast, lower-priority EVs will have a smaller increase in power demand for positive errors and a larger decrease for negative errors. This strategy guarantees that EVs maintain their allocated share of power consumption dynamically, adapting to continuous changes in error, which may result from frequency fluctuations. Each VA calculates its power reference P r e f , i and communicates it to its charging plug. The control loop completes with feedback on power and frequency measurements provided by the meter at the PCC to the VAs and the CA.

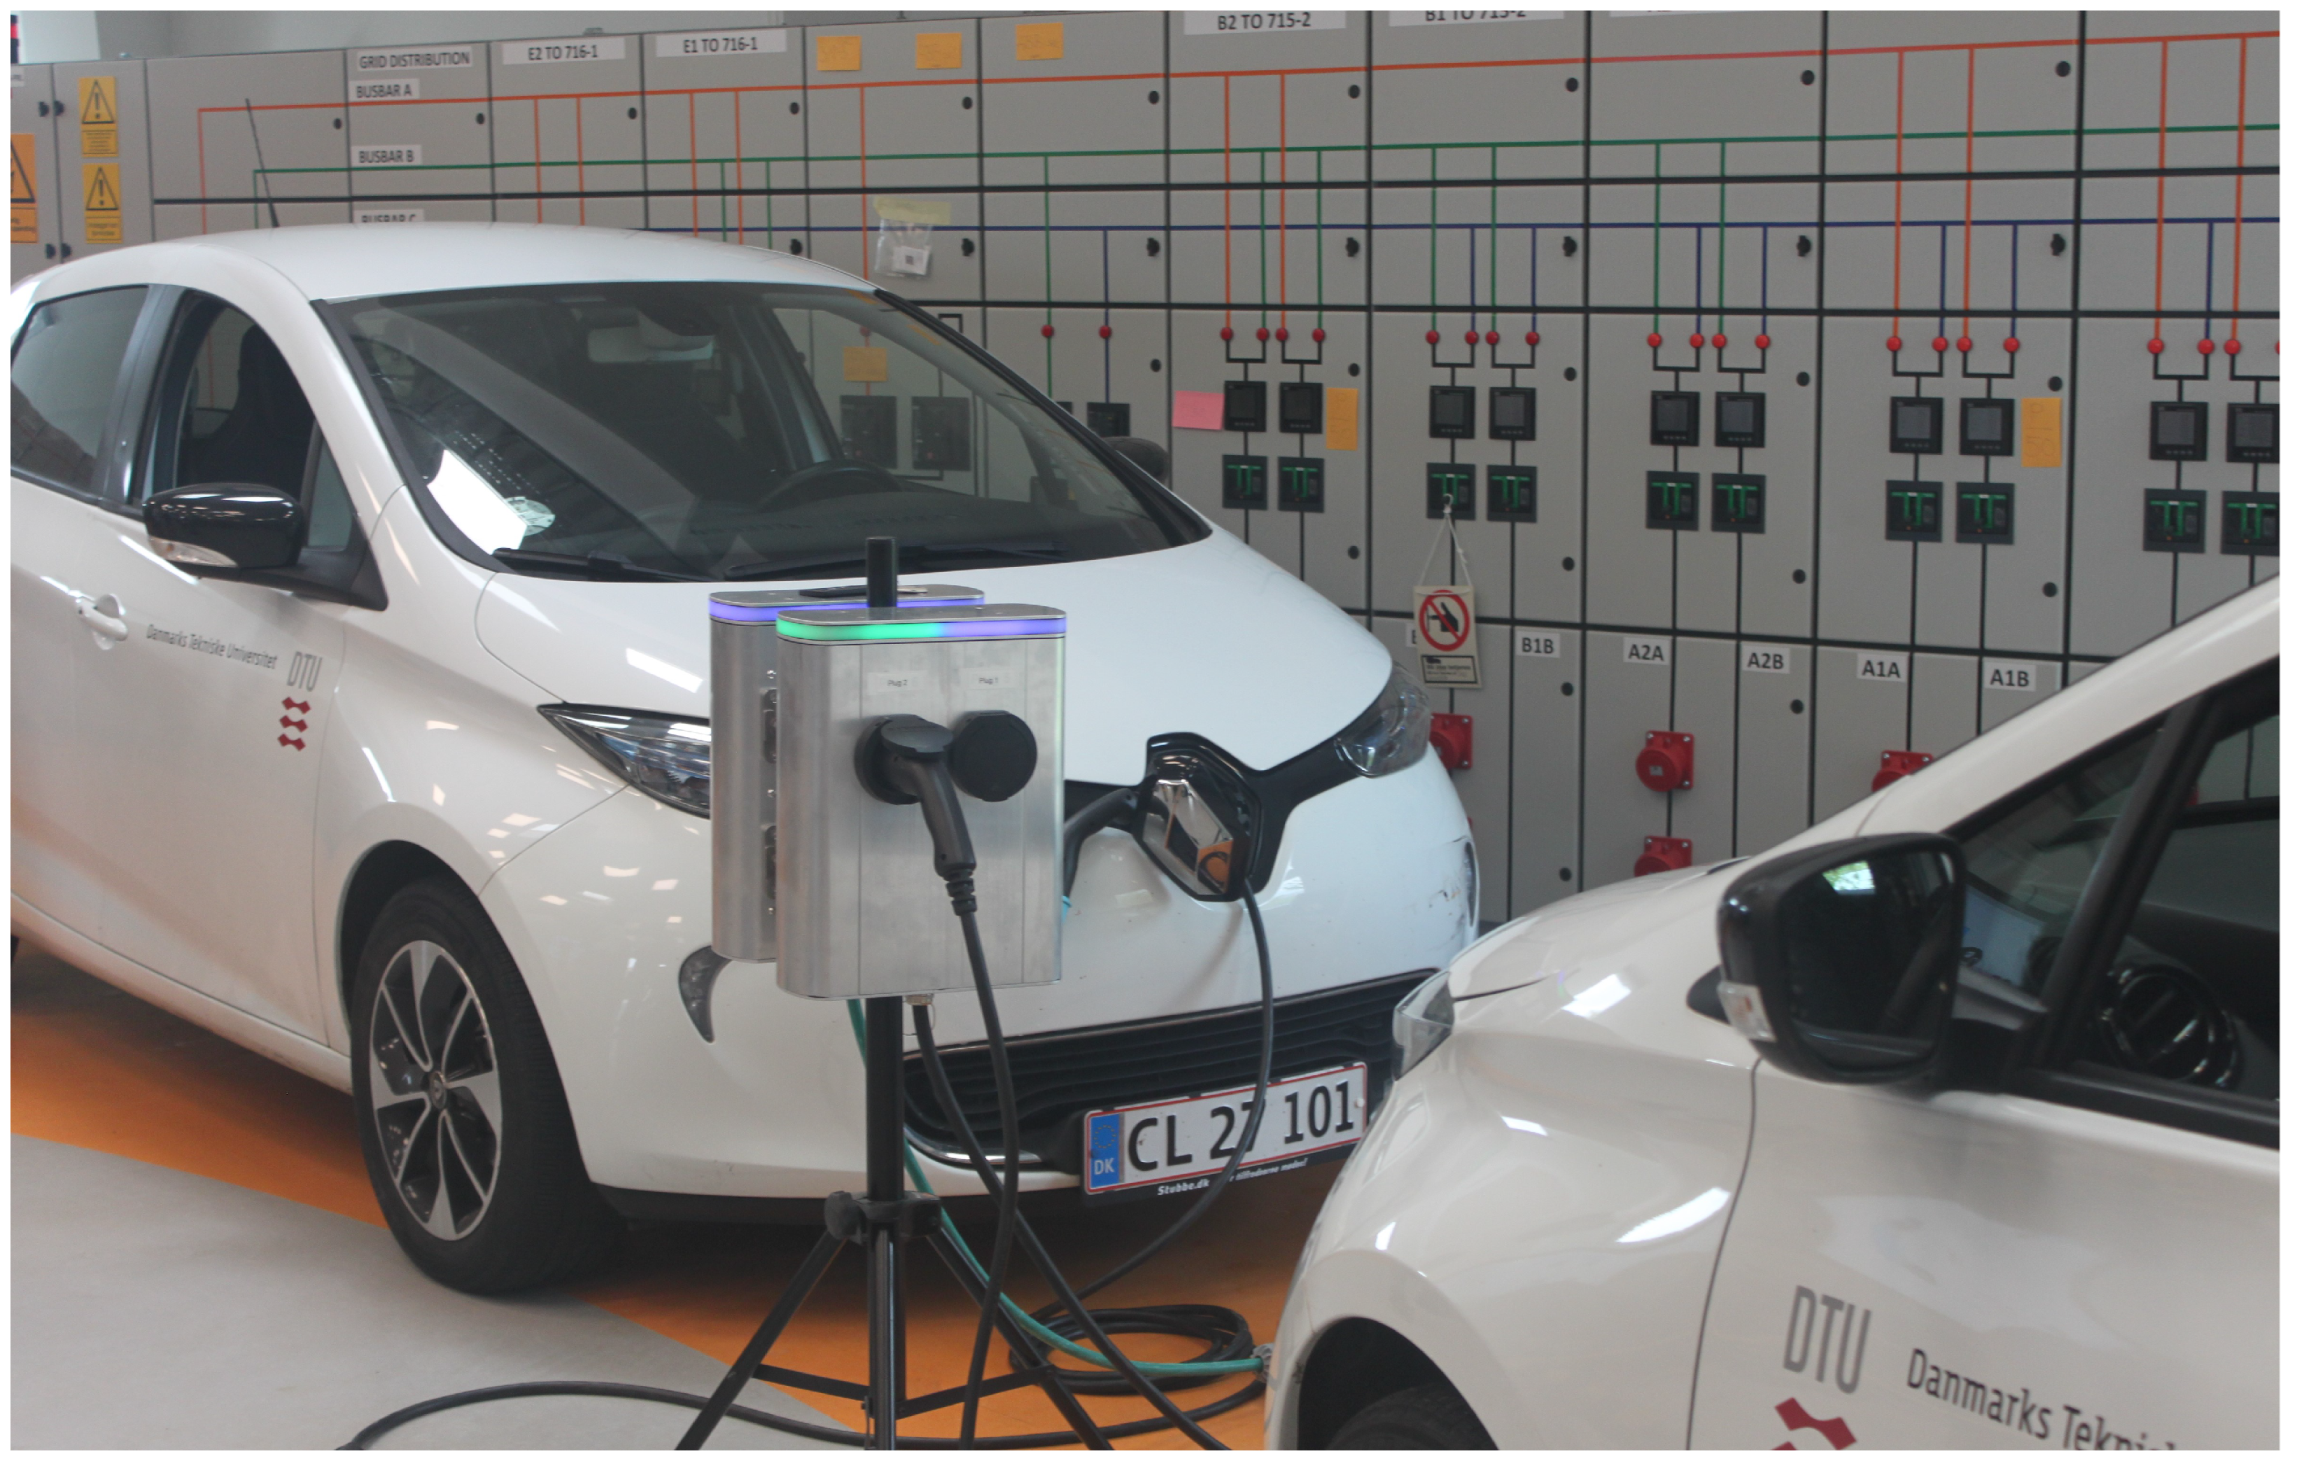
3. Physical Implementation

This subsection describes the physical implementation of the architecture concept. Section 3.1 details the hardware and software used in the test. Section 3.2 describes the test case chosen for the demonstration. This chapter provides a clear guide for other researchers who wish to replicate the results.

3.1. Hardware and Software Used

The VAs and the CA reside in “Beaglebone® black industrial” microcontrollers, shown in Figure 2. The microcontrollers have an ARM Cortex-A8 1 GHz processor with a RAM of 512 MB and an embedded flash memory of 4 GB. The microcontrollers run on Debian OS, and all the control algorithms are built in Python 3.8. Each charger has a dedicated external microcontroller, where the control algorithm is executed. This arrangement is due to a non-disclosure agreement with Circle Consult, the manufacturer and operator of the chargers, limiting direct control integration. Consequently, only the final power set points can be communicated to the chargers. The CA also has a dedicated microcontroller. These microcontrollers run on Debian OS and are connected to the network via wired Ethernet to facilitate data exchange. During the tests, the CA and the VA operate with an update rate of 4 and 2 s, respectively. Therefore, they execute their scripts (which consist of reading inputs, computing outputs, and sending outputs) at their respective intervals. Regarding network connectivity, the chargers are linked to the internet through a 4G connection, while other devices utilize the university Wi-Fi, which is secured by a firewall. The firewall restrictions on direct communication necessitate a server database as a mediator for data exchange across the two network interfaces. This server, acting as a central hub, facilitates the flow of information among devices without retaining a historical record of data values, only storing the most recent updates. In other words, the server database mediates all the communication paths in Figure 1.
The charging system incorporates a web interface, which allows for the input and management of user data and session-related parameters E r e q , t d e p .
The VAs on the Beaglebone microcontrollers use Amazon Web Services as an interface to transmit their final power set point to the microcontrollers integrated with the chargers.
The microcontrollers integrated with the chargers convert the power set point received from the external microcontrollers into a current set point, which they then relay to the charger actuators. The PCC is equipped with a smart meter (DEIF Multi-instrument MIC-2 MKII), which publishes, among other parameters, the power consumption and frequency measured in 1 s intervals to the MQTT data broker energidata.dk. The charger utilizes type 2 charging protocol as outlined in IEC 61851-1:2019 [28], featuring a 32 A 5-wire connection capable of delivering up to 22 kW of 3-phase power. However, the maximum power consumption per plug is limited to 11 kW, setting the operational control range between 3.68 kW and 11 kW for charging electric vehicles.

3.2. Test Case

In the tests, two Renault Zoes were employed for the frequency regulation, as shown in Figure 3. These Renault Zoes have a 22 kW onboard charger and a 41 kWh battery. For both EVs, the user inputs are assumed to be 8.1 kWh for EV1 and 19 kWh for EV2, resulting in internal priorities ρ i n t of 0.7 and 0.3, respectively. The length of the charging session inputted is 3 h for both vehicles. It is important to note that fulfilling the energy request and respecting the duration of the charging session are not the focus of the investigation. The user inputs are chosen to establish the priorities mentioned above. The expected results are that the high-priority EV charges more than the EV with lower priority while performing frequency regulation. The P b i d is chosen to be ± 3 kW, meaning that the power that can be used for regulation is 6 kW. The droop control is set up to be in the range of 13 kW to 19 kW for a frequency range of 49.9 Hz to 50.1 Hz.

4. Results and Discussion

This chapter details the performance of the distributed architecture observed during the test. Section 4.1 delves into the time history of frequency, power consumption, SOC, and priority ( ρ i n t ), aiming to illustrate the general trends and behaviors observed. Section 4.2 presents the analysis of the system’s delay and accuracy in responding to frequency changes. Section 4.3 describes the benefits of the system for the transmission system operators, charging point operators, and users. Finally, Section 4.4 discusses some identified limitations affecting the system’s reaction time.

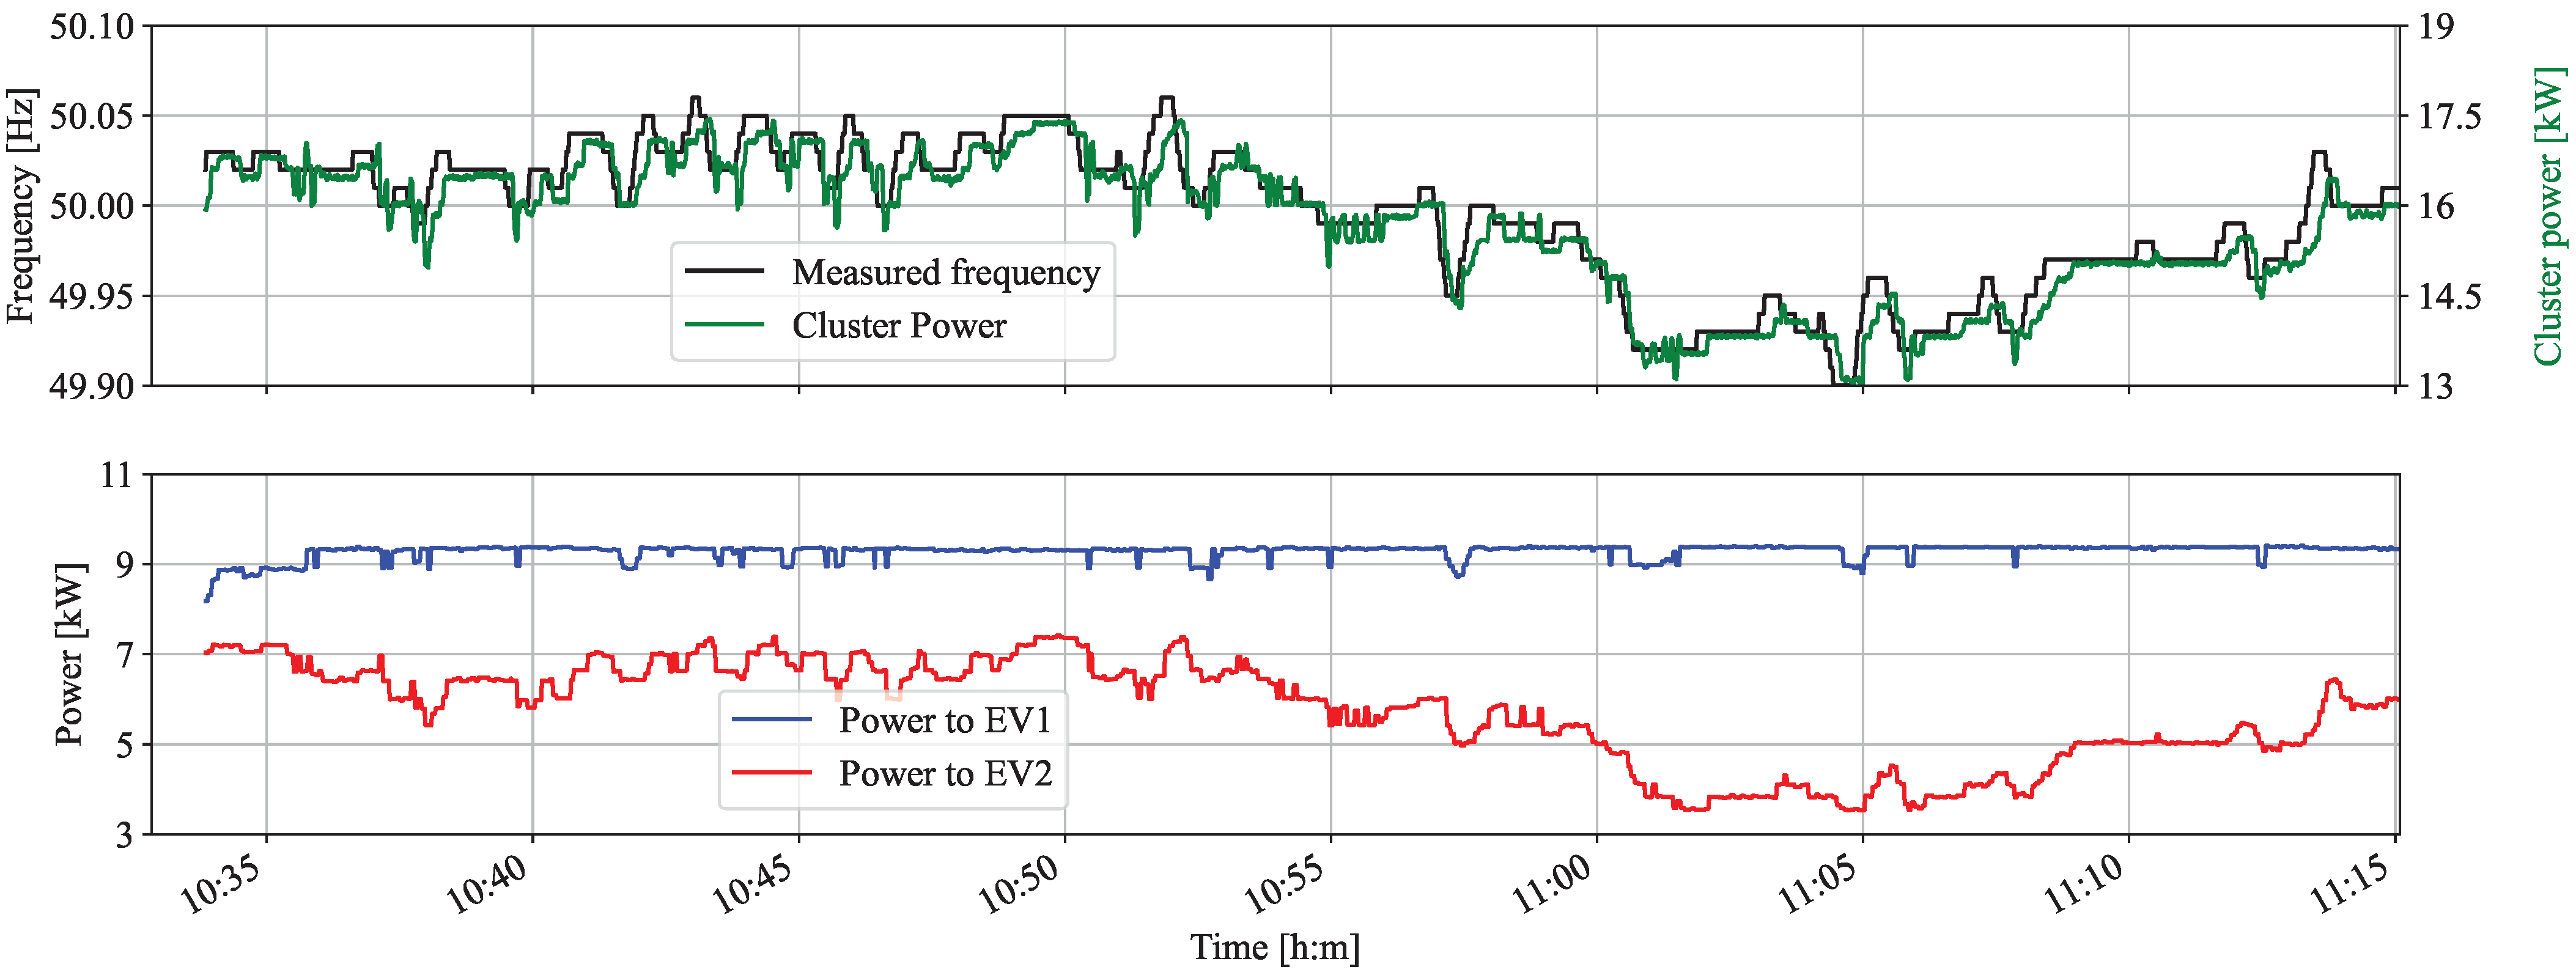
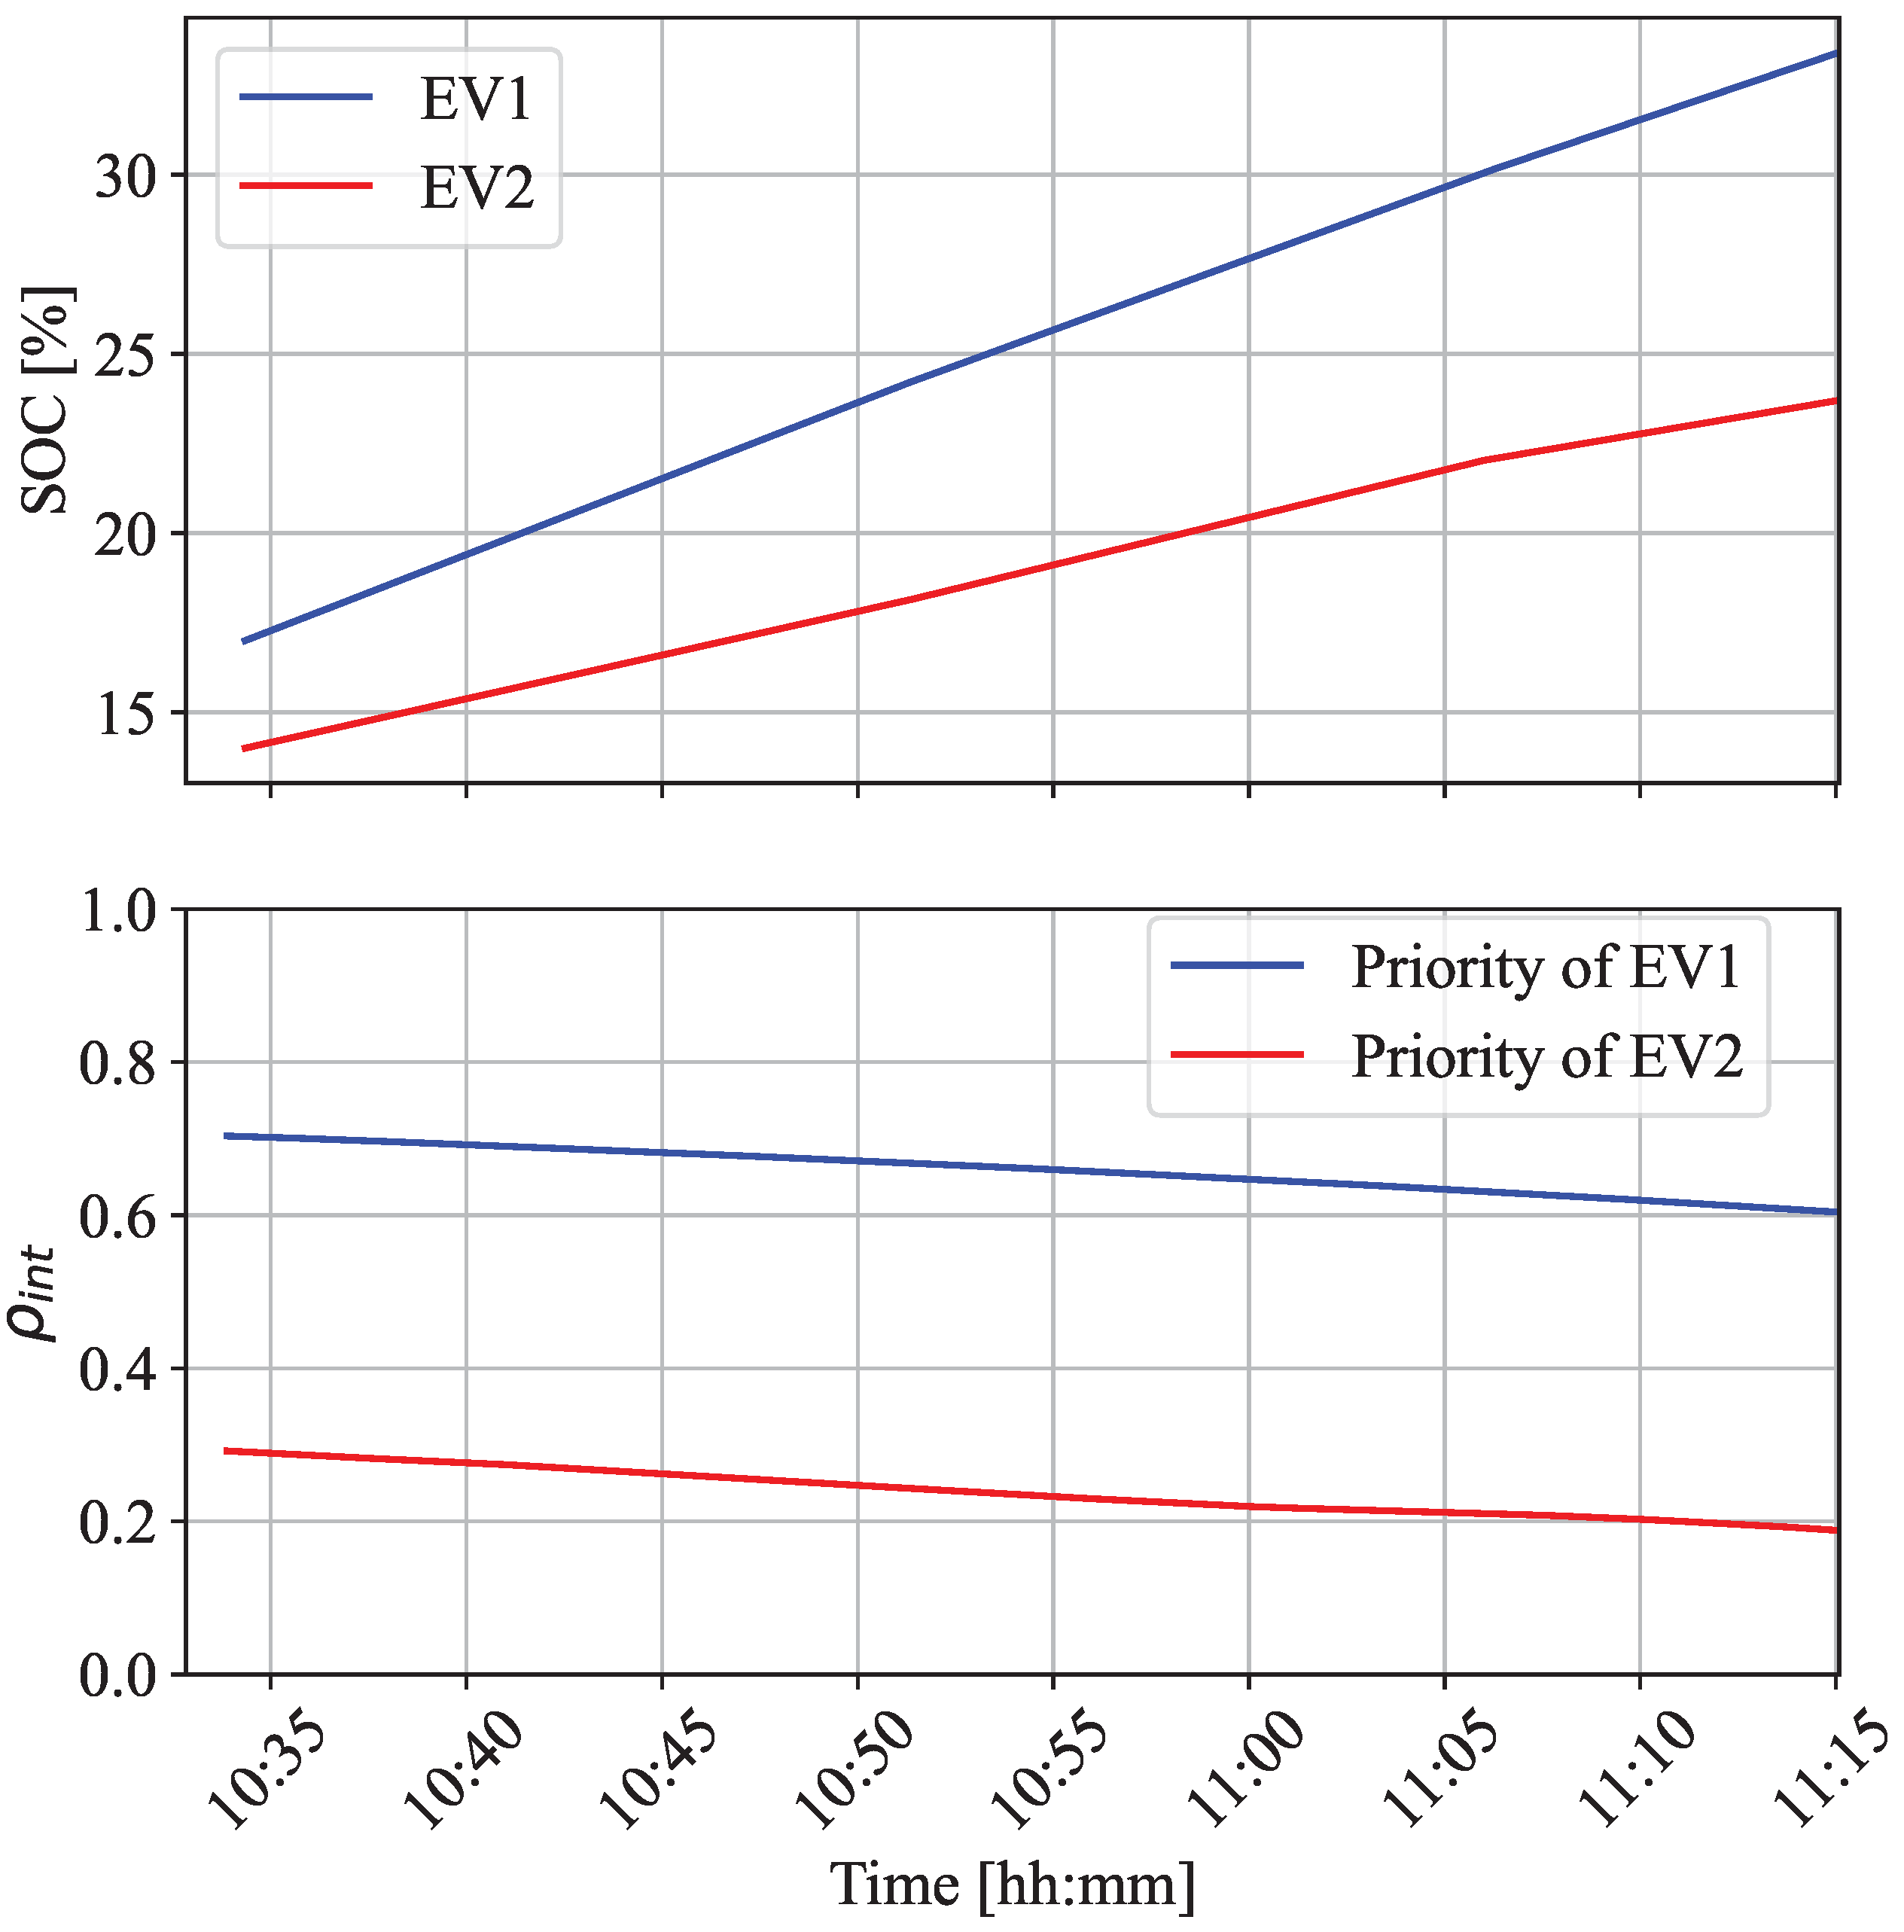
4.1. System Behavior Observed

In Figure 4, the time history of the frequency regulation performances is provided. The top graph shows the time history of the frequency measurements and the power consumed by the cluster; the graph has a double y-axis showing the frequency range on the left side and the power measured range on the right side. The scales of the dual y-axis are calibrated to highlight any potential overshoots or undershoots in the measured cluster power compared to the expected power from the droop controller. The graph shows a correct match of power and frequency, with some additional oscillation and a general undershoot of the power measured at the PCC compared to the expected power. Such oscillations around the power set point might be due to non-optimal interaction between the control tuning, the VAs set point update rate, and the reaction time of the EVs. The undershoot of the power adjustment could be related to the production of reactive power of the EVs at low charging power. In detail, because the charger output is the maximum allowed current for the EVs, the active power consumed by the EVs depends on the power factor characteristic of the onboard charger. This phenomenon has been reported in previous studies on the modulation of EVs [29]. The Renault Zoe is optimized to charge at its rated power (22 kW), while the reactive power increases when charging at low active power. Both phenomena—the oscillations and the undershoot of the power measured—should be further analyzed in future work. The bottom graph shows the individual dynamic power consumed by each EV during the test. The graph shows that EV1 charges at higher power because of the higher priority. EV2 has lower priority and, therefore, lower charging power. Furthermore, the charging power of EV1 saturates at an upper limit. As a result, the aggregated cluster response in the upper direction in case of frequency increases can only be provided by EV2. This behavior can potentially slow down the reaction time in this direction of service provision since only EV2 is reacting to frequency increases. This is particularly true because the design of the PI control, defined in the Equation (4), allocates a smaller share of the up-regulation power to the low-priority EV. Future work will address this behavior by adjusting the PI control near the upper and lower power limits of the plug.
Figure 5 illustrates the development of the SOC in the top graph and their priorities over time for two EVs in the bottom graph. At the start of the test, the SOCs for EV1 and EV2 were 17% and 14%, respectively. The SOC of EV1 increased faster because of its higher power allocation than EV2. At the end of the test, the SOCs were 48% and 33% for EV1 and EV2, respectively. The priority trends for both EVs ran nearly parallel throughout the charging session, with their priorities decreasing as they approached the completion of their requested energy.
A comparison of the bottom graph in Figure 4 and the graphs in Figure 5 reveals the impact of the longer period of underfrequency occurring from 10:50 until the end of the test. Because of its lower priority, EV2 reduced its power consumption, while EV1 maintained charging at maximum power. Consequently, the rate of SOC increase and the rate of priority decrease for EV2 slowed down. In contrast, the priority and SOC trends for EV1 remained unaffected, as EV1 maintained constant power.

4.2. Response Delay and Accuracy

Figure 6 shows a normalized cross-correlation of the power measured at the PCC ( P m e a s ) and power expected from the droop control ( P e x p ) to visualize the delays. The normalized cross-correlation is computed using the Pearson formula for each value of lag between the two curves:
r ( k ) = i ( P m e a s i P m e a s a v g i ) · ( P e x p , i + k P e x p , i + k a v g ) σ P m e a s · σ P e x p · N
In the formula, k is the value of lag, and σ P m e a s and σ P e x p are the standard deviations of the power measurement and expected power, respectively. N is the length of the time series. In the graph, the y-axis shows the normalized cross-correlation coefficient, and the x-axis shows the lag in seconds. The lag represents the displacement between the two time series for which each cross-correlation coefficient is calculated. The normalized cross-correlation peaks at 0.98 at a lag value of 8.48 s of the measured power curve with the expected power curve. Such a result, although semi-quantitative, tells us that the two curves have a very high degree of similarity. The delay depends on different factors. Together with the delays in communication and actuation of the control signals, an important factor is the reaction time of the EVs. In our case, the two car models are identical. However, reaction time can be drastically different depending on brand and model.
Finally, Figure 7 illustrates a histogram of the error distribution between the measured power and the expected power during the test. For this analysis, the measured power was shifted by approximately 8.48 s to highlight the controller’s precision and minimize the influence of the controller delay on the calculation. The analysis confirms the previously identified undershoot of the measured power in response to the frequency signal in Figure 4, with an average undershoot of 0.17 kW during the test. Additionally, the error ranges from 1.08 kW to 0.48 kW. The error values fall within the range of 0.73 kW to 0.29 kW for the 98th percentile, indicating a 2% probability of an error exceeding 0.29 kW or subceeding 0.73 kW.

4.3. Discussion of the Results

The results demonstrate a fast and accurate system response to frequency changes, including effective coordination among individual EVs based on their priority. Large-scale adoption of this system by charging point operators can generate significant value for all stakeholders in the EVSE business, as well as for EV users. The transmission system operator can purchase flexibility services from charging point operators, improving grid stability. Charging point operators will profit from trading frequency services and can develop business models incentivizing users to participate in frequency regulation by offering cheaper charging prices. Thanks to the robust prioritization mechanism, users can lower their charging costs without compromising their charging requirements. The additional power cycling incurred by the EVs is not expected to increase battery degradation significantly [26]. Lowering charging prices will, in turn, incentivize the purchase of more EVs.

4.4. Limitations of the Results

In our physical implementation, we identified several limiting factors that contribute to additional delays in the control action, offering areas for improvement: Firstly, the database server, necessitated by firewall constraints, is an intermediary node in most control communications, thereby adding delays in communicating set points. Bypassing this node can potentially streamline the communication process. Similarly, compliance with the non-disclosure agreement necessitated locating the VAs externally from the chargers, creating an additional intermediate node for all control communication. Incorporating the control logic of the VAs directly into the chargers can shorten the control communication pathway. Lastly, improving the current one-second sampling rate of the DEIF meter can accelerate system response to new set points and decrease reaction times.

5. Conclusions

This paper presents an experimental demonstration of frequency regulation provided by an EV charging infrastructure with a novel distributed control architecture. This architecture integrates global intelligence for cluster control and local intelligence within each charger’s microcontroller for autonomous localized control. The control concept combines power modulation of EVs in response to frequency fluctuations and prioritization of charging sessions according to charging urgency. The proof of concept is conducted using two Renault ZOEs with different priorities. During the experimental demonstration, the EV charging power and engagement in frequency regulation varied according to their priorities, while the system as a whole responded accurately to frequency fluctuations. A cross-correlation analysis revealed a peak of similarity between the expected power and power measured at 8.48 s. The error between expected and measured power ranged from 1.08 kW to 0.48 kW, with an average system undershoot of 0.17 kW. The accuracy and delay analysis show potential suitability for frequency services, although further studies are needed. Consistent with previous studies, the paper identifies the EVs as the likely cause of undershooting power set points and suggests future investigations to enhance the reliability of EVs as service providers. Finally, the study outlines system improvements and future research directions for integrating EVs into the power system.

Author Contributions

Conceptualization, S.S., J.E. and M.M.; Methodology, S.S.; Software, S.S. and K.L.P.; Validation, S.S.; Investigation, S.S. and K.L.P.; Resources, K.L.P. and M.M.; Data curation, S.S.; Writing—original draft, S.S.; Writing—review & editing, S.S., J.E., K.L.P. and M.M.; Supervision, J.E. and M.M.; Project administration, M.M.; Funding acquisition, M.M. All authors have read and agreed to the published version of the manuscript.

Funding

The work in this paper is supported by the research project ACDC (EUDP grant number: 64019-0541) and by the research project EV4EU (Horizon Europe grant no. 101056765) https://ev4eu.eu, accessed on 10 August 2024.

Data Availability Statement

The original contributions presented in the study are included in the article, further inquiries can be directed to the corresponding authors.

Conflicts of Interest

The funders had no role in the design of the study; in the collection, analyses, or interpretation of data; in the writing of the manuscript; or in the decision to publish the results.

References

  1. Vishnu, G.; Kaliyaperumal, D.; Jayaprakash, R.; Karthick, A.; Kumar Chinnaiyan, V.; Ghosh, A. Review of Challenges and Opportunities in the Integration of Electric Vehicles to the Grid. World Electr. Veh. J. 2023, 14, 259. [Google Scholar] [CrossRef]
  2. Crozier, C.; Morstyn, T.; McCulloch, M. The opportunity for smart charging to mitigate the impact of electric vehicles on transmission and distribution systems. Appl. Energy 2020, 268, 114973. [Google Scholar] [CrossRef]
  3. Gunkel, P.A.; Bergaentzlé, C.; Jensen, I.G.; Scheller, F. From passive to active: Flexibility from electric vehicles in the context of transmission system development. Appl. Energy 2020, 277, 115526. [Google Scholar] [CrossRef]
  4. Muratori, M.; Marcus, A.; Arent, D.; Bazilian, M.; Cazzola, P.; Dede, E.; Farrell, J.; Gearhart, C.; Greene, D.; Jenn, A. The rise of electric vehicles—2020 status and future expectations. Prog. Energy 2021, 3, 022002. [Google Scholar] [CrossRef]
  5. Ulbig, A.; Borsche, T.S.; Andersson, G.; Zurich, E. Impact of Low Rotational Inertia on Power System Stability and Operation. Ifac Proc. Vol. 2014, 47, 7290–7297. [Google Scholar] [CrossRef]
  6. Fernández-Guillamón, A.; Gómez-Lázaro, E.; Muljadi, E.; Molina-García, Á. Power systems with high renewable energy sources: A review of inertia and frequency control strategies over time. Renew. Sustain. Energy Rev. 2019, 115, 109369. [Google Scholar] [CrossRef]
  7. Borne, O.; Korte, K.; Perez, Y.; Petit, M.; Purkus, A. Barriers to entry in frequency-regulation services markets: Review of the status quo and options for improvements. Renew. Sustain. Energy Rev. 2018, 81, 605–614. [Google Scholar] [CrossRef]
  8. González, L.G.; Siavichay, E.; Espinoza, J.L. Impact of EV fast charging stations on the power distribution network of a Latin American intermediate city. Renew. Sustain. Energy Rev. 2019, 107, 309–318. [Google Scholar] [CrossRef]
  9. Liu, H.; Qi, J.; Wang, J.; Li, P.; Li, C.; Wei, H. EV Dispatch Control for Supplementary Frequency Regulation Considering the Expectation of EV Owners. IEEE Trans. Smart Grid 2018, 9, 3763–3772. [Google Scholar] [CrossRef]
  10. Sevdari, K.; Calearo, L.; Andersen, P.B.; Marinelli, M. Ancillary services and electric vehicles: An overview from charging clusters and chargers technology perspectives. Renew. Sustain. Energy Rev. 2022, 167, 112666. [Google Scholar] [CrossRef]
  11. Atallah, R.F.; Assi, C.M.; Fawaz, W.; Tushar, M.H.K.; Khabbaz, M.J. Optimal Supercharge Scheduling of Electric Vehicles: Centralized Versus Decentralized Methods. IEEE Trans. Veh. Technol. 2018, 67, 7896–7909. [Google Scholar] [CrossRef]
  12. Richardson, P.; Flynn, D.; Keane, A. Local versus centralized charging strategies for electric vehicles in low voltage distribution systems. IEEE Trans. Smart Grid 2012, 3, 1020–1028. [Google Scholar] [CrossRef]
  13. Statnett. Distributed Balancing of the Power Grid. Technical Report. 2021. Available online: https://www.statnett.no/contentassets/5f177747331347f1b5da7c87f9cf0733/2021.02.24-results-from-the-efleks-pilot-in-the-mfrr-market--.pdf (accessed on 10 August 2024).
  14. Han, X.; Heussen, K.; Gehrke, O.; Bindner, H.W.; Kroposki, B. Taxonomy for Evaluation of Distributed Control Strategies for Distributed Energy Resources. IEEE Trans. Smart Grid 2018, 9, 5185–5195. [Google Scholar] [CrossRef]
  15. Anwar M., B.; Muratori, M.; Jadun, P.; Hale, E.; Bush, B.; Denholm, P.; Ma, O.; Podkaminer, K. Assessing the value of electric vehicle managed charging: A review of methodologies and results. Energy Environ. Sci. 2022, 15, 466–498. [Google Scholar] [CrossRef]
  16. Knez, M.; Zevnik, G.K.; Obrecht, M. A review of available chargers for electric vehicles: United States of America, European Union, and Asia. Renew. Sustain. Energy Rev. 2019, 109, 284–293. [Google Scholar] [CrossRef]
  17. Thompson, A.W.; Perez, Y. Vehicle-to-Everything (V2X) energy services, value streams, and regulatory policy implications. Energy Policy 2020, 137, 111136. [Google Scholar] [CrossRef]
  18. Thingvad, A.; Ziras, C.; Marinelli, M. Economic value of electric vehicle reserve provision in the Nordic countries under driving requirements and charger losses. J. Energy Storage 2019, 21, 826–834. [Google Scholar] [CrossRef]
  19. Yao, E.; Wong, V.W.S.; Schober, R. Robust Frequency Regulation Capacity Scheduling Algorithm for Electric Vehicles. IEEE Trans. Smart Grid 2017, 8, 984–997. [Google Scholar] [CrossRef]
  20. Falahati, S.; Taher, S.A.; Shahidehpour, M. A new smart charging method for EVs for frequency control of smart grid. Int. J. Electr. Power Energy Syst. 2016, 83, 458–469. [Google Scholar] [CrossRef]
  21. Orihara, D.; Kimura, S.; Saitoh, H. Frequency Regulation by Decentralized V2G Control with Consensus-Based SOC Synchronization; Elsevier B.V.: Amsterdam, The Netherlands, 2018; Volume 51, pp. 604–609. [Google Scholar] [CrossRef]
  22. Meesenburg, W.; Thingvad, A.; Elmegaard, B.; Marinelli, M. Combined provision of primary frequency regulation from Vehicle-to-Grid (V2G) capable electric vehicles and community-scale heat pump. Sustain. Energy Grids Netw. 2020, 23, 100382. [Google Scholar] [CrossRef]
  23. Yang, Q.; Li, J.; Yang, R.; Zhu, J.; Wang, X.; He, H. New hybrid scheme with local battery energy storages and electric vehicles for the power frequency service. eTransportation 2021, 11, 100151. [Google Scholar] [CrossRef]
  24. Meng, J.; Mu, Y.; Jia, H.; Wu, J.; Yu, X.; Qu, B. Dynamic frequency response from electric vehicles considering travelling behavior in the Great Britain power system. Appl. Energy 2016, 162, 966–979. [Google Scholar] [CrossRef]
  25. Marinelli, M.; Martinenas, S.; Knezović, K.; Andersen, P.B. Validating a centralized approach to primary frequency control with series-produced electric vehicles. J. Energy Storage 2016, 7, 63–73. [Google Scholar] [CrossRef]
  26. Arias, N.B.; Hashemi, S.; Andersen, P.B.; Traeholt, C.; Romero, R. V2G Enabled EVs Providing Frequency Containment Reserves: Field Results. In Proceedings of the 2018 IEEE international conference on industrial technology (ICIT), Lyon, France, 20–22 February 2018. [Google Scholar]
  27. Striani, S.; Sevdari, K.; Marinelli, M.; Lampropoulos, V.; Kobayashi, Y.; Suzuki, K. Wind Based Charging via Autonomously Controlled EV Chargers under Grid Constraints; Institute of Electrical and Electronics Engineers Inc.: Piscataway, NJ, USA, 2022. [Google Scholar] [CrossRef]
  28. DS/EN 61851-1:2019; Electric Vehicle Conductive Charging System—Part 1: General Requirements. European Committee for Electrotechnical Standardization: Brussels, Belgium, 2019.
  29. Sevdari, K.; Calearo, L.; Bakken, B.H.; Andersen, P.B.; Marinelli, M. Experimental validation of onboard electric vehicle chargers to improve the efficiency of smart charging operation. Sustain. Energy Technol. Assess. 2023, 60, 103512. [Google Scholar] [CrossRef]
Figure 1. Simplified block diagram of the proposed distributed control architecture applied to a general parking lot with a number “n” of chargers.
Wevj 15 00361 g001
Figure 2. Beaglebone® black industrial microcontrollers used for testing the control architecture.
Wevj 15 00361 g002
Figure 3. Experimental setup implemented: The figure shows the two Renault Zoes and the charger used in the test. The test is conducted in the DTU Energy System Integration Lab (SYSLAB).
Wevj 15 00361 g003
Figure 4. Representative time window of the experimental validation of frequency regulation using distributed control architecture: frequency and power measured (top); power dispatched to each EV (bottom).
Wevj 15 00361 g004
Figure 5. Trends of SOC (top) and internal priority (bottom) for the two EVs during the experimental validation.
Wevj 15 00361 g005
Figure 6. Normalized cross-correlation of the frequency with the power measured during the experimental validation.
Wevj 15 00361 g006
Figure 7. Histogram of the error distribution between expected and measured power during the experimental validation.
Wevj 15 00361 g007
Disclaimer/Publisher’s Note: The statements, opinions and data contained in all publications are solely those of the individual author(s) and contributor(s) and not of MDPI and/or the editor(s). MDPI and/or the editor(s) disclaim responsibility for any injury to people or property resulting from any ideas, methods, instructions or products referred to in the content.

