Article

A Bi-Objective Optimal Scheduling Method for the Charging and Discharging of EVs Considering the Uncertainty of Wind and Photovoltaic Output in the Context of Time-of-Use Electricity Price

Key Laboratory of Energy Saving and Controlling in Power System of Liaoning Province, Shenyang Institute of Engineering, Shenyang 110136, China
*
Author to whom correspondence should be addressed.
World Electr. Veh. J. 2024, 15(9), 398; https://doi.org/10.3390/wevj15090398
Submission received: 15 July 2024 / Revised: 14 August 2024 / Accepted: 21 August 2024 / Published: 2 September 2024

Abstract

:
With the increasing share of renewable energy generation and the integration of large-scale electric vehicles (EVs) into the grid, the reasonable charging and discharging scheduling of electric vehicles is essential for the stable operation of power grid. Therefore, this paper proposes a bi-objective optimal scheduling strategy for microgrids based on the participation of electric vehicles in vehicle-to-grid technology (V2G) mode. Firstly, the system structure for electric vehicles participating in the charging and discharging schedule was established. Secondly, a bi-objective optimization model was formulated, considering load mean square error and user charging cost. A heuristic method was employed to handle constraints related to system energy balance and equipment output. Then, the Monte Carlo method was employed to simulate electric vehicle loads and to facilitate the generation of and reduction in scenario scenes. Finally, the model was solved using an improved multi-objective barebones particle swarm optimization algorithm. The simulation results show that the proposed scheduling strategy has a lower charging cost (CNY 11,032.4) and lower load mean square error (12.84 × 10⁵ kW2) than the strategy employed in the comparison experiment, which ensures the economic and stable operation of the microgrid.

1. Introduction

1.1. Literature Review

Considering the scarcity of global resources and growing ecological pollution concerns, renewable energy has significantly advanced the construction and development of new power systems due to its environmental benefits and sustainability [1]. According to the latest data released by the National Energy Administration, in the first quarter of 2024, China’s renewable energy sector added 63.67 million kilowatts of new installed capacity, marking a 34% year-on-year increase, which accounts for an overall increase of up to 92%. With the increasing proportion of renewable energy in power generation, its intermittent, random, and fluctuating characteristics pose increasingly significant challenges for grid system adjustment. The issue of renewable energy consumption remains serious [2]. Furthermore, the widespread disorderly charging behavior resulting from integrating electric vehicles into the grid may increase peak loads and adversely affect the safety, stability, and economic operation of power grids [3]. In the context of rapid developments in renewable energy and electric vehicles, which continue to present new challenges to the power system, V2G has garnered significant attention as a practical solution [4]. At this stage, recognizing electric vehicles as mobile energy storage units, providing them with structured guidance and facilitating their integration into the microgrid can bolster the utilization of renewable energy generation. Additionally, V2G technology can further aid microgrids in terms of peak shaving and load leveling, enhancing their economic viability and stability [5].
For this reason, both domestic and international scholars have conducted extensive research on the coordinated optimization scheduling problem involving electric vehicles and microgrids. In the realm of optimal scheduling for electric vehicles, sources of travel data typically fall into two categories: actual electric vehicle travel data and data generated through Monte Carlo simulations. Mahsa Bagheri Tookanlou et al. [6] developed a three-layer model incorporating electric vehicle charging costs, charging station benefits, and operator benefits. They conducted simulation research using accurate electric vehicle travel data from San Francisco, United States. Chai et al. [7] proposed a two-stage optimization technique that emphasizes enhancing travel convenience for electric vehicle owners. This was achieved through the introduction of two V2G options. Zhang et al. [8] developed a bi-objective collaborative schedule model that considers trading factors and grid-connected load fluctuation rates. They employed an improved cuckoo search algorithm to conduct simulations. Athanasios Paraskevas et al. [9] proposed a deep reinforcement learning agent, which can optimize the pricing and charging control of public electric vehicle charging stations under electricity prices that fluctuate in real time. By utilizing the Monte Carlo method to simulate electric vehicle travel data for studying optimal scheduling problems, Chao et al. [10] introduced a multi-objective collaborative scheduling strategy. They developed a model for multi-objective optimal scheduling based on predicted wind power. Ren et al. [11] developed a reinforcement learning framework utilizing long short-term memory (LSTM) and improved linear programming (ILP) to manage the V2G behavior of electric vehicles. LV et al. [12] formulated a day-ahead optimal scheduling model addressing the following three objectives: economic efficiency, mean square error of grid-connected power, and peak–valley differences in grid-connected power.
In addition, mainstream solutions for solving the optimal scheduling problem of electric vehicles include intelligent algorithms and mathematical solvers. In addressing the optimal scheduling problem of electric vehicles using mathematical solvers, Can Berk Saner et al. [13] proposed a cooperative multi-level multi-agent system. They designed an electric vehicle charging scheduling strategy to minimize charging costs while fulfilling user charging requirements. Yu et al. [14] devised a hierarchical cooperative operation strategy comprising upper real-time vehicle network scheduling and a lower cooperative strategy. Bakul Kandpal et al. [15] proposed a day-ahead electric vehicle scheduling strategy. They utilized a multi-objective dictionary sorting method to regulate electric vehicles’ charging and discharging rates based on dynamic electricity prices, aiming to achieve economic benefits while adjusting the power consumption of electric vehicles across phases. Yin et al. [16] addressed the uncertainty and volatility of wind power by constructing an objective function to maximize wind power utilization and minimize system generation costs. They employed a second-order cone relaxation method to manage branch power flow constraints. Alicia Triviño-Cabrera et al. [17] proposed a mathematical framework based on mixed-integer linear programming to maximize benefits for electric vehicle users. They conducted testing using the IEEE 37-node test feeder. To address the optimal scheduling problem of electric vehicles using intelligent algorithms, Zhao et al. [18] proposed a two-stage optimization strategy. They employed an advanced genetic algorithm with an elite retention strategy to validate their approach through a residential microgrid case study. Wang et al. [19] developed a bi-level optimization model for configuring electric vehicle charging stations. They utilized a generalized Nash equilibrium model to address the equilibrium and coupling among the upper multi-objectives, employing the incremental penalty function algorithm to solve the problem. Hou et al. [20] proposed a long-term V2G scheduling strategy considering the psychological effect of range anxiety. They applied a rolling optimization method to manage the real-time optimization process within the strategy and employed a non-dominated sorting genetic algorithm to address the multi-objective problem. A summary of the significant research findings is presented in Table 1.

1.2. Motivation and Contributions

The output of wind and photovoltaic energy is highly uncertain, and existing research rarely considers the impact of this uncertainty on electric vehicle scheduling systems. In addition, the objective optimization function of a charging and discharging optimization scheduling system for electric vehicles is usually high-order nonlinear. It is very complicated to use mathematical methods to solve this problem, and it is also challenging to obtain the exact solution to the problem. In this study, the IBBMOPSO algorithm, with an improved position update formula, was used to directly solve the optimal scheduling model of electric vehicle charging and discharging, and a simulation comparison was carried out with the intelligent algorithm commonly used in the scheduling field to verify the effectiveness of the proposed method. The main contributions of this study are as follows:
(1) A bi-objective optimal scheduling model is developed, which considers the load mean square error and charging costs for electric vehicle users. The model considers time-of-use electricity pricing on the demand side and fully exploits the potential of V2G technology in utilizing renewable energy sources. Incorporating scenarios involving wind and photovoltaic generation further validates the adaptability of the proposed scheduling method across various environmental conditions.
(2) Based on the optimization characteristics of the electric vehicle optimal scheduling system, an improved multi-objective particle swarm optimization algorithm is employed to directly derive the Pareto front of the proposed scheduling model. Subsequently, the algorithm’s parameters are determined using an orthogonal test, and the algorithm’s performance is evaluated from multiple angles using an evaluation index and multi-factor variance analysis method. Finally, the TOPSIS method is applied to determine the optimal compromise solution.
(3) The proposed optimal scheduling method is validated using a specific example. Experimental results demonstrate that the proposed scheduling strategy effectively lowers the charging costs for electric vehicle owners, mitigates power grid load fluctuations, and enhances the economic and operational stability of the microgrid. Furthermore, the IBBMOPSO algorithm has a superior performance compared to the MOPSO, MODE, and NSGA-II algorithms.
The remainder of this paper is organized as follows: The second section introduces the system structure and mathematical model. The third section describes the algorithm design based on the optimization schedule for electric vehicles. The fourth section presents the simulation methodology for electric vehicle travel. The fifth section de-tails the methods for generating and reducing wind and photovoltaic scenarios. The sixth section presents the results of the simulation experiments, which strongly confirm the feasibility and effectiveness of the proposed strategy. Finally, the seventh section summarizes the main research findings of this paper.

2. Problem Description

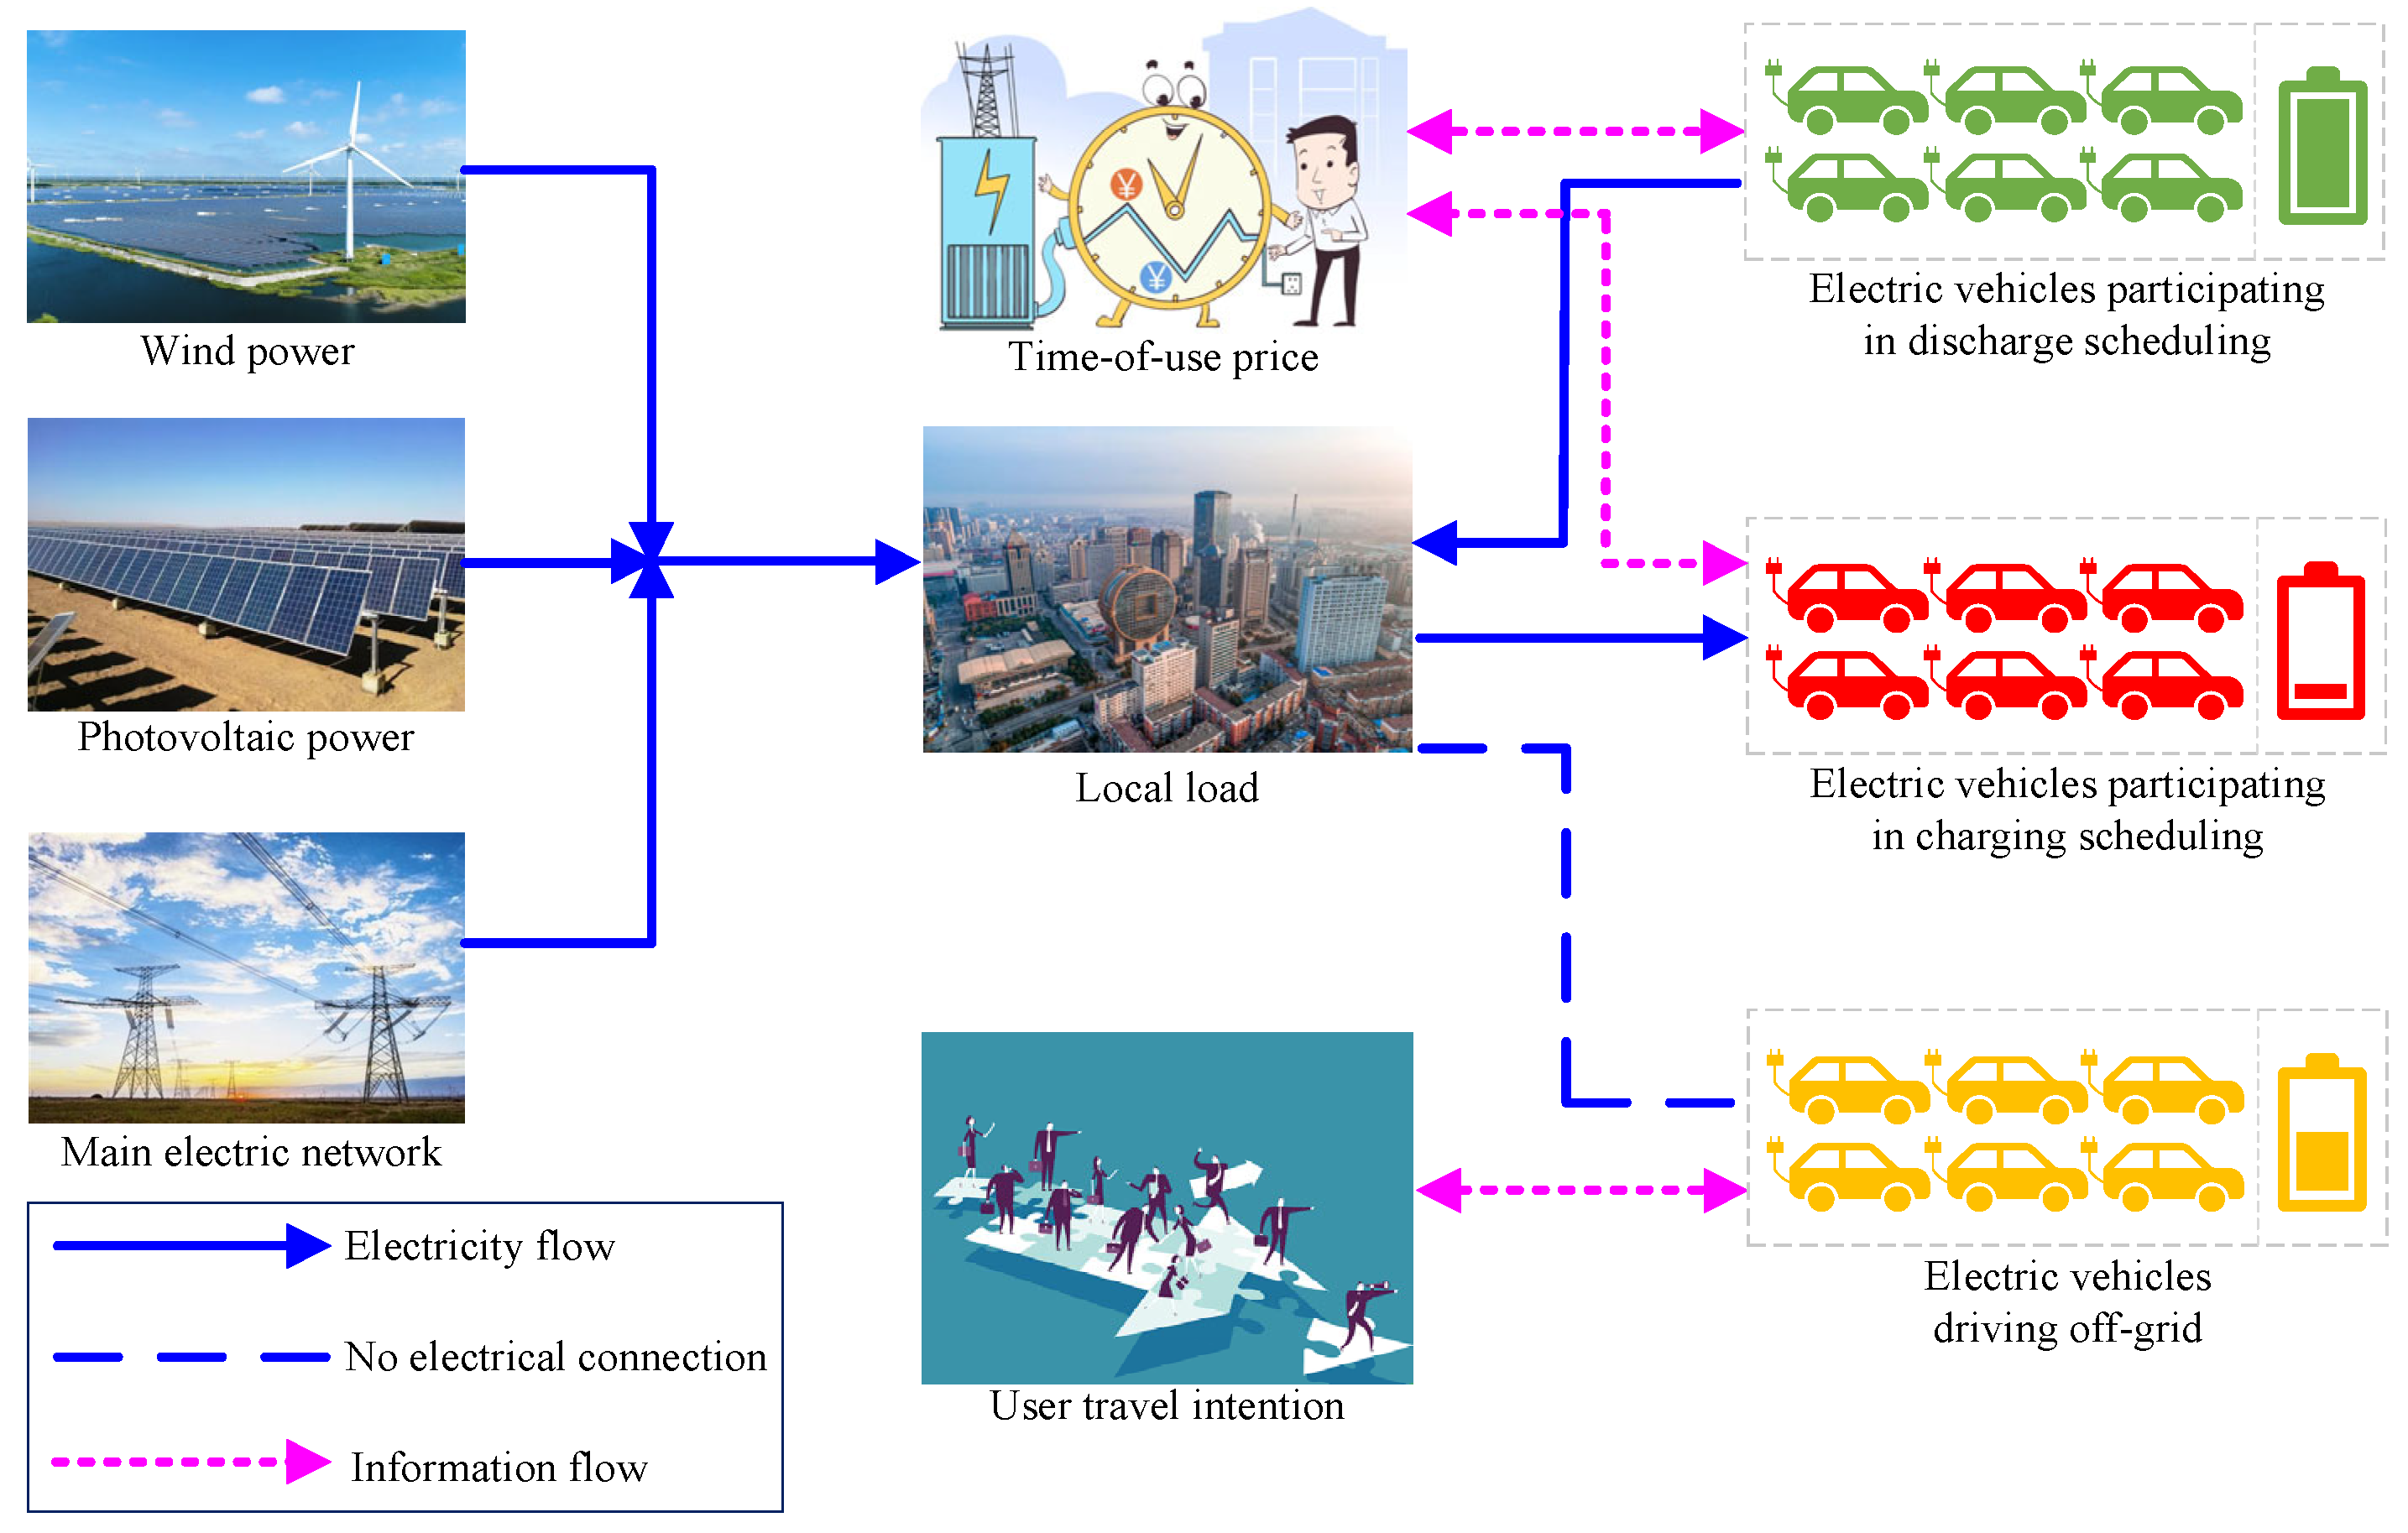
2.1. System Structure

The system structure, depicting electric vehicles participating in charge and dis-charge optimization scheduling, is illustrated in Figure 1. On the power supply side, a photovoltaic power generation array and a wind turbine provide the necessary power for system operations. The load side comprises both the electric vehicle load and the local load. Depending on the scheduling requirements, electric vehicles are categorized into the following three types: Firstly, electric vehicles are involved in discharge scheduling. These vehicles have sufficient electrical power to meet the travel needs of their owners, allowing them to participate in discharge scheduling, typically occurring during peak load periods on the grid. Secondly, electric vehicles are engaged in charging schedules. These vehicles have a lower power capacity than the owner’s demand level, necessitating urgent charging. Such scheduling generally occurs during periods of low load on the power grid. Lastly, there are off-grid electric vehicles. These vehicles do not participate in charging and discharging schedules as their users have their own travel needs. Among these, electric vehicle users participating in charge and discharge scheduling are subject to regulation by time-of-use electricity pricing.

2.2. Mathematical Model

(1) Objective function
The optimization objective of the electric vehicle charging and discharging scheduling problem is twofold. First, to minimize the distribution network load fluctuation and second, to reduce the charging costs incurred by electric vehicle users. The model can be formulated as follows:
min F 1 = 1 T 1 t = 1 T ( P d t P pv P w P ave + n = 1 N P n , t , c + n = 1 N P n , t , d ) 2 , P ave = t = 1 T ( P dt P pv P w ) T
min F 2 = t = 1 T n = 1 N ( P n , t , c × R c , t P n , t , d × R d , t P n , t , d × r )
Equation (1) is the expression of the mean square error of the system load, where T = T leave T arrival represents the scheduling period of the electric vehicle participating in the charging and discharging schedule, which is numerically equal to the time when the nth electric vehicle leaves the charging station minus the time when the electric vehicle arrives at the charging station. P d t represents the load data at time t; P pv represents the photovoltaic output at time t; P w represents the wind power output at time t; and P ave represents the arithmetic mean value of the difference between load and new energy output in the whole dispatching cycle. P n , t , c denotes the charging power of the nth EV at time t and P n , t , d  denotes the discharge power of the nth EV at time t.
Equation (2) is the expression of the charging costs for all-electric vehicle users, where R c , t represents the charging price at time t; R d , t denotes the discharge price at time t; r = C 0.8 k , r is the cost of battery loss per degree of discharge; C is the price of unit battery capacity (CNY 137.84); and k is the number of battery life cycles (1200 cycles).
(2) Constraints
t = 1 T n = 1 N P n , t , c ini = t = 1 T n = 1 N P n , t , c  
P i l oad = t = 1 T P d t + t = 1 T P pv + n = 1 N t = 1 T ( P n , t , c + P n , t , d ) P load   max
0 P n , t , c   P c , EV max
P d , EV max P n , t , d   0
S O C min S O C n , t , EV S O C max , S O C n , t , EV = E n , t , EV + ( P n , t , c + P n , t , d ) × t E EV
0 D DOD D DOD _ max , D DOD = P n , t , EVdis × t E EV × 100 %
Equation (3) denotes the equality constraint for the charging load before and after scheduling. Equation (4) imposes an inequality constraint, ensuring that the total system load does not exceed the system’s maximum capacity. Equation (5) sets the upper and lower limits for the charging power of electric vehicles. Equation (6) establishes similar limits for the discharge power of electric vehicles. Equation (7) specifies the upper and lower bounds for the state of charge of electric vehicle batteries. Lastly, Equation (8) dictates the upper and lower limits for the depth of discharge of electric vehicle batteries.

3. Algorithm Design of Bi-Objective Optimal Scheduling

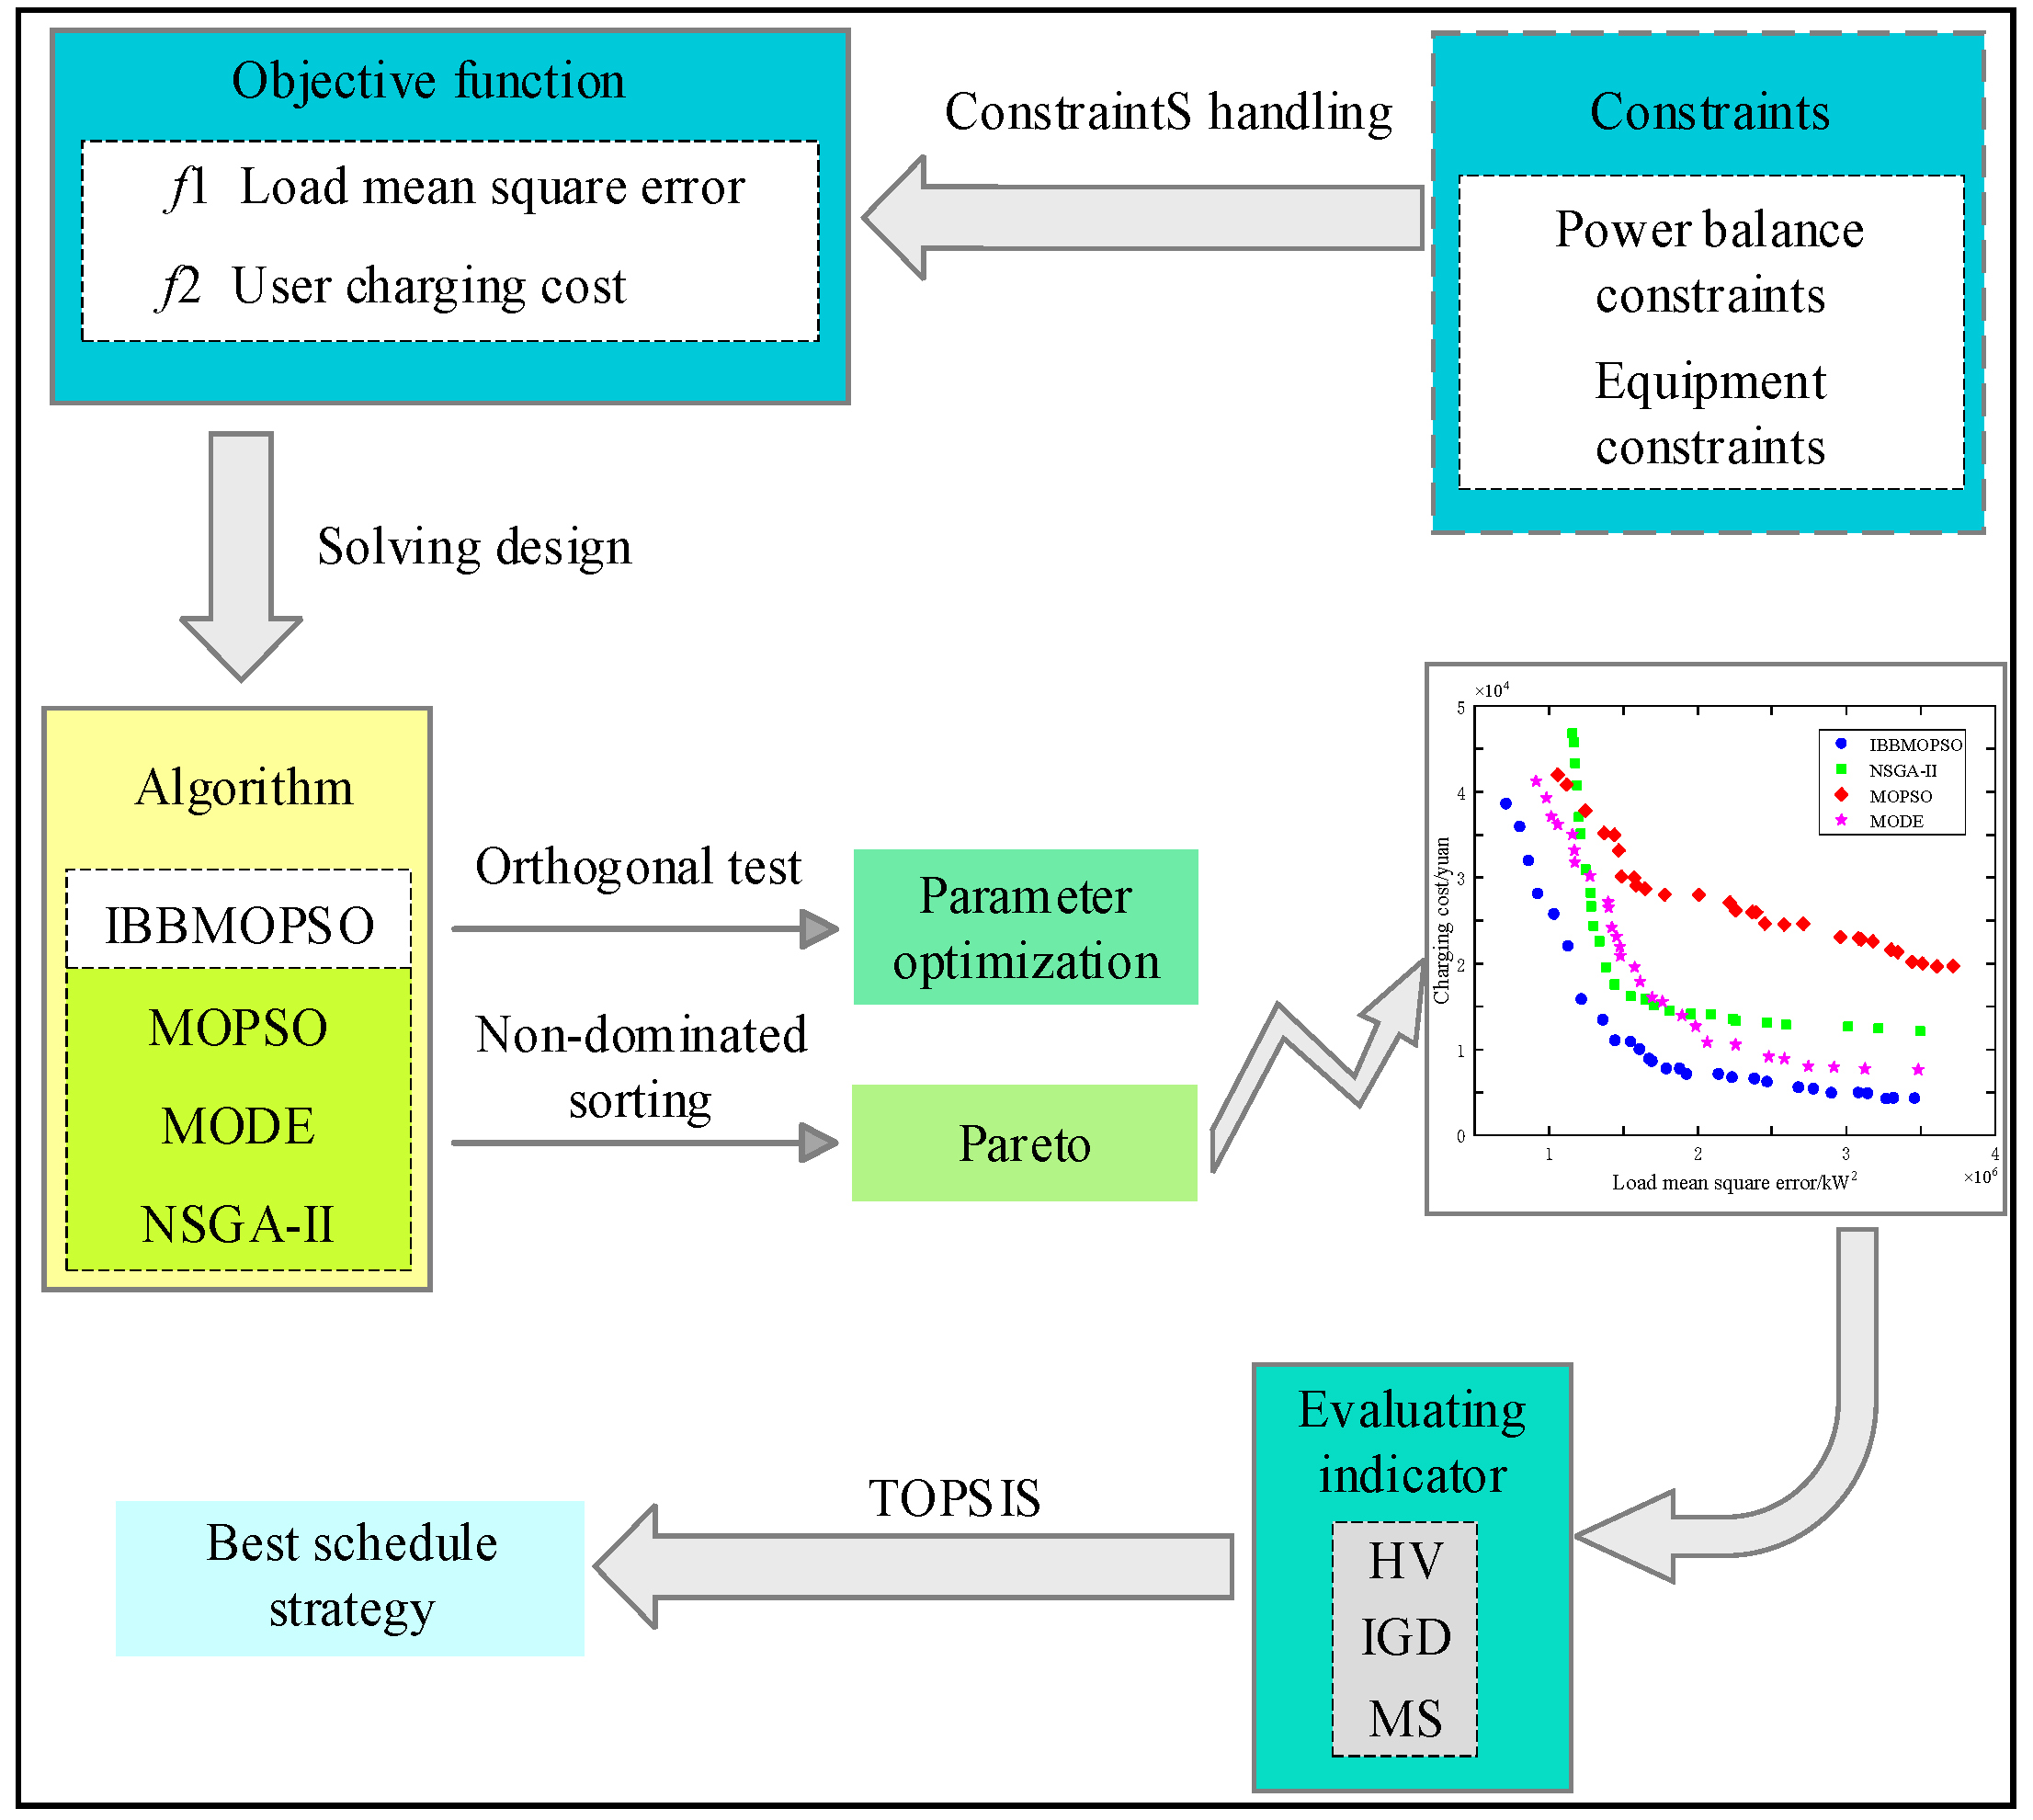
3.1. Structure of the Optimization Strategy

The optimized strategy for scheduling electric vehicle charging and discharging is depicted in Figure 2. Two key optimization indicators were set in the system plan—the mean square deviation of the load and the user’s charging cost—and a heuristic algorithm was used to properly manage the energy balance of the system, as well as the output power limit of the power generation unit and related facilities. System optimization utilizes a multi-objective approach to directly solve the Pareto optimal frontier. The chosen solution algorithm was the IBBMOPSO algorithm, benchmarked against commonly used algorithms in optimal scheduling, such as MOPSO, MODE, and NSGA-II. An orthogonal test was conducted to fine-tune the algorithm parameters, and the algorithm performance was evaluated using metrics including inverted generation distance (IGD), hypervolume (HV), and maximum spread (MS) to assess effectiveness. The optimal scheduling scheme is ultimately determined using a decision method based on the ideal point.

3.2. Algorithm Design

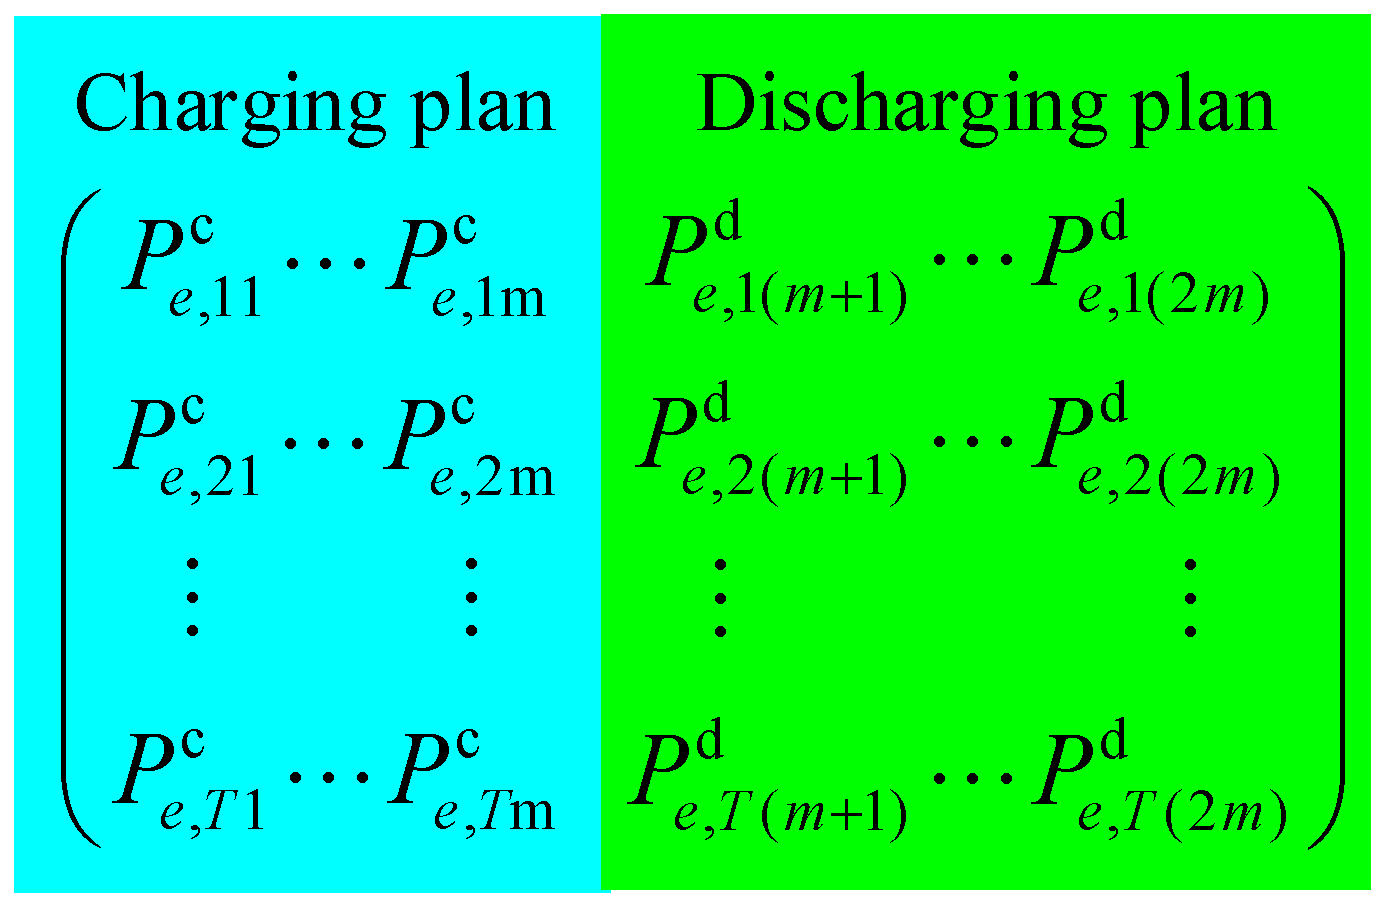
3.2.1. Particle Coding

The formulation of coding problems constitutes a fundamental challenge in algorithm design. In this section, T vectors P e , 1 , P e , 2 , P e , 3 , , P e , T are used to represent the solution P e in a scheduling cycle P e = P e , 1 , P e , 2 , P e , 3 , , P e , T . Each vector represents the charging and discharging plan of m electric vehicles at T time, from left to right, the charging power and discharging power of m electric vehicles at T time. Therefore, each particle in the IBBMOPSO algorithm is finally represented as a decision matrix of T rows and 2m columns. In this paper, the scheduling cycle T is set to 24, and the number of electric vehicles m is set to 500. Hence, each particle is depicted as a 24 × 100 decision matrix, as illustrated in Figure 3.

3.2.2. Optimize the Particle Position Update Equation

The multi-objective backbone particle swarm optimization (MOPSO) algorithm is a stochastic method rooted in swarm intelligence technology. It emulates the foraging dynamics observed in bird populations, characterized by competition and cooperation among individuals, to achieve optimal solutions. This approach endows MOPSO with robust versatility and global optimization capabilities. At its core, the algorithm updates particle positions using Gaussian distributions for global and individual guidance. One notable advantage is its elimination of the need to set control parameters such as inertia weight and learning factors. Instead, the evolution of the particle swarm occurs through iterative refinement, culminating in the identification of a globally optimal solution.
In the multi-objective backbone particle swarm optimization algorithm, the weighted distribution of individual leaders and global leaders in the particle position update equation is stochastic, potentially compromising search performance across various processing stages. Moreover, the randomness inherent in individual leader selection contributes to the algorithm’s slow convergence speed. This paper addresses these issues by optimizing the particle position update equation [21] to enhance global search efficacy during the initial stage and bolster local search capability in subsequent stages, thereby accelerating algorithm convergence. The improved search equations, including Equations (9) and (10), are proposed for this purpose.
x ( g e n + 1 ) = N w , v , i f U ( 0 , 1 ) < 0.5 g b e s t ( g e n ) , o t h e r w i s e   w = r 1 p b e s t ( g e n ) + ( 1 r 1 ) g b e s t ( g e n ) 2 v = p b e s t ( g e n ) g b e s t ( g e n )
x ( g e n + 1 ) = N w , v + b 3 , i f U ( 0 , 1 ) < 0.5 g b e s t ( g e n ) , o t h e r w i s e   w = b 1 p b e s t g e n + b 2 g b e s t g e n 2 v = b * p b e s t g e n g b e s t g e n b 1 = 1 0.6 cos π × g e n / s e t g e n b 2 = 1 + 0.6 cos π × g e n / s e t g e n b * = 0.6 + 0.4 cos π × g e n / s e t g e n b 3 = rand × g b e s t g e n p b e s t g e n

3.2.3. Pseudo-Code of IBBMOPSO

This paper applies the improved backbone particle swarm optimization algorithm to solve the dual-objective optimal scheduling model for electric vehicles. The pseudo-code detailing Algorithm 1 is provided below.
Algorithm 1 IBBMOPSO
Wevj 15 00398 i001

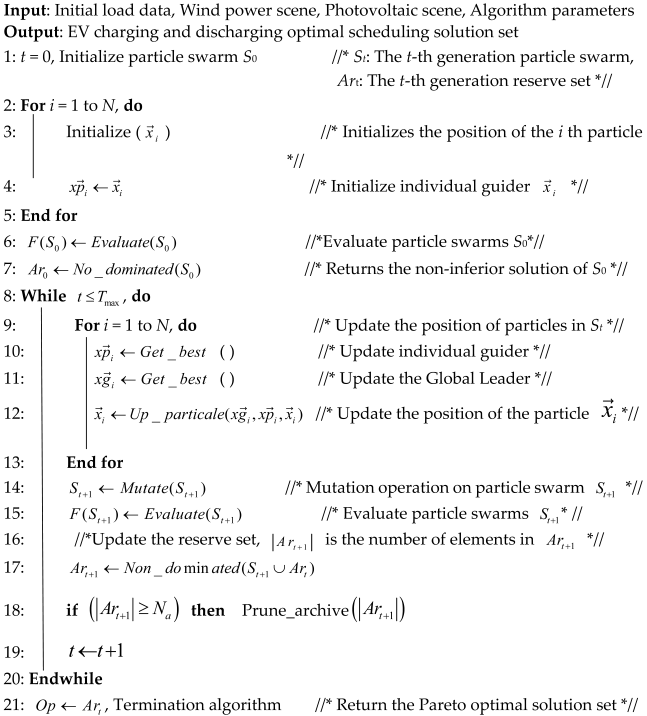
3.3. Comprehensive Decision-Making

The Pareto front generated by the multi-objective algorithm represents a set of solutions. To ensure the practical relevance of the results, evaluating this solution set and comprehensively identifying the optimal solution is essential. The bi-objective optimization problem concerning electric vehicle charging and discharging presents a multi-attribute comprehensive decision-making challenge. Therefore, the TOPSIS method, itself a multi-objective decision-making approach, can effectively determine the best compromise scheduling scheme. This method involves the decision maker defining an ideal solution (which may not be feasible), establishing a distance metric, and quantifying the deviation of each scheme within the set from this ideal. The objective is to select a subset of feasible solutions closest to the ideal solution (or furthest from the negative ideal solution) to inform the final decision. The specific steps for decision-making are outlined below:
Step 1: Let the decision matrix of the multi-objective problem be A. A can form a normalized decision matrix Z, whose element is Zij.
Z i j = f i j i = 1 n f i j   2 , i = 1 , 2 , , n , j = 1 , 2 , , m
where the solution is given by the decision matrix.
Step 2: The normalized weighted decision matrix Z, whose element is Zij, is constructed.
Z i j = W j Z i j   , i = 1 , 2 , , n , j = 1 , 2 , , m
where Wj is the weight of the jth goal.
Step 3: Determine the ideal solution and negative ideal solution.
Z * = ( Z 1 * , Z 2 * , , Z m * ) , Z = ( Z 1 , Z 2 , , Z m )
Step 4: The distance from each scheme to the ideal point and the distance from each scheme to the negative perfect point are calculated.
Step 5: According to the above equation, the relative proximity C i * of each scheme close to the ideal point is calculated.
Step 6: Sort them according to the relative closeness C i * of each scheme.

4. EV Travel Simulation

Based on the probability density function of electric vehicle driving patterns and relevant parameters, this paper employs the Monte Carlo method to randomly sample daily mileage and the start and end times for charging each electric vehicle. Subsequently, initial power requirements and the necessary charging duration are computed to simulate the charging load curve for electric vehicles.
In electric vehicle charging and discharging optimization scheduling, platforms offering relevant electric vehicle travel data are seldom publicly accessible [22]. Therefore, the Monte Carlo method is crucial in simulating these travel data. This method relies on statistical distributions, more specifically, probability density functions that characterize electric vehicles’ residence times and driving distances. By sampling these probability density functions [23], the load data for electric vehicles can be effectively generated.
This paper focuses on pure electric private cars, where the electric vehicle charging load is influenced by factors such as mileage, parking duration, and battery characteristics. Given that electric vehicles can only charge while parked, the length of parking time directly dictates the duration of the charging process. Moreover, this study primarily focuses on the slow charging method and lithium-ion batteries [24], which are known for their generally constant power charging dynamics. This paper assumes that each electric vehicle undergoes uninterrupted daily charging and does not account for potential disruptions to the charging process due to emergencies.
It is assumed that the scheduling cycle commences when the owner departs from home to go to work, with the corresponding endpoint being the return from work to home in the afternoon. According to this scheduling rule, the probability density function governing a single electric vehicle’s arrival and departure times follows a normal distribution. The probability density functions governing the arrival and departure times of the electric vehicle are as follows:
f e ( x ) = 1 2 π σ s exp ( ( x 24 μ s ) 2 2 σ s )   μ s , 12 < x 24 f e ( x ) = 1 2 π σ s exp ( ( x μ s ) 2 2 σ s ) , 0 <   x μ s + 12  
f e ( x ) = 1 2 π σ e exp ( ( x + 24 μ e ) 2 2 σ e )   , 0 < x μ e 12   f e ( x ) = 1 2 π σ e exp ( ( x μ e ) 2 2 σ e ) , μ e 12   <   x 24
where x is the time variable; expected value μ e = 16.47 ; μ s = 8.43 ; variance σ e = 3.41 ; and σ s = 2.55 .
Based on the probability density function and the relevant parameters of electric vehicles, the Monte Carlo method was employed to randomly sample the daily mileage of each electric vehicle, as well as its start and end times for charging [25]. Subsequently, each vehicle’s initial power state and necessary charging duration are computed to simulate the charging load curve. Utilizing these electric vehicle load data, the optimal scheduling problem for electric vehicles is explored in greater detail.
The daily mileage data of electric vehicles conform to the following probability density function:
f m ( l ) = 1 2 π σ m l exp ln l μ m 2 2 σ m
where l is the driving distance; the expected value is μ m = 13.7; and the variance is σ m = 3.9.

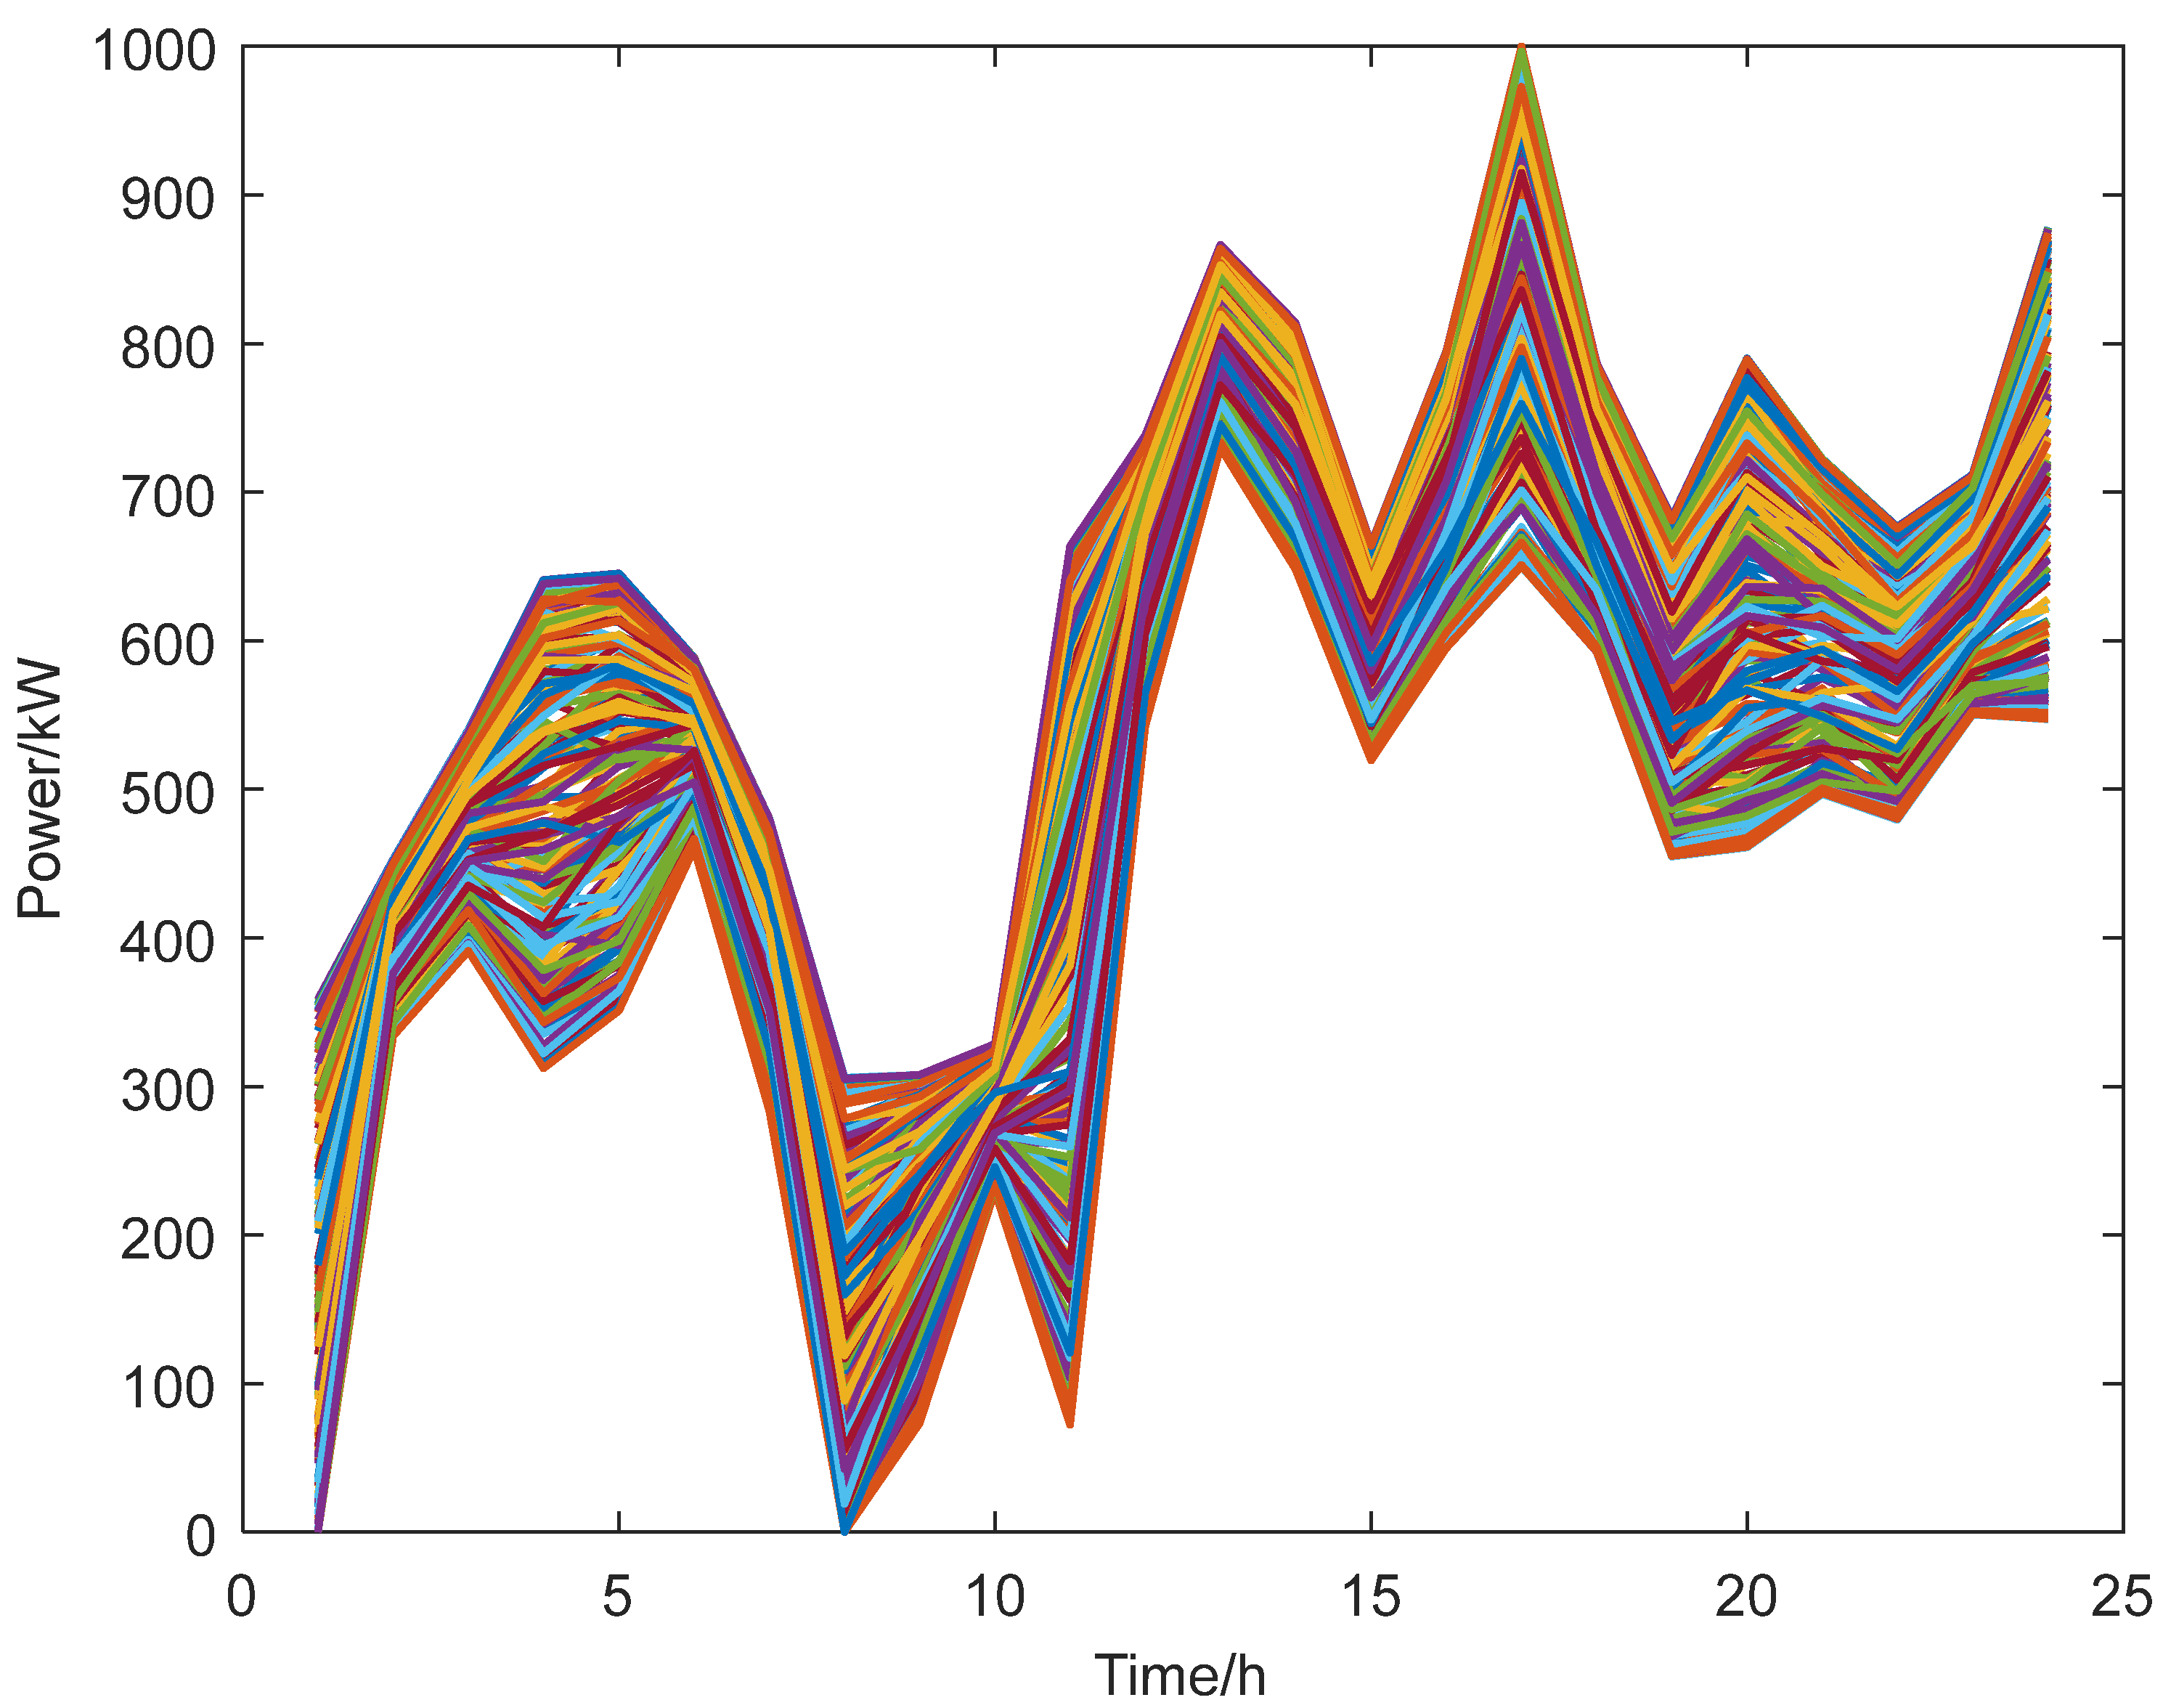
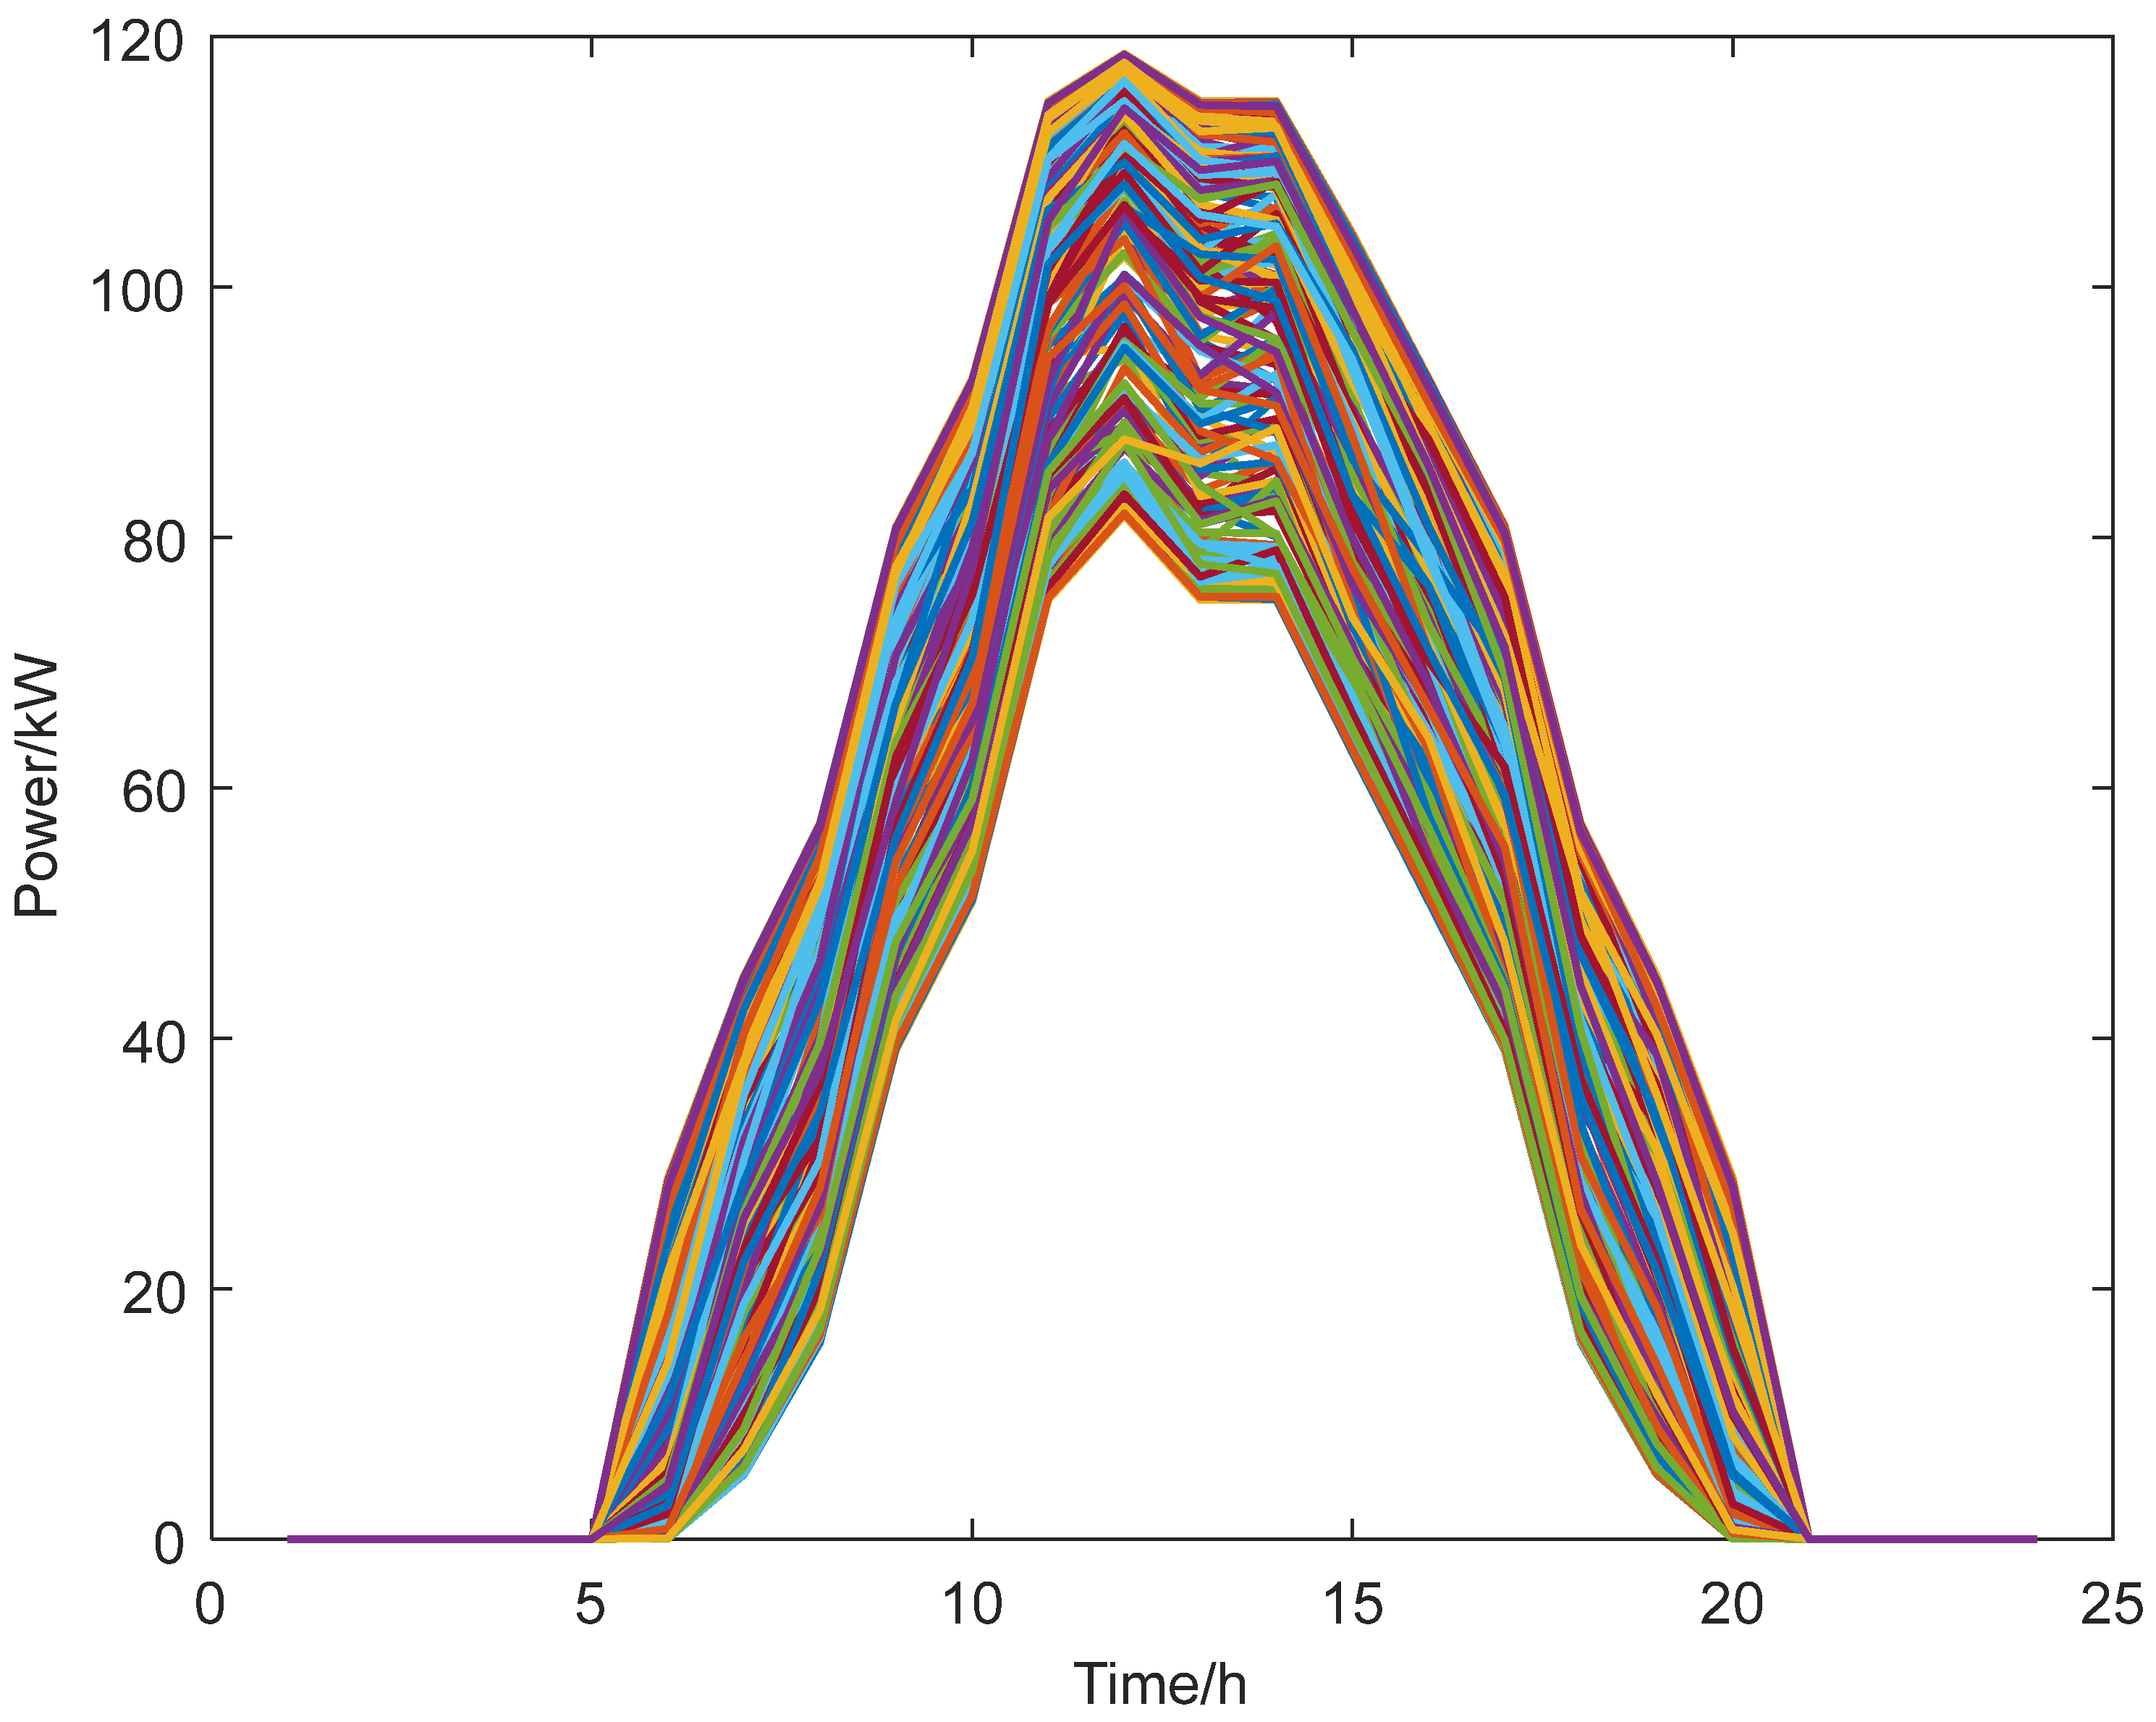
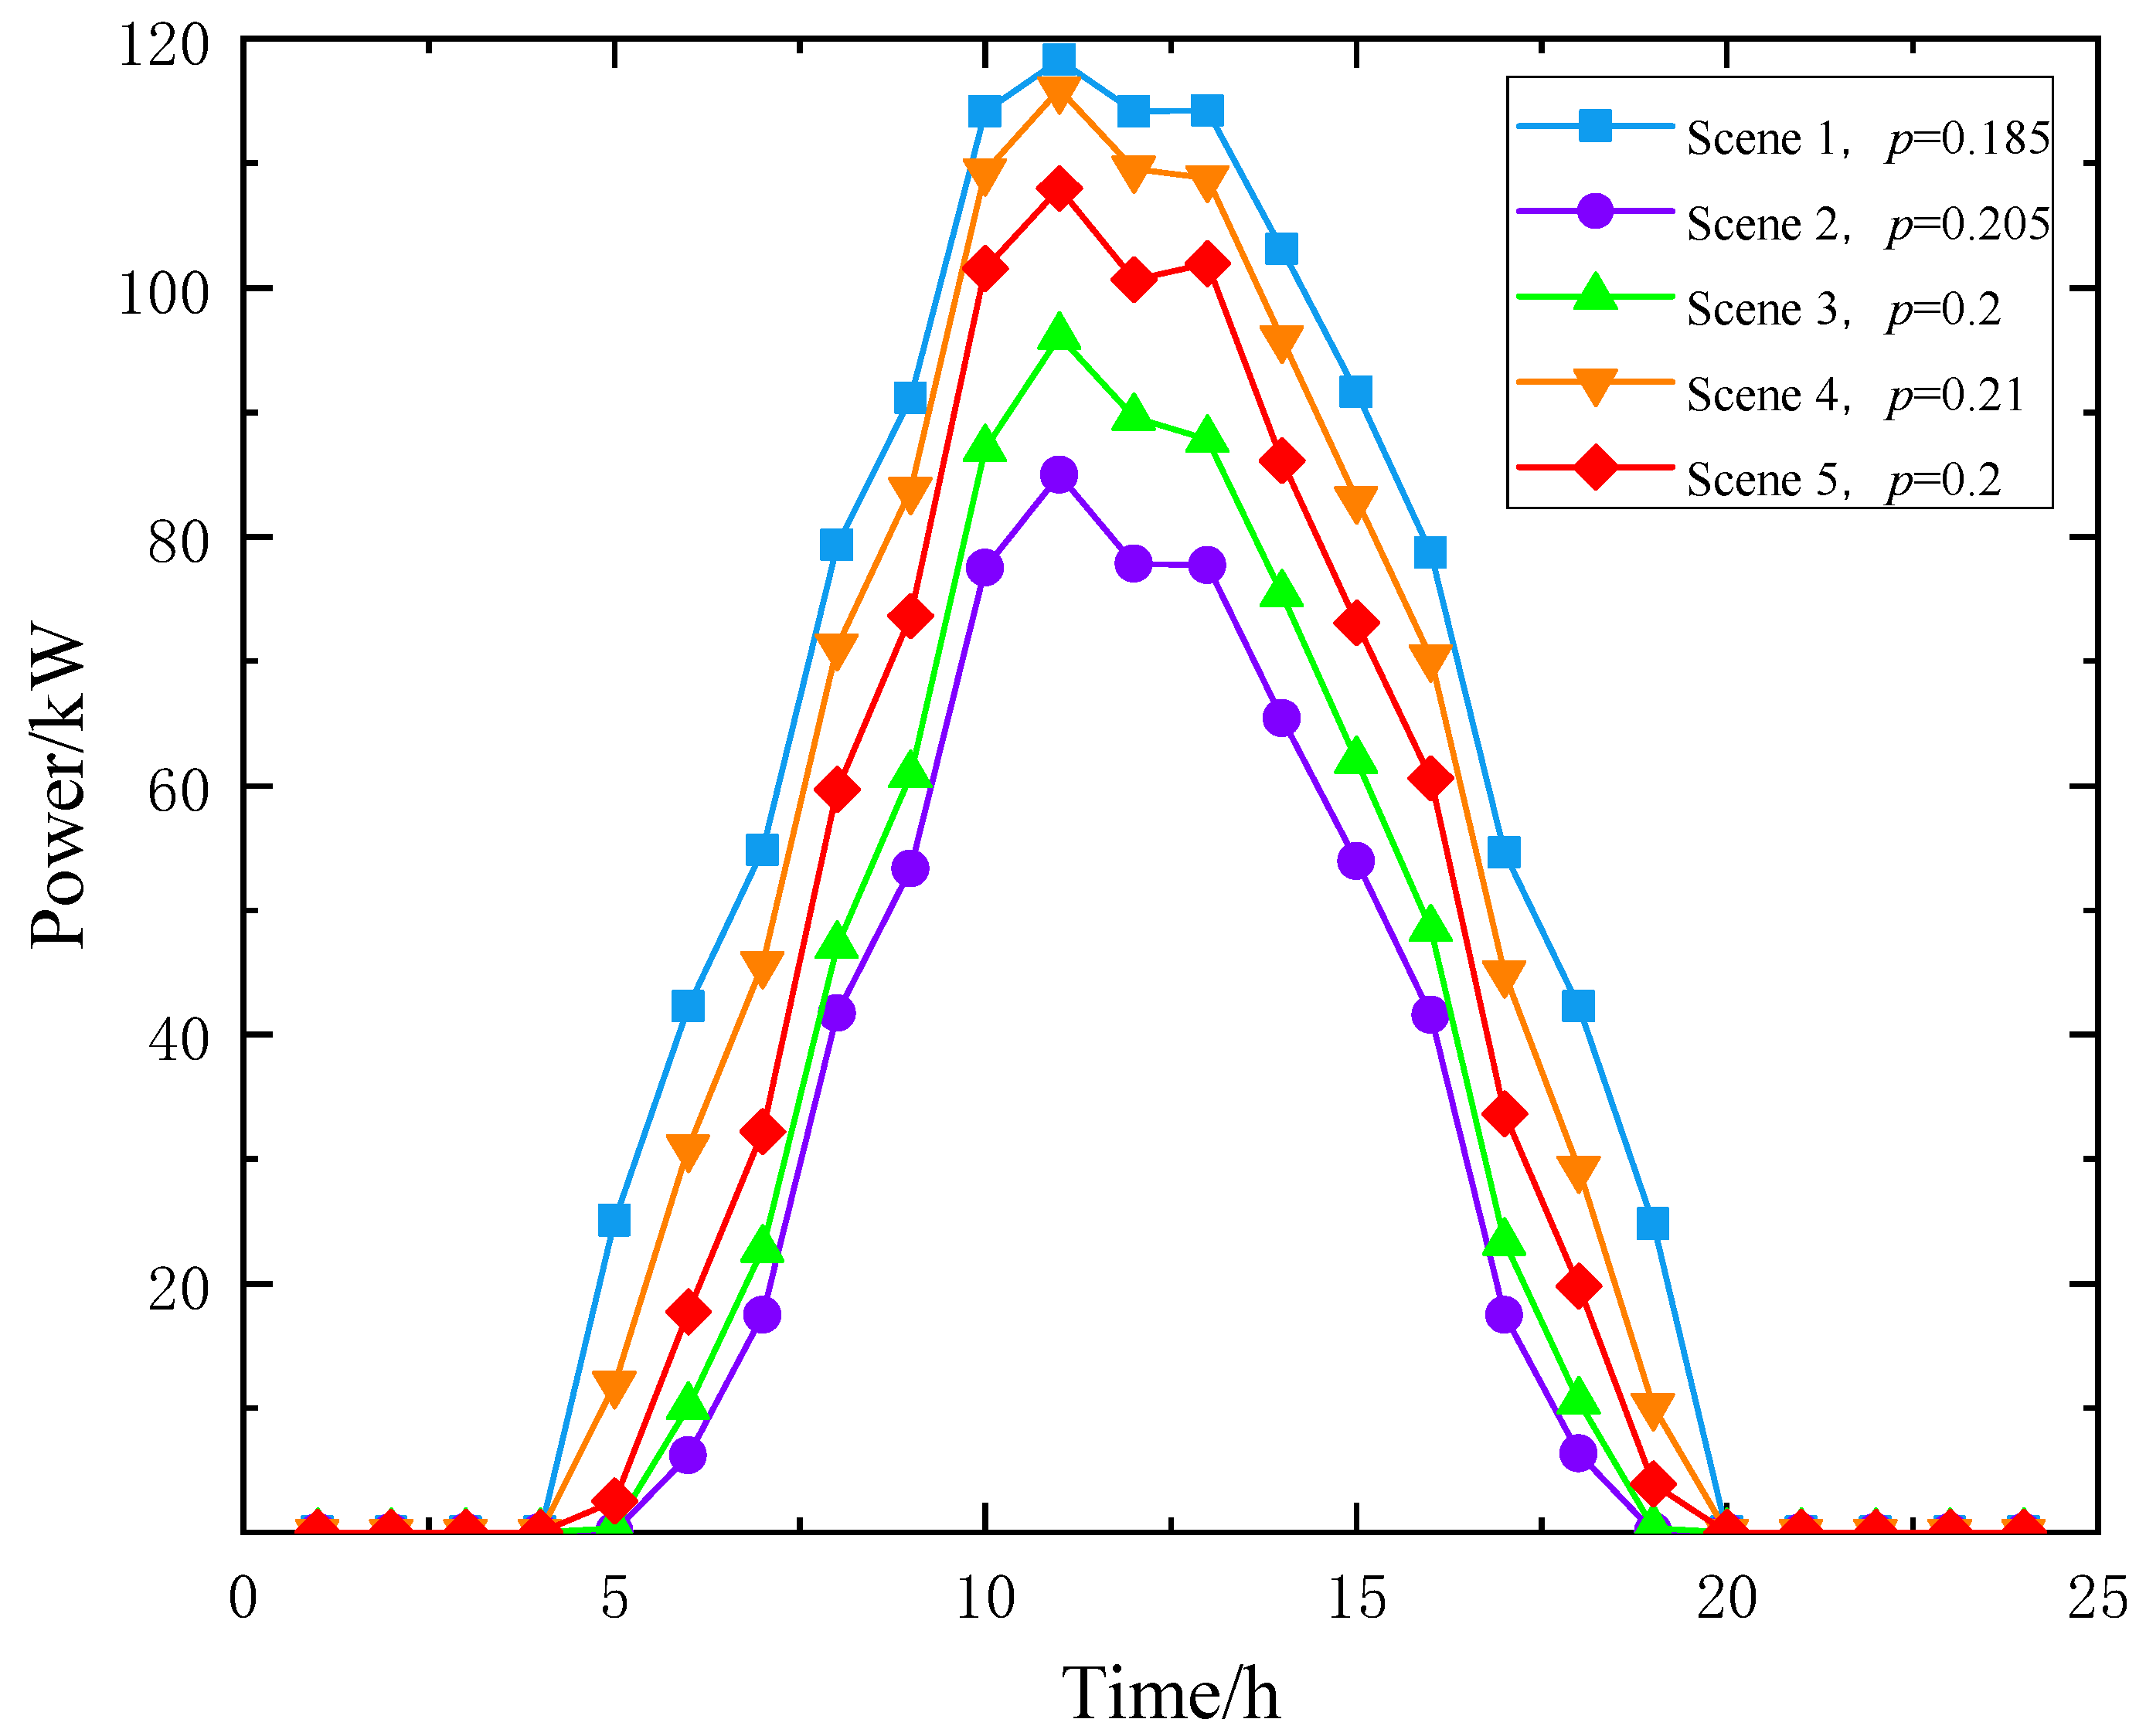
5. Wind Power Scenario and Photovoltaic Scenario Generation and Reduction

Due to the uncertainty associated with distributed generation sources such as wind and photovoltaic systems [26], the rising penetration rates of these sources amplify the challenges in the grid power balance [27]. Consequently, effectively utilizing wind and solar prediction data holds significant importance for optimizing the scheduling of electric vehicle charging and discharging [28]. This paper addresses these uncertainties by employing classical scene-setting methods that incorporate probabilistic information.
In this study, a method combining Monte Carlo simulation and K-means clustering was employed to generate and reduce the number of wind and photovoltaic power scenarios. A multivariate Gaussian distribution was utilized to establish temporal correlations, focusing on the interdependence of individual wind or photovoltaic outputs across adjacent or similar time intervals. Subsequently, the Monte Carlo method was applied for the simulation, employing the Weibull distribution for wind power’s probability density function and the Beta distribution for photovoltaic power. Finally, the K-means clustering technique was used to streamline the typical scenarios and their associated probabilities.
Figure 4 and Figure 5 depict the 200 wind and photovoltaic scenarios generated using the Monte Carlo simulation. Figure 6 and Figure 7 display the five representative wind and photo-voltaic scenarios determined using the K-means clustering method. Each figure also presents the respective probabilities associated with each scenario. These post-reduction wind and photovoltaic scenarios serve as exemplars in the subsequent validation phase to assess the efficacy of the proposed bi-objective optimization scheduling method for electric vehicles under varying conditions.

6. Simulation Analysis

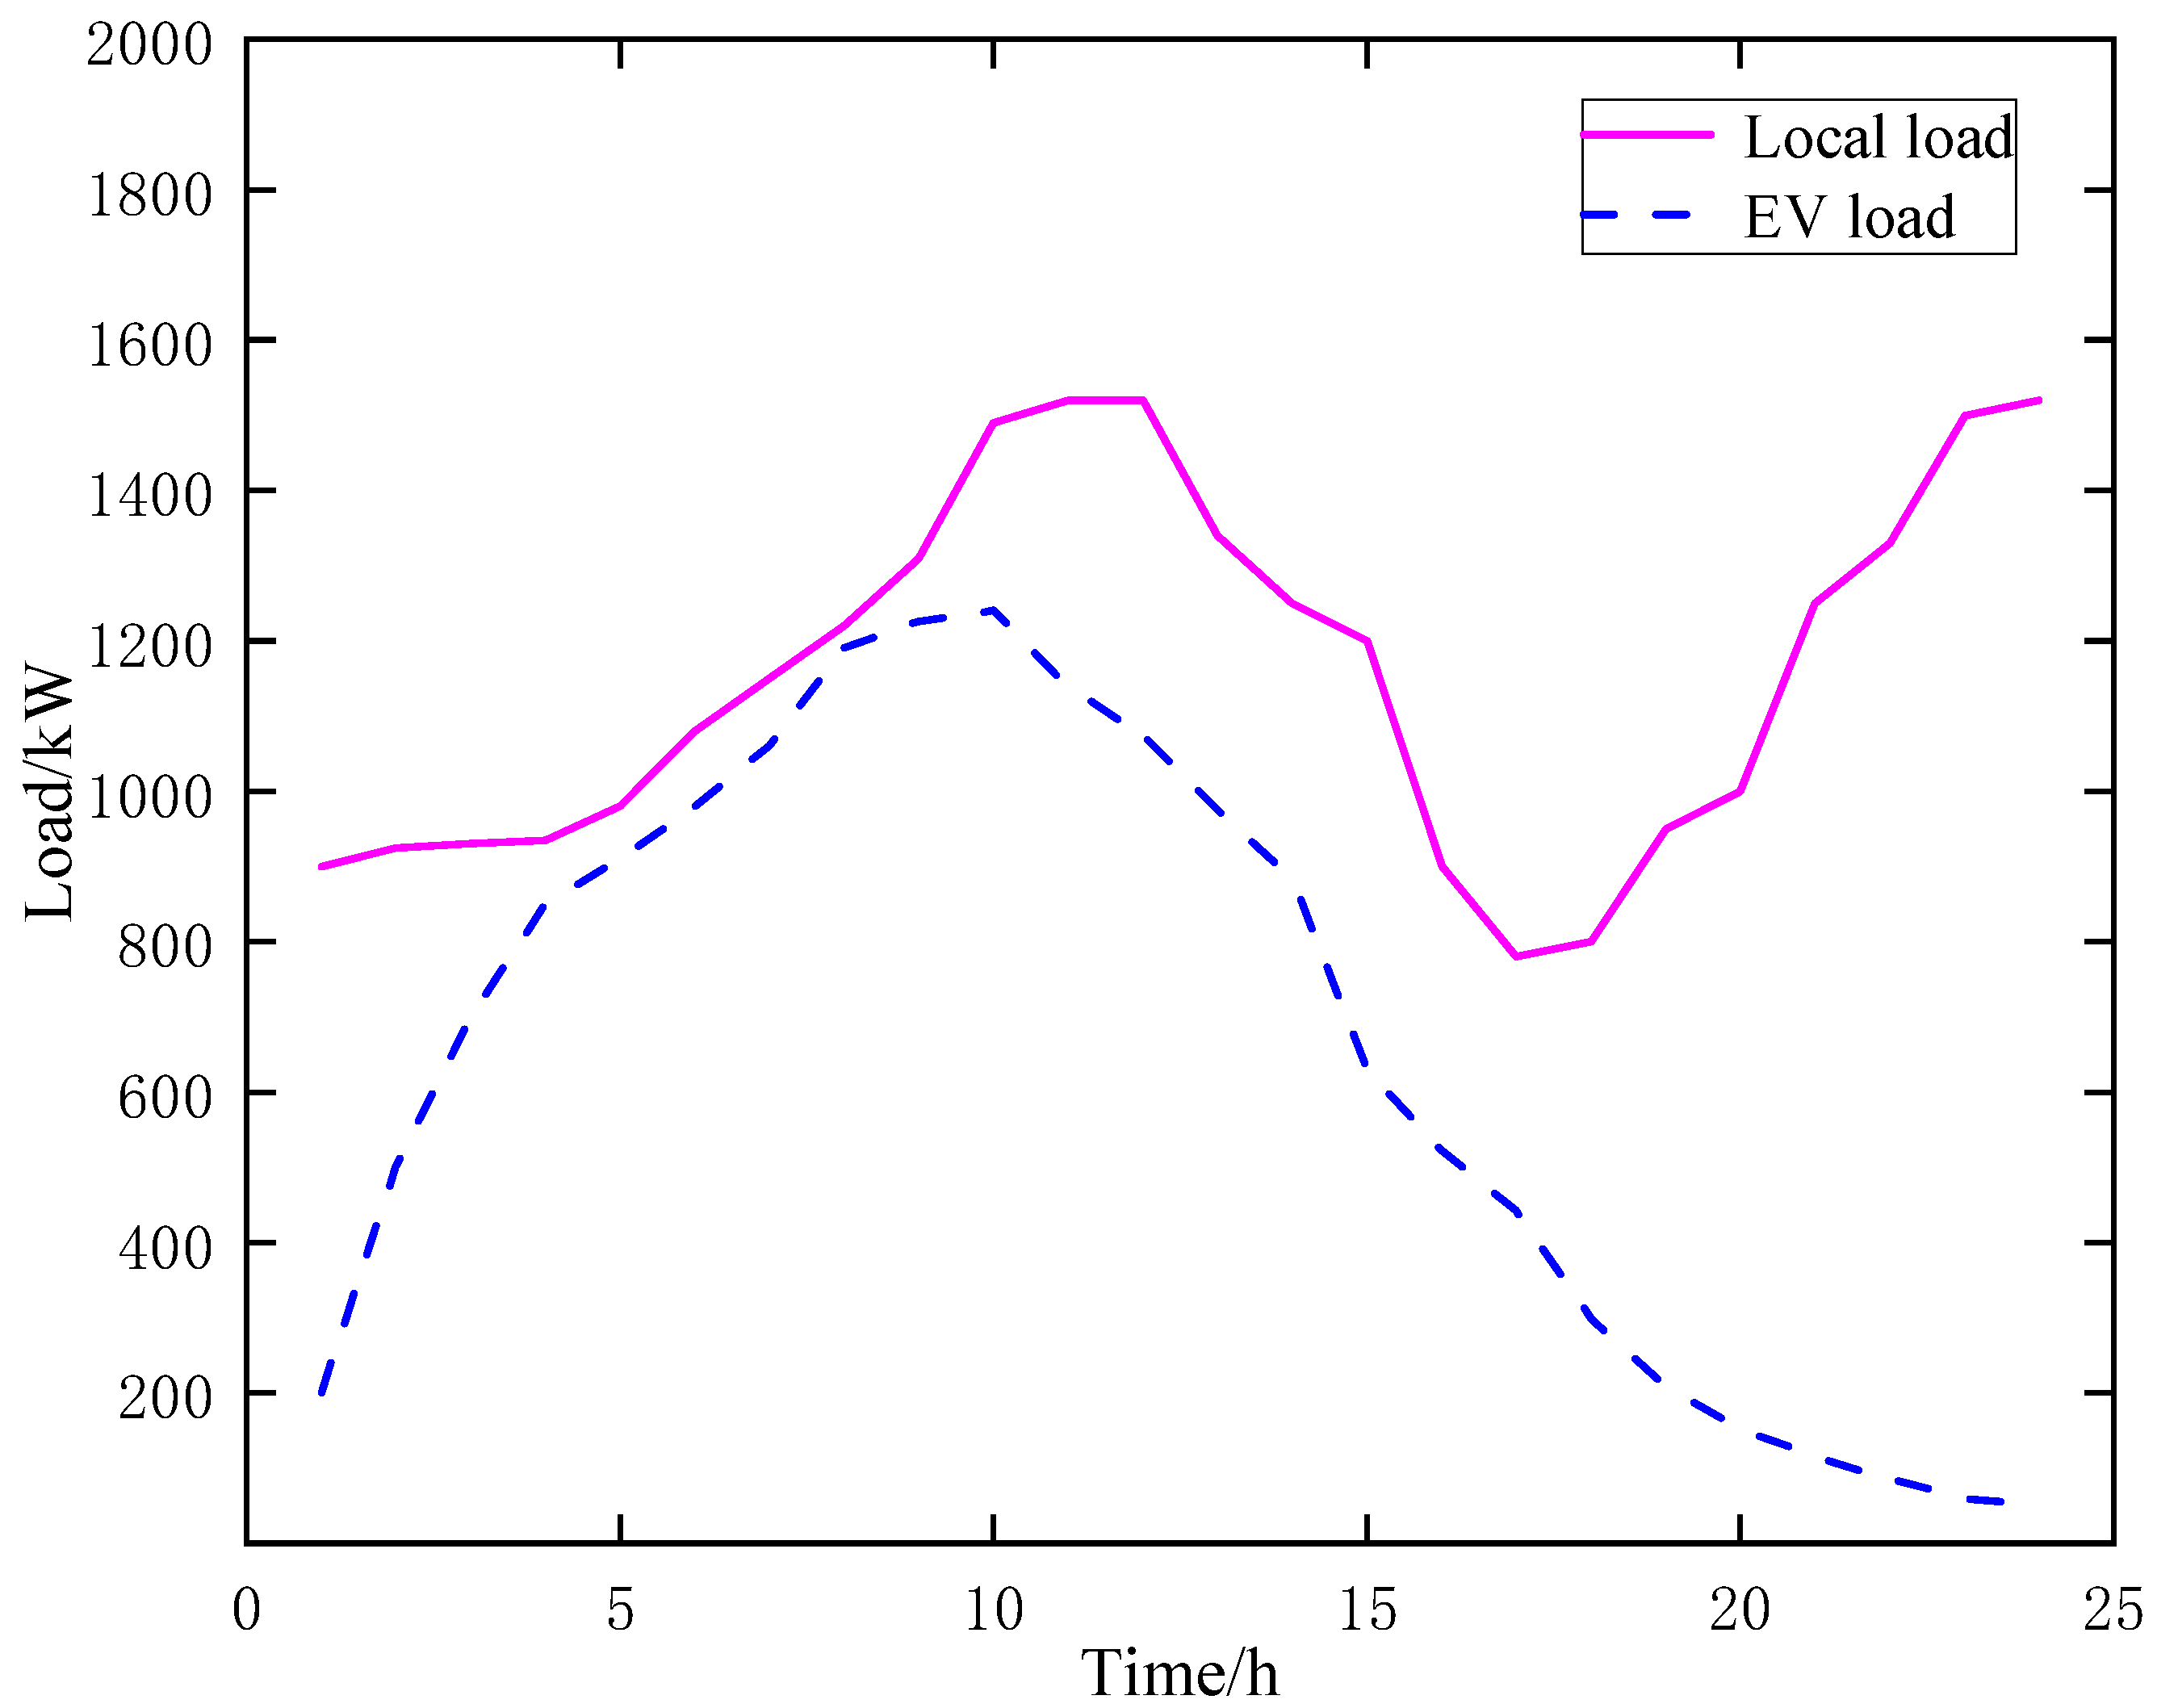
6.1. System Initial Data

The relevant parameters of electric vehicles are presented in Table 2, and the initial load of electric vehicles was simulated using the travel probability density function provided earlier. In this study, the Monte Carlo method was employed to randomly sample driving data from electric vehicles based on these parameters [29], generating simulated load data for input into the model. The initial load profile is depicted in Figure 8, assuming the local load data are available. Additionally, Figure 9 illustrates the 24 h time-of-use charging and discharge prices.

6.2. Simulation Environment

All the experiments performed in this paper are based on the 64-bit Windows 10 operating system environment equipped with a 5th generation Intel (R) Core (TM) i5-8265U processor (main frequency 1.60 GHz) and 8 GB memory, using MATLAB R2019b software.

6.3. Algorithm Parameters Setting and Optimization

The main parameters of the IBBMOPSO algorithm include the population size (N), external archive size (P), iteration number (T), and mutation parameter (K). Each parameter is varied across four levels, and their respective impacts on the algorithm are evaluated using an orthogonal test design. The system schedule involves the following two response variables (RVs): user charging cost and load mean square error. Therefore, the total normalized overall desirability (OD) value method is utilized to assess the combined performance of these parameters. Initially, each RV is normalized to a range between 0 and 1. Subsequently, the geometric mean OD of the normalized values across all experiments serves as the optimization index for each parameter. A higher OD value indicates better algorithmic performance. The calculation equation is expressed as follows:
d i = F i max F i F i max F i min
O D = ( d 1 d 2 d l ) l
The parameter level of the algorithm and the orthogonal test results are shown in Table 3 and Table 4.
The trend in factor levels in the IBBMOPSO algorithm is illustrated in Figure 10. It is evident that the optimal performance was achieved when N = 75, P = 40, T = 300, and K = 5. To validate its superior performance in optimizing the scheduling of electric vehicle charging and discharging, IBBMOPSO was compared with other optimization algorithms, namely MOPSO, MODE, and NSGA-II. The parameters for these algorithms were configured based on the settings above.
To ensure the accuracy and comparability of the simulation results, this paper standardized the parameters of the control algorithm to align with those of the IBBMOPSO algorithm. This includes matching parameters such as the number of groups, iterations, and the size of the external archive. In the NSGA-II algorithm, this paper specified a crossover probability of 0.9 and a mutation probability of 0.1. In the MOPSO algorithm, this paper set the learning rate to a constant value of 2, with an inertia weight of 0.9. In the MODE algorithm, the scaling factor is set to 0.1, and the crossover probability is set to 0.5.

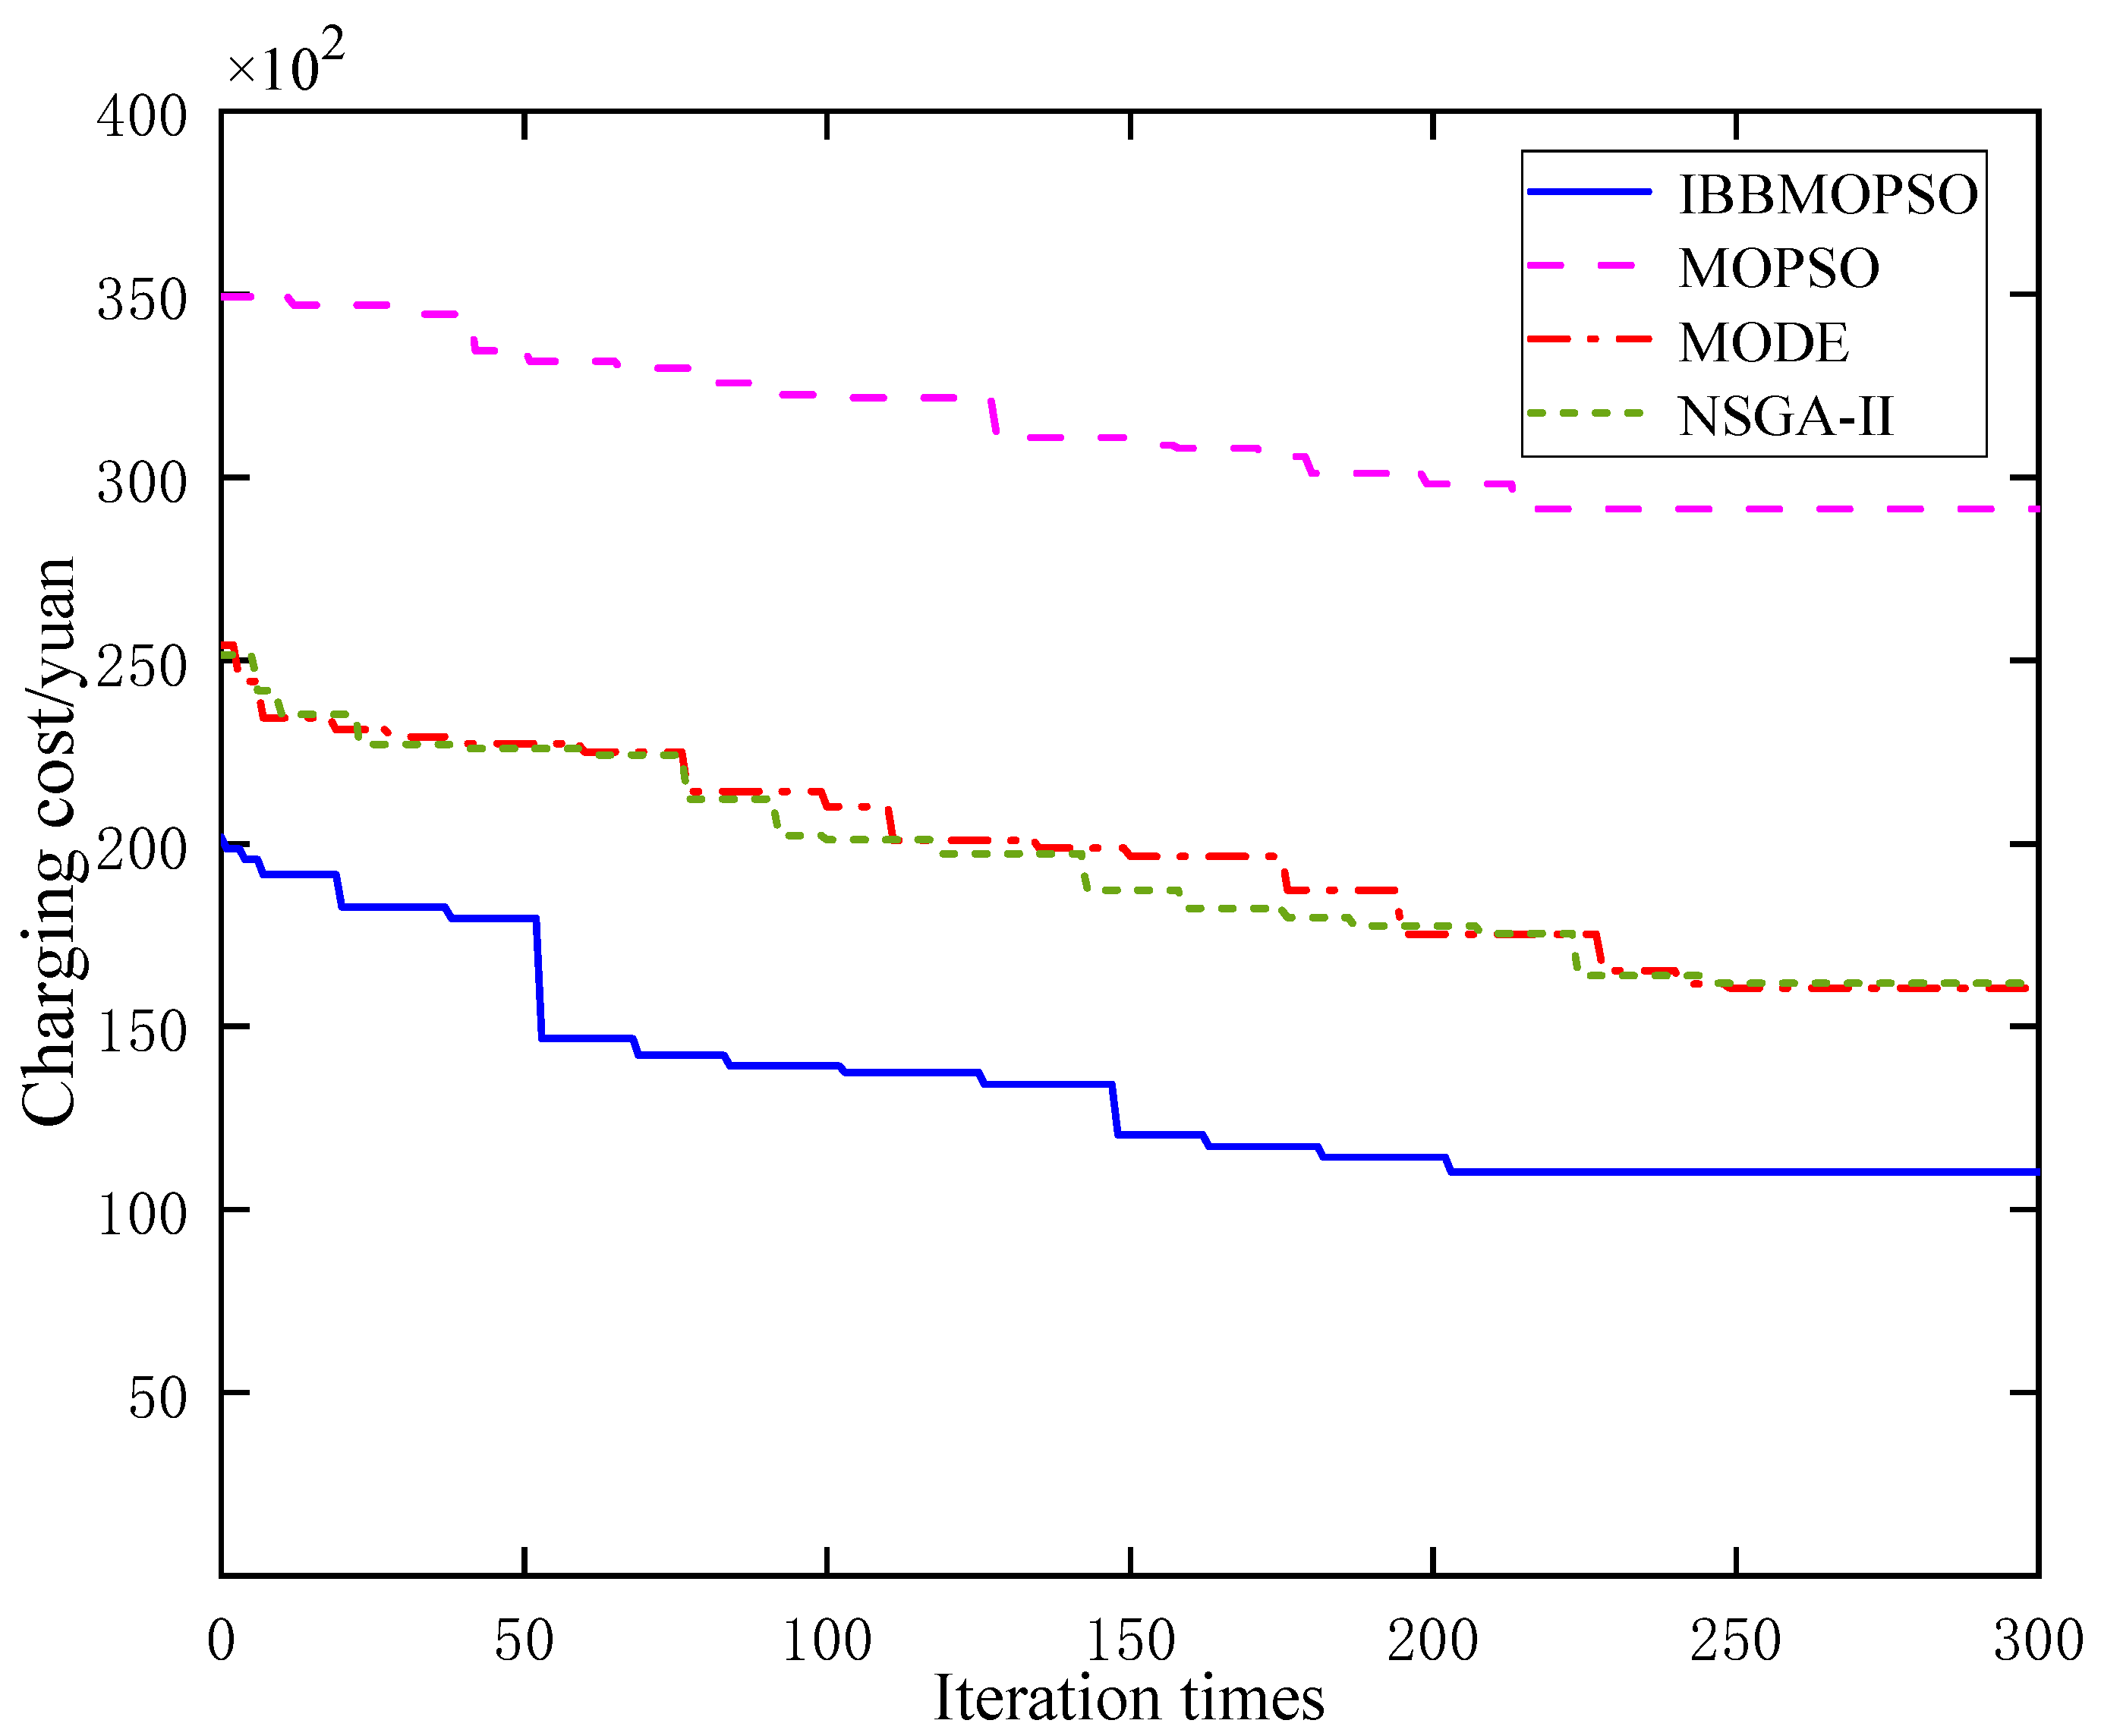
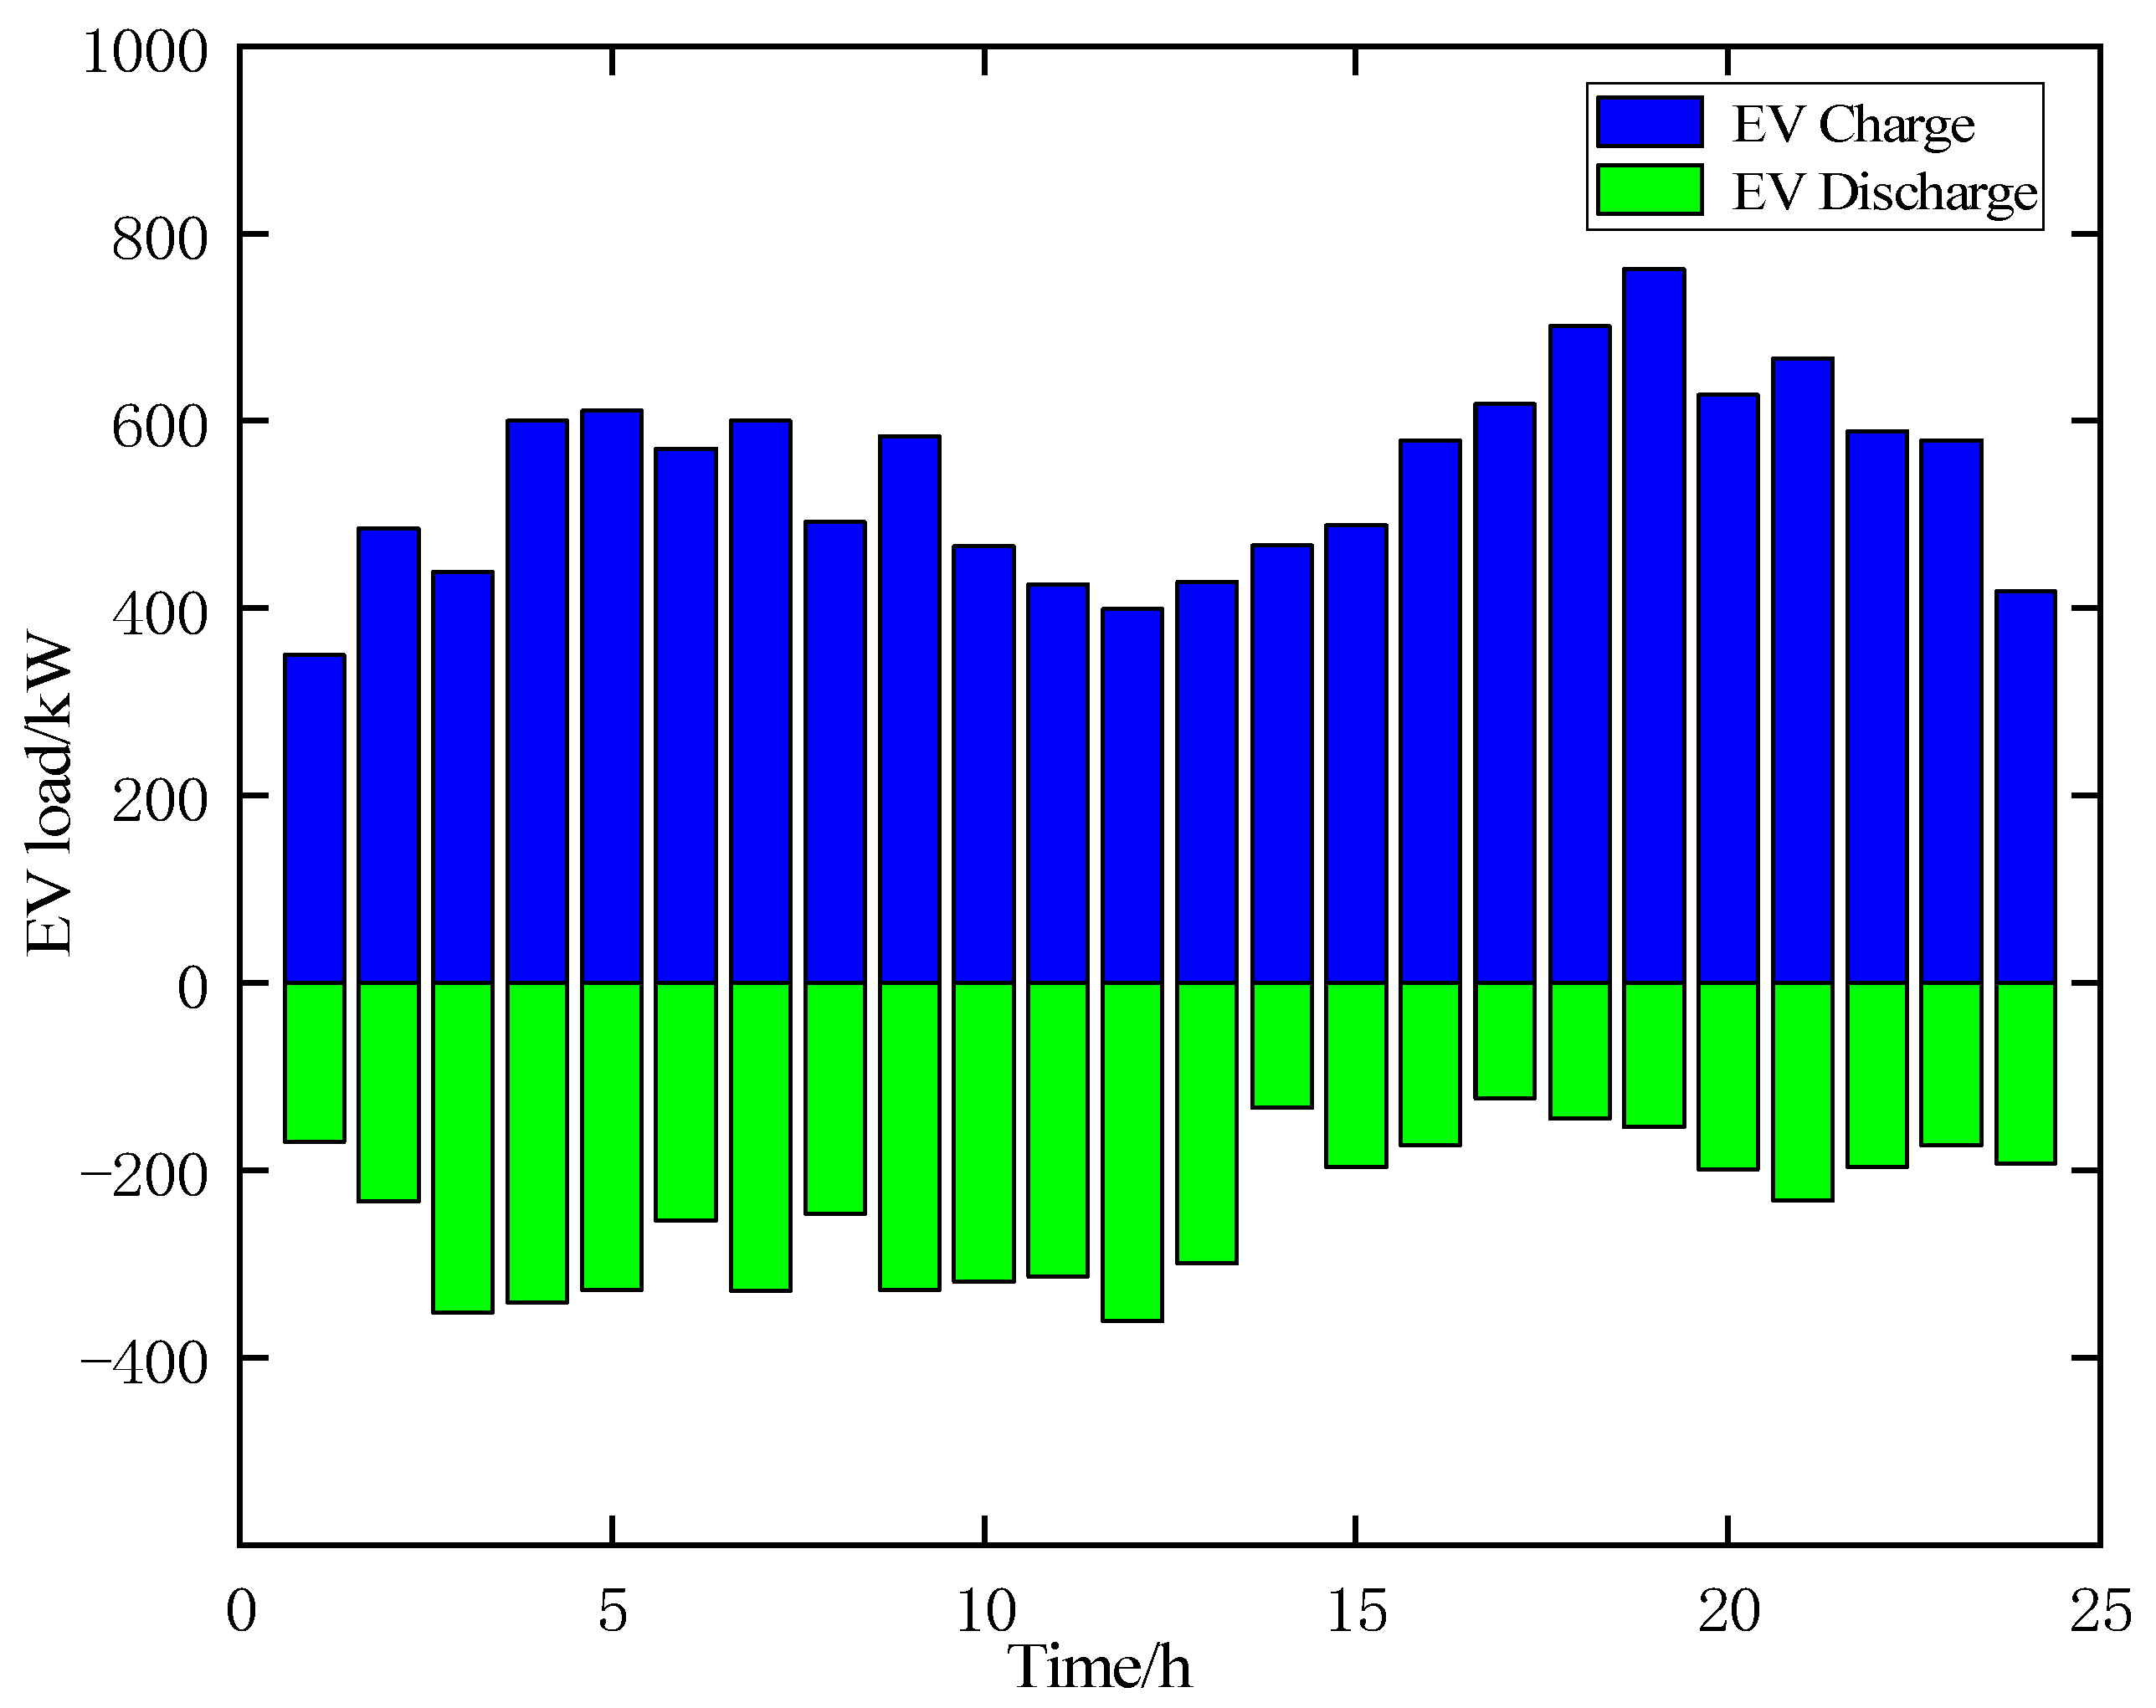
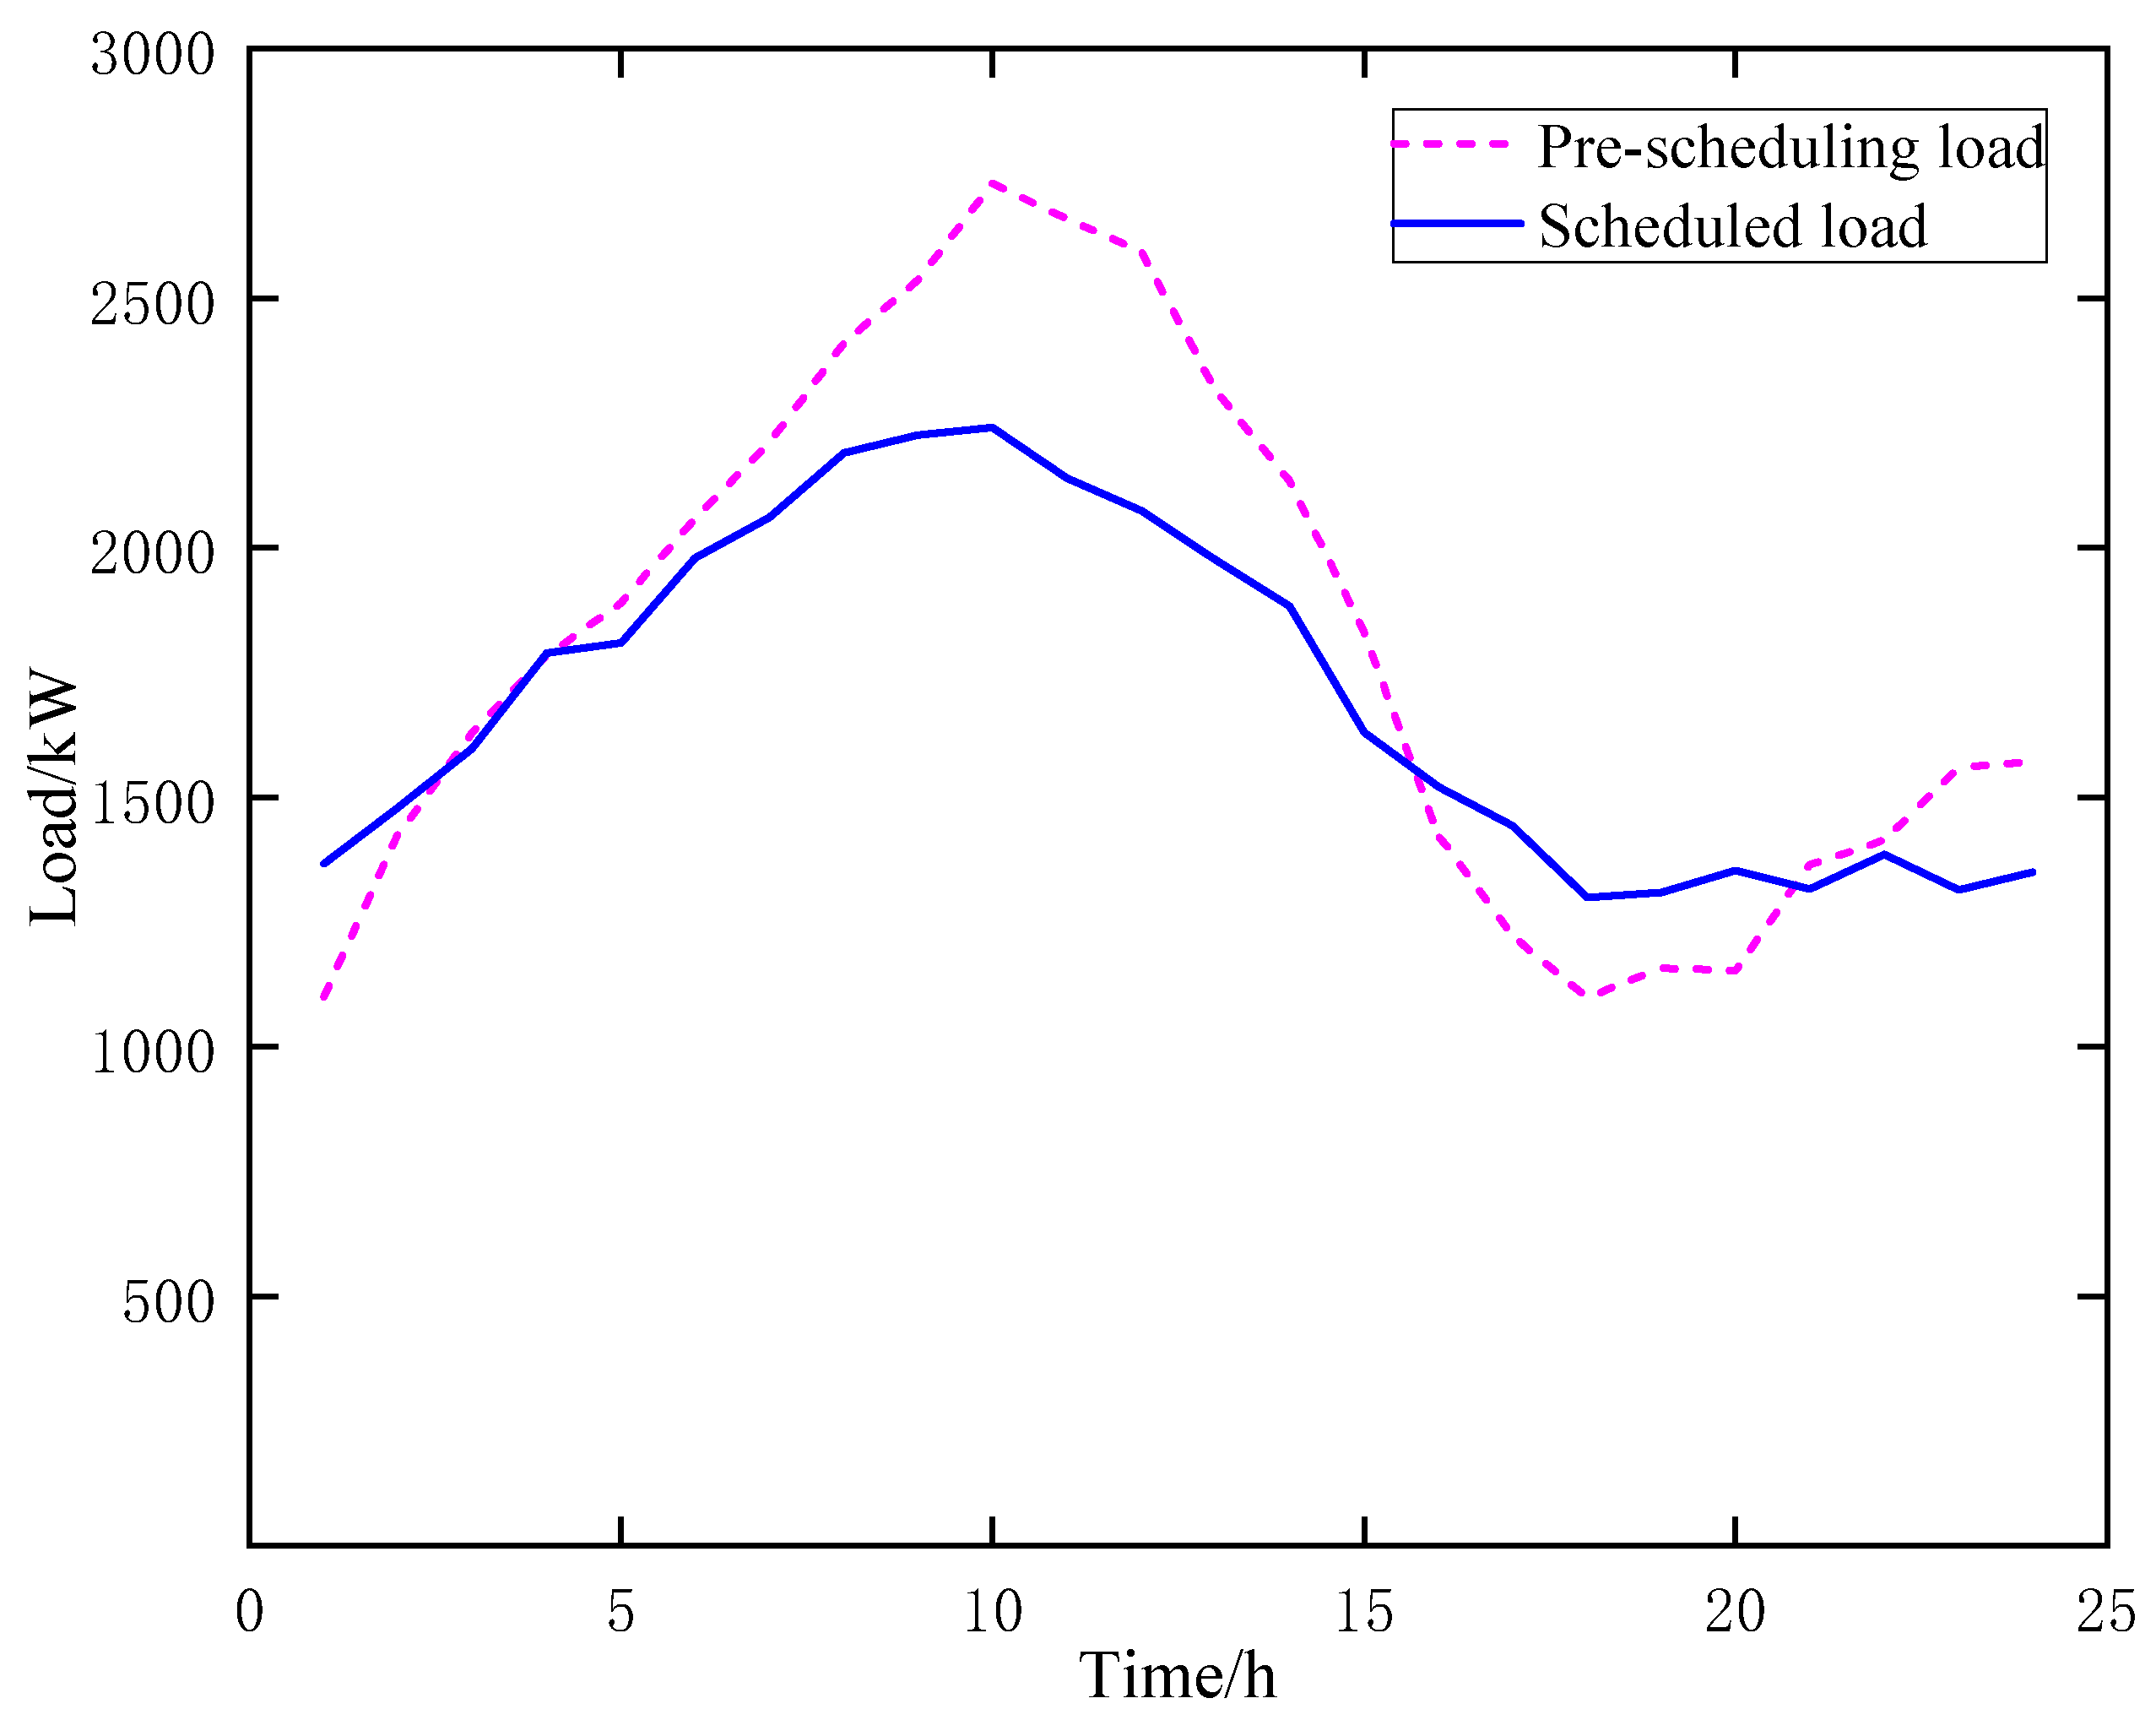
6.4. Simulation Results Analysis

To substantiate the rationality and efficacy of the proposed optimal scheduling strategy, this paper selects a typical day’s conventional power load profile in a regional microgrid as a case study. The scheduling strategy outlined in this paper is then applied. Specifically, the optimal operational cycle spans 24 h, with an optimization interval of 1 h.
After confirming the scheduling system’s initial data and the scheduling algorithms’ parameter settings, we applied IBBMOPSO, MOPSO, MODE, and NSGA-II algorithms to solve the model in the No. 2 wind and photovoltaic scenario. The corresponding Pareto results are depicted in Figure 11. Minimizing the mean square error of the load and user charging cost is imperative throughout the optimization process. Consequently, the Pareto solution set generated by the IBBMOPSO algorithm significantly outperforms those of NSGA-II, MOPSO, and MODE algorithms. This observation underscores the IBBMOPSO algorithm’s distinct advantages in effectively addressing the proposed bi-objective optimization model for electric vehicle charging and discharging scheduling.
The convergence of system load mean square error and charging cost is shown in Figure 12 and Figure 13. Compared to other algorithms, the IBBMOPSO algorithm demonstrates superior performance in achieving lower targets for both load mean square error and user charging cost. It exhibits the fastest convergence speed, substantiating its effectiveness in solving the proposed model.
Table 5 and Table 6 present the decision outcomes for each algorithm and the solution outputs specifically for the IBBMOPSO algorithm across five scenarios. The results demonstrate that the IBBMOPSO algorithm consistently yields superior solutions compared to other algorithms. Moreover, the proposed IBBMOPSO algorithm exhibits adaptability across various scenarios.
To further highlight the advantages of the IBBMOPSO algorithm in addressing the bi-objective optimization scheduling challenge for electric vehicle charging and discharging, this paper presents the 24 h charging and discharging profiles obtained by the IBBMOPSO algorithm under Scenario 2, as depicted in Figure 14. Additionally, Figure 14 illustrates the system load curve before and after scheduling.
Figure 15 reveals that the total load on the power grid peaks between 05:00 and 14:00 and reaches a trough between 15:00 and 21:00 when comparing the disordered load to the ordered load during the electric vehicle charge and discharge schedule. Disordered charging by electric vehicle users exacerbates peak loads on the power grid. Conversely, an orderly charging and discharging strategy schedules electric vehicles to charge during periods of low grid load and discharge during peak load times, alleviating grid pressure during high, local demand periods. This strategy effectively reduces peak loads and facilitates peak load shifting within the power system.

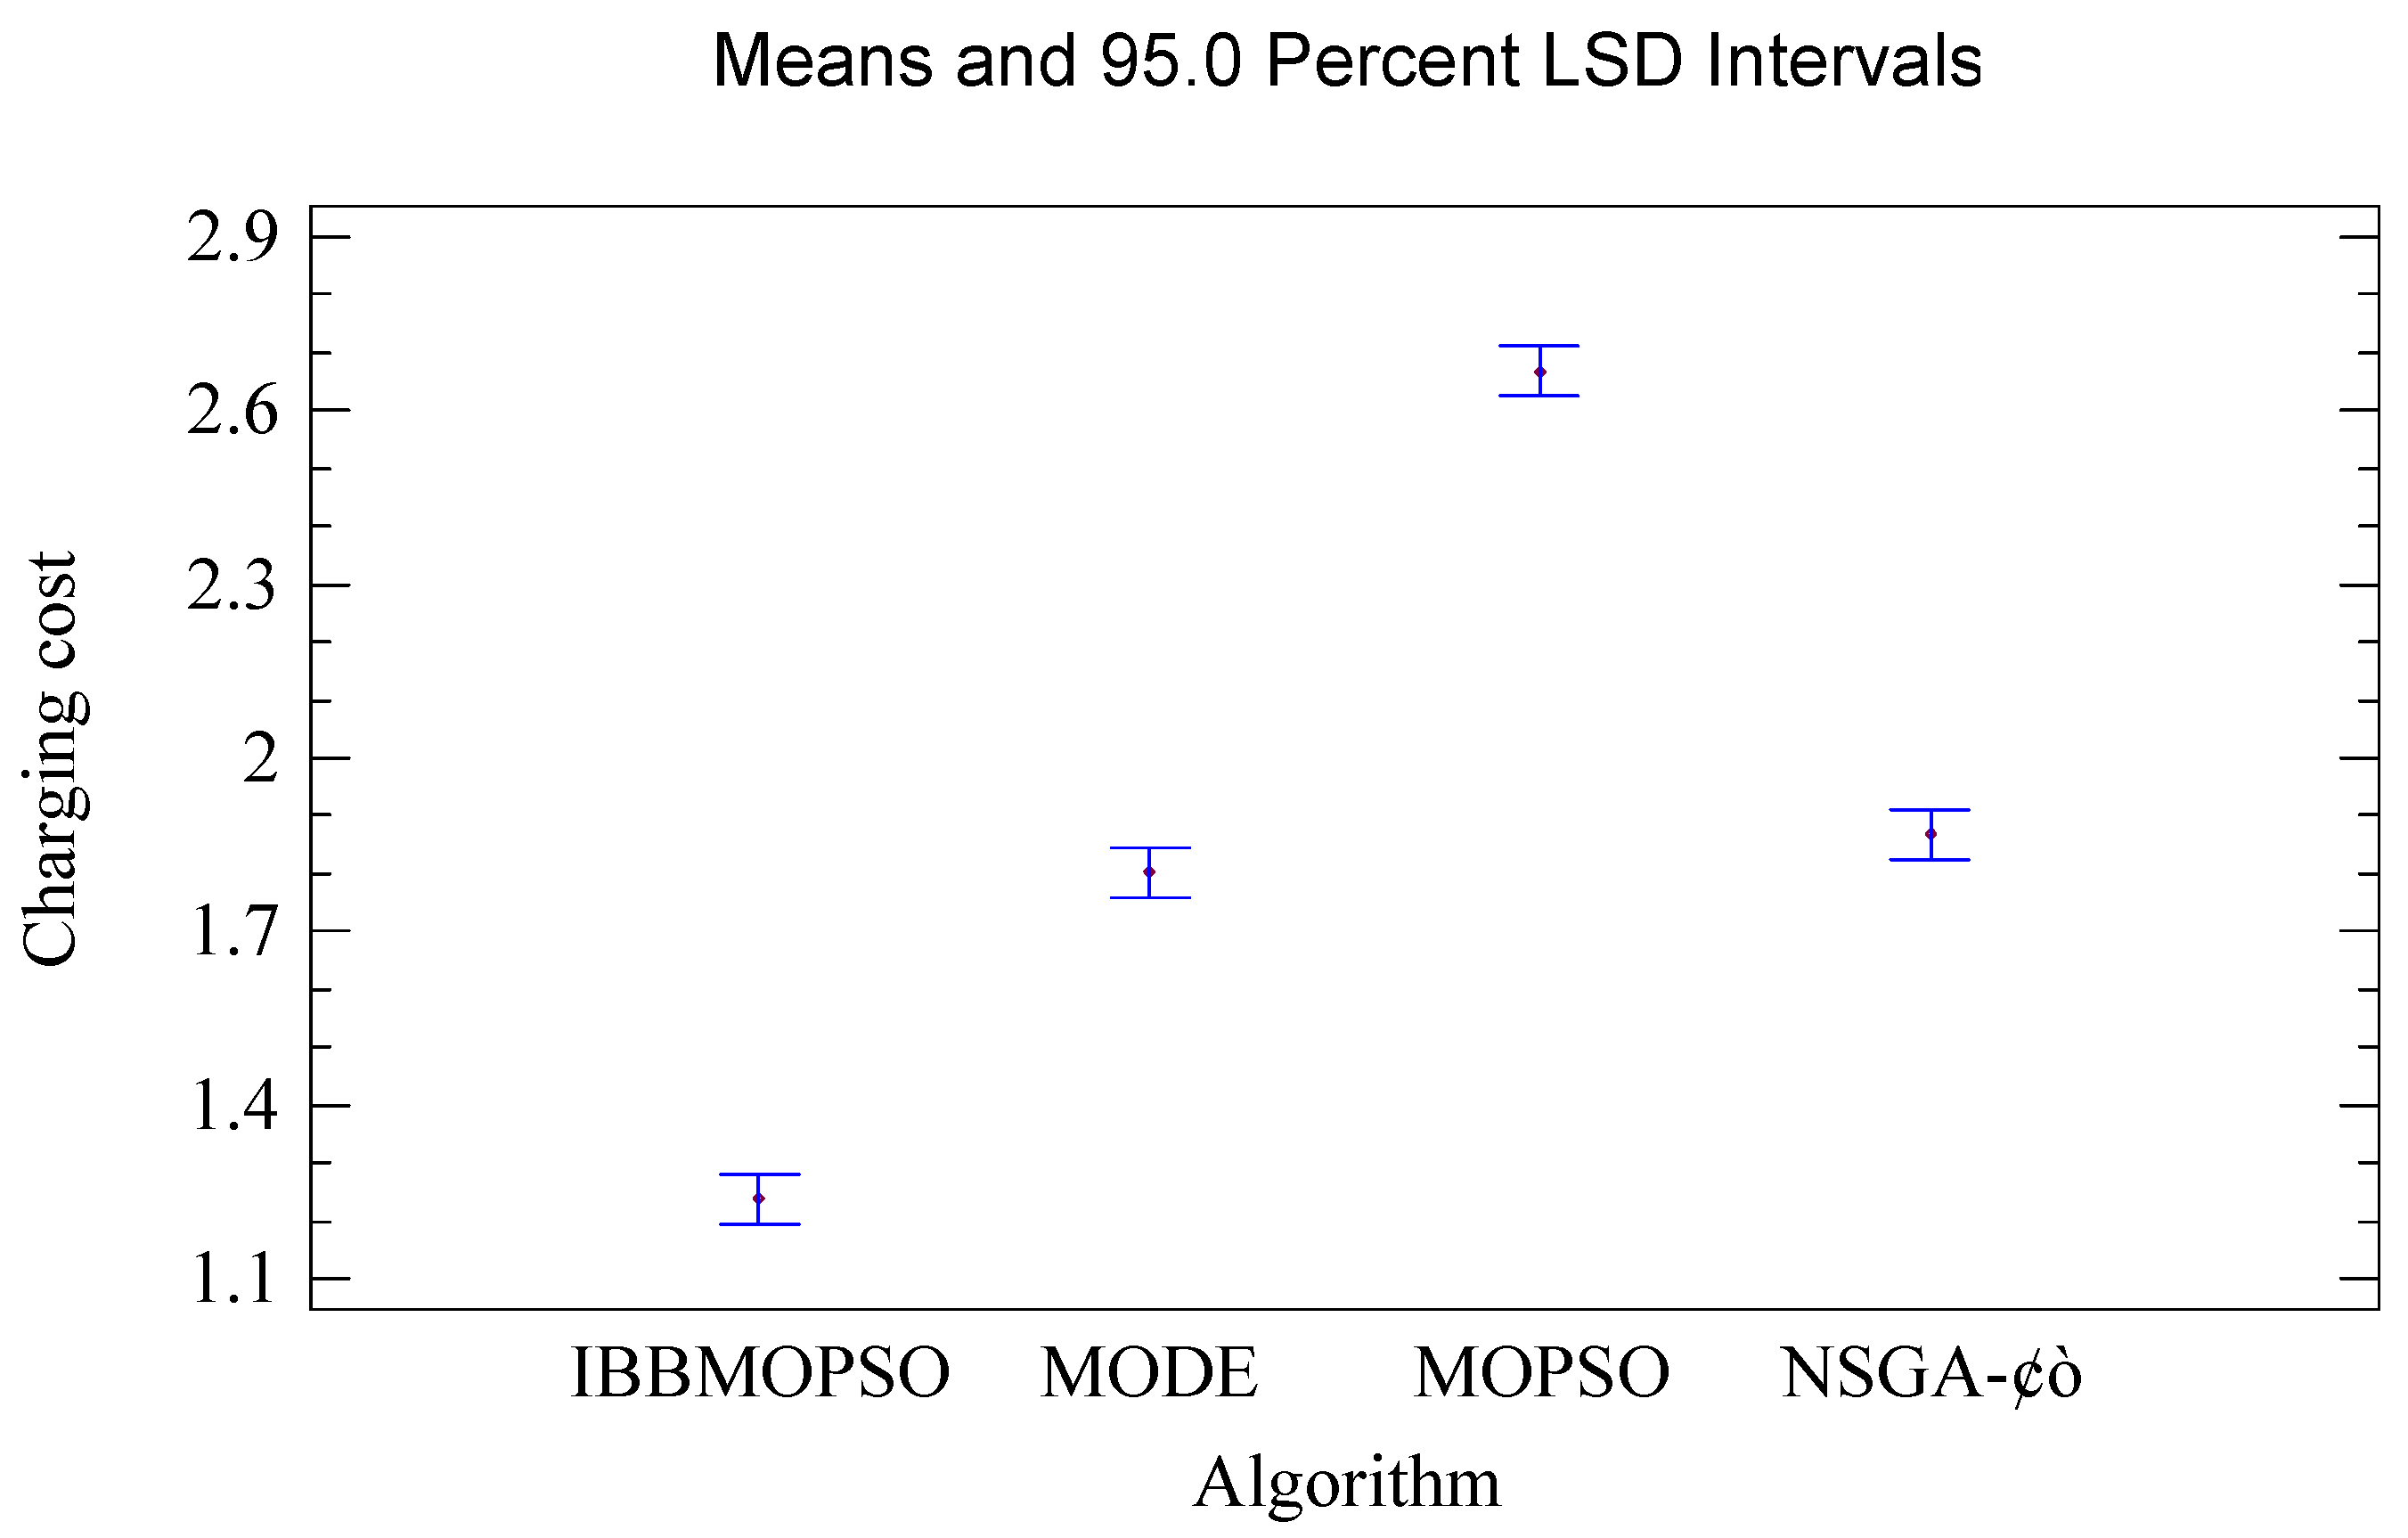
6.5. Algorithm Analysis

After employing an intelligent algorithm to solve the model, it is necessary to evaluate its performance. Typically, the effectiveness of a multi-objective optimization algorithm is assessed through convergence and distribution metrics. Convergence measures how close the solution set is to the Pareto front. At the same time, diversity gauges the exploration of the solution space and the density of solutions distributed across the Pareto front. In recent years, commonly used evaluation indices include hypervolume, inverted generational distance, and maximum spread.
(1) Hypervolume evaluation index
The hypervolume metric calculates the region’s volume formed by the non-dominated solution set and a specified reference point [30]. This index value directly correlates with the quality of the evaluated solution set. The equation is as follows:
HV ( S , P ) = V o l u m e x s [ f 1 ( x ) , z 1 p ] × × [ f m ( x ) , z m p ]
where S represents the evaluated population and P represents a set of reference points from the Pareto front.
(2) Inversion generation distance
The performance of the algorithm is evaluated using the IGD index, which calculates the sum of distances from the solution set individuals generated by the algorithm to the nearest points on the actual Pareto boundary [31]. A smaller index value indicates a better convergence and distribution of the solution set obtained by the algorithm, indicating a higher quality of solutions. The equation is as follows:
IGD S , P = X S min d S , P S
where (S) denotes the evaluated population; (P) represents a set of reference points located above the Pareto front; and (d) signifies the Euclidean distance between the obtained solution and the reference point. This metric reflects the average distance between solutions within the set and the reference points.
(3) Maximum spread
The MS index assesses the extent to which the non-inferior solution set generated by the algorithm covers the actual Pareto optimal frontier [32]. A higher value of this index indicates the greater coverage of the algorithm’s solution set on the Pareto optimal surface, thereby reflecting a broader diversity of solutions. The calculation equation is as follows:
MS = 1 M i = 1 M min f i max , f i t r u e max max f i min , f i t r u e min f i t r u e max f i t r u e min
where M represents the number of optimization objectives; f i max and f i min represent the maximum and minimum values of the target i obtained by the algorithm; and f i t r u e max and f i t r u e min represent the maximum and minimum values of target i on the real Pareto front, respectively.
When evaluating performance indicators such IGD and MS, it is crucial to accurately delineate the Pareto boundary of the optimization problem. However, in practical scenarios, pinpointing this boundary can be challenging. To address this issue, several strategies can be employed to approximate the true Pareto front. Initially, each algorithm tasked with solving the scheduling problem is independently executed ten times, and the resulting Pareto solution sets from each run are collected. Subsequently, these solutions are amalgamated into a comprehensive solution library, which is then subjected to non-dominated sorting based on crowding distance. Ultimately, the selected non-dominated solutions are considered proximate to the genuine Pareto optimal solution set.
The evaluation results are presented in Table 7. According to the IGD index, IBBMOPSO achieves a value of 2.871 × 10⁻³, significantly smaller than the other three algorithms. Regarding the HV index, the IBBMOPSO algorithm demonstrates superior performance with an average value higher than that of the other algorithms. Regarding the MS index, the distribution of the Pareto front obtained by IBBMOPSO is broader. Thus, the IBBMOPSO algorithm demonstrates significant advantages in both the uniform distribution of the solution set and the convergence performance towards approximate optimal solutions.
To further validate the exceptional performance of the IBBMOPSO algorithm, this paper independently applied the aforementioned four algorithms to the scheduling model in Scenario 2, conducting ten iterative solution rounds. Subsequently, this paper calculated the relative percentage increase (RPI) of the optimal compromise solution derived from the scheduling decisions, with detailed values listed in Table 8.
The specific calculation equation for RPI is as follows:
R P I S = S S * S * × 100
where S represents the scheduling result obtained by the adopted algorithm and S * represents the optimal scheduling result among all the algorithms involved in the simulation operation.
The scheduling performance of different algorithms is compared, as depicted in Figure 16 and Figure 17. Through the results of multi-factor variance analysis, it is evident that the IBBMOPSO algorithm excels in addressing the bi-objective optimal scheduling problem of electric vehicle charging and discharging, particularly considering the uncertainty of wind and photovoltaic outputs under the time-of-use electricity pricing proposed in this study.

7. Conclusions

With the aim of addressing the optimal scheduling problem of the charging and discharging of electric vehicles, in this study, a scheduling strategy was proposed based on the IBBMOPSO algorithm, which was validated through practical cases for its effectiveness and superiority. This strategy ensured that solutions were kept stable in different wind power photovoltaic scenarios and demonstrated a superior solution performance compared to simulation results for standard intelligent algorithms in the scheduling field. The main conclusions of this paper can be summarized as follows:
(1) The output of wind and photovoltaic energy is highly uncertain. In this study, 200 wind and photovoltaic scenarios were generated using the Monte Carlo method, and then the 200 scenes were reduced to 5 typical scenarios using the K-means method. The simulation proves that the proposed scheduling method can maintain a stable and efficient solution ability in different scenarios.
(2) The simulation results show that the proposed scheduling method can effectively reduce the charging cost of electric vehicle users and the load fluctuation of the system, ensuring its economic and stable operation.
(3) Through the simulation results, algorithm evaluation indicators, and multi-factor analysis of variance, it can be concluded that compared with the MOPSO, MODE, and NSGA-II algorithms commonly used in the scheduling field, the IBBMOPSO algorithm has a better performance in solving the optimal scheduling problem of charging and discharging for electric vehicles.

Author Contributions

Conceptualization, H.L.; methodology, X.P.; software, W.J.; validation, W.J.; formal analysis, X.P.; investigation, X.P. and W.J.; resources, H.L.; data curation, H.L.; writing—original draft preparation, X.P. and W.J.; writing—review and editing, X.P. and H.L.; visualization, W.J.; supervision, H.L.; project administration, W.L.; funding acquisition, X.P. and Q.G. All authors have read and agreed to the published version of the manuscript.

Funding

This research was funded by the Shenyang Science and Technology Plan Project (Grant number 22-322-3-29), the Natural Science Foundation of Liaoning Province of China (Grant number 2022JH1/10400033 and 2023JH2/101700261).

Data Availability Statement

The raw data supporting the conclusions of this article will be made available by the authors on request.

Conflicts of Interest

The authors declare that they have no conflicts of interest.

Abbreviations

V2GVehicle-to-Grid;
IBBMOPSOImproved bare-bones multi-objective particle swarm optimization;
LSTMLong Short-Term Memory;
LPLinear Programming;
IGDInverted Generational Distance;
HVHypervolume;
MSMaximum spread;
TOPSISTechnique for order preference by similarity to an ideal solution;
MOPSOMulti-objective particle swarm optimization;
MODEMulti-Objective Differential Evolution;
NSGA-IINon-dominated Sorting Genetic Algorithm II;
IGWAImproved grey wolf algorithm;
ICSAImproved cuckoo search algorithm;
SOCState of capacity;
RVResponse variables;
RPIRelative percentage increase.

References

  1. Bhaskar, C.; Jain, S.K. Scheduling of electric vehicle’s power in V2G and G2V modes using an improved charge–discharge opportunity-based approach. IEEE Trans. Transp. Electrif. 2023, 10, 811–822. [Google Scholar]
  2. Khabbouchi, I.; Said, D.; Oukaira, A.; Mellal, I.; Khoukhi, L. Machine learning and game-theoretic model for advanced wind energy management protocol (AWEMP). Energies 2023, 16, 2179. [Google Scholar] [CrossRef]
  3. Shaheen, H.I.; Rashed, G.I.; Yang, B.; Yang, J.; Shaheen, H.I.; Rashed, G.I.; Yang, B.; Yang, J. Optimal electric vehicle charging and discharging scheduling using metaheuristic algorithms: V2G approach for cost reduction and grid support. J. Energy Storage 2024, 90, 111816. [Google Scholar] [CrossRef]
  4. Yin, W.; Xuan, Q. Cooperative optimization strategy for large-scale electric vehicle charging and discharging. Energy 2022, 258, 124969. [Google Scholar] [CrossRef]
  5. Khalid, H.M.; Peng, J.C.H. Bidirectional charging in V2G systems: An in-cell variation analysis of vehicle batteries. IEEE Syst. J. 2020, 14, 3665–3675. [Google Scholar] [CrossRef]
  6. Tookanlou, M.B.; Kani, S.A.P.; Marzband, M. A comprehensive day-ahead scheduling strategy for electric vehicles operation. Int. J. Electr. Power Energy Syst. 2021, 131, 106912. [Google Scholar] [CrossRef]
  7. Chai, Y.T.; Che, H.S.; Tan, C.; Tan, W.-N.; Yip, S.-C.; Gan, M.-T. A two-stage optimization method for vehicle to grid coordination considering building and electric vehicle user expectations. Int. J. Electr. Power Energy Syst. 2023, 148, 108984. [Google Scholar] [CrossRef]
  8. Zhang, L.; Liu, Y.; Hao, L.; Zheng, X.; Liu, X.; Li, J. Multi-objective optimal scheduling strategy of microgrid based on V2G technology. In Proceedings of the 2022 12th International Conference on Power and Energy Systems (ICPES), Guangzhou, China, 23 December 2022. [Google Scholar]
  9. Paraskevas, A.; Aletras, D.; Chrysopoulos, A.; Marinopoulos, A.; Doukas, D.I. Optimal management for EV charging stations: A win–win strategy for different stakeholders using constrained deep Q-learning. Energies 2022, 15, 2323. [Google Scholar] [CrossRef]
  10. Zhang, C.; Yin, W.; Wen, T. An advanced multi-objective collaborative scheduling strategy for large scale EV charging and discharging connected to the predictable wind power grid. Energy 2024, 287, 129495. [Google Scholar] [CrossRef]
  11. Ren, L.; Yuan, M.; Jiao, X. Electric vehicle charging and discharging scheduling strategy based on dynamic electricity price. Eng. Appl. Artif. Intell. 2023, 123, 106320. [Google Scholar] [CrossRef]
  12. Shuai-Shuai, L.V.; Hui, W.; Ming-Yue, W.; Zi-Jie, L.; Di, W. Multi-objective day-ahead optimal scheduling of wind-solar microgrid considering V2G technology. In Proceedings of the 2022 34th Chinese Control and Decision Conference (CCDC), Hefei, China, 21 May 2022. [Google Scholar]
  13. Saner, C.B.; Trivedi, A.; Srinivasan, D. A cooperative hierarchical multi-agent system for EV charging scheduling in presence of multiple charging stations. IEEE Trans. Smart Grid 2022, 13, 2218–2233. [Google Scholar] [CrossRef]
  14. Yu, H.; Tu, J.; Lei, X.; Shao, Z.; Jian, L. A cost-effective and high-efficient EV shared fast charging scheme with hierarchical coordinated operation strategy for addressing difficult-to-charge issue in old residential communities. Sustain. Cities Soc. 2024, 101, 105090. [Google Scholar] [CrossRef]
  15. Kandpal, B.; Pareek, P.; Verma, A. A robust day-ahead scheduling strategy for EV charging stations in unbalanced distribution grid. Energy 2022, 249, 123737. [Google Scholar] [CrossRef]
  16. Yin, W.; Wen, T.; Zhang, C. Cooperative optimal scheduling strategy of electric vehicles based on dynamic electricity price mechanism. Energy 2023, 263, 125627. [Google Scholar] [CrossRef]
  17. Triviño-Cabrera, A.; Aguado, J.A.; de la Torre, S. Joint routing and scheduling for electric vehicles in smart grids with V2G. Energy 2019, 175, 113–122. [Google Scholar] [CrossRef]
  18. Huang, Z.; Guo, Z.; Ma, P.; Wang, M.; Long, Y.; Zhang, M. Economic-environmental scheduling of microgrid considering V2G-enabled electric vehicles integration. Sustain. Energy Grids Netw. 2022, 32, 100872. [Google Scholar] [CrossRef]
  19. Wang, Z.; Zhang, L.; Tang, W.; Ma, Z.; Huang, J. Equilibrium configuration strategy of vehicle-to-grid-based electric vehicle charging stations in low-carbon resilient distribution networks. Appl. Energy 2024, 361, 122931. [Google Scholar] [CrossRef]
  20. Hou, H.; Wang, Y.; Chen, Y.; Zhao, B.; Zhang, L.; Xie, C. Long-time scale vehicle-to-grid scheduling strategy considering psychological effect based on weber-fechner law. Int. J. Electr. Power Energy Syst. 2022, 136, 107709. [Google Scholar] [CrossRef]
  21. Jie, X.; Huang, Y. The short-term optimal resource allocation approach for electric vehicles and V2G service stations. Appl. Energy 2022, 319, 119200. [Google Scholar]
  22. Zaneti, L.A.; Arias, N.B.; de Almeida, M.C.; Rider, M.J. Sustainable charging schedule of electric buses in a university campus: A rolling horizon approach. Renew. Sustain. Energy Rev. 2022, 161, 112276. [Google Scholar] [CrossRef]
  23. Pan, K.; Liang, C.-D.; Lu, M. Optimal scheduling of electric vehicle ordered charging and discharging based on improved gravitational search and particle swarm optimization algorithm. Int. J. Electr. Power Energy Syst. 2024, 157, 109766. [Google Scholar] [CrossRef]
  24. Yue, H.; Zhang, Q.; Zeng, X.; Huang, W.; Zhang, L.; Wang, J. Optimal scheduling strategy of electric vehicle cluster based on index evaluation system. IEEE Trans. Ind. Appl. 2022, 59, 1212–1221. [Google Scholar] [CrossRef]
  25. Sowmya, R.; Sankaranarayanan, V. Optimal vehicle-to-grid and grid-to-vehicle scheduling strategy with uncertainty management using improved marine predator algorithm. Comput. Electr. Eng. 2022, 100, 107949. [Google Scholar]
  26. Choudhary, D.; Mahanty, R.N.; Kumar, N. Plug-in electric vehicle dynamic pricing strategies for bidirectional power flow in decentralized and centralized environment. Sustain. Energy Grids Netw. 2024, 38, 101317. [Google Scholar] [CrossRef]
  27. Er, G.; Soykan, G.; Canakoglu, E. Stochastic optimal design of a rural microgrid with hybrid storage system including hydrogen and electric cars using vehicle-to-grid technology. J. Energy Storage 2024, 75, 109747. [Google Scholar] [CrossRef]
  28. Jin, Y.; Acquah, M.A.; Seo, M.; Ghorbanpour, S.; Han, S.; Jyung, T. Optimal EV scheduling and voltage security via an online bi-layer steady-state assessment method considering uncertainties. Appl. Energy 2023, 347, 121356. [Google Scholar] [CrossRef]
  29. Pang, X.; Wang, Y.; Yang, S.; Liu, W.; Yu, Y. A bi-objective low-carbon economic scheduling method for cogeneration system considering carbon capture and demand response. Expert Syst. Appl. 2024, 243, 122875. [Google Scholar] [CrossRef]
  30. Coelloc, A.C.; Cortés, N.C. Solving multi-objective optimization problems using an artificial immune system. Genetic. Program. Evolvable Mach. 2005, 6, 163–190. [Google Scholar] [CrossRef]
  31. Zitzler, E.; Thiele, L. Multi-objective evolutionary algorithms: A comparative case study and the strength pareto approach. IEEE Trans. Evol. Comput. 1999, 3, 257–271. [Google Scholar] [CrossRef]
  32. Luo, S.; Guo, X. Multi-objective optimization problem of the microgrid power dispatch using improved multi-objective evolutionary algorithm based on decomposition. J. Sys. Sci. Math. Sci. 2020, 40, 81–104. [Google Scholar]
Figure 1. System structure diagram of an EV participating in charging and discharging scheduling.
Wevj 15 00398 g001
Figure 2. Charging and discharging optimal scheduling strategy diagram of the electric vehicle.
Wevj 15 00398 g002
Figure 3. Encoding of particles.
Wevj 15 00398 g003
Figure 4. Wind power scenario generation.
Wevj 15 00398 g004
Figure 5. Photovoltaic scene generation.
Wevj 15 00398 g005
Figure 6. Wind power scenario reduction.
Wevj 15 00398 g006
Figure 7. Photovoltaic scene reduction.
Wevj 15 00398 g007
Figure 8. Initial load data.
Wevj 15 00398 g008
Figure 9. Time-of-use electricity price.
Wevj 15 00398 g009
Figure 10. Variation trend in factor level of IBBMOPSO algorithm.
Wevj 15 00398 g010
Figure 11. Pareto front of each algorithm under Scenario 2.
Wevj 15 00398 g011
Figure 12. The load mean square error convergence curve of each algorithm under Scenario 2.
Wevj 15 00398 g012
Figure 13. The charging cost convergence curve of each algorithm in Scenario 2.
Wevj 15 00398 g013
Figure 14. Charging and discharging power of IBBMOPSO under Scenario 2.
Wevj 15 00398 g014
Figure 15. The load curve of IBBMOPSO before and after participating in scheduling under Scenario 2.
Wevj 15 00398 g015
Figure 16. Comparison of load mean square errors for different algorithms.
Wevj 15 00398 g016
Figure 17. Comparison of charging costs for different algorithms.
Wevj 15 00398 g017
Table 1. The comparison of studies in the literature.
ResearchersDirection of Power FlowObjective FunctionEVs Data SourcesSolution MethodParameter
Optimization
ParetoEvaluating IndicatorDecision-Making Method
One-WayBoth-WayEconomic GoalLoad GoalOthers
Chai et al. [7] (2023) Historical dataCPLEX
Ren et al. [11] (2023) Monte CarloSimplex algorithm
LV et al.
[12] (2022)
Monte CarloIGWA
Saner et al. [13] (2022) CPLEX
Zhang et al. [8] (2022) ICSA
Zhao et al. [18] (2022) Monte CarloGA
Xu et al.
[21] (2022)
CPLEX
Hou et al. [20] (2022) Monte CarloGA
Yin et al.
[16] (2023)
Historical dataCPLEX
Zaneti et al. [22] (2022) Historical dataCPLEX
This paper Monte CarloIBBMOPSOOrthogonal
test
IGD, HV, MSTOPSIS
Table 2. Electric vehicle-related parameters.
ParameterNumerical Value
Quantity of EV500
Rated charging power12 kW
Rated discharge power12 kW
EV battery capacity60 kWh
Expected SOC of the user0.8
Maximum discharge depth0.5
Power consumption per kilometer0.15
Battery charge efficiency90%
Battery discharge efficiency90%
Table 3. Algorithm parameter level.
ParameterLevel
123
N255075
P304050
T200300400
K51015
Table 4. Orthogonal test results.
Experiment NumberFactorOD
NPTK
111110.5371
212220.6215
313330.5231
421230.6776
522310.7316
623120.6829
731320.7917
832130.5813
933210.7218
Table 5. Decision results for each algorithm.
AlgorithmsCharging Cost/CNYLoad Mean Square
Error/kW2
Simulation Time/s
IBBMOPSO11,032.412.84 × 10519.71
MOPSO29,125.519.18 × 10528.68
MODE16,053.015.86 × 10533.49
NSGA-Ⅱ16,183.315.51 × 10527.93
Table 6. The solution results of the IBBMOPSO algorithm in five scenarios.
ScenarioCharging Cost/CNYLoad Mean Square Error/kW2
111,121.412.42 × 105
211,032.412.84 × 105
311,925.812.71 × 105
411,283.312.65 × 105
511,516.912.81 × 105
Table 7. Evaluation results.
AlgorithmIGDHVMS
IBBMOPSO2.871 × 10−30.417 × 10−20.9316
NAGA-Ⅱ3.719 × 10−30.325 × 10−20.8962
MOPSO3.921 × 10−30.359 × 10−20.8286
MODE3.164 × 10−30.394 × 10−20.8767
Table 8. RPI value.
Table 8. RPI value.
NumberLoad Mean Square ErrorCharging Cost
IBBMOPSOMODEMOPSONSGA-ⅡIBBMOPSOMODEMOPSONSGA-Ⅱ
10.7271.2150.9181.3280.1250.8271.9611.743
21.0212.0861.7681.6571.1721.3721.8210.781
31.1250.8291.5621.8530.5211.5382.3190.579
40.9171.6561.8471.9430.9651.6322.1911.636
50.1351.8672.3120.7811.2780.9762.0121.673
60.8131.9291.9651.1280.8211.2572.5711.728
70.1371.7121.7311.7430.9171.5511.5690.217
80.2150.9211.7272.0121.2160.5271.1270.721
90.4261.6712.0121.6671.7480.6131.7651.137
100.0001.4122.1251.4390.0000.2151.2460.621
Disclaimer/Publisher’s Note: The statements, opinions and data contained in all publications are solely those of the individual author(s) and contributor(s) and not of MDPI and/or the editor(s). MDPI and/or the editor(s) disclaim responsibility for any injury to people or property resulting from any ideas, methods, instructions or products referred to in the content.

