Review

Net-Zero Greenhouse Gas Emission Electrified Aircraft Propulsion for Large Commercial Transport

by
Hao Huang
* and
Kaushik Rajashekara
Department of Electrical and Computer Engineering, University of Houston, Houston, TX 77204, USA
*
Author to whom correspondence should be addressed.
World Electr. Veh. J. 2024, 15(9), 411; https://doi.org/10.3390/wevj15090411 (registering DOI)
Submission received: 30 July 2024 / Revised: 26 August 2024 / Accepted: 3 September 2024 / Published: 8 September 2024
(This article belongs to the Special Issue Electric and Hybrid Electric Aircraft Propulsion Systems)

Abstract

:
Until recently, electrified aircraft propulsion (EAP) technology development has been driven by the dual objectives of reducing greenhouse gas (GHG) emissions and addressing the depletion of fossil fuels. However, the increasing severity of climate change, posing a significant threat to all life forms, has resulted in the global consensus of achieving net-zero GHG emissions by 2050. This major shift has alerted the aviation electrification industry to consider the following: What is the clear path forward for EAP technology development to support the net-zero GHG goals for large commercial transport aviation? The purpose of this paper is to answer this question. After identifying four types of GHG emissions that should be used as metrics to measure the effectiveness of each technology for GHG reduction, the paper presents three significant categories of GHG reduction efforts regarding the engine, evaluates the potential of EAP technologies within each category as well as combinations of technologies among the different categories using the identified metrics, and thus determines the path forward to support the net-zero GHG objective. Specifically, the paper underscores the need for the aviation electrification industry to adapt, adjust, and integrate its EAP technology development into the emerging new engine classes. These innovations and collaborations are crucial to accelerate net-zero GHG efforts effectively.

1. Introduction

Until recently, electrified aircraft propulsion technology development was driven by the dual objectives of reducing greenhouse gas (GHG) emissions and addressing the depletion of fossil fuels. However, the increasing severity of climate change, posing a significant threat to all life forms, including humans, has resulted in a global consensus to achieve net-zero GHG emissions by 2050, referred to as the 2050 net-zero GHG objective [1]. This major shift has alerted the aviation electrification industry to consider the following: What is the clear path forward for EAP technology development to support the net-zero GHG objective for large commercial transport aviation?
Before answering the above question, it should be realized that the 2050 net-zero GHG objective, which aims to balance emitted and removed GHGs by that year, is far more than just a “snapshot” objective. It is fundamentally motivated by the crucial goal of limiting global warming to no more than 1.5 °C above pre-industrial levels. Achieving this target necessitates substantial reductions in cumulative GHG emissions in the coming decades leading up to 2050 [1].
Aviation contributes approximately 3% of the global CO2 emissions. However, when considering all its climate impacts, including CO2, NOx, contrails, and other non-CO2 pollutants, aviation accounts for about 3.5% of the warming impact caused by human activities. Figure 1 shows the U.S. aviation GHG emissions for 2019 [2]. The figure indicates that 86% of these emissions in the U.S. are generated by large commercial transport, which comprises narrow-body aircraft (e.g., Boeing 737, Airbus A320, Embraer E-Jets, and Bombardier CRJ series), wide-body aircraft (e.g., Boeing 777, Boeing 787 Dreamliner, Airbus A350, and Airbus A330), and large regional airplanes (e.g., ATR 42/72, Bombardier Dash 8, Mitsubishi SpaceJet, and so on). For these large commercial transport aircraft, adopting all-electric propulsion powered by batteries and/or fuel cells is in a distant future beyond 2050. This is due to the considerable energy density disparity between traditional fuel/engine systems and battery or fuel cell systems.
To answer the question raised in the first paragraph of this section, this paper investigates the primary source of GHG emissions in large commercial transport—the turbofan engine. It starts with identifying four types of GHG emissions to be used as metrics for assessing the effectiveness of various technologies in reducing these emissions. Then, it presents three major categories of GHG reduction efforts revolving around the engine; evaluates the necessity and potential of EAP technologies within each category, as well as combinations of technologies among the different categories, using the identified metrics; and thus determines the clear path forward to support the net-zero GHG objective. In particular, the paper emphasizes the need for the aviation electrification industry to adapt, adjust, and integrate its EAP technology development to the emerging new engine classes to ultimately achieve true net-zero GHG EAP technology for large commercial transport.
The paper is organized as follows. Section 3 reviews the GHG reduction capabilities of conventionally known electrified aircraft propulsion, which provide modest GHG emission reduction but fall far short of achieving net-zero GHGs. Section 4 explores green fuel combustion using sustainable aviation fuel and green hydrogen, offering significant GHG cuts but still falling short of achieving net-zero GHG emissions. Finally, Section 5 discusses the emerging net-zero propulsion technologies, such as supercritical CO2-based closed-Brayton-cycle engines and closed-Strayton-cycle engines, and provides a digest of the operating principles of these engines from an electrical engineering standpoint based on the limited explanations in the available literature. Furthermore, this section determines that the new class of engines cannot achieve net-zero GHGs without the success of green fuel combustion and the intervention of electrified aircraft propulsion. The combination of the three technologies forms true net-zero GHG EAP for future generations of large commercial transport aircraft. However, the technology needs further development. These innovations and collaborations are crucial to accelerating net-zero GHG efforts effectively.
Overall, this technological review paper analyzes the aviation electrification industry’s status and the potential of different developments, identifies the necessary recalibrations, and forges the path forward to support the net-zero GHG objective.

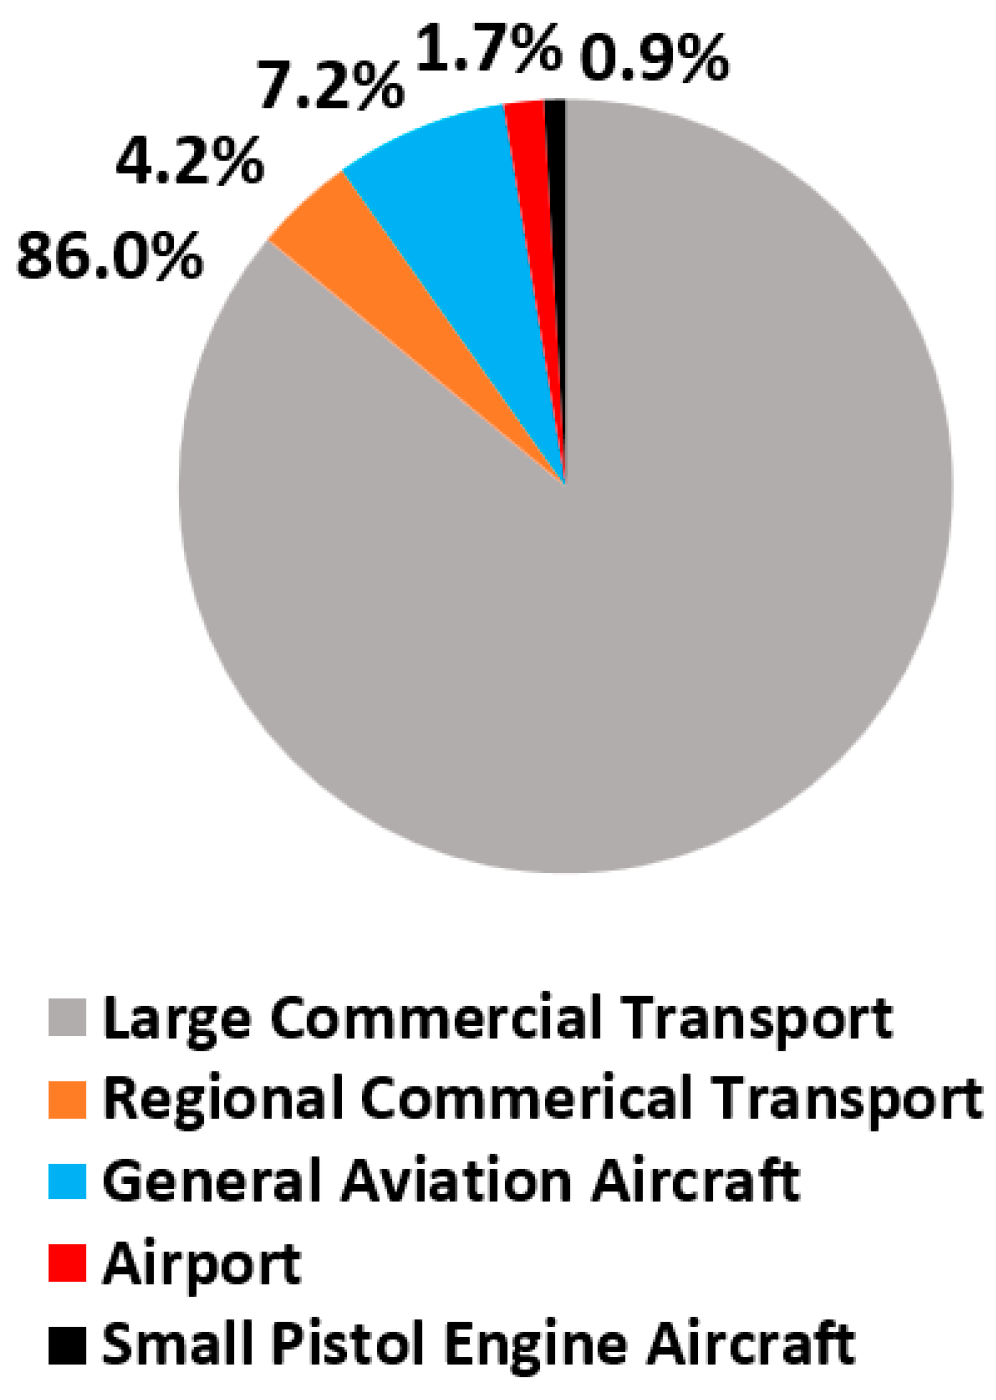
2. Types of Emissions from Large Commercial Transport

To reassess the current EAP technologies being developed for large commercial transport and their alignment with the net-zero GHG objective, it is necessary to thoroughly examine the GHG emissions produced by the primary source: turbofan engines (open Brayton cycle). Figure 2 presents a schematic diagram of such a turbofan and its GHG emissions. The large fan at the front of the engine pulls in air, with most of this air bypassing the engine’s core and producing approximately 90% of the thrust. Compressors, including high-pressure and low-pressure compressors, increase the pressure of the incoming air before it enters the combustion chamber. Each compressor consists of several stages of rotating blades and stationary vanes. Fuel is mixed with the high-pressure air in the combustion chamber and ignited. This combustion process generates high-temperature, high-pressure gases. The high-pressure gases pass through the turbines, including both high-pressure and low-pressure turbines, causing them to spin. The low-pressure turbine is connected to the low-pressure spool shaft that drives the large fan to generate the main thrust. As shown in the figure, the exhaust comprises the remaining high-speed gases that exit the engine through the exhaust nozzle, providing additional thrust (~10%). The figure shows that exhaust includes four types of GHG emissions [3].
The first emission is CO2, which causes the warming of the Earth’s surface and atmosphere.
The second emission is NOx. It is produced when combustion temperatures exceed 1300 °C, and the fuel temperature in the combustor of turbofan engines is generally between 1800 and 2000 °C. NOx are not greenhouse gases themselves, but they are converted into ozone (O3), a potent GHG in the atmosphere.
The third emission is contrails. When the aircraft flies at an altitude of 29,000 to 36,000 ft, the water vapor emitted by the engine condenses into ice crystals under conditions of ≤−40 °C, forming cloud-like contrails. Contrails are not GHGs but form thin cloud layers, altering the Earth’s radiation balance and creating a greenhouse effect. In contrast, ground traffic emissions do not have this issue.
The fourth emission comprises other non-CO2 compounds, including water vapor, sulfate aerosols, soot (black carbon), and additional pollutants. Although this emission may be relatively small, it significantly impacts the climate system through various direct and indirect mechanisms. Therefore, it should not be ignored.
The impact on the GHG effect in the atmosphere can be roughly ordered as follows: contrails ~38%, CO2 ~37%, NOx ~17.5%, and other non-CO2 compounds ~7.5% [3,4]. These percentage numbers represent the portions of the total radiative forcing attributable to carbon dioxide emissions from the engine operation. Radiative forcing is a concept used in climate science to quantify the influence that a particular factor (such as greenhouse gases, aerosols, or changes in solar radiation) has on the Earth’s energy balance. Obviously, all four emissions must be considered while achieving net-zero GHG emissions from large commercial transport into the atmosphere.
Figure 3 outlines three major GHG reduction effort categories regarding the turbofan (open-Brayton-cycle engine) for large commercial transport. GHG reduction effort category 1 includes all the ongoing EAP development efforts to date except all-electric propulsion. This exclusion is because all-electric aircraft powered by batteries or fuel cell technologies for large commercial transport remains in the distant future. Section 3 examines the technologies in category 1 and discusses the associated issues. GHG reduction effort category 2 focuses on the combustor and its fuel. This effort is solely performed by the engine sector today. This area may require the aviation electrification industry’s attention, as the engine sector needs support from electrification, representing an opportunity for electrical engineering involvement. That said, it is important to realize that the effort is still insufficient to achieve the net-zero GHG objective due to the nature of the approach. Details of this effort are covered in Section 4. GHG reduction effort category 3 is an emerging research and development area for achieving the net-zero GHG objective. Its operating principles, viewed from an electrical engineering perspective, and the necessity of EAP technology intervention to develop true net-zero GHG electrified aircraft propulsion are discussed in Section 5.
The four types of GHG emissions generated by the turbofan, previously discussed, will serve as key metrics to evaluate the effectiveness of each effort category presented in Figure 3. These details will be discussed in the following sections. Achieving the net-zero GHG objective necessitates a broad, collaborative approach emphasizing the importance of joint efforts and comprehensive solutions. This strategy will enhance the effectiveness, efficiency, and economic viability of the efforts, leading to fully achieving the global net-zero GHG ambition for large commercial transport.

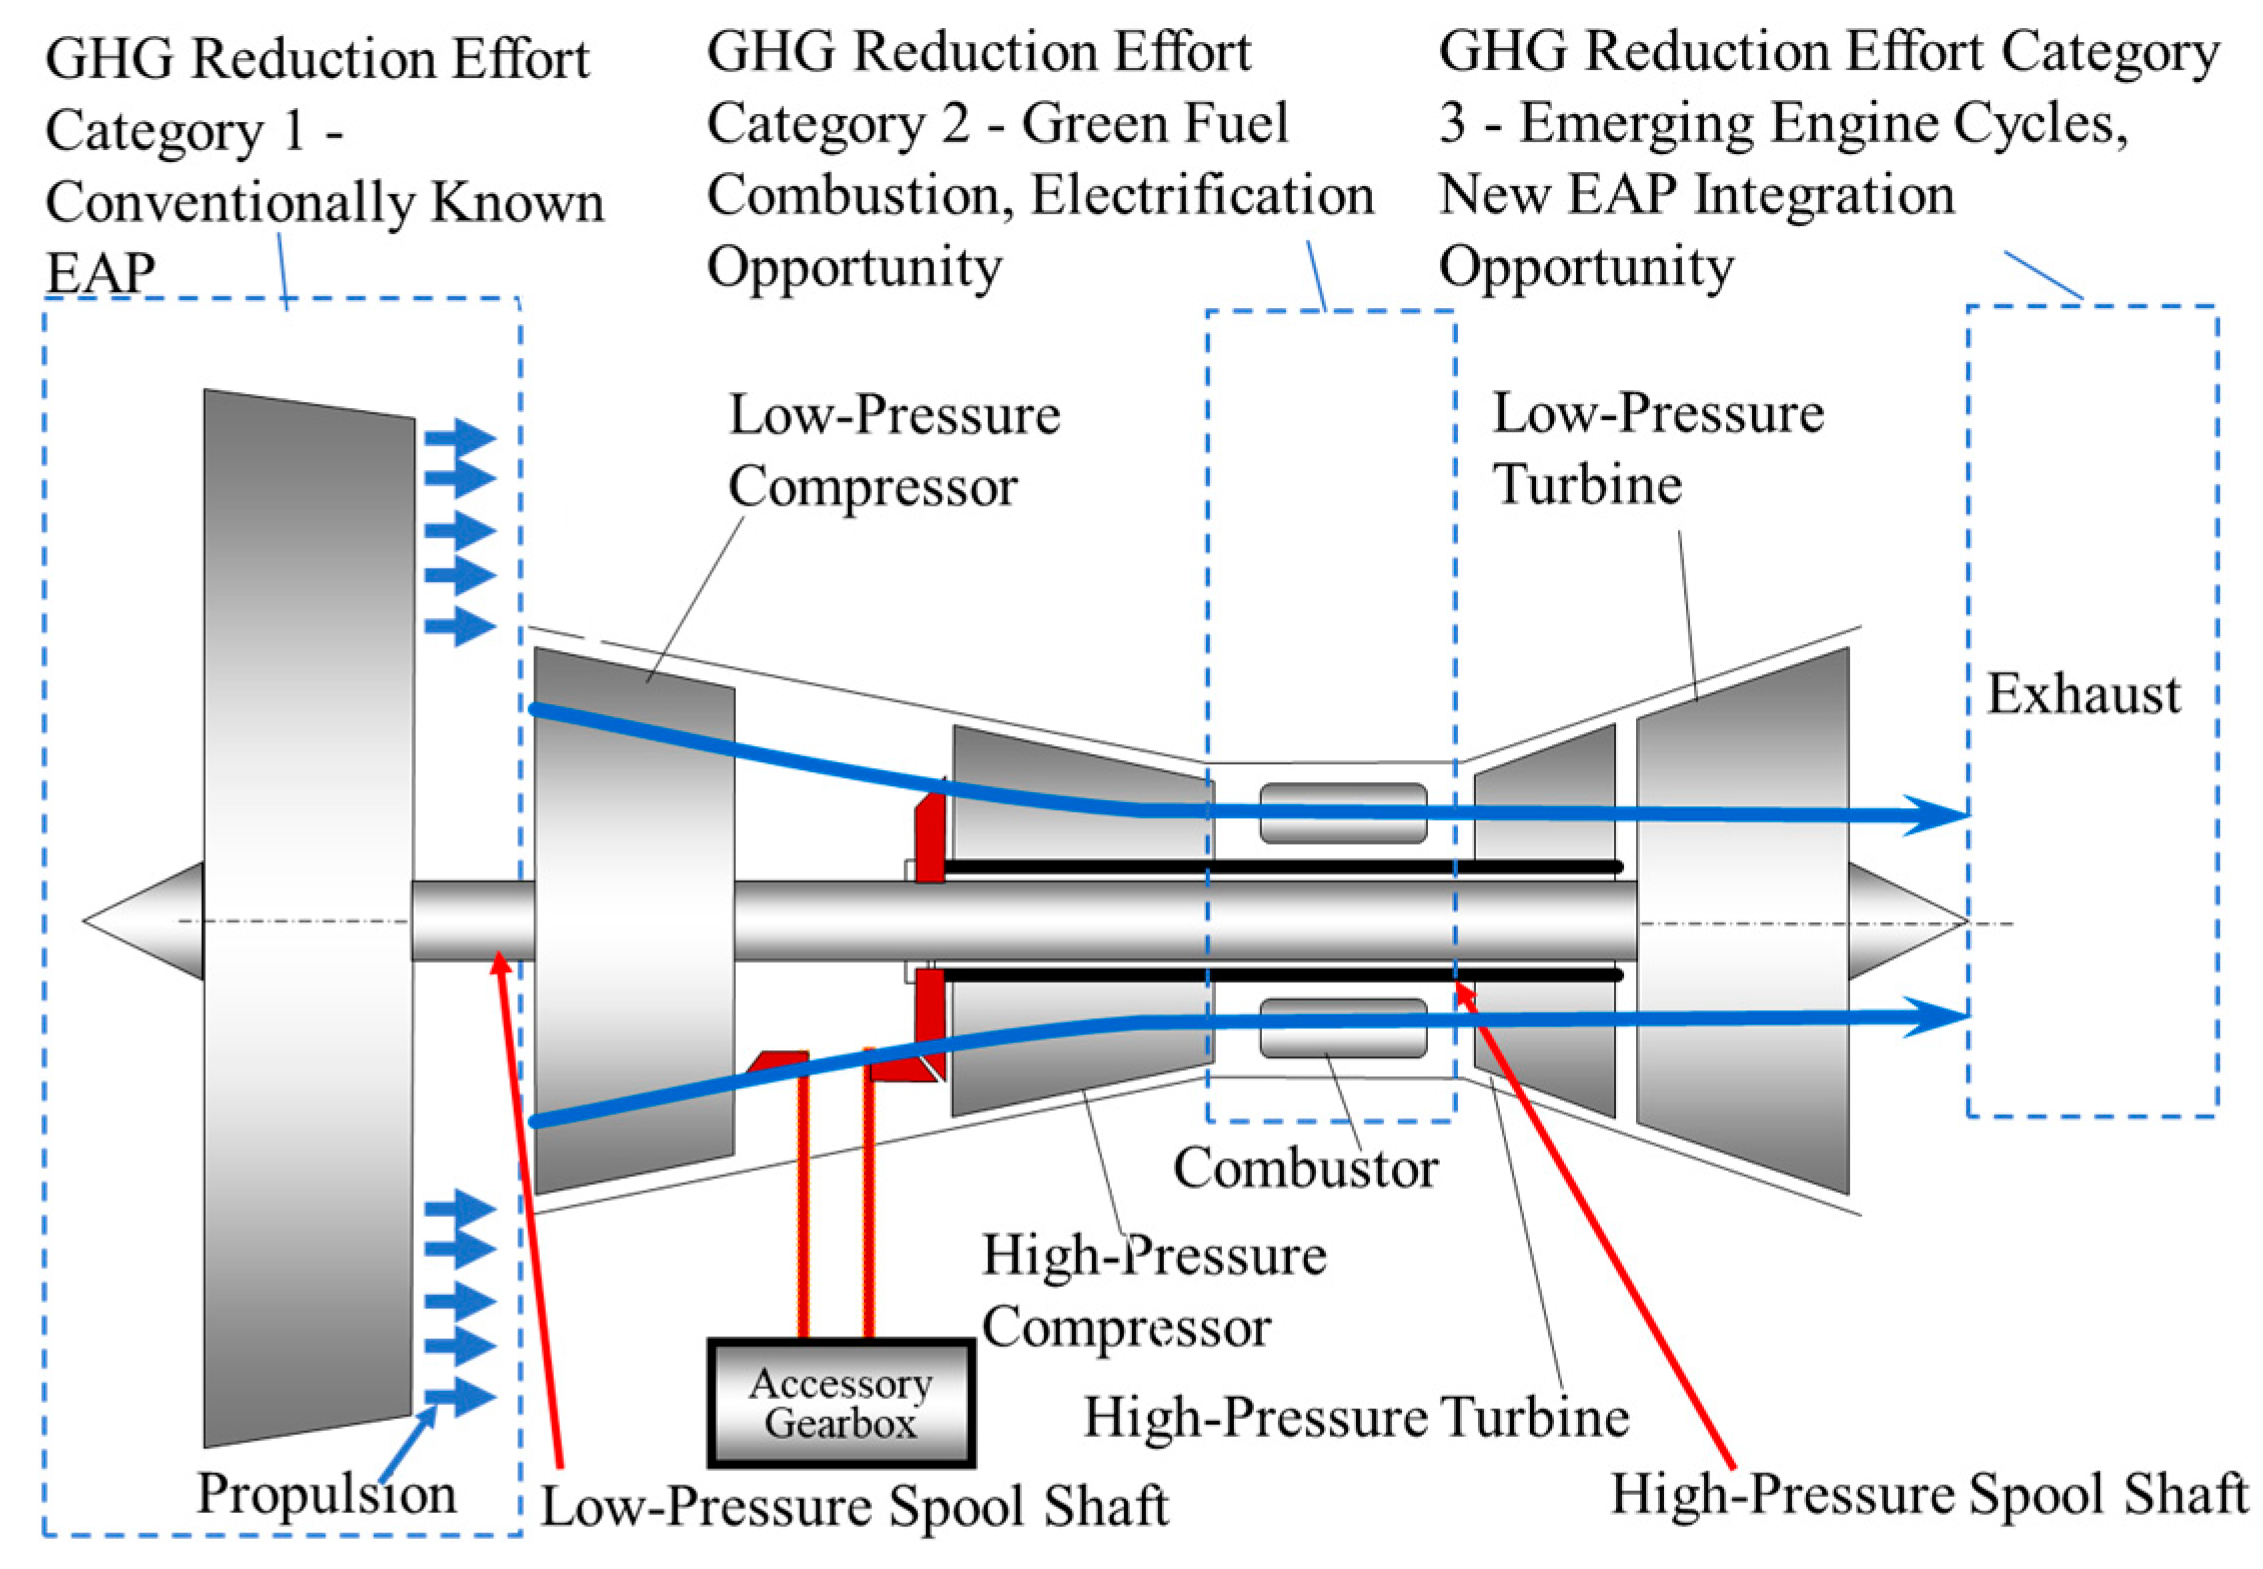
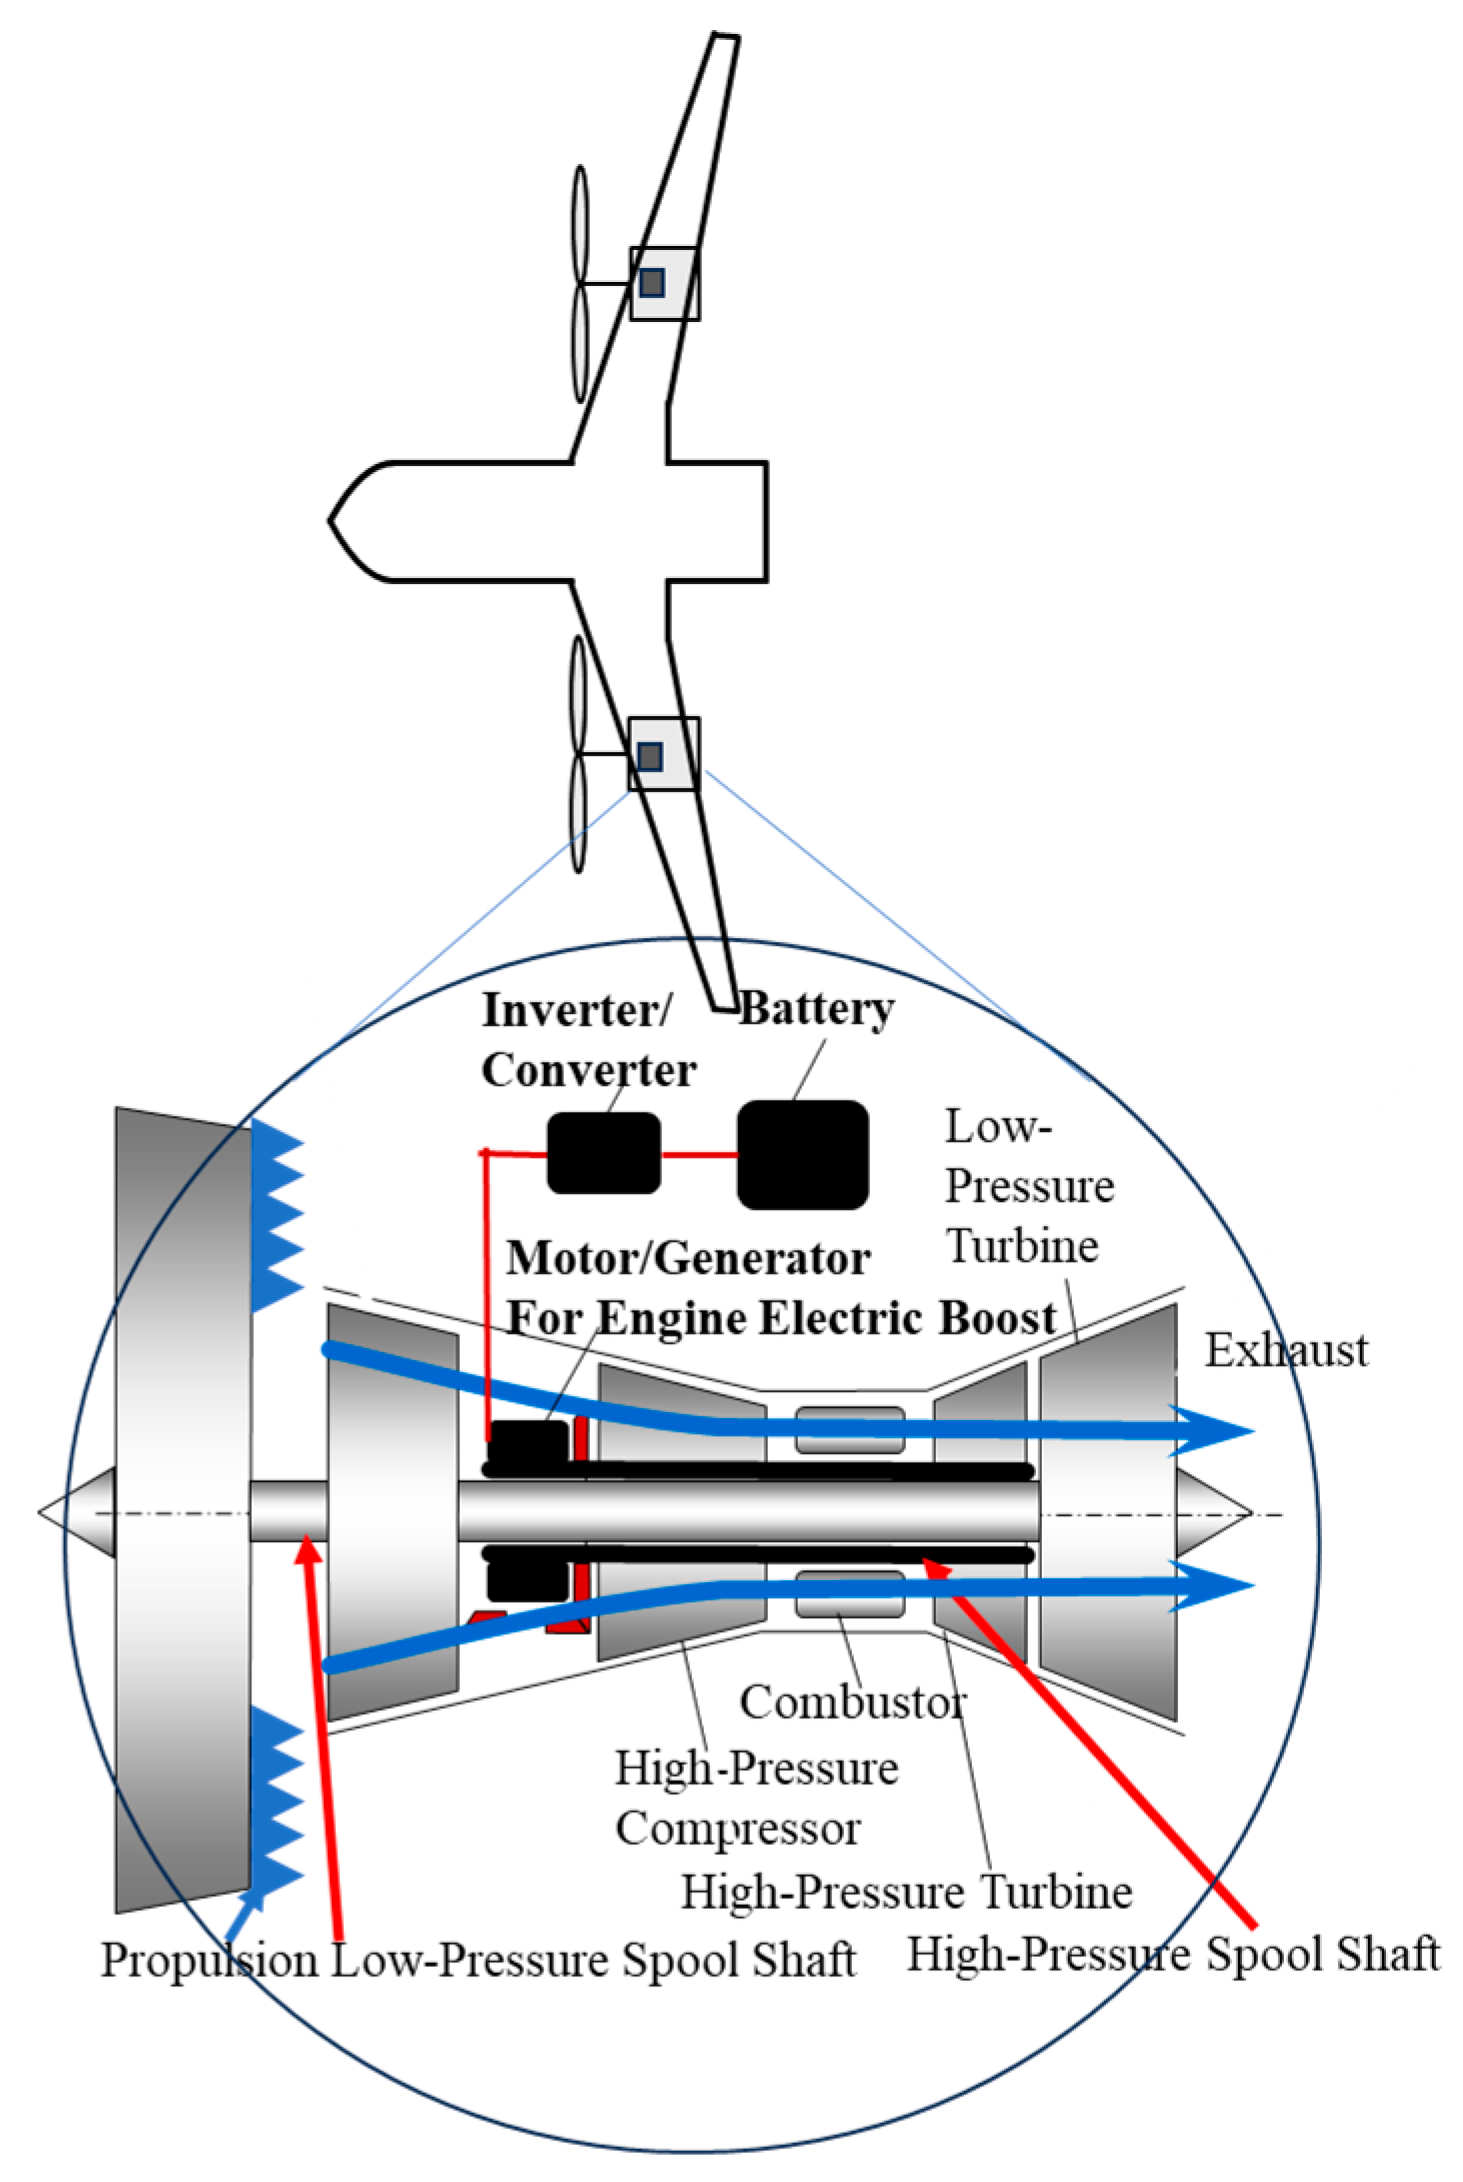
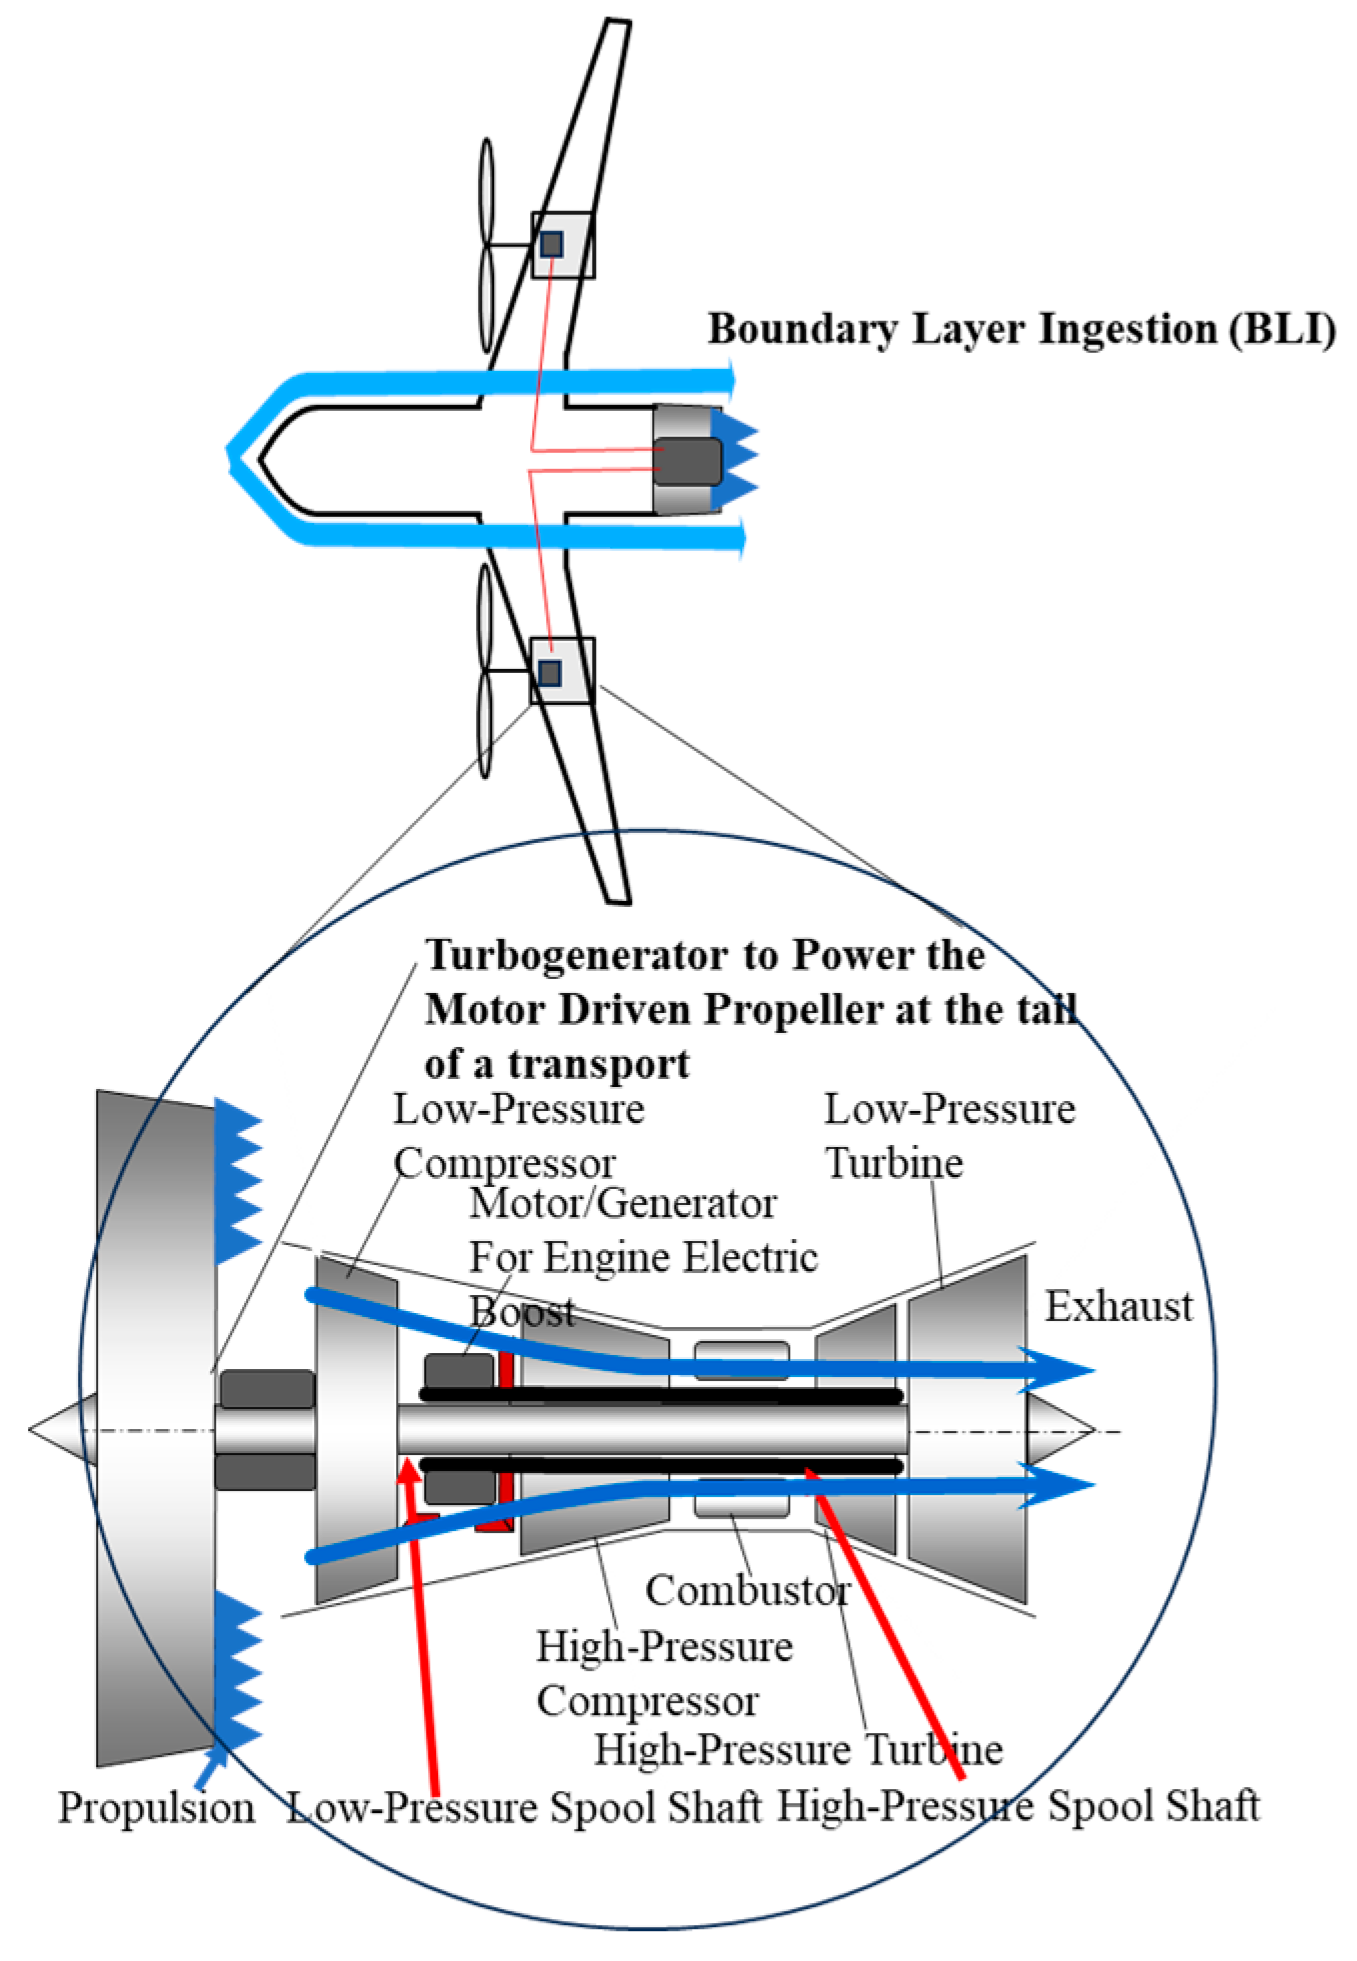
3. GHG Reduction Effort Category 1—Conventionally Known EAP

The GHG reduction effort category 1 for large commercial transport is represented in the first dotted-line box from the left in Figure 3. This category focuses on the aviation industry’s ongoing advancements in hybrid electric propulsion, commonly called electrified aircraft propulsion (EAP). To distinguish it from new electrification or EAP initiatives (to be discussed in Section 4 and Section 5, particularly Section 5), we designate it as conventionally known EAP (CK-EAP). While CK-EAP remains an important technological advancement for the future of aviation, its GHG reduction effectiveness is limited.

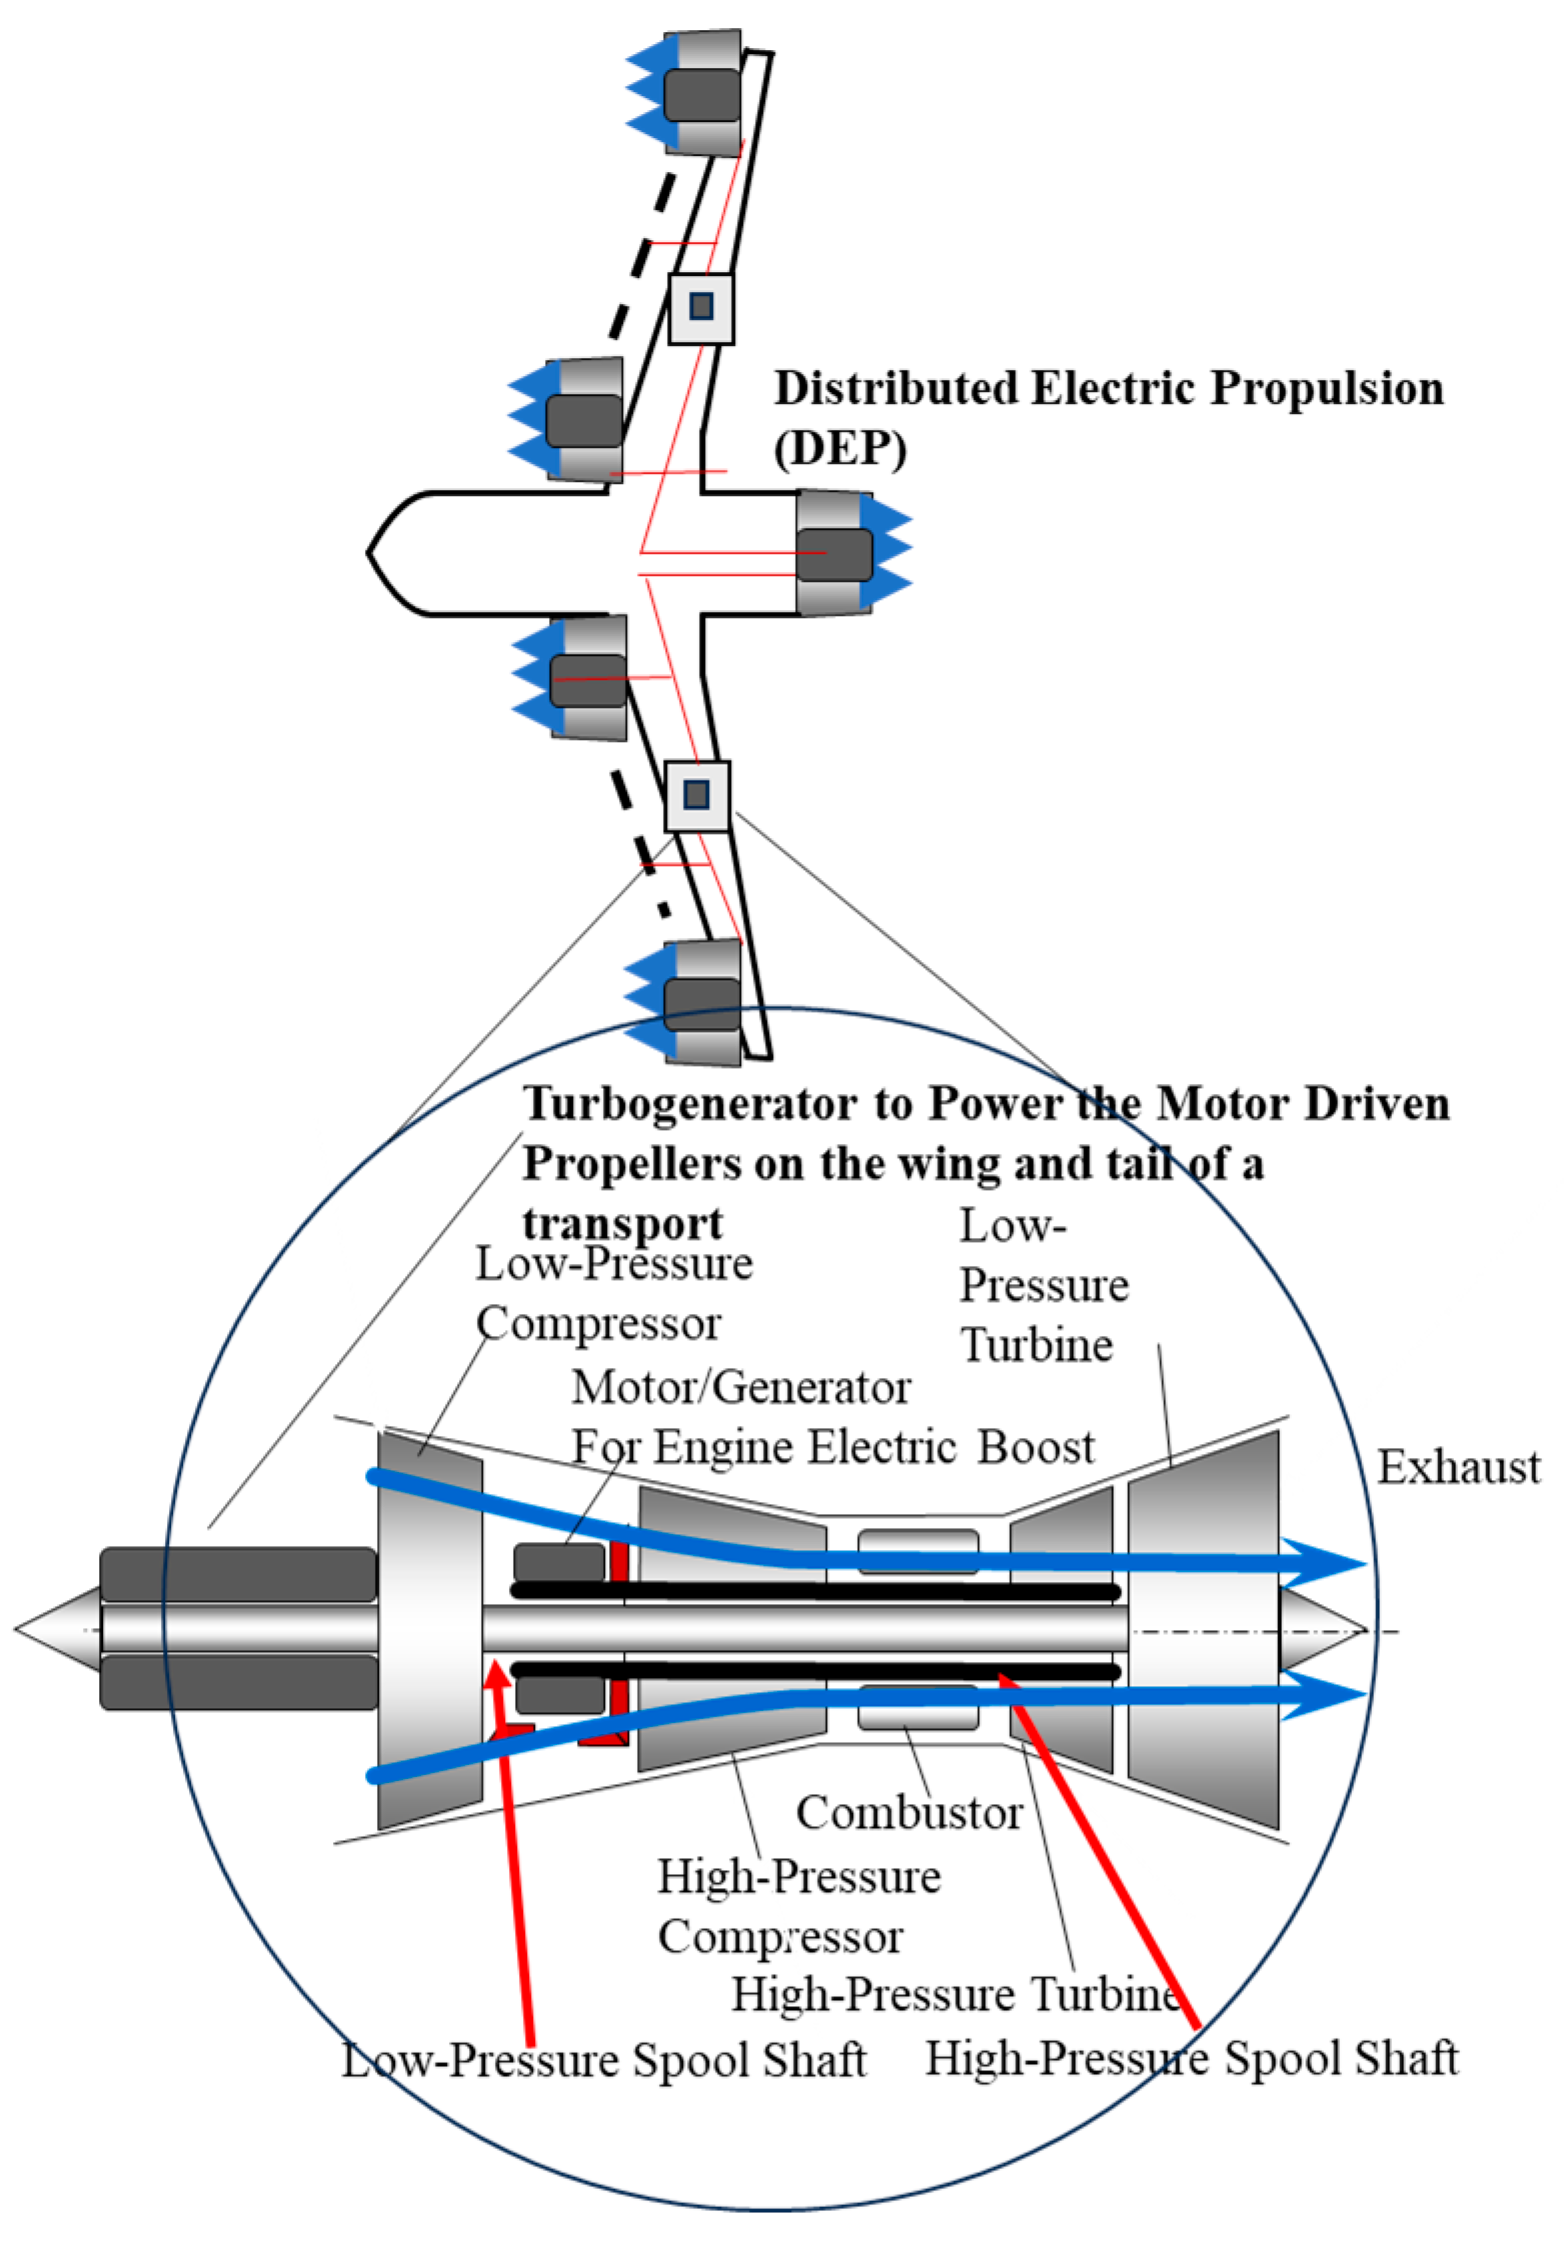
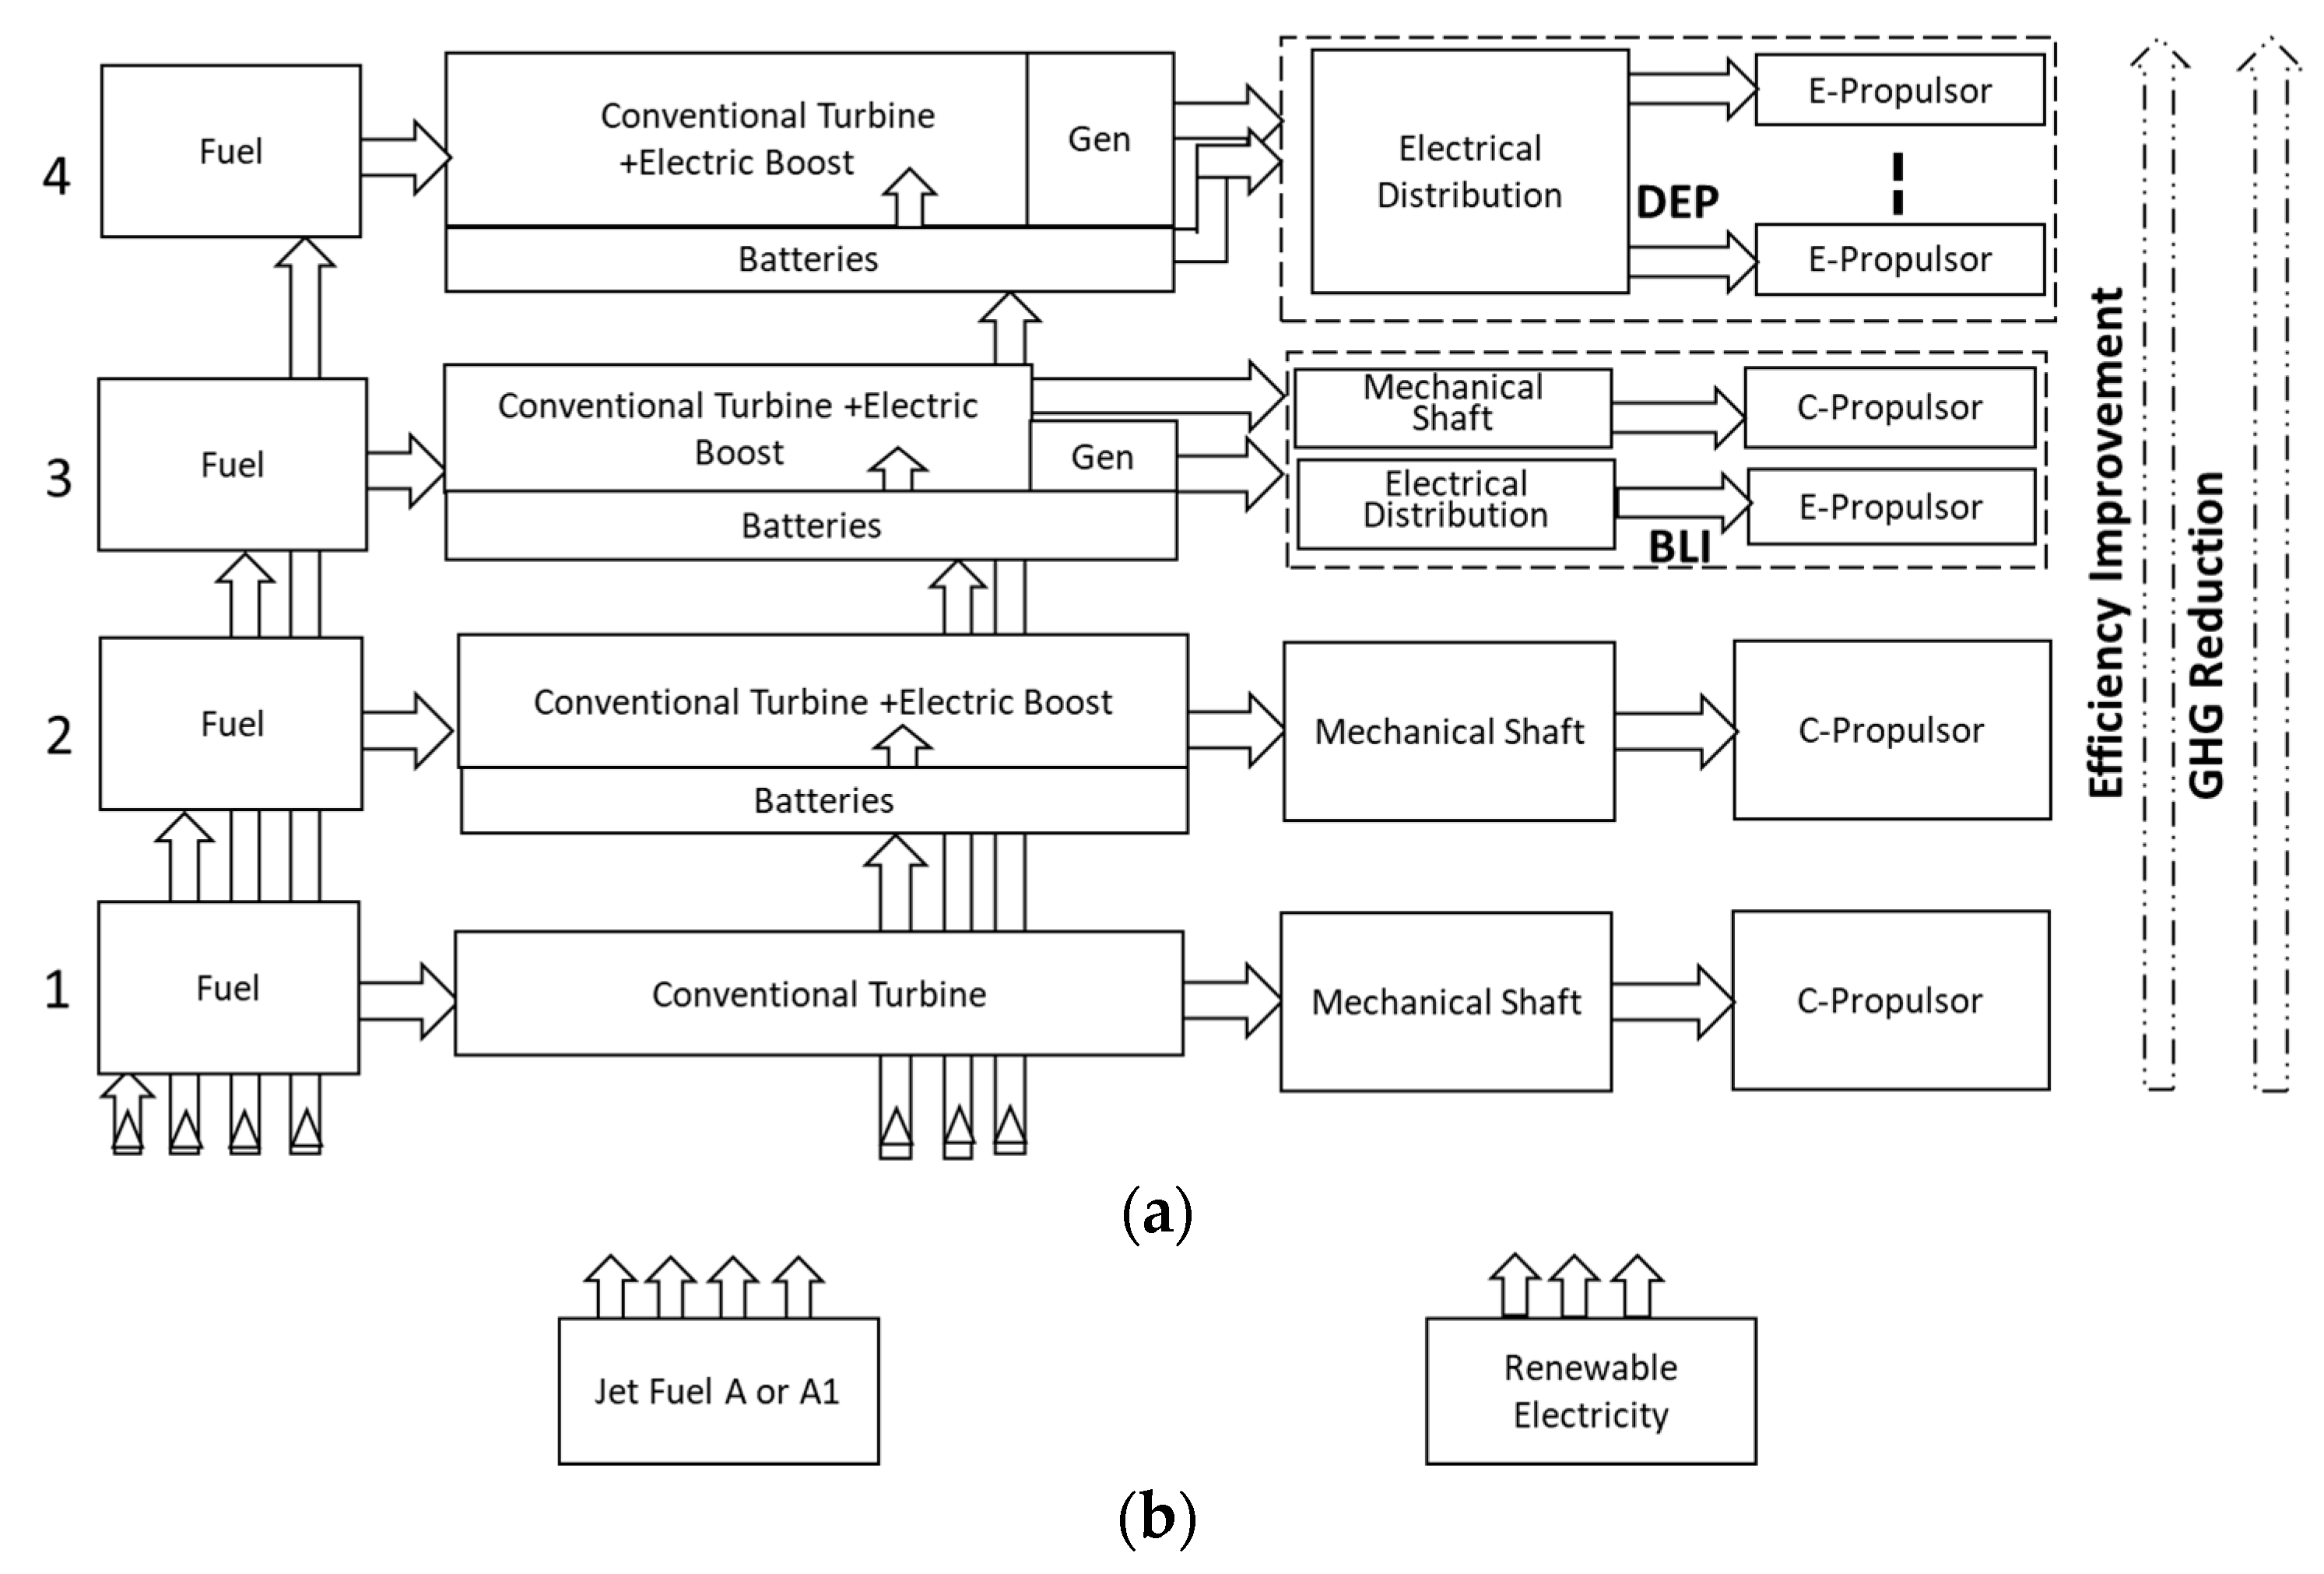
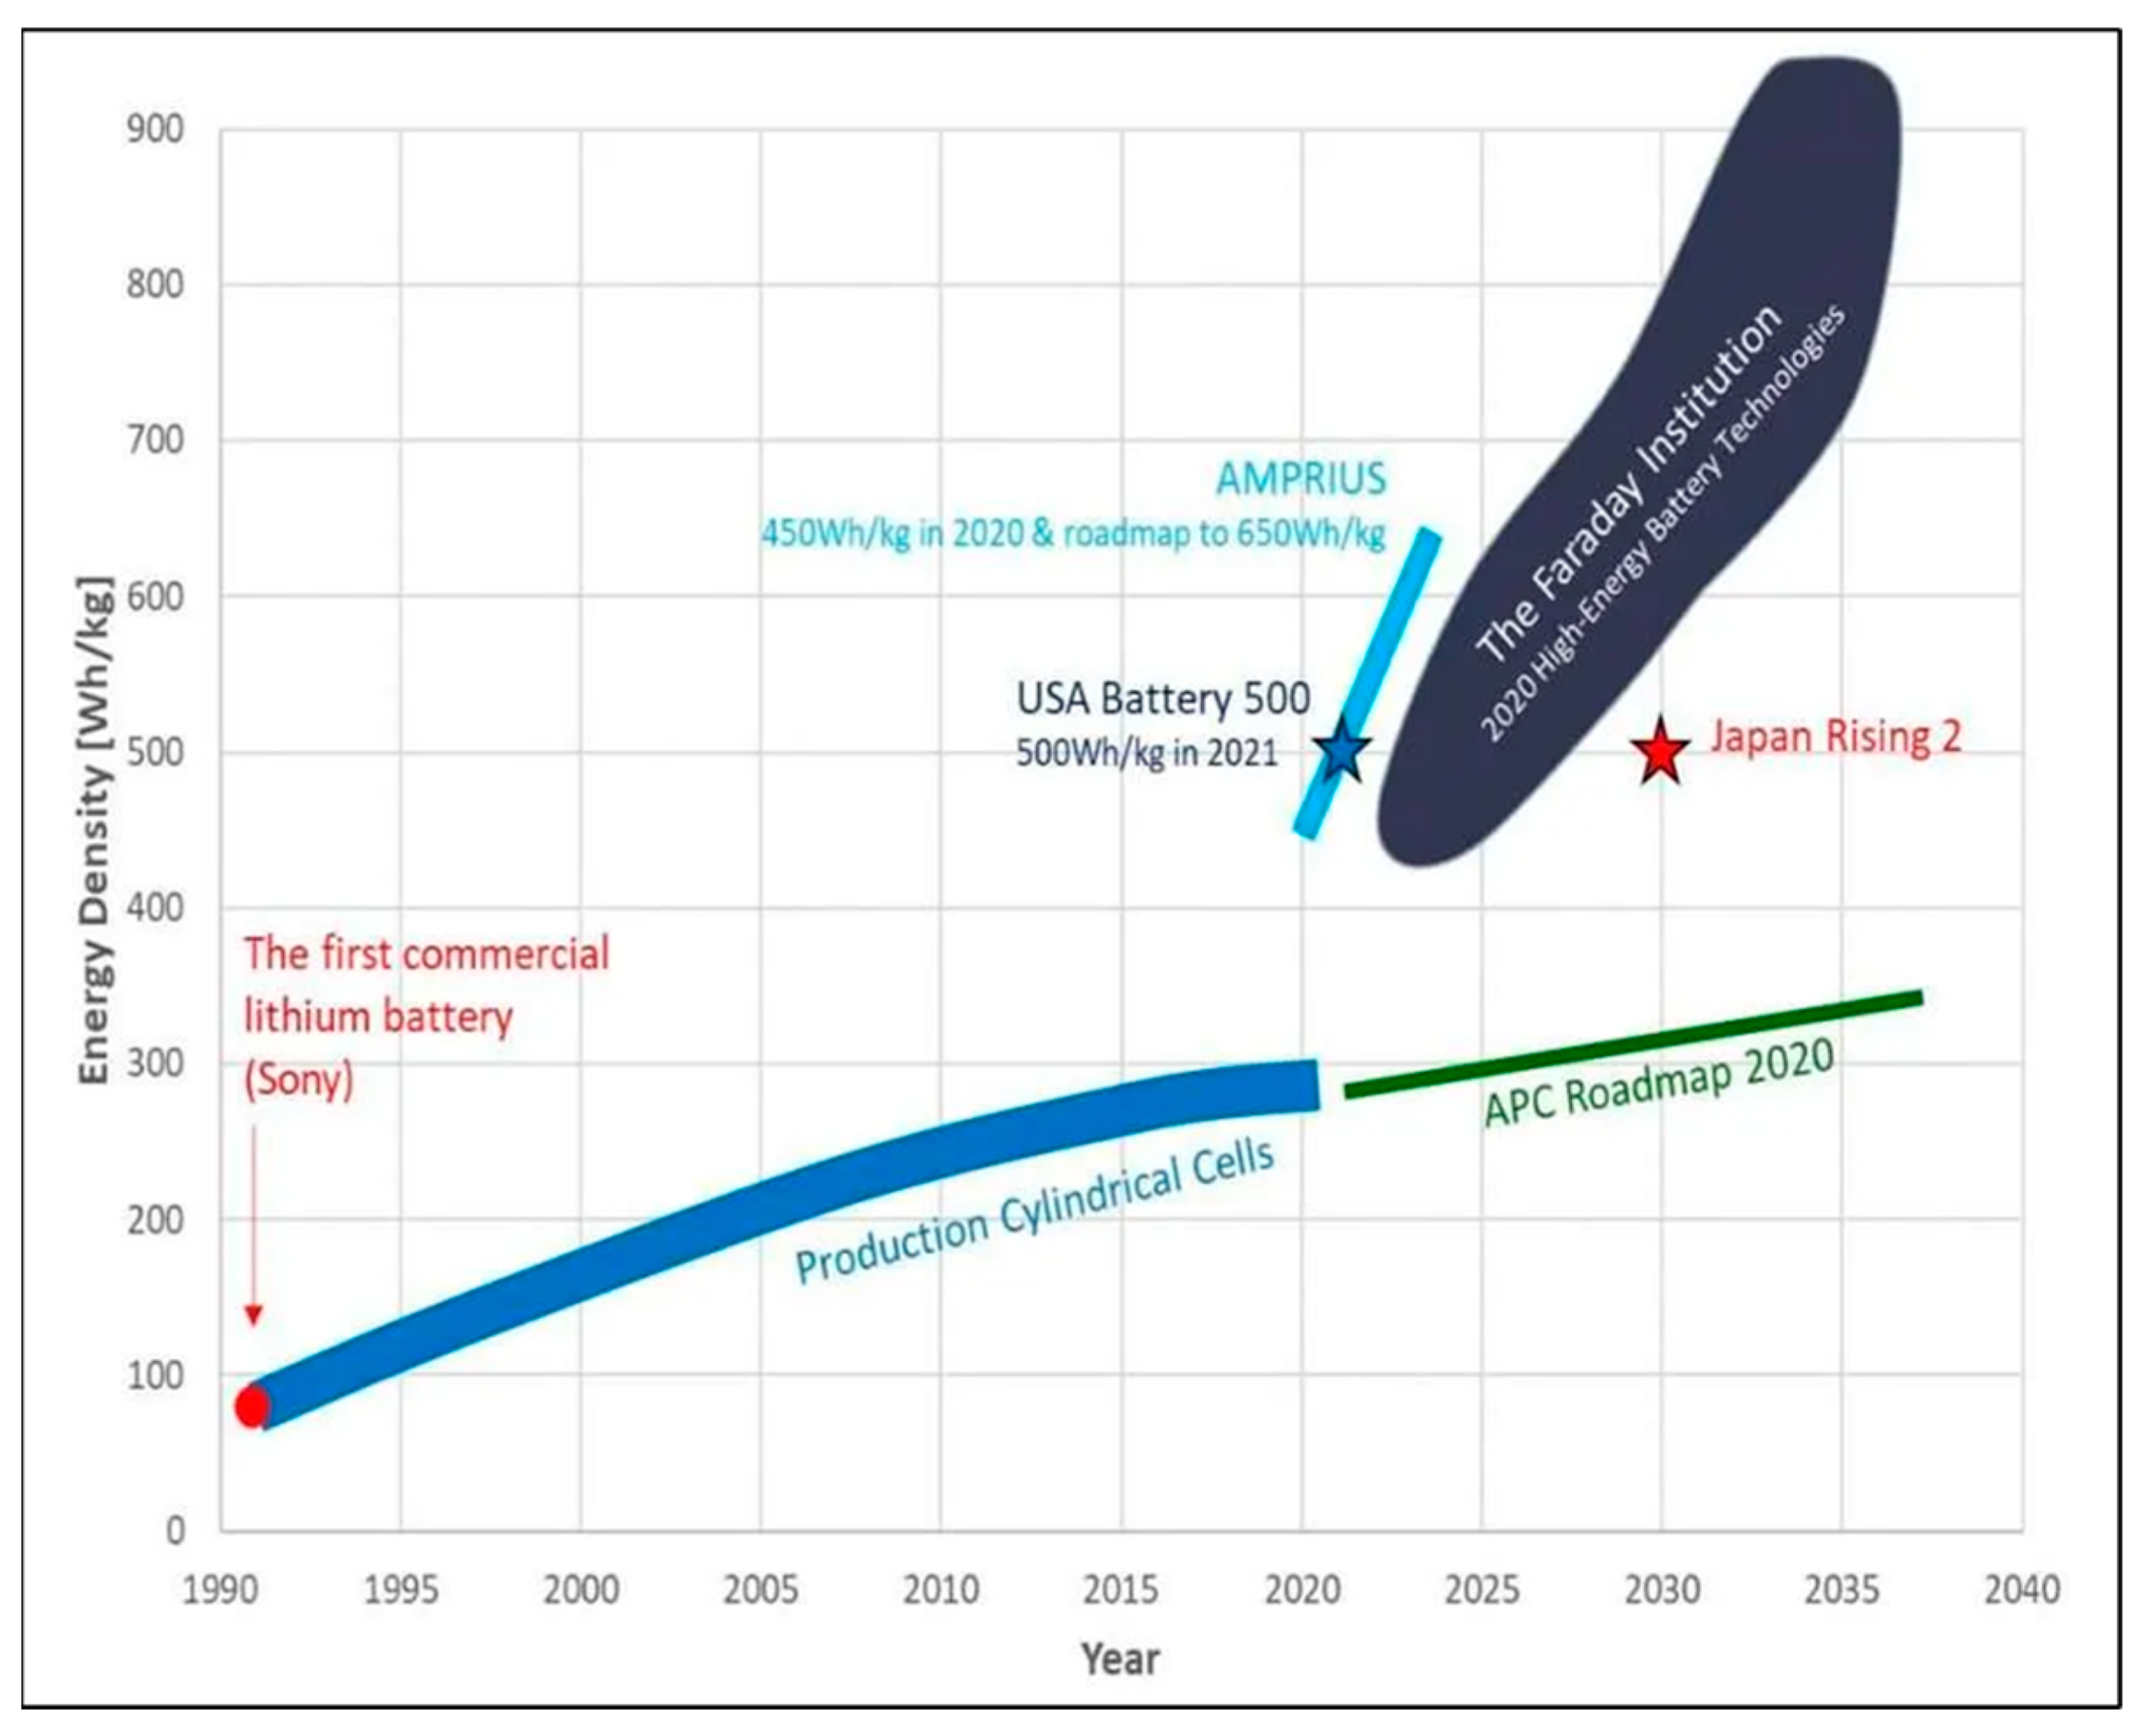
3.1. Technologies in CK-EAP for Large Commercial Transport

This category excludes all-electric propulsion for the reason discussed previously. It includes three technologies: engine electric boost propulsion, partial turbo-electric propulsion for boundary layer ingestion (BLI), and full turbo-electric distributed hybrid propulsion [5]. These three technologies progressively enhance the decoupling between the propulsor (fan) and the engine, enabling progressively reduced GHG emissions by improving the efficiency of the engine and propulsor.
Figure 4 illustrates the engine electric boost. As the figure indicates, this architecture involves adding an electric motor/generator to the high-pressure spool shaft. A battery and a power converter/inverter power this electric machine. The battery could be charged through this power electronic unit in generation mode. During takeoff and climb, the motor can assist the engine in improving its stall margin. By providing additional power to the high-pressure spool (where the motor/generator is integrated), the motor helps to maintain a higher rotational speed of the compressor, reducing the risk of stalling or surging during these critical phases of flight. This not only enhances the engine’s performance but also improves overall safety and efficiency during takeoff and climb. During the cruising phase, the generator charges the battery. This operation is, in fact, a typical parallel hybrid operation. This electric boost improves the engine’s fuel efficiency and GHG emissions. The electric motor/generator and the gas turbine work together, but the fan’s propulsion is still primarily driven by the gas turbine.
Figure 5 presents the partial turbo-electric propulsion for BLI. In the partial turbo-electric architecture, a generator is mounted between the turbine and the fan on the low-pressure spool shaft. The gas turbine-driven generator generates electric power that drives the fan located aft of the aircraft. This configuration allows for innovative airframe designs, such as integrating the electric fan effect into the aircraft’s fuselage dynamics to ingest and re-energize the boundary layer air. The technology reduces drag, improves aerodynamic efficiency, and allows for greater flexibility in independently improving the engine and fan performance.
Figure 6 describes the full turbo-electric distributed hybrid propulsion, also called hybrid turbo-electric distributed propulsion (HTeDP). With such a fully turbo-electric system, the gas turbine is entirely dedicated to generating electricity, which powers electric motors driving the fans (propulsors). This complete decoupling allows for maximum flexibility in positioning the fans and optimizing their design for specific aerodynamic benefits (for example, minimizing the fan pressure ratio (FPR)). It also enables the distribution of multiple fans across the airframe for better thrust distribution and reduced drag. The HTeDP can significantly improve overall efficiency by allowing the engine and the fans to operate independently at their optimal points.

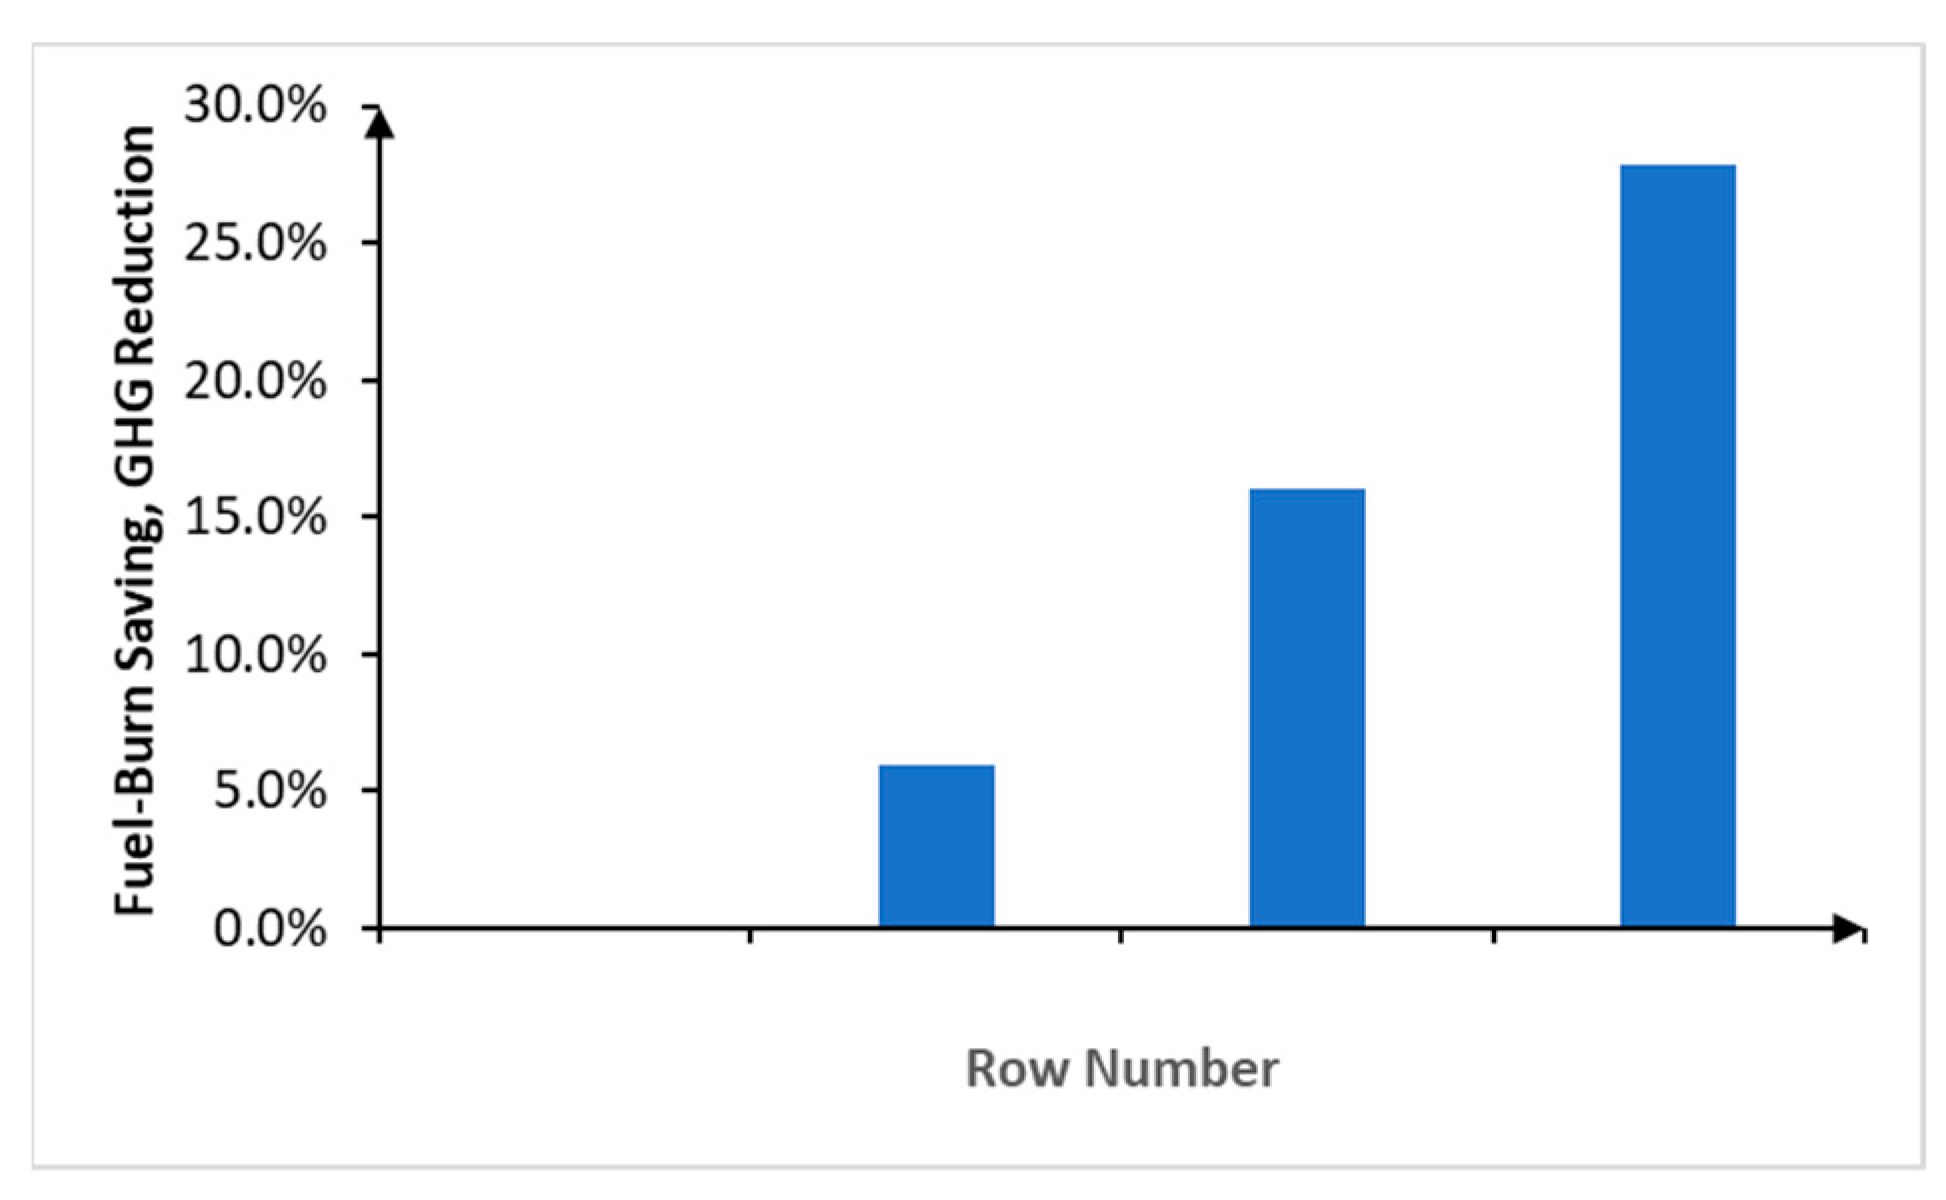
3.2. GHG Reduction Potential of CK-EAP for Large Commercial Transport

It is known that the reduction in contrails, CO2, NOx, and other non-CO2 emissions is generally proportional to fuel consumption improvement in terms of rough order of magnitude, which is sufficient to be used in determining the GHG reduction potential of CK-EAP. Therefore, it is necessary first to find the cumulative fuel-burn savings potential of CK-EAP. The word cumulative emphasizes that we must combine all three fuel-burn savings together to find the potential.
Figure 7 presents the CK-EAP technologies with conventional fuel in a way that progressively reduces the fuel burn from previous technology, starting from the baseline. The row numbers 1, 2, 3, and 4 on the far left of the diagram represent different propulsion architectures.
Row 1 in Figure 7a illustrates the operation of a conventional propulsion architecture. In this system, fuel, Jet A or Jet A1, is supplied to the turbine, generating the torque needed to spin the conventional propulsor (fan) located on the low-pressure spool shaft of the low-pressure turbine. Jet A and Jet A1 are kerosene-based aviation fuels for turbine engines in aerospace. GHGs are emitted into the atmosphere during turbine operation.
Row 2 in Figure 7a depicts the engine electric boost propulsion system shown in Figure 4. This propulsion system includes a set of batteries (the associated motor/generator is not shown) and offers a potential fuel-burn savings of approximately 6% compared to conventional propulsion [6]. GE Aerospace and SAFRAN have collaboratively prepared a demonstration using one of their CFM engines [7].
Row 3 in Figure 7a shows the partial turboelectric propulsion system with an electric boost shown in Figure 5. Through the electrical distribution system, the generator delivers power to the E-propulsor, typically located aft of the transport, to create the BLI effect. This results in approximately 10% savings in fuel consumption compared to conventional propulsion [8].
Row 4 in Figure 7a illustrates the full turbo-electric distributed hybrid propulsion system shown in Figure 6, eliminating the conventional propulsor (C-propulsor). This arrangement offers substantial fuel-burn savings of approximately 11.9% compared to conventional propulsion after the weight increase from the E-propulsors and electrical distribution system is considered [9].
Figure 7b shows conventional fuel for turbines and energy sources for energy storage. Plugging the seven arrows in Figure 7b into the seven triangle slots at the bottom of Figure 7a, one can obtain a complete technological picture of the CK-EAP technologies.
Ideally, row 5, which represents all-electric propulsion driven by batteries for large commercial transport, should be positioned above row 4 in Figure 7a. However, as Figure 8 [10] indicates, this propulsion technology is not expected to be viable until well after 2050. Battery energy density is projected to reach only 1500 Wh/kg by 2050, significantly lower than kerosene-based aviation fuel’s 12,000 Wh/kg energy density. This forecast is widely supported by experts in the battery technology field [11,12,13]. Although fuel cells offer higher energy density compared to batteries, proton exchange membrane (PEM) fuel cells operate at relatively low temperatures (120 °C to 180 °C), which limits their suitability for generating propulsion. The challenge lies in efficiently rejecting the substantial heat losses associated with PEM fuel cells, which become impractical, uneconomical, and heavy when applied to large commercial transport. For instance, a large commercial transport aircraft with 20 MW motors for propulsion would require a 33 MW PEM fuel cell, given a 60% efficiency. This fuel cell system would necessitate rejecting 13 MW of heat, posing a feasibility issue. In contrast, solid oxide fuel cells (SOFCs) operate at much higher temperatures (600 °C to 1000 °C), enabling useful propulsion generation. However, this approach is a hybrid approach, deviating from all-electric propulsion. Because of the above reasons, this paper excludes all-electric propulsion from the category 1 greenhouse gas (GHG) reduction strategies for large commercial transport.
Once the fuel-burn savings potential is determined, the potential for the reduction of contrails, CO2, NOx, and other non-CO2 emissions become obvious. Figure 9 presents the cumulative fuel-burn savings corresponding to the CK-EAP map shown in Figure 7. This map represents a combination of various CK-EAP architectures depicted in Figure 7a and the use of conventional fuel for turbines along with other sources for energy storage, as illustrated in Figure 7b. The numbers below the horizontal axis in Figure 9 are the same as the row numbers in Figure 7a, which are, in fact, the architecture sequential numbers. Fuel-burn savings of 6%, 10%, and 11.9%, shown in Figure 9, are from the values described in the above paragraphs. The total fuel-burn savings of 27.9% is the cumulative efficiency of all the architectures except Architecture 1, which is the baseline. Because the same baseline is used to calculate the fuel-burn savings for each architecture, the additive relationship is used for the cumulative efficiency calculations.
Because the degree of hybridization of the electric boost is small [6], it can be deduced that the CO2 reduction is proportional to the corresponding fuel-burn savings. Therefore, the % percentage number represents the CO2 reduction percentage from the first order-of-magnitude standpoint. Likewise, for the same reason, it can be said that NOx, contrails, and non-CO2 compounds are also approximately reduced by the same percentage. Table 1 lists the GHG reductions of the GHG reduction effort category 1 technologies. As previously discussed, GHG reductions are primarily driven by fuel-burn savings. With the exclusion of the all-electric propulsion option, these savings are determined by several key factors: the improvement in propulsive efficiency through the use of decoupled electric propulsors, enhanced thermal efficiency optimized by the improved propulsive efficiency, and reduced fuselage drag achieved through BLI. These enhancements build upon the engine’s propulsive and thermal efficiencies, which have seen significant advancements over years of continuous improvement. Consequently, the 27.9% reduction represents a reasonable upper limit for GHG reductions. Although the numbers may be slightly higher or lower from different research groups, it is clear that the CK-EAP technologies substantially fall short of supporting achieving net-zero GHG emissions for large commercial transport.

4. GHG Reduction Effort Category 2—Green Fuel Combustion and Its Associated Electrification

GHG reduction effort category 2 for large commercial transport is indicated in the second dotted-line box from the left in Figure 3. This effort concerns aviation’s green fuel combustion effort. Two green fuel combustion efforts have occurred in this category: sustainable aviation fuel (SAF) and hydrogen fuel combustion.

4.1. SAF Combustion

SAF is an environmentally friendly alternative fuel that significantly reduces GHG emissions over its lifecycle. SAF can be produced from various feedstocks, such as biomass and synthetic fuels. SAF generated through the biomass approach is called Bio-SAF, while SAF generated through the synthetic fuel approach is called synthetic SAF. One of the most significant advantages of sustainable aviation fuel (SAF) is that it does not require modifying existing engines and supporting infrastructures. Besides the significant CO2 reduction, SAF has the advantage of reducing NOx and other non-CO2 emissions due to the purity of the fuel and the contrails caused by the relatively low peak combustion temperature [14,15,16].
Bio-SAF is usually made from biomass such as vegetable oils, waste cooking oils, agricultural waste, etc. These feedstocks absorb CO2 from the atmosphere through photosynthesis during their growth and then release CO2 during combustion. This process achieves partial GHG neutrality, with approximate reductions of 80% in CO2, 12% in NOx, 60% in contrails, and 25% in other non-CO2 compounds, all normalized to equivalents of CO2′s GHG impact.
Synthetic SAF is synthesized from H2O and CO2, using renewable energy sources such as wind and solar power. The process includes water electrolysis to produce hydrogen, capture carbon, and induce chemical synthesis to generate synthetic SAF. Theoretically, synthetic SAF can achieve 100% carbon neutrality. This is because the CO2 captured from the atmosphere during the production process is equal to the CO2 released during combustion, and the production process uses renewable energy, resulting in no additional carbon emissions. This process achieves partial GHG neutrality, with approximate reductions of 90% in CO2, 15% in NOx, 60% in contrails, and 25% in other non-CO2 compounds, all normalized to equivalents of CO2′s GHG impact.
GE Aerospace has been actively testing SAF across various aircraft engines. This extensive testing program began in 2016 and includes engines like the LEAPX, GE9X, Passport, GEnx, and others. Testing for LEAPX has been a joint effort with SAFRAN. The tests are conducted at different levels—component, engine, and aircraft—to evaluate the performance, emissions, and impact of 100% SAF on these engines [17]. Several airlines have committed to using SAF to replace conventional jet fuel.

4.2. Green Hydrogen Combustion

Green hydrogen is another environmentally friendly alternative fuel significantly reducing GHGs [18]. The energy density of hydrogen fuel cell systems is approximately 1000–2000 Wh/kg, whereas the energy density of hydrogen fuel engine systems is approximately 4800 Wh/kg. This significant difference makes the hydrogen engine the choice for large commercial transport aircraft such as B737, A320, A350, B747, B787, C919, etc.
The advantages of hydrogen include almost non-CO2 emissions and a mass-energy density of about 33,600 Wh/kg, far higher than traditional aviation fuel (such as Jet A fuel at 11,890 Wh/kg). Furthermore, compared to Jet A, hydrogen combustion can reduce contrails by 70% because, despite the higher water vapor, there is a lack of condensation nuclei, making the contrails thinner, more transparent, or less noticeable.
Hydrogen combustion’s disadvantages are also significant: hydrogen has a low volumetric density, requiring storage as liquid hydrogen at high pressure. The volumetric energy density of liquid hydrogen is about 8.491 MJ/L stored at −253 °C, compared to Jet A fuel’s volumetric energy density of about 35 MJ/L. Despite hydrogen’s high mass-energy density, its low volumetric energy density requires considerably more storage space, diminishing the advantage of the mass-energy density. Additionally, the large-scale construction of hydrogen production and refueling infrastructure is necessary, which requires significant investment and time.
AIRBUS and CFM have been jointly working on hydrogen combustion tests and exploring the pros and cons of future green fuel combustion [19].

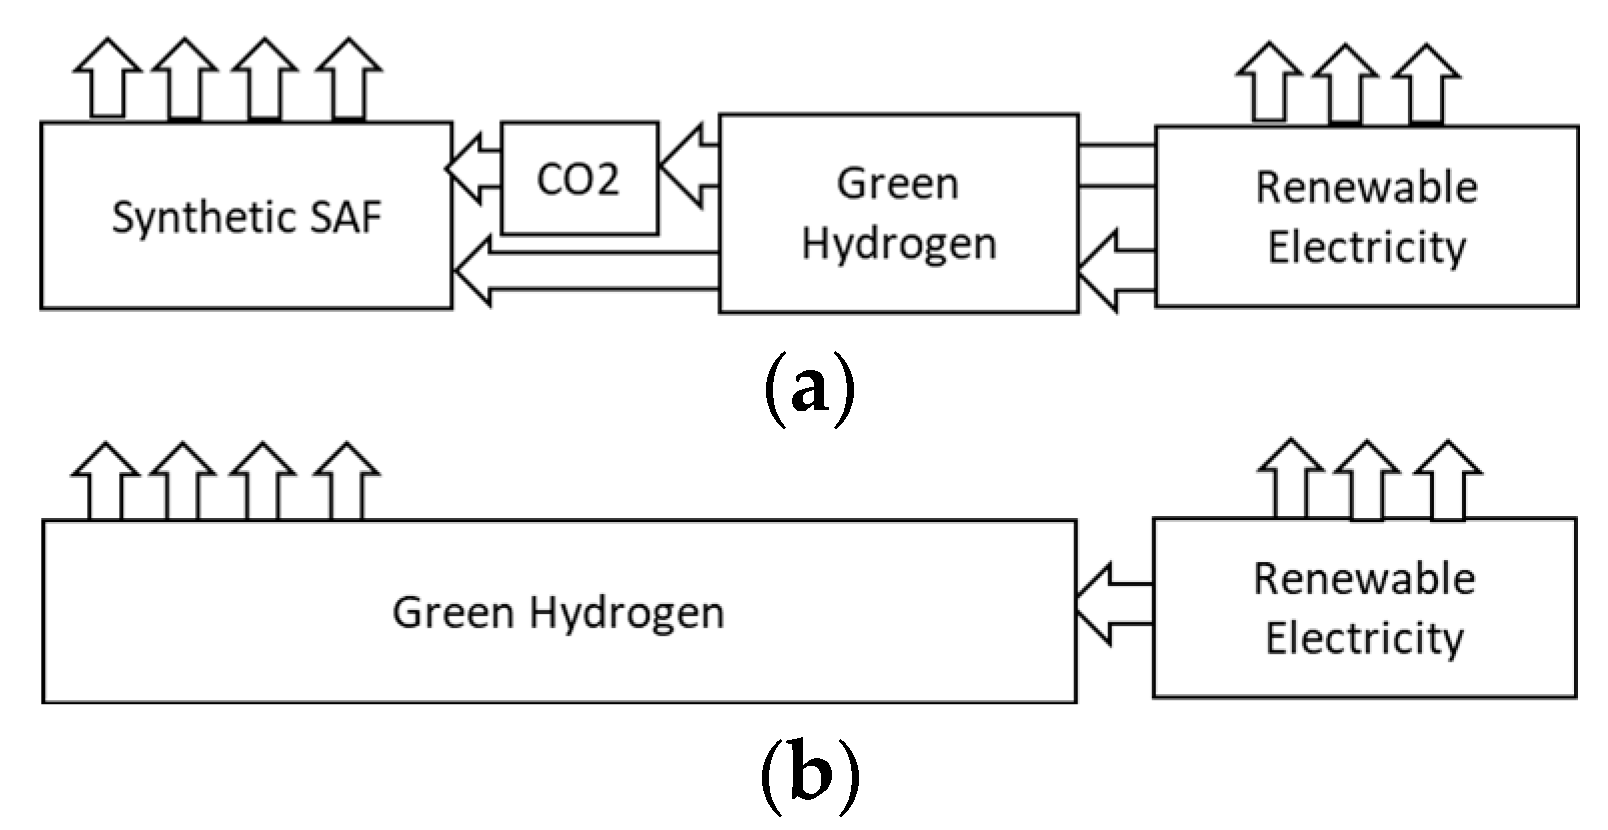
4.3. Necessity of Electrification in Green Fuel Production

The production processes of synthetic SAF and green hydrogen are heavily related to renewable energy power and electric motors/drives, which the aviation electrification industry should get involved in to accelerate the large-scale production of these fuels. Figure 10 describes the typical processes at a high level. The box at the upper right corner is for the green hydrogen production process, and all the boxes in the figure describe the synthetic SAF production process. Clearly, both synthetic SAF and green hydrogen processes are substantially tied to power from renewable energy sources. Also, every box in the figure involves motors and drives, for which efficiency, robustness, and cost are crucial.

4.4. Green Fuel Combustion Enhanced by CK-EAP

Another essential aspect that should be recognized is the opportunity to integrate GHG reduction effort categories 1 and 2. This can considerably enhance the benefits of green fuel combustion for all four emission reductions, including CO2, NOx, contrails, and other non-CO2 compounds, as well as fuel-burn savings improvement. Plugging Figure 11a into Figure 7a provides a good picture of the integration of synthetic SAF with CK-EAP, while plugging Figure 11b into Figure 7a offers a good picture of the integration of green hydrogen with CK-EAP.
Table 2 summarizes the GHG reductions achieved by green fuel combustions and their integration with CK-EAP, as depicted in GHG Box 2 of Figure 3. The “Synthetic SAF” column shows the performance of synthetic SAF combustion, divided into two sub-columns: one without CK-EAP integration and one with CK-EAP integration. Similarly, the “Green Hydrogen” column displays the performance of green hydrogen combustion, divided into sub-columns without and with CK-EAP integration. The integration of CK-EAP significantly enhances the performance of both green fuel combustions. C1 in the table means GHG reduction effort category 1.
GHG reduction effort category 2 offers significant potential for reducing GHG emissions in large commercial transport. The overall reduction is even more substantial when combining GHG reduction effort categories 1 and 2. However, neither of these efforts, individually or combined, can fully prevent all four types of emissions from entering the atmosphere. In other words, the approach still falls short of supporting the net-zero GHG objective.
The synthetic SAF solution offers the great advantages of directly replacing conventional fuel Jet A or Jet A1 and substantial GHG reductions, but the solution faces two major hurdles. One is the cost, which is currently about 50% higher than that of conventional jet fuel if the SAF is BIOSAF [20] and 2–3 times the conventional fuel if the SAF is synthetic [21,22], which has higher CO2 reduction potential (see Table 2). Theoretically, the reduction can reach 100% in the future. Although the cost is not affordable now, it continuously decreases with time. Also, the fuel-burn savings of 27.9% by CK-EAP, indicated in Table 2, offsets the high cost. The offset will be more effective with time. Another hurdle, as mentioned above, is that the solution falls short of supporting the net-zero GHG objective, and there may not be a remedy to overcome this disadvantage if the net-zero GHG means net-zero emissions of contrails, CO2, NOx, and other non-CO2 compounds.
The green hydrogen solution offers greater GHG emission reductions than synthetic SAF, with the significant advantage of completely eliminating CO2 emission. However, it faces five major hurdles. First, the cost of green hydrogen remains high, similar to that of synthetic SAF, making it economically challenging in the short term. Second, adopting hydrogen as a fuel necessitates an engine redesign, requiring substantial investments to transition from current technologies. Third, liquid hydrogen storage and safe operation pose significant engineering challenges, demanding the extensive redesign of aircraft, which will again require a considerable financial investment. Fourth, the development of refueling and transportation infrastructure for hydrogen will also require significant investment and time, further complicating the transition. Lastly, as mentioned above, is that the solution falls short of supporting the net-zero GHG objective, and there may not be a remedy to overcome this disadvantage if the net-zero GHG objective means net-zero emissions of contrails, CO2, NOx, and other non-CO2 compounds.
The shortcomings drive the need for better technologies. If the aviation industry relies solely on GHG reduction effort categories 1 and 2, it will leave a substantial portion of the GHG problem for other industries to address. It should be noted that leaving NOx and other non-CO2 compounds in the atmosphere not only causes greenhouse issues but also causes human health issues. These other industries are already facing their own challenges in supporting the net-zero target by 2050. Section 5 explores these technologies and pathways going forward.

5. GHG Reduction Efforts—Emerging Net-Zero-GHG Propulsion-Based EAP

The limitations of GHG reduction efforts in categories 1 and 2 and their combined impact highlight the need for a comprehensive exploration of GHG reduction effort category 3. This category is depicted in the third dotted-line box from the left in Figure 3. It focuses on containing the exhaust of the open-Brayton-cycle engine to prevent GHGs from entering and overheating the atmosphere. This section aims to review, digest, and examine the operational principles related to the net-zero GHG potential of these technologies and their interrelationship with the EAP technologies that must be incorporated into the integrated system.
The thermodynamic cycle must be closed to contain the exhaust of an open-Brayton-cycle engine; this technological approach is known as the closed Brayton cycle. Section 5.1 and Section 5.2 discuss two emerging closed-Brayton-cycle engines in aviation.
It is necessary to emphasize that both emerging technologies are grounded in the net-zero CO2 potential of synthetic SAF or green hydrogen. Synthetic SAF combustion can theoretically achieve net-zero CO2 emission, although it still requires further development. In contrast, green hydrogen combustion already possesses this capability. However, engine redesign, hydrogen storage development, aircraft modification, and ground infrastructure establishment will take time. The necessity of reliance on the net-zero CO2 feature in closed Brayton cycle technologies is illustrated by the following example: a B737 Max-7 carrying 21 tons of conventional Jet A fuel would generate 66.4 tons of CO2 during a flight where the entire 21 tons of fuel is consumed. Carrying 66.4 tons of CO2 is a feasibility issue, and dumping this 66.4 tons of CO2 diminishes the advantage of the closed-cycle engine technology.

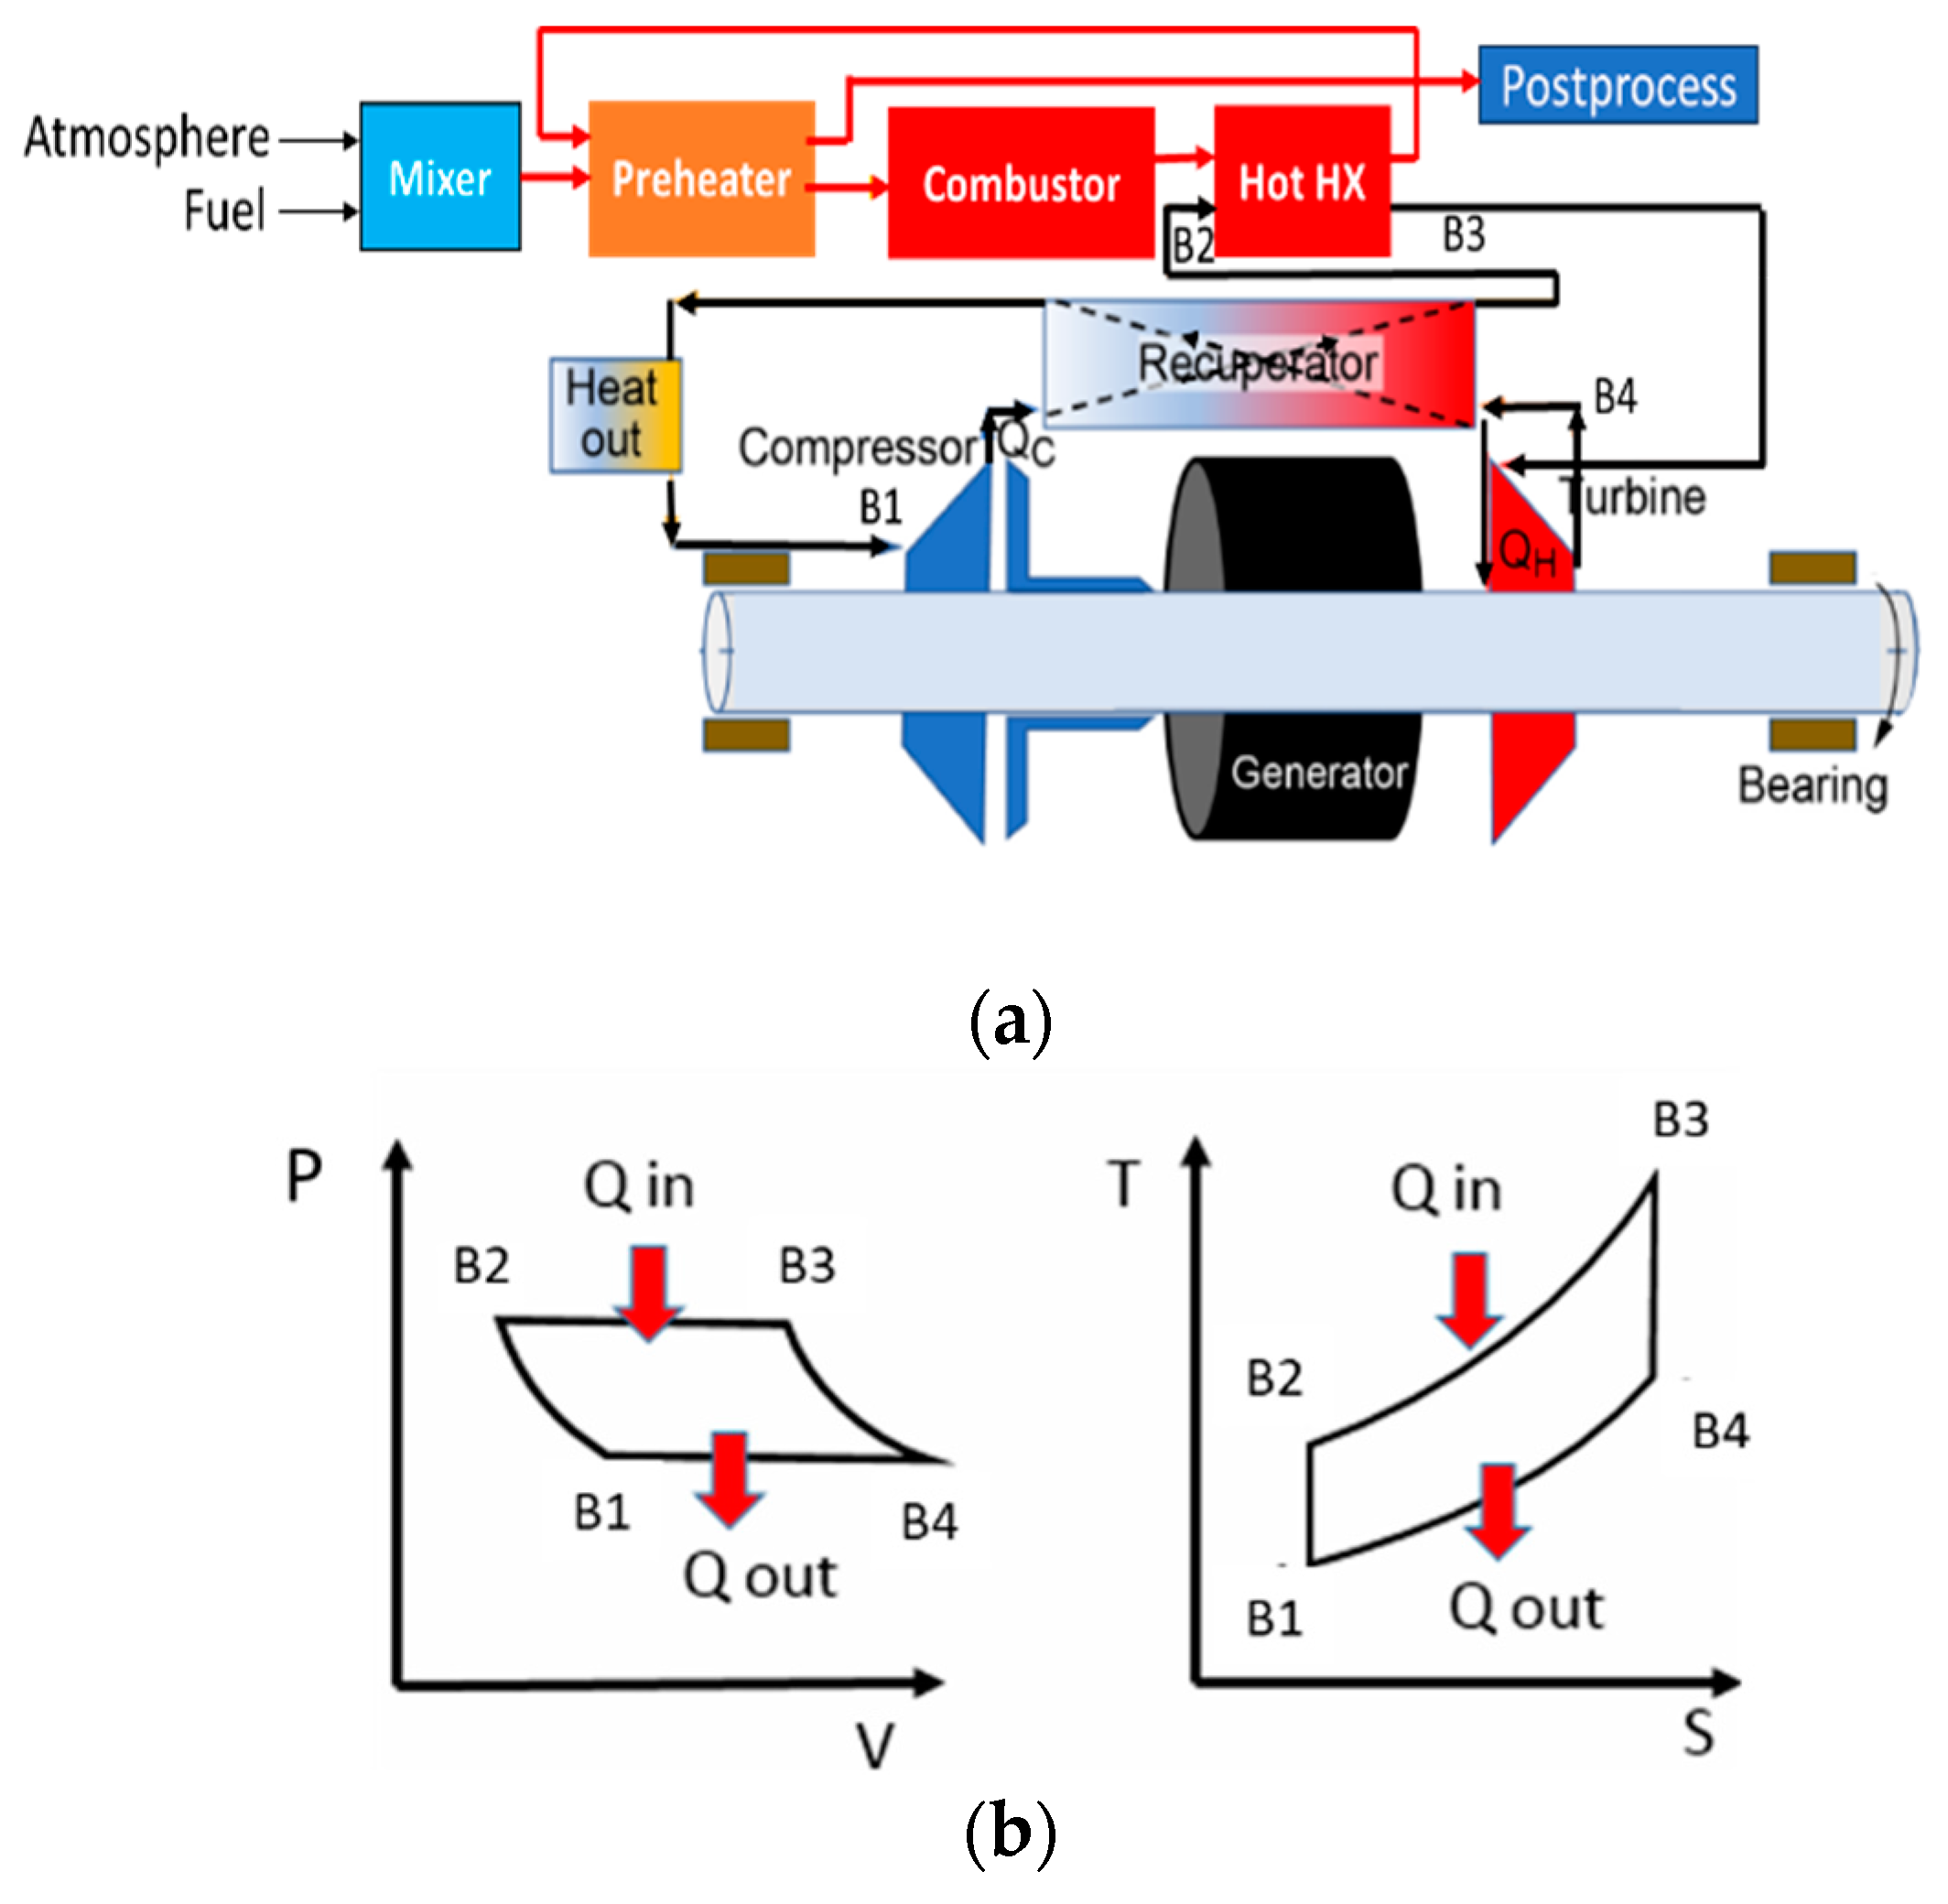
5.1. Supercritical CO2-Based Closed-Brayton-Cycle Engine Technology

Figure 12a illustrates a supercritical CO2 (sCO2)-based closed-Brayton-cycle engine. Unlike the open-Brayton-cycle engine, the closed-Brayton-cycle engine is a type of gas turbine engine in which the working fluid is continuously recirculated within a closed loop, indicated by the black lines with arrows in the figure. For the engine being discussed, the working fluid is supercritical CO2 generated under the conditions that the temperature is greater than 31.1 °C and the pressure is greater than 1070 psi [23]. Under this condition, the CO2 looks like a gas but has the density of a liquid—enabling powerful cooling and improving the overall efficiency of the heat exchangers in the cycle. Figure 12b presents the thermodynamic cycle curves for the closed-Brayton-cycle engine. The diagram on the left in Figure 12b shows the relationship between pressure (P) and volume (V), while the diagram on the right depicts the relationship between temperature (T) and entropy (S). The points B1, B2, B3, and B4 in Figure 12a,b correspond to each other. The working fluid sCO2 enters the compressor at point B1, where it is compressed, raising its pressure and temperature. The compressed fluid then flows through a heat exchanger, named Hot HX, where it absorbs heat from the combustor between point B2 and point B3, raising its temperature further while maintaining constant pressure (isobaric process). As indicated by points B3 and B4, the high-temperature, high-pressure fluid enters the turbine, where it expands, performing work (usually driving a generator or other mechanical device) and decreasing its pressure and temperature. After passing through the turbine, the fluid goes into a recuperator before re-entering the compressor to complete the cycle at point B1.
The recuperator is a type of heat exchanger used to enhance the efficiency of a closed-Brayton-cycle engine. It does this by recovering heat from the working fluid exiting the turbine and using it to preheat the compressed working fluid before it enters the primary heat exchanger (Hot HX). When the working fluid is compressed by the compressor, it is at a high pressure but relatively low temperature. This compressed fluid then enters the recuperator to absorb heat from the hot exhaust exiting the turbine.
As shown by the red lines with arrows, the combustor channel in Figure 12a is completely decoupled from the closed-loop fluid of the closed Brayton cycle by the primary heat exchanger, HOT HX. Air and fuel are introduced into a mixer. The mixture is then passed through a preheater before entering the combustor. Following combustion, the hot gases flow through the HOT HX. The output from the HOT HX is recirculated back to the preheater to preheat the incoming air and fuel mixture. Subsequently, the heat of the flow is reduced before entering a unit labeled “Postprocess”, where the water vapor is condensed by an HX cooled by the cold air at an altitude between 29,000 and 36,000 ft to bring the temperature below the dew point of water, causing the water vapor to condense into liquid form. The condensed water can then be separated from the gas stream and dumped outside the aircraft without generating contrails. This operation is crucial because SAF or hydrogen can generate enormous amounts of water in large commercial transport. For example, a B737Max-7 carrying 21T SAF generates 29.4T water. Furthermore, the leftover gases, such as NOx and other non-CO2 compounds, are collected for further processing. As a result, the closed-Brayton-cycle engine does not release contrails, NOx, and other non-CO2 compounds into the atmosphere.
Turbine blade cooling, or turbine blade heat rejection, is crucial for the success of the closed-Brayton-cycle engine for large commercial transport. In the case of the sCO2-based closed-Brayton-cycle engine, the blade is cooled by sCO2 without requiring an additional heat rejector inside the turbine shaft because the operating temperature of the sCO2 is relatively low, around 900°K. Although this is an advantage for turbine blade cooling, according to the Carnot efficiency formula, the turbine’s thermal efficiency is penalized. Several companies have been working on the technology development, but no product is ready for large commercial transport applications yet [24,25,26].

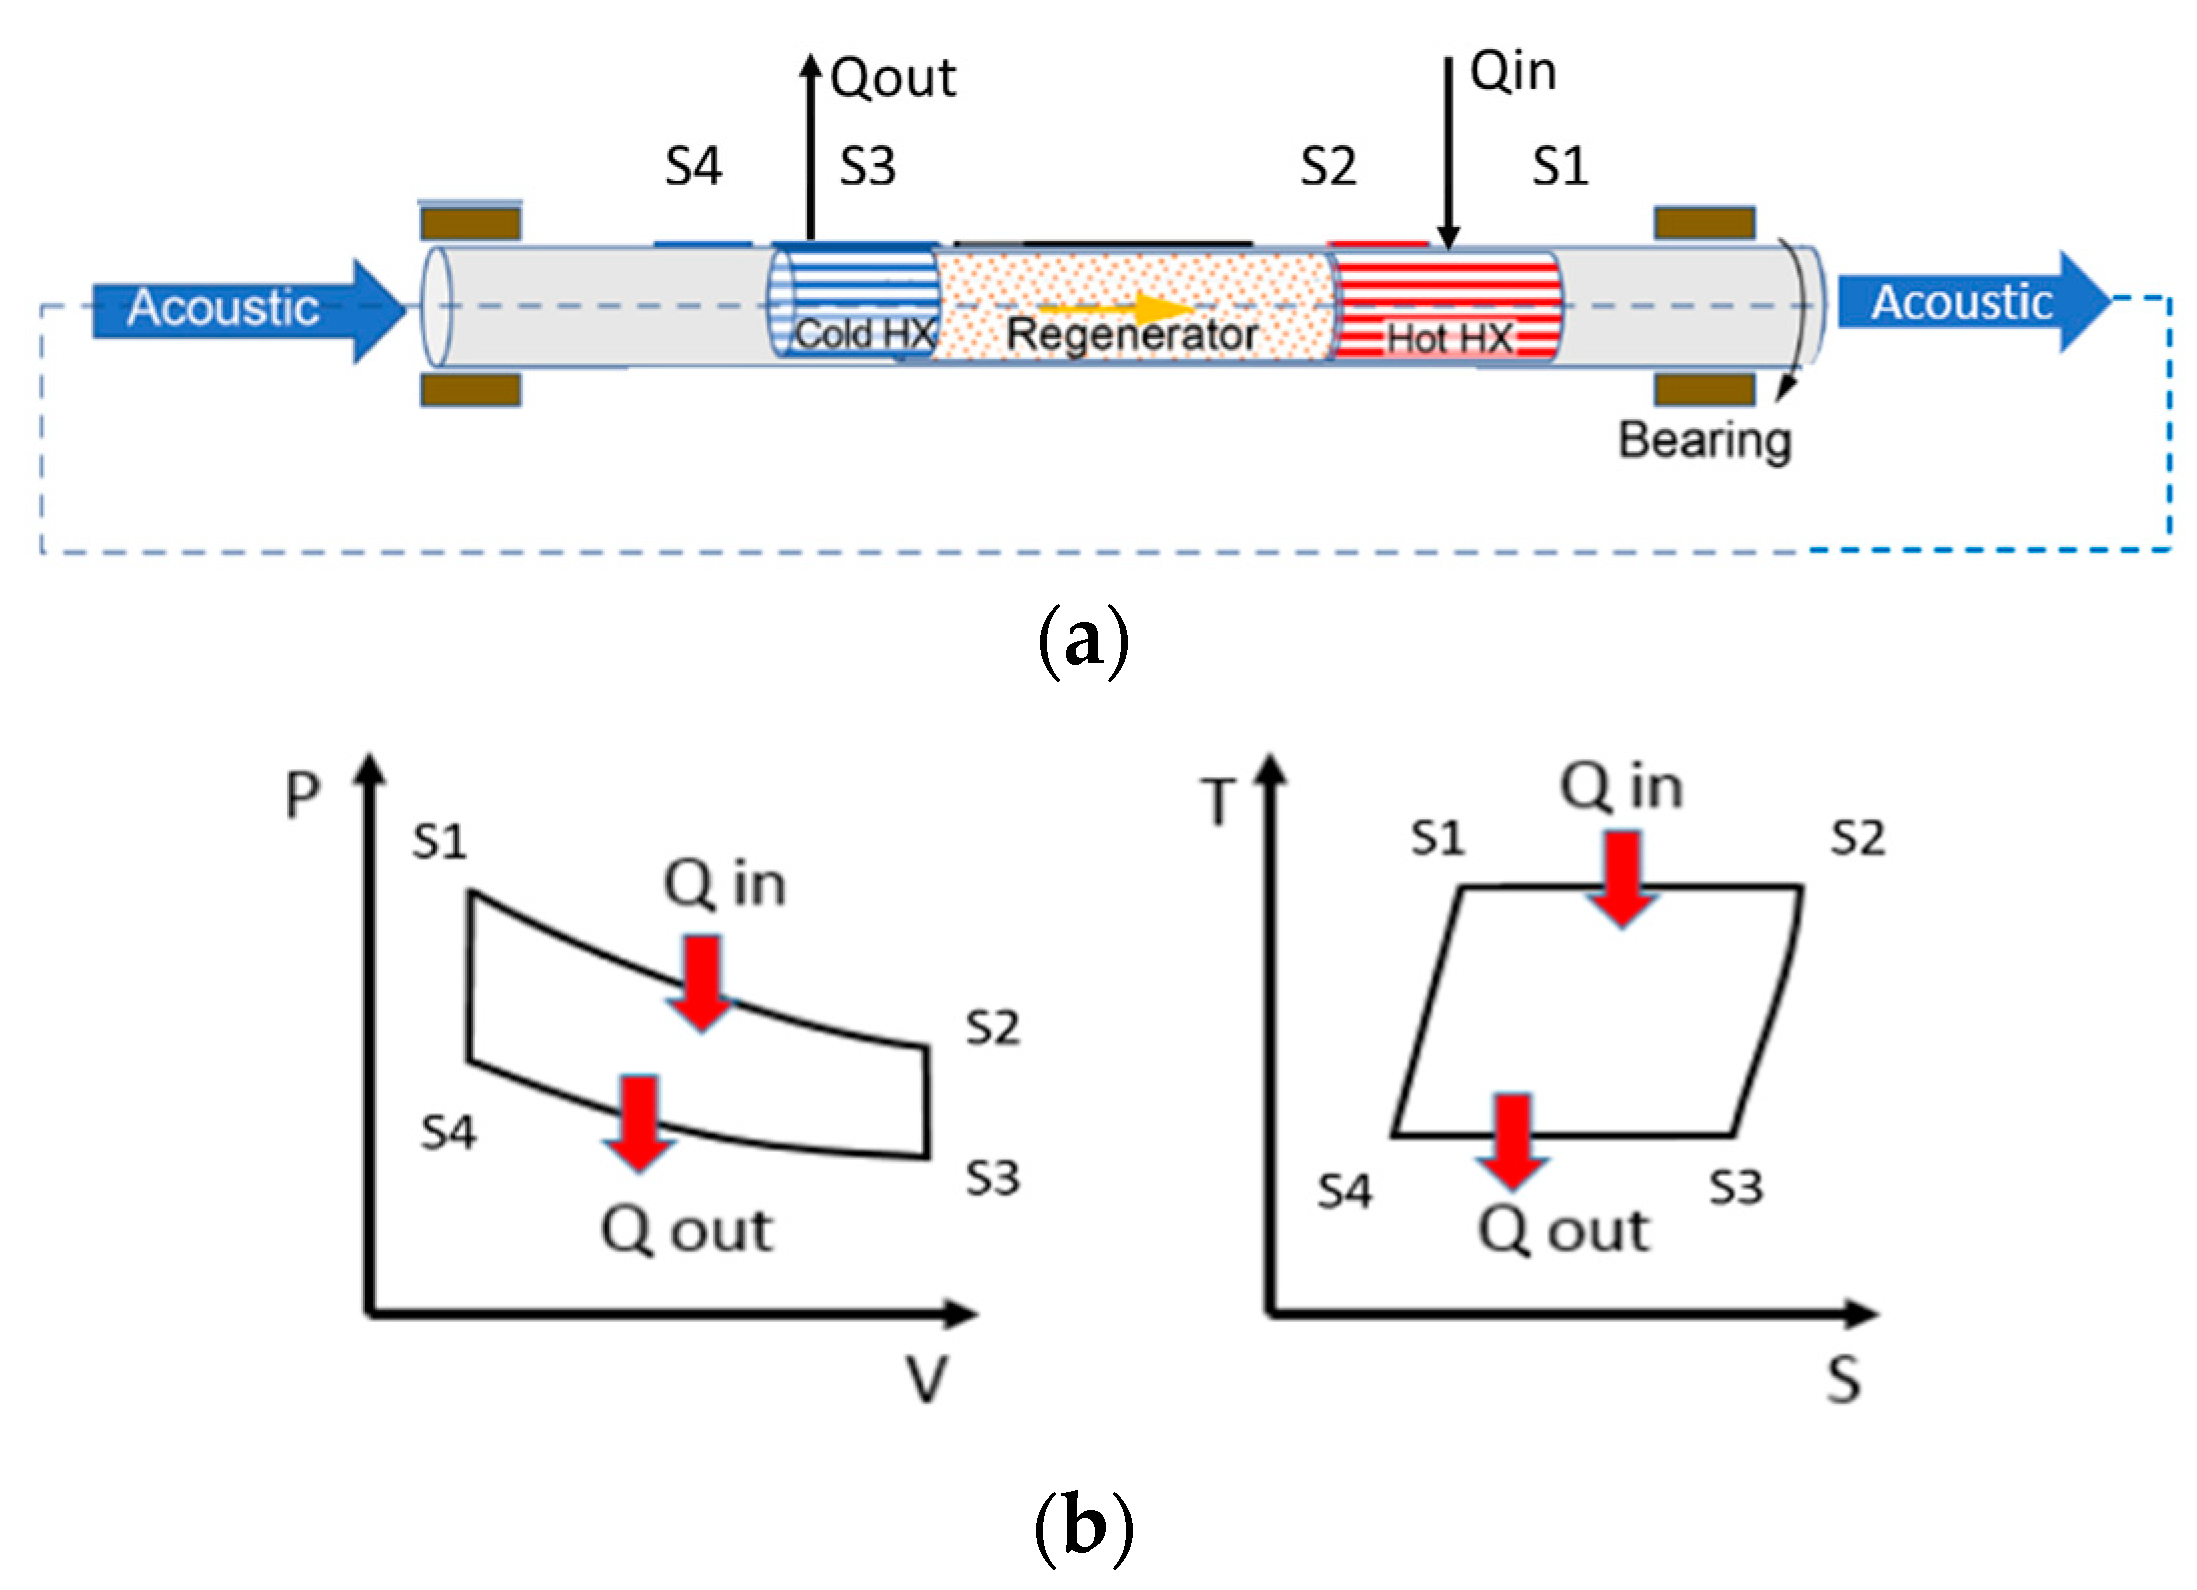
5.2. Closed-Strayton-Cycle Engine Technology

Helium is another working fluid used in the closed-Brayton-cycle engine instead of sCO2. The operating temperature is about 1900 °K, which substantially increases the engine’s thermal efficiency according to the Carnot efficiency formula. However, the disadvantage of such a high operating temperature is the turbine blade overheating issue. To address this issue, a turbine blade heat rejector must be added to the inside of the turbine shaft. To date, two approaches have been discussed in the aviation technical community to explore the realization of the turbine blade heat rejector: the thermoacoustic closed Stirling cycle [27] and the high-rotating-speed high-temperature heat pipe [28]. The technology of the latter approach is far from being applied to this application, so no further discussion will be given in this paper.
Figure 13a presents a thermoacoustic Stirling-cycle engine, while Figure 13b presents its corresponding thermodynamic cycle curves. The diagram on the left in Figure 13b shows the relationship between pressure (P) and volume (V), while the diagram on the right depicts the relationship between temperature (T) and entropy (S). Following through points S1, S2, S3, and S4 in Figure 13a,b, one can observe how such a Stirling-cycle engine operates: From point S1 to point S2, the sound wave causes the working fluid to expand in the rarefaction regions. This expansion leads to an increase in volume and a decrease in pressure. The working fluid absorbs heat (Qin) while maintaining a constant temperature. This occurs in the high-temperature heat exchanger (HotHX). From point S2 to point S3, the working fluid transfers heat to the regenerator at a constant volume, further decreasing pressure. From point S3 to S4, the sound wave causes the working fluid to compress in the compression regions. This compression results in a decrease in volume and an increase in pressure. The working fluid releases heat (Qout) while maintaining a constant temperature. This occurs in the low-temperature heat exchanger (ColdHX). From point S4 to S1, under the influence of the sound wave, the working fluid is heated at a constant volume, absorbing heat (Qin), and the pressure increases as the working fluid temperature rises.
Replacing the turbine shaft in Figure 12a with the Stirling cycle in Figure 13a, one obtains the closed-Strayton-cycle engine invented by NASA engineer Rodger Dyson [27,29]. Following both Figure 14a,b, one can see that the heat, QH, on the turbine blades from the Brayton cycle is transferred to the high-temperature heat exchanger (HotHX) in the Stirling cycle, and then heat is transferred through the regenerator to the low-temperature heat exchanger (ColdHX) as QC. This heat is then used to warm the air from the compressor, which is sent to the recuperator and then to the combustor. In other words, this heat, QC, is sent back to the Brayton cycle. This circulation described between the Brayton cycle and the Stirling cycle is called the Strayton cycle.
It must be noted that acoustic wave energy is generated during the cycle’s expansion (between points S1 and S4) and compression (between points S4 and S1) phases. This energy must be utilized to keep the Stirling cycle operating appropriately. The energy can be used through either the conversion of thermoacoustic energy to refrigeration for cooling electronics and electric machines in the system or the conversion of thermoacoustic energy to mechanical energy by a device called a bi-directional turbine to drive an electric generator (in addition to the main generator in the closed Brayton cycle), as mentioned in Figure 14a.
The paper [27] proposes combining four sets of the closed-Strayton-cycle quarters into a closed-Strayton-cycle engine, as shown in Figure 15. Figure 15a shows the engine’s schematics, and Figure 15b shows its physical representation. The engine includes four main generators and either four refrigerators or four auxiliary generators.

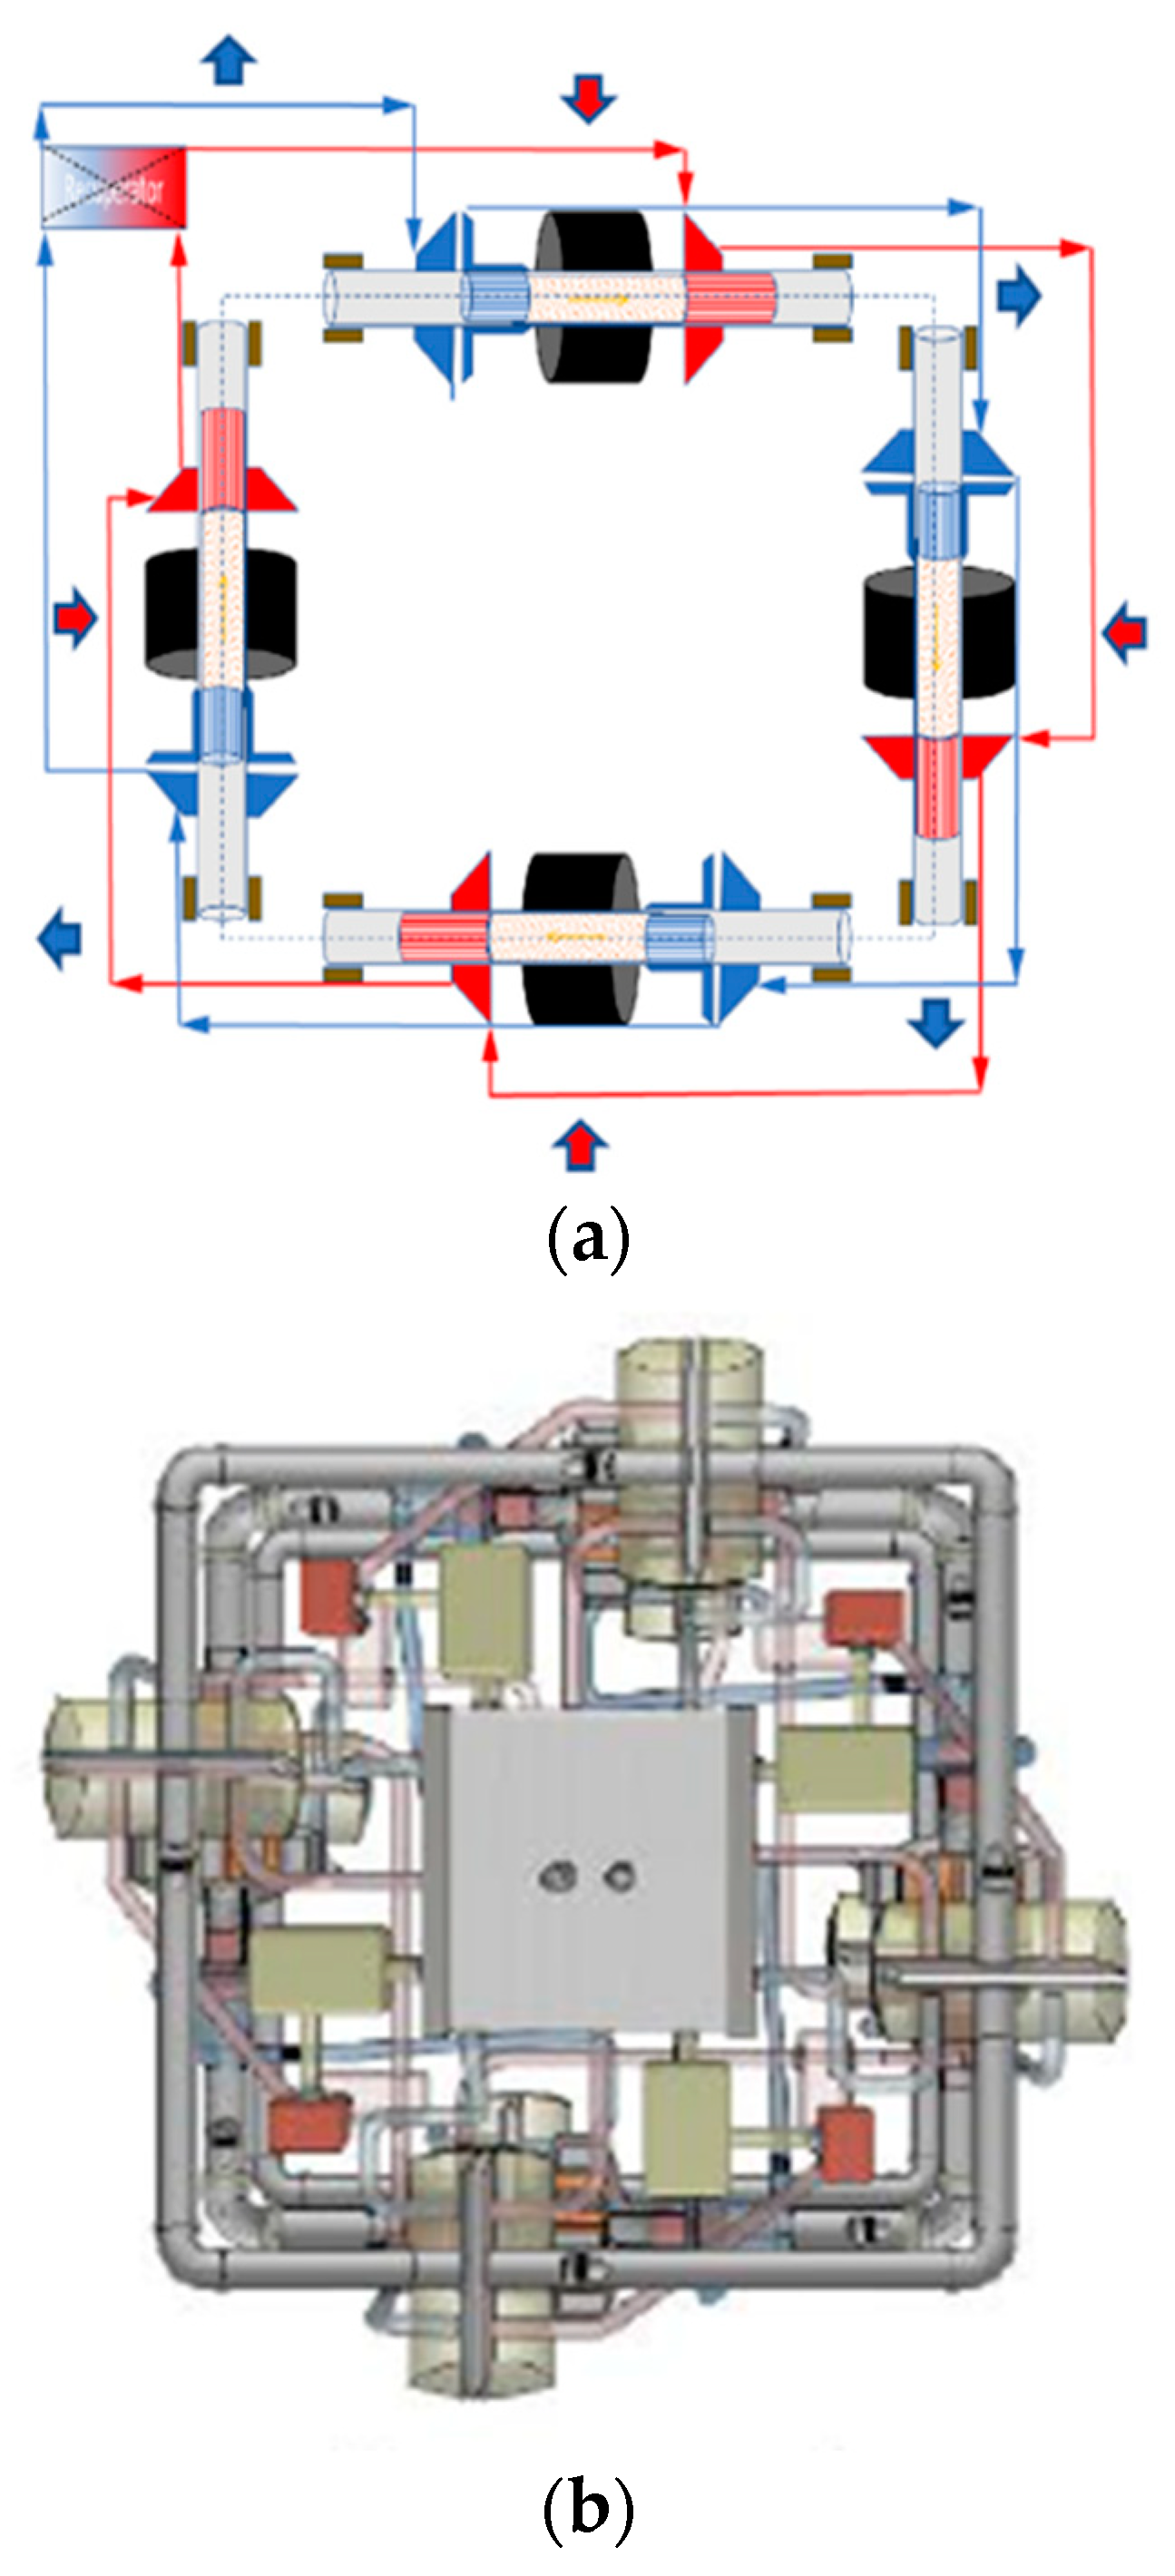
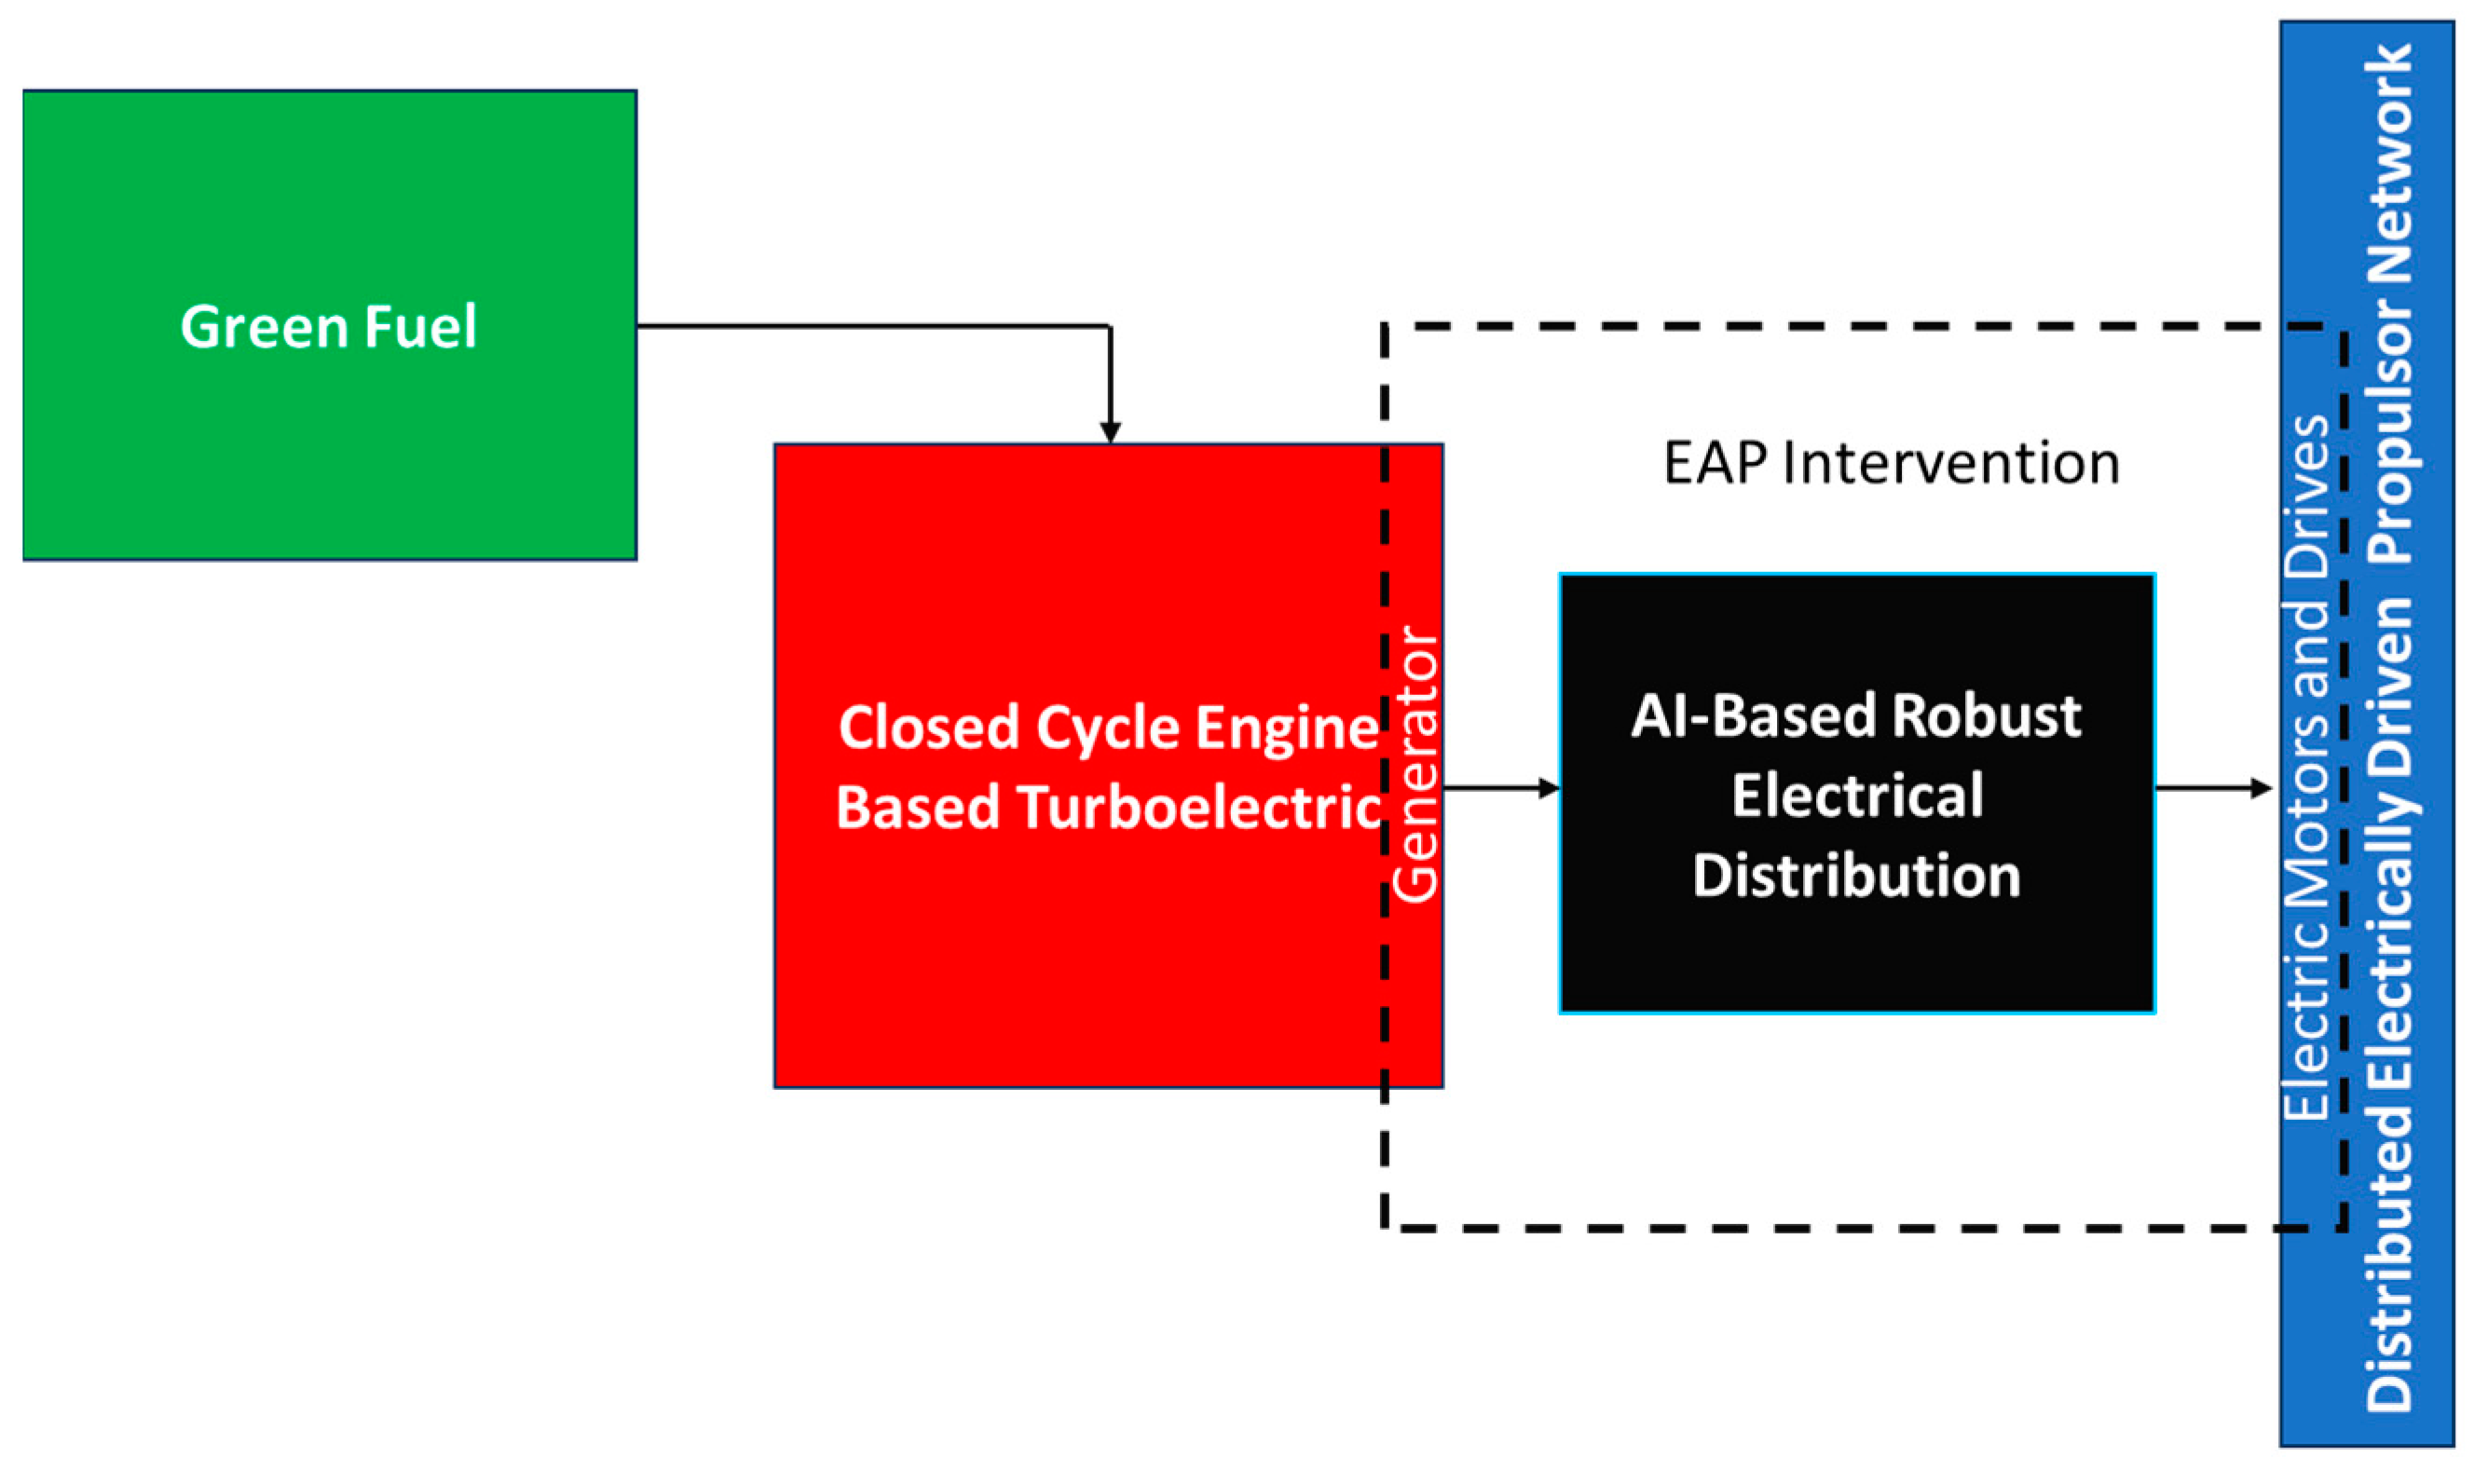
5.3. True Net-Zero GHG Propulsion-Based EAP

The two emerging closed-cycle engine technologies reviewed above are crucial for achieving net-zero-GHG propulsion. Table 3 presents the GHG net-zero capabilities of the technologies. Such great potential has not been seen in GHG reduction effort categories 1 and 2 or their combination. Nevertheless, it is important to note that the 100% CO2 reduction shown in Table 3 is not directly attributable to GHG reduction effort category 3 but to category 2 with an assumption that synthetic SAF and green hydrogen combustion eliminate the CO2 emission. Of course, green hydrogen has already been capable of doing this, while synthetic SAF still needs some time. Now, a question should be raised: Can the emerging propulsion and green fuel combustion technologies alone achieve what Table 3 shows? The answer is no; the details can be seen below.
Further, it should be emphasized that the two emerging closed-cycle engine technologies require significant research and development before they can be implemented in large commercial transport.
The two emerging technologies and green fuel combustion offer an extraordinary net-zero GHG advantage. However, this advantage cannot be realized without the intervention of electrified aircraft technologies. For instance, in the case of the EAP-based narrow-body transport proposed by NASA, shown in Figure 16, there are four main generators (5 MW each) and sixteen electric propulsors (1.25 MW each) [30,31]. Each main generator powers four electric propulsors. In the scenario of using the sCO2-based Brayton-cycle engines, using the conventional engine and propulsor architecture is impossible because the operating temperature of the sCO2-based Brayton-cycle engine is low, 900 °K, so the size and weight of the engine are extremely challenging. Large commercial transport powered by sCO2-based Brayton-cycle engines cannot compete with conventional large commercial transport in weight without relying on the turbo-electric approach. In the scenario of using the Strayton-cycle engines, the conventional engine with a mechanically integrated propulsor arrangement is not even feasible, according to Figure 15. Therefore, an EAP technology intervention is profoundly necessary to realize the net-zero advantage of either engine.
It is essential to point out that many technologies that have been in development for CK-EAP can be adopted and utilized for the EAP intervention in this section. The time, effort, and investment the industry dedicates to CK-EAP are valuable and will not be in vain.
This new opportunity for the aviation electrification industry encompasses two key aspects: integrating the generator with the engine and integrating the power system with the engine generator and the electric propulsors. For example, an H-type ring bus architecture, shown in Figure 17, significantly improves reliability, redundancy, protection, and weight reduction [32].
If the closed-Strayton-cycle engine is chosen, the generator’s power rating will need to be 1.25 MW, as indicated in Figure 14, since the engine must utilize four small 1.25 MW main generators instead. Consequently, breaking down 5 MW to four 1.25 MW generators opens up an opportunity to further enhance the redundancy and robustness of the entire electrical power system. The power generation circuit within the dotted-line box in Figure 17 will open up significant improvements and modifications.
Despite the smaller machine, a 1.25 MW generator still presents considerable challenges regarding generator type selection, machine design, and the mechanical, thermal, and lubrication interfaces with the Strayton engine.
To summarize the key points in this section, Figure 18 provides a block diagram of the net-zero GHG EAP for large commercial transport. In the figure, the closed-cycle engine-based turboelectric system is at the center of the figure (red box), with the generator as a crucial component. The green fuel (green box), a critical input ensuring the engine operates in a CO2-free condition, feeds into the central closed-cycle engine. As discussed in this section, the closed-cycle engine doesn’t exhaust CO2, NOx, contrails, or other non-CO2 compounds into the atmosphere. On the right, the distributed electrically driven propulsor network (blue box) represents the array of electric propulsors distributed across the aircraft wings and tail. The AI-based robust electrical distribution system (black box) is between the closed-cycle engine-based turboelectric system and the propulsor network. This electrical distribution system, the generator within the turboelectric system, and the electric motors and drives within the propulsor network form an integrated system labeled "EAP Intervention." This system is essential for enabling the entire system to function as a true net-zero GHG electrified aircraft propulsion solution for large commercial transport.
The true net-zero-GHG propulsion-based EAP is promising for fully green future commercial large transport. However, there is a long way to go to achieve it. The aviation industry must research, develop, design, build, test, and qualify products, including closed-cycle engines, generators, power systems, motors, drives, etc. On top of these efforts, certification is another hurdle the industry must overcome.

6. Conclusions

The increasing severity of climate change has necessitated a shift in priorities, making net-zero GHG emissions an important top priority for the aviation electrification industry. GHG reduction effort category 1 (conventionally known EAP (CK-EAP)) falls far short of achieving net-zero GHG emissions for large commercial transport. GHG reduction effort category 2 (green fuel combustion and its associated electrification) and combining the two categories still fall short of achieving net-zero GHG emissions for large commercial transport. These shortcomings highlight the necessity and urgency of developing the closed-cycle engine technologies described in GHG reduction effort category 3 (emerging net-zero-GHG propulsion-based EAP), which show true net-zero GHG potential.
On the other hand, the closed-cycle engine technologies in GHG reduction effort category 3 (emerging net-zero-GHG propulsion-based EAP) will not work without the intervention of EAP technologies from GHG reduction effort category 1 and the success of green fuel combustion in GHG reduction effort category 2. The combination of the efforts of these three categories is the true net-zero propulsion-based EAP for large commercial transport.
The aviation electrification industry should more proactively and urgently devote its resources, innovations, and investments to GHG reduction efforts for large commercial transport.

Author Contributions

H.H., conceptualization, research, literature analyses, and original draft; K.R., research, review, and edit. All authors have read and agreed to the published version of the manuscript.

Funding

This research received no external funding.

Acknowledgments

The authors wish to express their sincere appreciation to Di Zhang at the Naval Postgraduate School for his valuable and excellent discussions and knowledge sharing on closed Brayton- and Strayton-cycle engines.

Conflicts of Interest

The authors declare no conflicts of interest.

References

  1. The Paris Agreement. United Nations, November 2016. Available online: https://unfccc.int/process-and-meetings/the-paris-agreement (accessed on 10 May 2023).
  2. United States 2021 Aviation Climate Action Plan. Available online: https://www.faa.gov/sites/faa.gov/files/2021-11/Aviation_Climate_Action_Plan.pdf (accessed on 21 June 2023).
  3. Lee, D.S.; Fahey, D.W.; Skowron, A.; Allen, M.R.; Burkhardt, U.; Chen, Q.; Doherty, S.J.; Freeman, S.; Forster, P.M.; Fuglestvedt, J.; et al. The contribution of global aviation to anthropogenic climate forcing for 2000 to 2018. Elsevier Atmos. Environ. 2021, 244, 117834. [Google Scholar] [CrossRef] [PubMed]
  4. Timperley, J. The challenge of tackling aviation’s non-CO2 emissions. Carbon Brief 2017, 15, 17. [Google Scholar]
  5. Haran, K.; Madavan, N.; O’Connell, T.C. Electrified Aircraft Propulsion, Powering the Future of Air Transportation; Cambridge University Press: Cambridge, UK, 2022. [Google Scholar]
  6. Hoogreef, M.; Vos, R.; de Vries, R.; Veldhuis, L.L. Conceptual Assessment of Hybrid Electric Aircraft with Distributed Propulsion and Boosted Turbofans. In Proceedings of the AIAA SciTech 2019 Forum, San Diego, CA, USA, 7–11 January 2019. [Google Scholar]
  7. GE Aviation and Safran Launch Advanced Technology Demonstration Program for Sustainable Engines; Extend CFM Partnership to 2050. Available online: https://www.geaerospace.com/press-release/other-news-information/ge-aviation-and-safran-launch-advanced-technology (accessed on 1 July 2023).
  8. Kim, H.D.; Brown, G.V.; Felder, J.L. Distributed Turboelectric Propulsion for Hybrid Wing Body Aircraft. In Proceedings of the 9th International Powered Lift Conference, London, UK, 22–24 July 2008. [Google Scholar]
  9. Perullo, C.; Alahmad, A.; Wen, J.; D’Arpino, M.; Canova, M.; Mavris, D.N.; Benzakein, M. Sizing and Performance Analysis of a Turbo-Hybrid-Electric Regional Jet for the NASA ULI Program. In Proceedings of the AIAA Propulsion and Energy 2019 Forum, Indianapolis, IN, USA, 19–22 August 2019. [Google Scholar]
  10. Taylor, N. Cell Energy Density Roadmap. Battery Design, 6 January 2022. Available online: https://www.batterydesign.net/cell-energy-density-roadmaps/ (accessed on 24 July 2024).
  11. Machín, A.; Morant, C.; Márquez, F. Advancements and Challenges in Solid-State Battery Technology: An In-Depth Review of Solid Electrolytes, and Anode Innovations. Batteries 2024, 10, 29. [Google Scholar] [CrossRef]
  12. Hettesheimer, T.; Neef, C.; Inclán, I.R.; Link, S.; Schmaltz, T.; Schuckert, F.; Stephan, A.; Stephan, M.; Thielmann, A.; Weymann, L.; et al. Lithium-Ion Battery Roadmap—Industrialization Perspectives Toward 2030. Fraunhofer Inst. Syst. Innov. Res. December 2023. Available online: https://publica.fraunhofer.de/entities/publication/fc576f43-5e5f-466e-9ea1-e0f2d9e742c9/details (accessed on 24 July 2024). [CrossRef]
  13. Schmaltz, T.; Wicke, T.; Weymann, L.; Voß, P.; Neef, C.; Thielmann, A. Solid-State Battery Roadmap 2035+. Fraunhofer Institute for Systems and Innovation Research ISI, Karlsruhe, April 2022. Available online: https://publica.fraunhofer.de/entities/publication/7be4b3d3-2844-42d9-b900-a19e1ee1ddea/details (accessed on 24 July 2024). [CrossRef]
  14. Thomson, R.; Sachdeva, N.; Healy, A.; Bail, N.; Sterm, C. Sustainable Aviation Fuels, Roland Berger Report, London, Great Britain, July 2020. Available online: https://www.rolandberger.com/publications/publication_pdf/roland_berger_sustainable_aviation_fuels.pdf (accessed on 24 July 2024).
  15. Sustainable Aviation Fuel, Energy Efficiency & Renewable Energy, Department of Energy. Available online: https://afdc.energy.gov/fuels/sustainable-aviation-fuel (accessed on 20 June 2024).
  16. SpringerLink—Advance in Pathways to Sustainable Aviation Fuels. Available online: https://link.springer.com/chapter/10.1007/978-3-031-06577-4_1 (accessed on 19 June 2024).
  17. AviTrader. Available online: https://avitrader.com/2023/12/12/ge-aerospace-and-partners-complete-testing-on-10th-engine-model-using-100-saf-since-2016/ (accessed on 19 May 2024).
  18. IATA. FACT SHEET 7: Liquid Hydrogen as a Potential Low-Carbon Fuel for Aviation; International Air Transport Association: Montreal, QC, Canada, 2019; Available online: https://www.iata.org/contentassets/d13875e9ed784f75bac90f000760e998/fact_sheet7-hydrogen-fact-sheet_072020.pdf (accessed on 24 July 2024).
  19. Hydrogen Takes Flight: Airbus and CFM International To Partner On Hydrogen-Fueled Demonstration by GE Reports. 23 February 2022. Available online: https://www.geaerospace.com/news/articles/product-sustainability-technology/hydrogen-takes-flight-airbus-and-cfm-international (accessed on 12 June 2022).
  20. Aircraft Fuel Prices at U.S. Airports & FBOs. Available online: https://www.globalair.com/airport/region.aspx (accessed on 24 July 2024).
  21. Wolff, C.; Rifer, D. Clean Skies for Tomorrow Sustainable Aviation Fuels as a Pathway to Net-Zero Aviation; World Economic Forum Insight Report; November 2020. Available online: https://www.weforum.org/publications/clean-skies-for-tomorrow-sustainable-aviation-fuels-as-a-pathway-to-net-zero-aviation/ (accessed on 14 June 2024).
  22. Holladay, J.; Abdullah, Z.; Heyne, J. Sustainable Aviation Fuels: Review of Technical Pathways, Office of Energy Efficiency & Renewable Energy, Department of Energy, 2020. Available online: https://www.energy.gov/sites/prod/files/2020/09/f78/beto-sust-aviation-fuel-sep-2020.pdf (accessed on 19 May 2024).
  23. Van Welie, G.D.; Marion, J.C.; Conlon, W.C. sCO2 Power Cycle Development and Commercialization. In Proceedings of the 6th International Supercritical CO2 Power Cycles Symposium, Pittsburgh, PA, USA, 27–29 March 2018. [Google Scholar]
  24. Khadse, A.; Blanchette, L.; Kapat, J.; Vasu, S.; Hossain, J.; Donazzolo, A. Optimization of Supercritical CO2 Brayton Cycle for Simple Cycle Gas Turbines Exhaust Heat Recovery Using Genetic Algorithm. Trans. ASME 2018, 140, 071601. [Google Scholar] [CrossRef]
  25. Wright, S.; Radel, R.; Vernon, M.; Rochau, G.; Pickard, P. Operation and analysis of a supercritical CO2 Brayton cycle, SAND2010-0171, 1 September 2010. Available online: https://www.osti.gov/biblio/984129/ (accessed on 24 July 2024). [CrossRef]
  26. Construction Underway on sCO2 Brayton Cycle Demo Plant. Available online: https://www.modernpowersystems.com/analysis/construction-underway-on-sco2-brayton-cycle-demo-plant-6920953/?cf-view (accessed on 6 June 2024).
  27. Dyson, R. True Zero Emission Electric Aircraft Propulsion Transport Technology. In Proceedings of the AIAA AVIATION 2023 Forum, San Diego, CA, USA, 12–16 June 2023. [Google Scholar]
  28. Wang, Z.; Turan, A.; Craft, T. Review of the State of the Art for Radial Rotating Heat Pipe Technology Potentially Applicable to Gas Turbine Cooling. Thermo 2023, 3, 127–147. [Google Scholar] [CrossRef]
  29. Chapman, J.; Simon, D.; McNichols, E. An Analysis of the Strayton Engine, a Brayton and Stirling Cycle Recuperating Engine. In Proceedings of the AIAA Propulsion and Energy Forum, Indianapolis, IN, USA, 19–22 August 2019. [Google Scholar]
  30. Armstrong, M.J.; Ross, C.A.H.; Blackwelder, M.J.; Rajashekara, K. Trade Studies for NASA N3-X Turboelectric Distributed Propulsion System Electrical Power System Architecture. SAE Int. J. Aerosp. 2012, 5, 325–336. [Google Scholar] [CrossRef]
  31. Kim, H.D.; Felder, J.L.; Tong, M.T.; Armstrong, M. Revolutionary Aeropropulsion Concept for Sustainable Aviation: Turboelectric Distributed Propulsion. In Proceedings of the 2013 International Society for Air Breathing Engines, Busan, Republic of Korea, 9–13 September 2013. [Google Scholar]
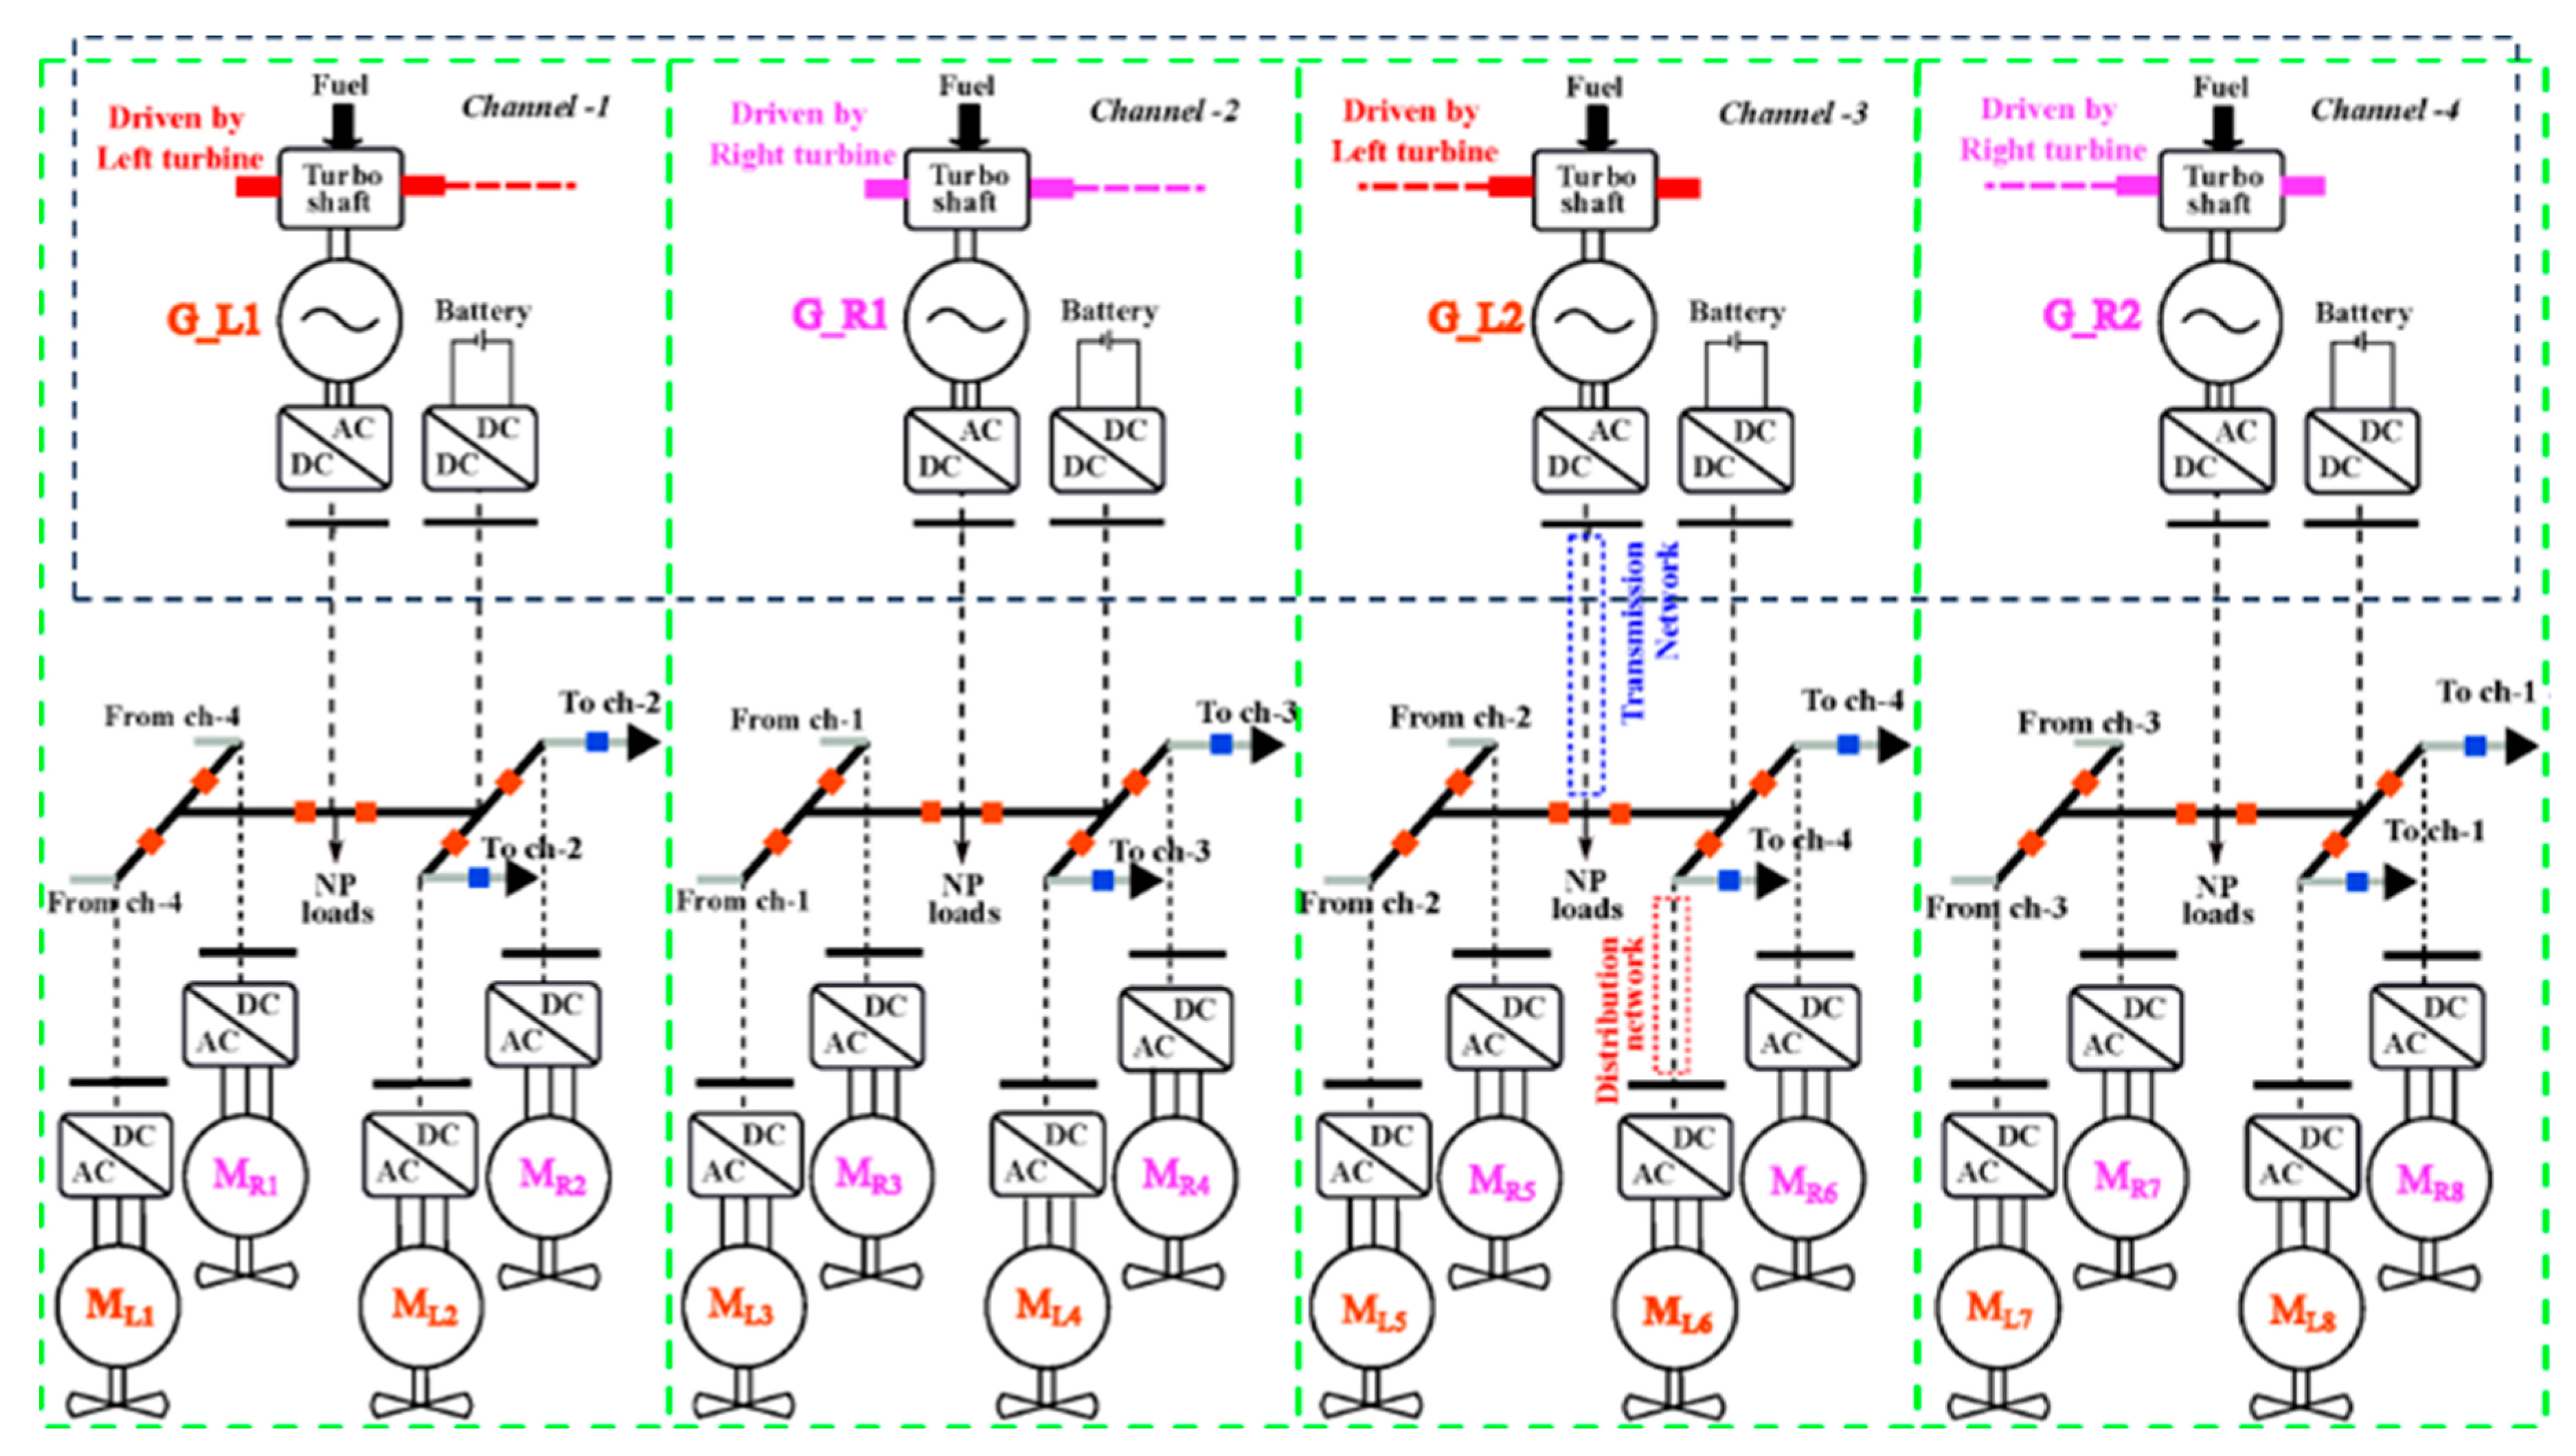
  32. Siddavatam, A.K.R.; Rajashekara, K.; Reddy, S.R.P.; Huang, H.; Krishnamoorthy, H.S.; Wang, F. A H-type architecture for electric/hybrid-electric aircraft propulsion systems. Institute of Engineering and Technology. IET Electr. Syst. Transp. 2023, 13, e12065. [Google Scholar] [CrossRef]
Figure 1. U.S. aviation GHG emissions in 2019.
Wevj 15 00411 g001
Figure 2. Turbofan (open Brayton cycle) with its GHG emissions in the exhaust.
Wevj 15 00411 g002
Figure 3. Three major GHG reduction effort categories revolving around turbofans.
Wevj 15 00411 g003
Figure 4. Engine electric boost propulsion.
Wevj 15 00411 g004
Figure 5. Partial turbo-electric propulsion for BLI.
Wevj 15 00411 g005
Figure 6. Full turbo-electric distributed hybrid propulsion.
Wevj 15 00411 g006
Figure 7. CK-EAP technology map: (a) architectures; (b) conventional fuel for turbine and energy source for energy storage.
Wevj 15 00411 g007
Figure 8. Battery energy density growth roadmap from the Faraday Institute, a battery expertise group; reprinted from Ref. [9].
Wevj 15 00411 g008
Figure 9. Cumulative fuel-burn savings and GHG reductions for CK-EAP in large commercial transport.
Wevj 15 00411 g009
Figure 10. Typical SAF and green hydrogen production processes.
Wevj 15 00411 g010
Figure 11. Green fuel working with Figure 7a: (a) synthetic SAF, (b) green hydrogen.
Wevj 15 00411 g011
Figure 12. sCO2-based closed-Brayton-cycle engine: (a) fundamentals; (b) thermodynamic cycle curves.
Wevj 15 00411 g012
Figure 13. Thermoacoustic Stirling-cycle engine: (a) fundamentals; (b) thermodynamic cycle curves.
Wevj 15 00411 g013
Figure 14. Closed-Strayton-cycle engine: (a) fundamentals; (b) thermodynamic cycle curves.
Wevj 15 00411 g014
Figure 15. Four quad configuration of the closed Strayton engine: (a) schematics; (b) physical representation; adapted from Ref. [27].
Wevj 15 00411 g015
Figure 16. NASA EAP-based narrow-body concept; adapted from Ref. [31].
Wevj 15 00411 g016
Figure 17. A H-type fault-tolerant architecture; adapted from Ref. [32].
Wevj 15 00411 g017
Figure 18. Block diagram of true net-zero GHG EAP for large commercial transport.
Wevj 15 00411 g018
Table 1. GHG reduction summary for the technologies in GHG reduction effort category 1.
GHG Reduction (%)
CO2−27.9
NOx−27.9
Contrails−27.9
Non-CO2−27.9
Fuel Burn−27.9
Important AttributeSubstantial ongoing R&D
Table 2. GHG reduction summary for the technologies in GHG reduction effort category 2.
GHG Reduction (%)
Synthetic SAFGreen Hydrogen
Without C1With C1 *Without C1With C1
CO2−90−93−100−100
NOx−15−41−25−48
Contrails−60−72−70−79
Non-CO2−25−48−40−58
Fuel Burn−27.9−27.9
Important AttributeNo need to change engine and infrastructureNeed to change engine and infrastructure
Note: * - C1 is GHG reduction effort category 1.
Table 3. GHG reduction summary for the technologies in GHG reduction effort category 3.
GHG Reduction (%)
CO2−100
NOx−100
Contrails−100
Non-CO2−100
Important AttributeLack of R&D for large commercial transport
Disclaimer/Publisher’s Note: The statements, opinions and data contained in all publications are solely those of the individual author(s) and contributor(s) and not of MDPI and/or the editor(s). MDPI and/or the editor(s) disclaim responsibility for any injury to people or property resulting from any ideas, methods, instructions or products referred to in the content.

