Abstract
This study aims to determine the type of vehicle with the lowest fuel consumption and greenhouse gas emissions by comparing spark ignition commercial vehicles against hybrid vehicles. The data were obtained through the OBD Link MX+ interface under traffic conditions in the Metropolitan District of Quito to determine the consumption and emissions delivered by each studied vehicle. Measurements were made while driving on two high-traffic routes during peak hours, with a duration of 2 to 3 h of stalling, and the engine fuel consumption parameters of each vehicle were obtained using 85 octane gasoline. Five measurements were generated per route and for each vehicle tested to reduce uncertainty and strengthen the prediction model with a factor of less than 10%. Statistical analysis was implemented to obtain a numerical model that allowed to analyse the estimate of the variation in fuel economy in each vehicle. The numerical model compared the values of fuel consumption measured with those calculated on all the routes with the highest traffic, finally indicating which vehicle with the smallest cylinder capacity is optimal, with an average consumption of 14 km/l on each route compared to a hybrid vehicle with an average consumption of 8.5 km/l per route, for better fuel performance within the Metropolitan District of Quito, in heavy traffic conditions. This study conducts a comparison of the consumption between a hybrid vehicle and spark ignition vehicles through the real driving cycle on routes considered to be of greater influx, to determine which vehicle has lower consumption and, therefore, greater energy efficiency in Quito City.
1. Introduction
The transport sector makes a significant contribution to global social and economic development. The energy demand in the transport sector in 2019 (pre-pandemic level) was 86 million Btu [1]. Furthermore, 24% of the global CO2 emissions in 2019 were due to the transport sector [2]. From the years 2020 to 2022, due to the COVID-19 pandemic, energy consumption and emissions from the transport sector were lower than those presented in 2019, although the International Energy Agency (IEA) estimates that in 2024, they will have recovered the levels of 2019. However, following the Net Zero Scenario requires emissions from the transport sector to decline to less than 6 Gt by 2030 [3].
The commercialization of light vehicles, the increase in energy efficiency, and the use of low-carbon content fuels can contribute significantly to this objective.
Although conventional internal combustion vehicles (ICE) have been the primary means of transport, as these engines represent the main source of propulsion, several studies, such as the one by Verbelan F. et al. [4], show that hybrid vehicles reduce fuel consumption by an average of 4.75%. This improvement varies depending on the design of the automatic transmission and the driving cycle characteristics applied. However, the focus is not only limited to fuel economy but also to performance in heavy traffic conditions, such as in the city of Quito.
In Ecuador, the percentage of hybrid vehicle sales has increased over the years, but more than 90% of the vehicles sold are still powered by internal combustion engines with spark ignition or compression ignition. According to Li, J. et al. [5], conventional vehicles represent 70% of the use of oil for their use. Sinigaglia et al. [6] estimate that 99.8% of world transport uses ICEs, and 95% of the energy for transport comes from liquid fuels derived from petroleum.
Over the past two years, there has been a notable increase in the commercialization of hybrid vehicles in Latin America, a phenomenon driven by tax incentives and growing environmental awareness. Ecuador increased its sales in 2023, reaching a total of 11,541 units, and in 2024 has surpassed 9000 units thanks to affordable prices and tax exemptions [7]. In Colombia, a 46.5% growth in hybrid vehicle sales was observed during the first eight months of 2024, reaching 28,164 units marketed. Brazil, with the largest market in the region, reported the sale of 35,736 hybrids by August 2024, including plug-in and flex-fuel models. In Argentina, sales also experienced a remarkable increase, doubling in 2023 with 5939 units sold [8]. This increase is evidence of the favourable reaction to the incentives and the intention to decrease dependence on fossil fuels in the region.
The increasing demand for transportation has prompted research to improve energy efficiency, focusing on alternative fuels like compressed natural gas (CNG) [9], liquefied natural gas (LNG), and biofuels, which produce lower emissions than traditional fuels. Hybrid and electric vehicles (EVs) are gaining attention due to their fuel efficiency and low or zero emissions, though affordability remains a concern in Ecuadorian society [10]. However, the global sale of hybrid vehicles has increased significantly, now representing 10% of total car sales worldwide. These vehicles aim to reduce fuel consumption (FC) and emissions by improving the efficiency of the thermal engine [11]. In 2021, CO2 emissions from passenger cars were assessed at 95 g/km according to the New European Driving Cycle (NEDC), marking a 27% reduction compared to 2015 and a 50% reduction compared to 2010 [12]. Urban and road planning issues create traffic variability, making studies in real-world dense traffic conditions difficult. Despite this, hybrid electric vehicles have implemented control strategies to optimize fuel economy and improve internal combustion engine efficiency [13]. According to Wang et al. [14], fuel consumption and power demand were 1–11% and 26–44% higher in the worldwide harmonized light-duty vehicles test cycle (WLTC) compared to the NEDC, with road load and vehicle inertia being significant contributors to increased CO2 emissions and energy demand.
A study by Won et al. [15] shows that a gasoline compression ignition vehicle can reduce CO2 emissions by 7%, meeting Euro 6d emission standards. However, this technology is still under development, and preliminary results suggest that CO2 emissions could be like those of diesel engines. In addition, hybrid propulsion systems have been shown to reduce environmental impact. According to Cutrignell et al. [16], regenerative braking, which recovers energy during deceleration, can reduce fuel consumption by 20%, CO2 emissions by 22.3 kg, and store up to 23.25 kWh of energy in the energy storage system (ESS).
HEVs are divided into three configurations: series, parallel, and series–parallel. In the parallel configuration, the traction power and the torque are caused by the ICE [12]. Depending on the powertrain configuration [17], ICE efficiency commonly ranges from 14% to 38%, while electric motor (EM) efficiency can range from 75% to 90%. This higher EM efficiency compared to internal combustion engine (ICE) benefits vehicle efficiency and reduces emissions because there are more components in a car’s powertrain. However, a power management strategy is needed to decide how to connect power sources to meet the car’s power needs [18].
Hybrid vehicles are believed to be more fuel efficient and less polluting than conventional internal combustion engine vehicles. HEV performance specifications given by manufacturers often show significant advantages compared to conventional vehicles, for example, 34% less FC [19]. When it moves at a higher speed and when the acceleration is lower, the difference in FC between a conventional vehicle and a hybrid is 21.26%. A hybrid vehicle in a difficult city regime consumes 47.56% less fuel than a conventional vehicle [20].
According to Tansini et al. [21], in the future, hybrid electric vehicles (HEVs) will be an effective solution to CO2 emission regulations, as they do not require major changes in infrastructure or driving habits. Their charge maintenance (CM) system improves energy efficiency by balancing the battery over the long term. A study analyzing six HEVs with different configurations showed an accuracy of ±5% in predicting energy efficiency and CO2 emissions.
Vehicle energy flow analysis shows the overall efficiency and energy loss points. In hybrid vehicles, most of the fuel energy is lost in the exhaust gases due to the Atkinson cycle characteristics of the combustion engine, which is used at medium and high speeds to improve fuel efficiency [22]. In low-speed conditions, the electric motor takes over, eliminating the energy load in the exhaust gases. However, if the combustion engine operates under these conditions, an increase in fuel consumption is observed, as recent research has shown [23].
According to Wang et al. [24], HEVs achieve 40–45% fuel economy and gain an improvement in emissions compared to conventional vehicles in real-world driving. Typically, a non-connected hybrid electric vehicle (which combines an internal combustion engine with a battery pack) will reduce emissions by 25–30% [25].
In countries such as China, hybrid vehicles accounted for 7.9% of light vehicle sales from January to July 2022, a significant increase compared to 5.2% in 2021 [26]. Although China and Europe are the areas where the number of hybrid vehicles is growing the most, the change in trend toward this type of vehicle is observed all over the planet [2]. In some regions of Russia, such as Primorsky (a hot climate region), the percentage of hybrid cars has already reached 55% [27]. In other countries, such as Ecuador, the commercialization of hybrid vehicles in recent years has risen to 273% compared to previous years [1].
Eco-driving, as described by Orecchini et al. [28], is an effective method for reducing fuel consumption, achieving savings of 5% to 15% in the long term. This technique involves practices such as smooth starts, gentle acceleration (“e-start”), and avoiding unnecessary deceleration or rapid acceleration. Driving behavior, particularly aggressive driving, has a significant impact on fuel economy and the production of greenhouse gases and pollutants, highlighting the importance of adopting more efficient driving habits to reduce energy use and environmental impact [29,30].
Kumar A. et al. [31] conclude that an all-electric driving mode is ideal for cities with high congestion and moderate speeds, saving fuel and reducing emissions in urban environments where dense traffic is frequent. As a result, in a driving cycle in a hybrid electric vehicle, FC can be reduced by up to 12% in urban driving, in comparison with cities such as Medellin, Bogota, or the metropolitan district of Quito, which are chaotic in terms of traffic flow due to their intense traffic congestion, leading to a more meaningful study in these conditions.
A 2015 study in Bangkok [32] compared fuel consumption between a conventional vehicle and a hybrid, finding that the hybrid consumed less in urban, suburban, and highway traffic, with savings of 56%, 46%, and 26%, respectively. These tests, conducted in moderate traffic, showed that the hybrid’s electric motor is activated at low speeds, reducing fuel consumption and emissions. In addition, the hybrid vehicle can avoid certain driving restrictions for internal combustion cars in cities with environmental regulations. Another important aspect is the variable valve timing (VVT) system [33], which improves engine performance and reduces specific fuel consumption, optimizing both torque delivery and efficiency in part-load operation.
This study examines the fuel economy behavior of a hybrid vehicle in real-world dense traffic conditions. This research addresses an area little explored in the existing literature by documenting the variability of hybrid vehicle efficiency in a practical context. The research focuses on evaluating various operating parameters of both the hybrid section and, especially, the engine control system. This facilitates a better understanding of how particular driving factors affect efficiency and consumption in urban circumstances with high energy demand, which in turn contributes to improving the performance of hybrid vehicles in real traffic situations.
2. Materials and Methods
2.1. Materials
2.1.1. Vehicles
The internal combustion vehicles and the hybrid vehicle implemented in the study are some of Ecuador’s most common commercial vehicles in category M1, automobile and SUV type. It should be noted that each vehicle was in optimal operating condition according to the parameters specified by the corresponding manufacturers. The technical characteristics of each vehicle are detailed in Table 1.

Table 1.
Specifications of the vehicles according to the manufacturer and travel values.
2.1.2. OBDII Interface
The OBD Link MX+ (Figure 1) is a Bluetooth OBD adapter that can turn a cell phone or tablet into a diagnostic scan tool, trip computer, and real-time performance monitor. This interface is compatible with all legislated OBD-II protocols, including Ford and General Motors advanced vehicle networks (MS-CAN AND SW-CAN) [34].
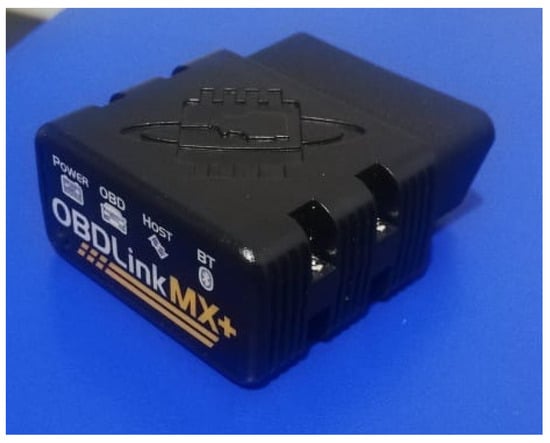
Figure 1.
OBD Link MX+ interface.
2.1.3. Routes
Driving cycles refer to speed profiles plotted on a speed/time map, where the way of driving is represented, whether in the city or on the highway, considering the vehicle’s characteristics, traffic conditions, weather conditions, and driver characteristics.
The routes were selected to have the most influx at peak hours used by citizens to move day by day [35]. According to Jaiswal A. et al. [36], the main causes are inefficiency in public transport, service performance, satisfaction, and quality, thus leaving a greater need to move in one’s private vehicle. On these roads, the laws inform that the speed allowed in urban areas is 50 km/h, according to [37].
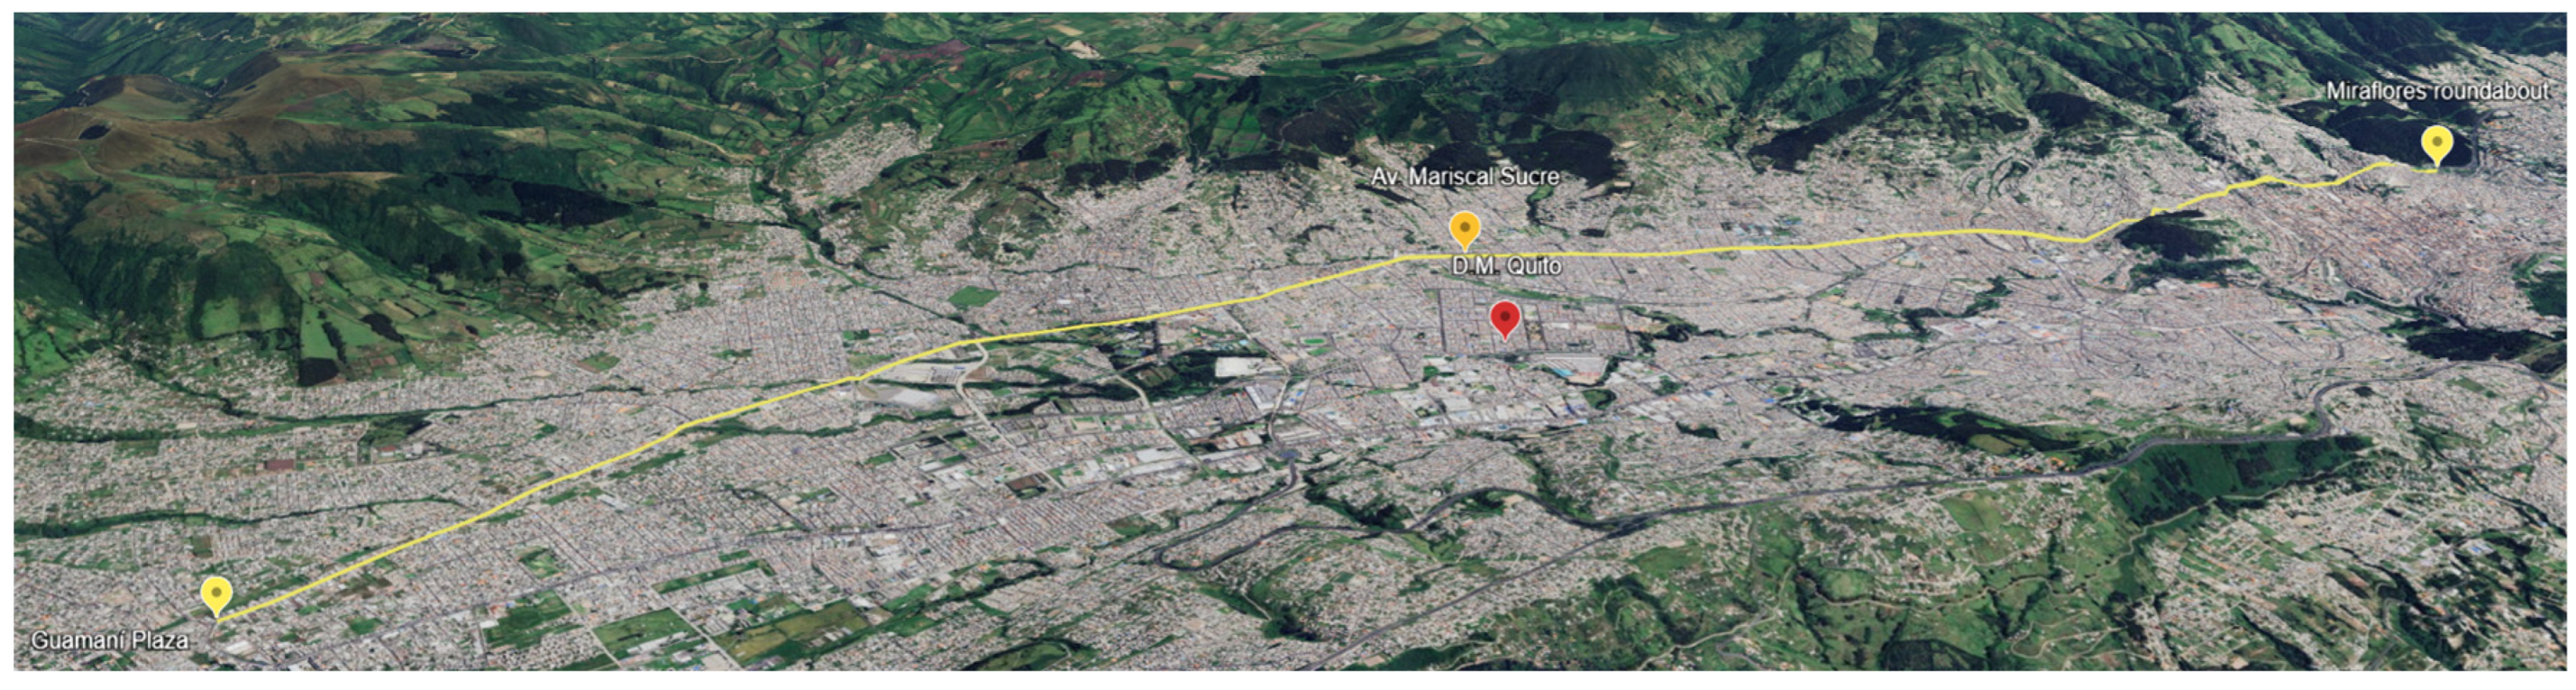
The first route (named Route 1) selected is Av. Mariscal Sucre, which took the section from the south of Quito in UPC Guamaní to the center-north in the Miraflores sector with a 32 km distance, shown in Figure 2.

Figure 2.
Distance route Av. Mariscal Sucre.
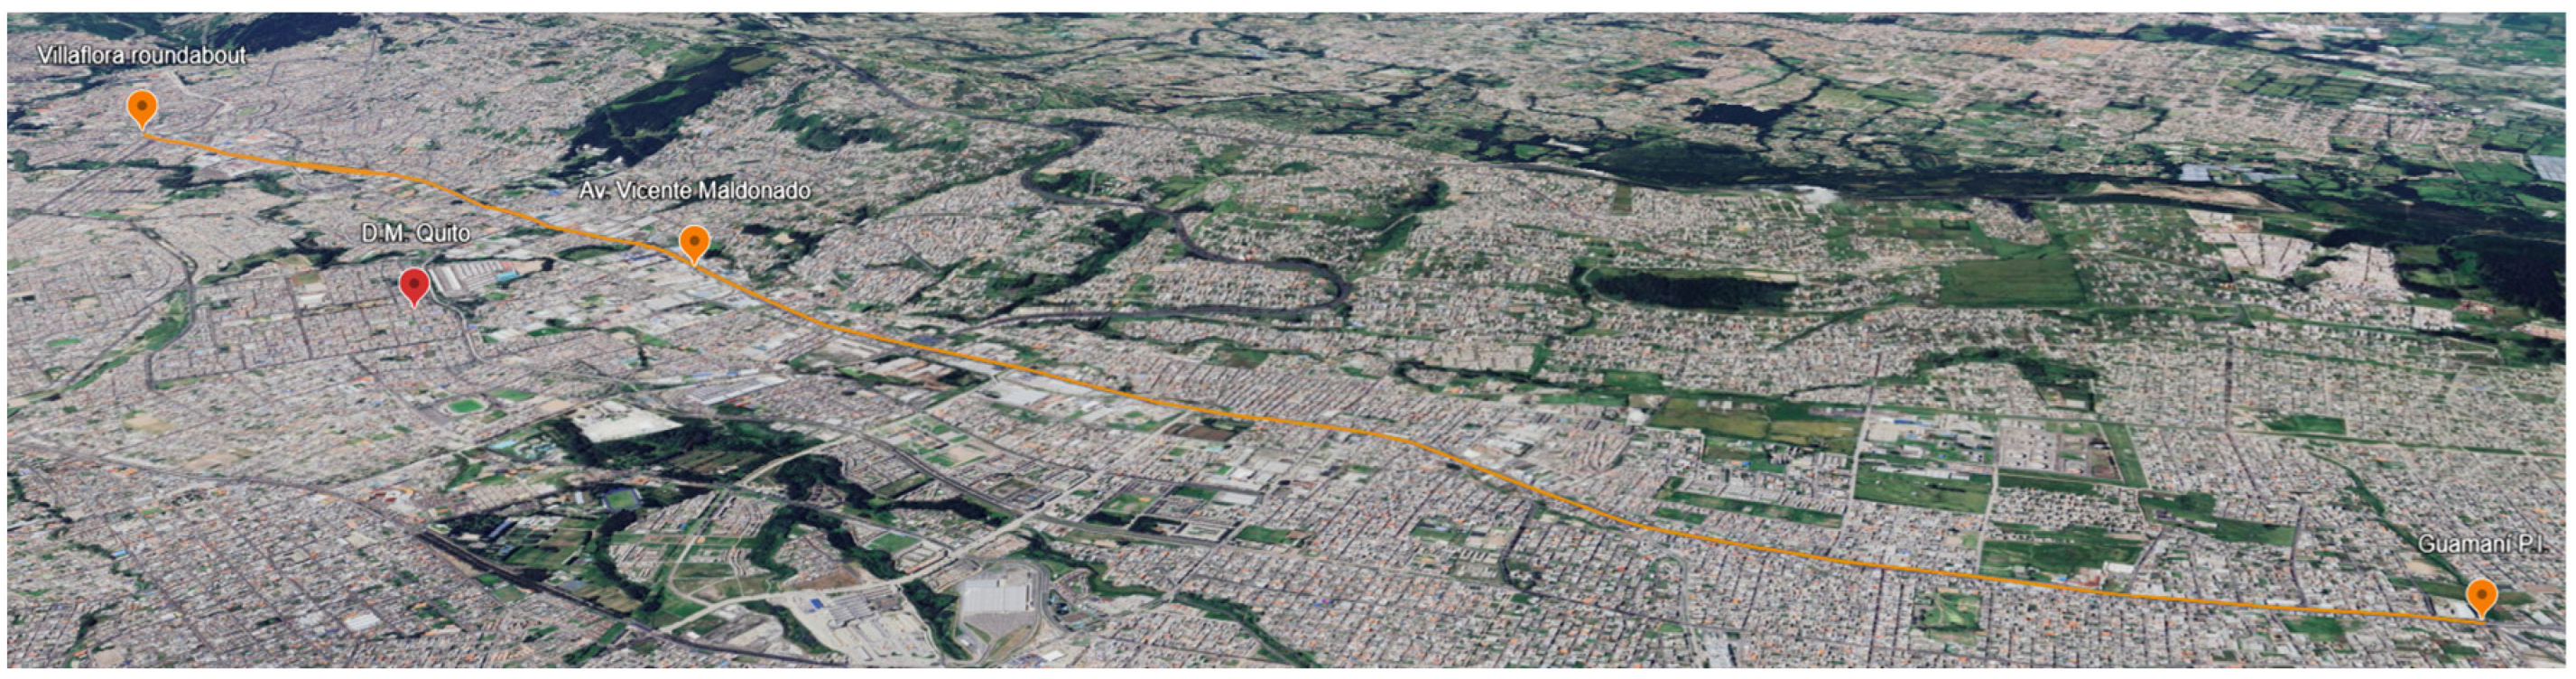
The second route (named Route 2) is Av. Maldonado in the section from the industrial zone located at the height of Guamaní to the Villaflora sector with 24 km, as shown in Figure 3.
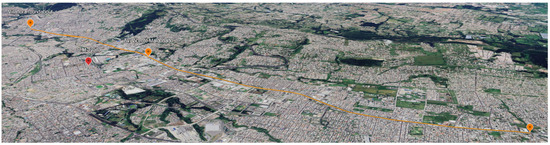
Figure 3.
Distance route Av. Maldonado.
These route tests are characterized by roads that present a greater vehicular influx at peak hours from the south to the north center of the city [38].
Table 2 shows the geographic characteristics of behavior during data collection for each route.
Table 2.
Geographical features of the route.
Routes 1 and 2 are the main arteries of the Metropolitan District of Quito. These sectors cross a high population density area distributed in residential, commercial, and institutional areas. The high flow of traffic and the increase in the number of vehicles means that it is considered one of the most congested roads in the city’s road network.
The Metropolitan District of Quito is in the Andean Mountain range. This avenue within the city of Quito is at an elevation of 2852 m and has an average temperature of 14.78° Celsius. Following a circuit composed of two types of city traffic, frequent stops and urban speed (50 km/h), the first driving circuit selected on Route 1 has a total length of 32 km, as mentioned above. The measurements corresponding to urban driving were carried out only on the section that connects to Route 1, whose longitude is −78.55877383 and latitude is −0.20527. In total, 3 tests were carried out on the driving circuit with an average time of 64 min per lap.
Route 2 follows the same circuit composed of two types of city traffic: frequent stops and urban speed (50 km/h). The selected driving circuit has a total length of 24 km, as mentioned above. The measurements corresponding to driving on urban roads were carried out only in the section that connects to Route 2, whose longitude is −78.54859 and latitude is −0.24468. Likewise, 3 tests were carried out on the driving circuit, using an average time of 55 min for each lap.
2.1.4. Software
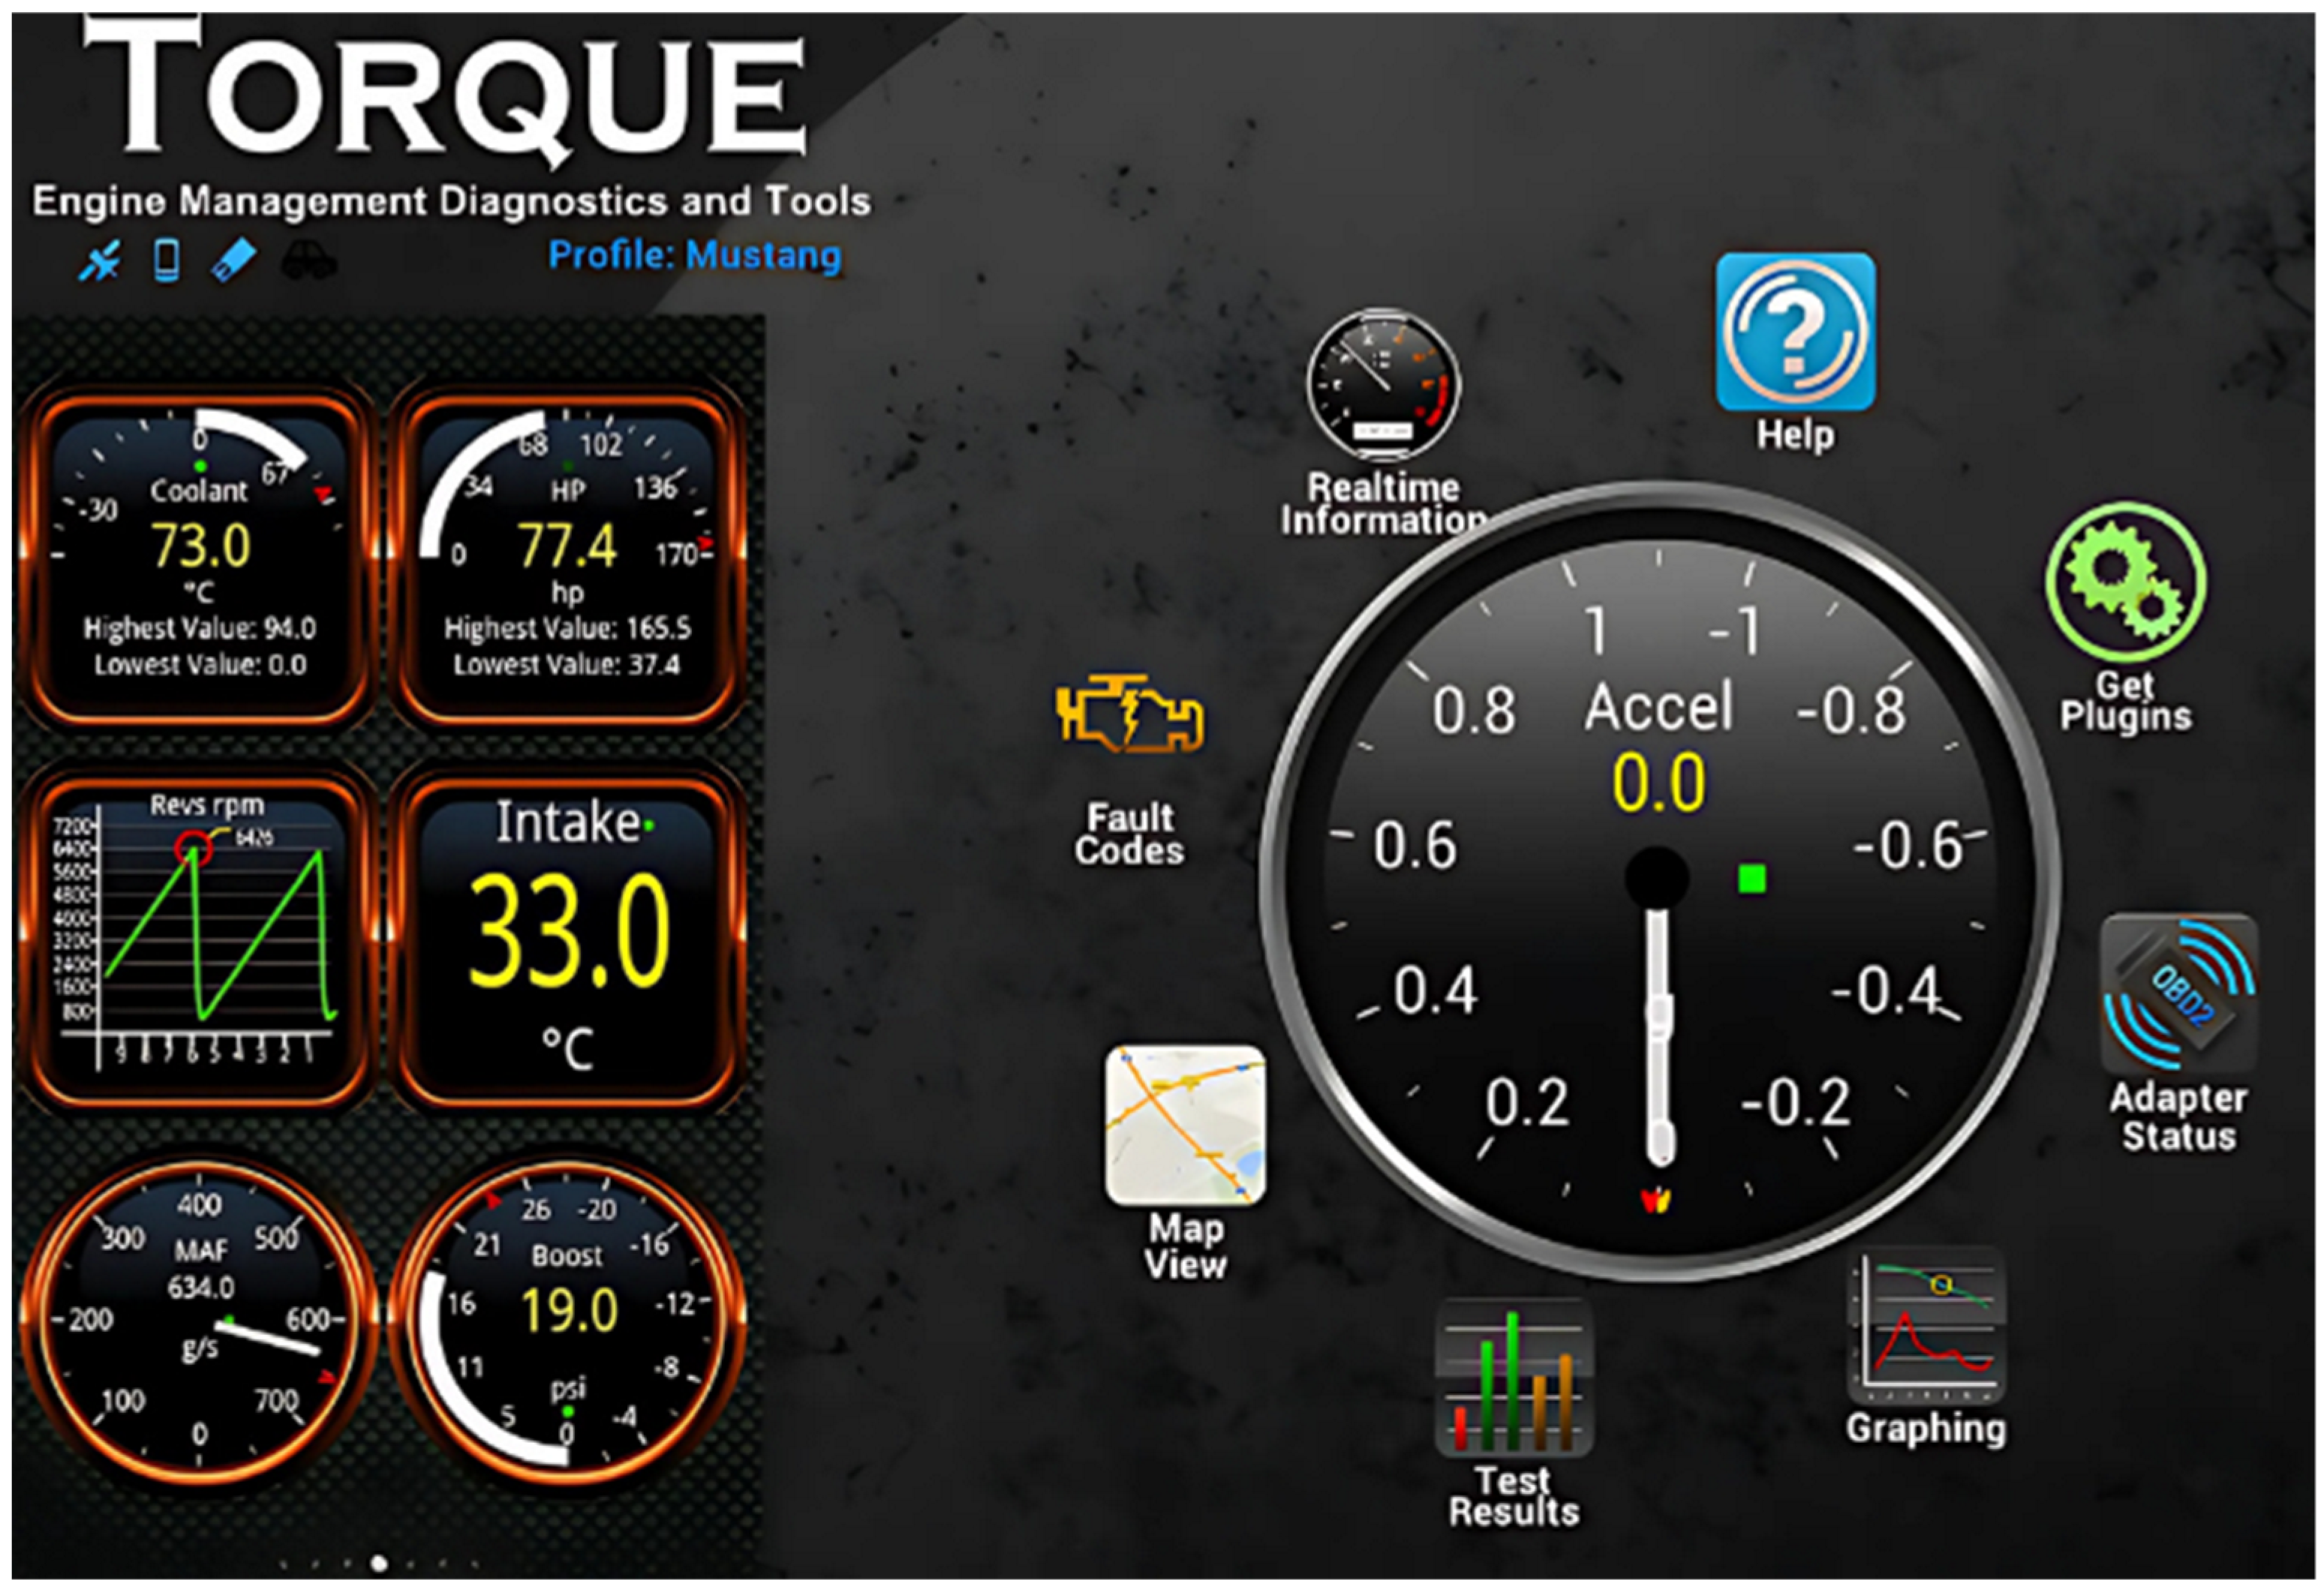
Torque Pro software version 1.6.8 (Figure 4) is compatible with the OBD Link MX+ device, which obtains the operating data of each vehicle used in this study. The reading parameters of the communication interface allow for acquiring measurement data of the injection system, actual engine RPM, speed, acceleration, engine power, engine torque, vehicle emission reading, transmission temperature, engine load, O2, torque, manifold absolute pressure (MAP), airflow rate, turbo boost and vacuum gauge, volumetric efficiency, exhaust gas recirculation (EGR), etc. These data can be saved thanks to the ability to record data at user-defined time intervals [39].
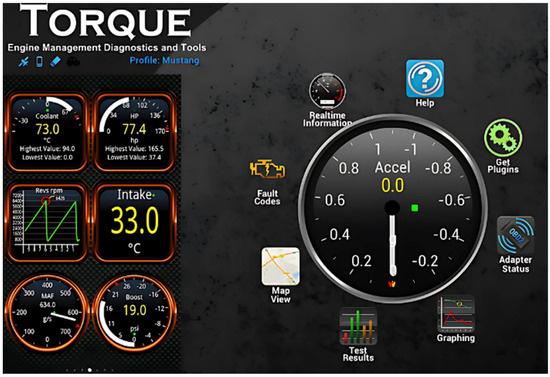
Figure 4.
Torque Pro software.
2.1.5. Fuel
In each vehicle, Extra 85 octane gasoline is used. Table 3 shows the physicochemical properties of the fuel under test [40].
Table 3.
Physical and chemical properties.
2.2. Methodology
During the road tests conducted on each vehicle, the fuel economy (FE) will allow us to determine the cost of the trip required for each vehicle and to select which vehicle will be the best option for use in traffic within the Metropolitan District of Quito. City driving and city driving data with heavy traffic were used, and cases with non-traffic driving conditions were excluded. Each vehicle used in the study must be in optimal conditions since if it presents anomalies, the data will be affected, and the study will be affected in its results.
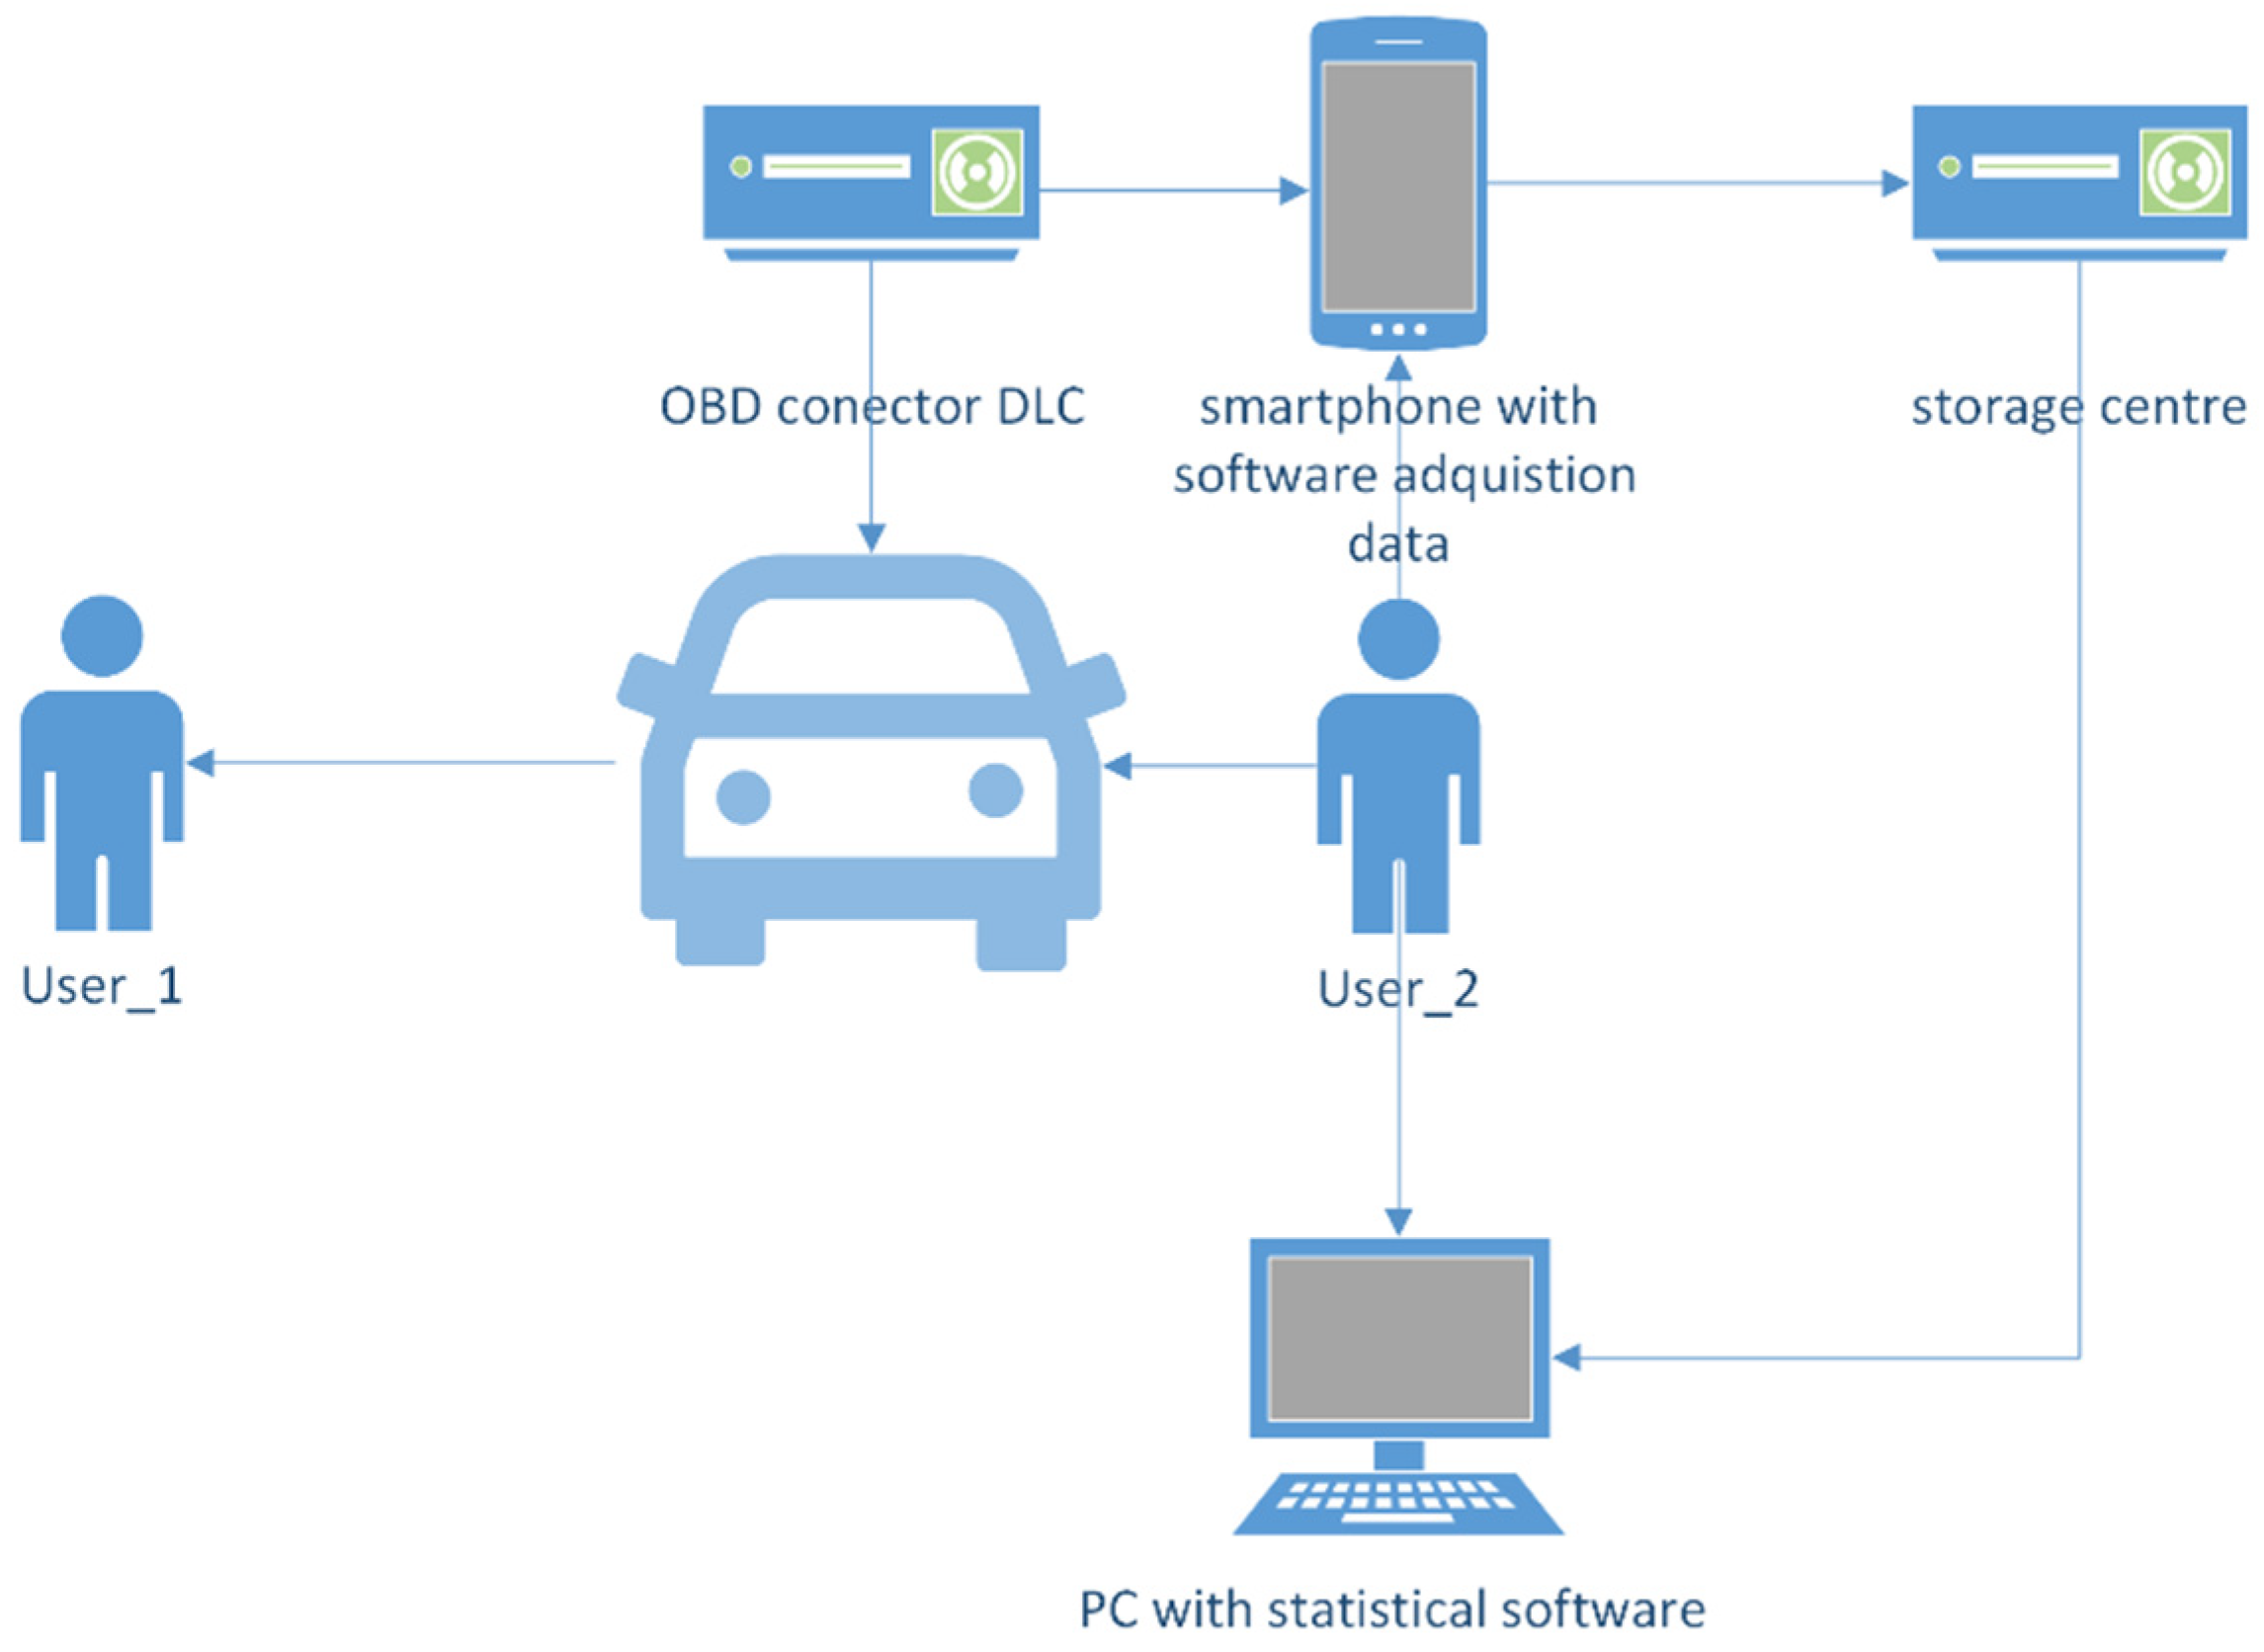
The vehicle parameters, emissions, and FC were obtained in the road tests carried out, which were performed with 85 octane fuel and in future work such as that of Rojas V. et al. [35,41], performing fuel blends. The following diagram (Figure 5) shows schematically the experimental setup, the measurement process, and the data acquisition used in the experimental test.
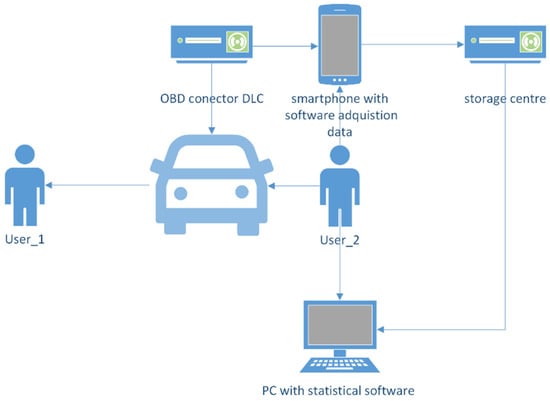
Figure 5.
Scheme for experimental installation and acquisition of data.
According to each designated route, each vehicle receives real-time data through the communication interface, which records everything in a range of 0.1 s in the software and then proceeds to send the generated file in CSV format and perform data processing and analysis.
The NEDC-like driving cycle was applied, which tries to combine the urban driving cycle (UDC) and the extra-urban driving cycle (EUDC) [42,43], but in heavy traffic conditions, so it is a real driving cycle in extreme traffic and altitude conditions. A single driver was used in the study to maintain on-road driving conditions. Petrol 85 was used, as it is the most used petrol in the test region, apart from diesel. According to [44], in 2024, it cost USD 2.679.
The relevant parameters for the study are displacement, RPM, O2, engine load, FC, and intake manifold pressure. These parameters can be obtained directly or through an automotive scanner; the displacement or rpm parameters were obtained from the manufacturer’s manual. At the same time, the parameters of O2, engine load, consumption, and intake manifold pressure were obtained with the help of an automotive scanner.
2.3. Model Validation
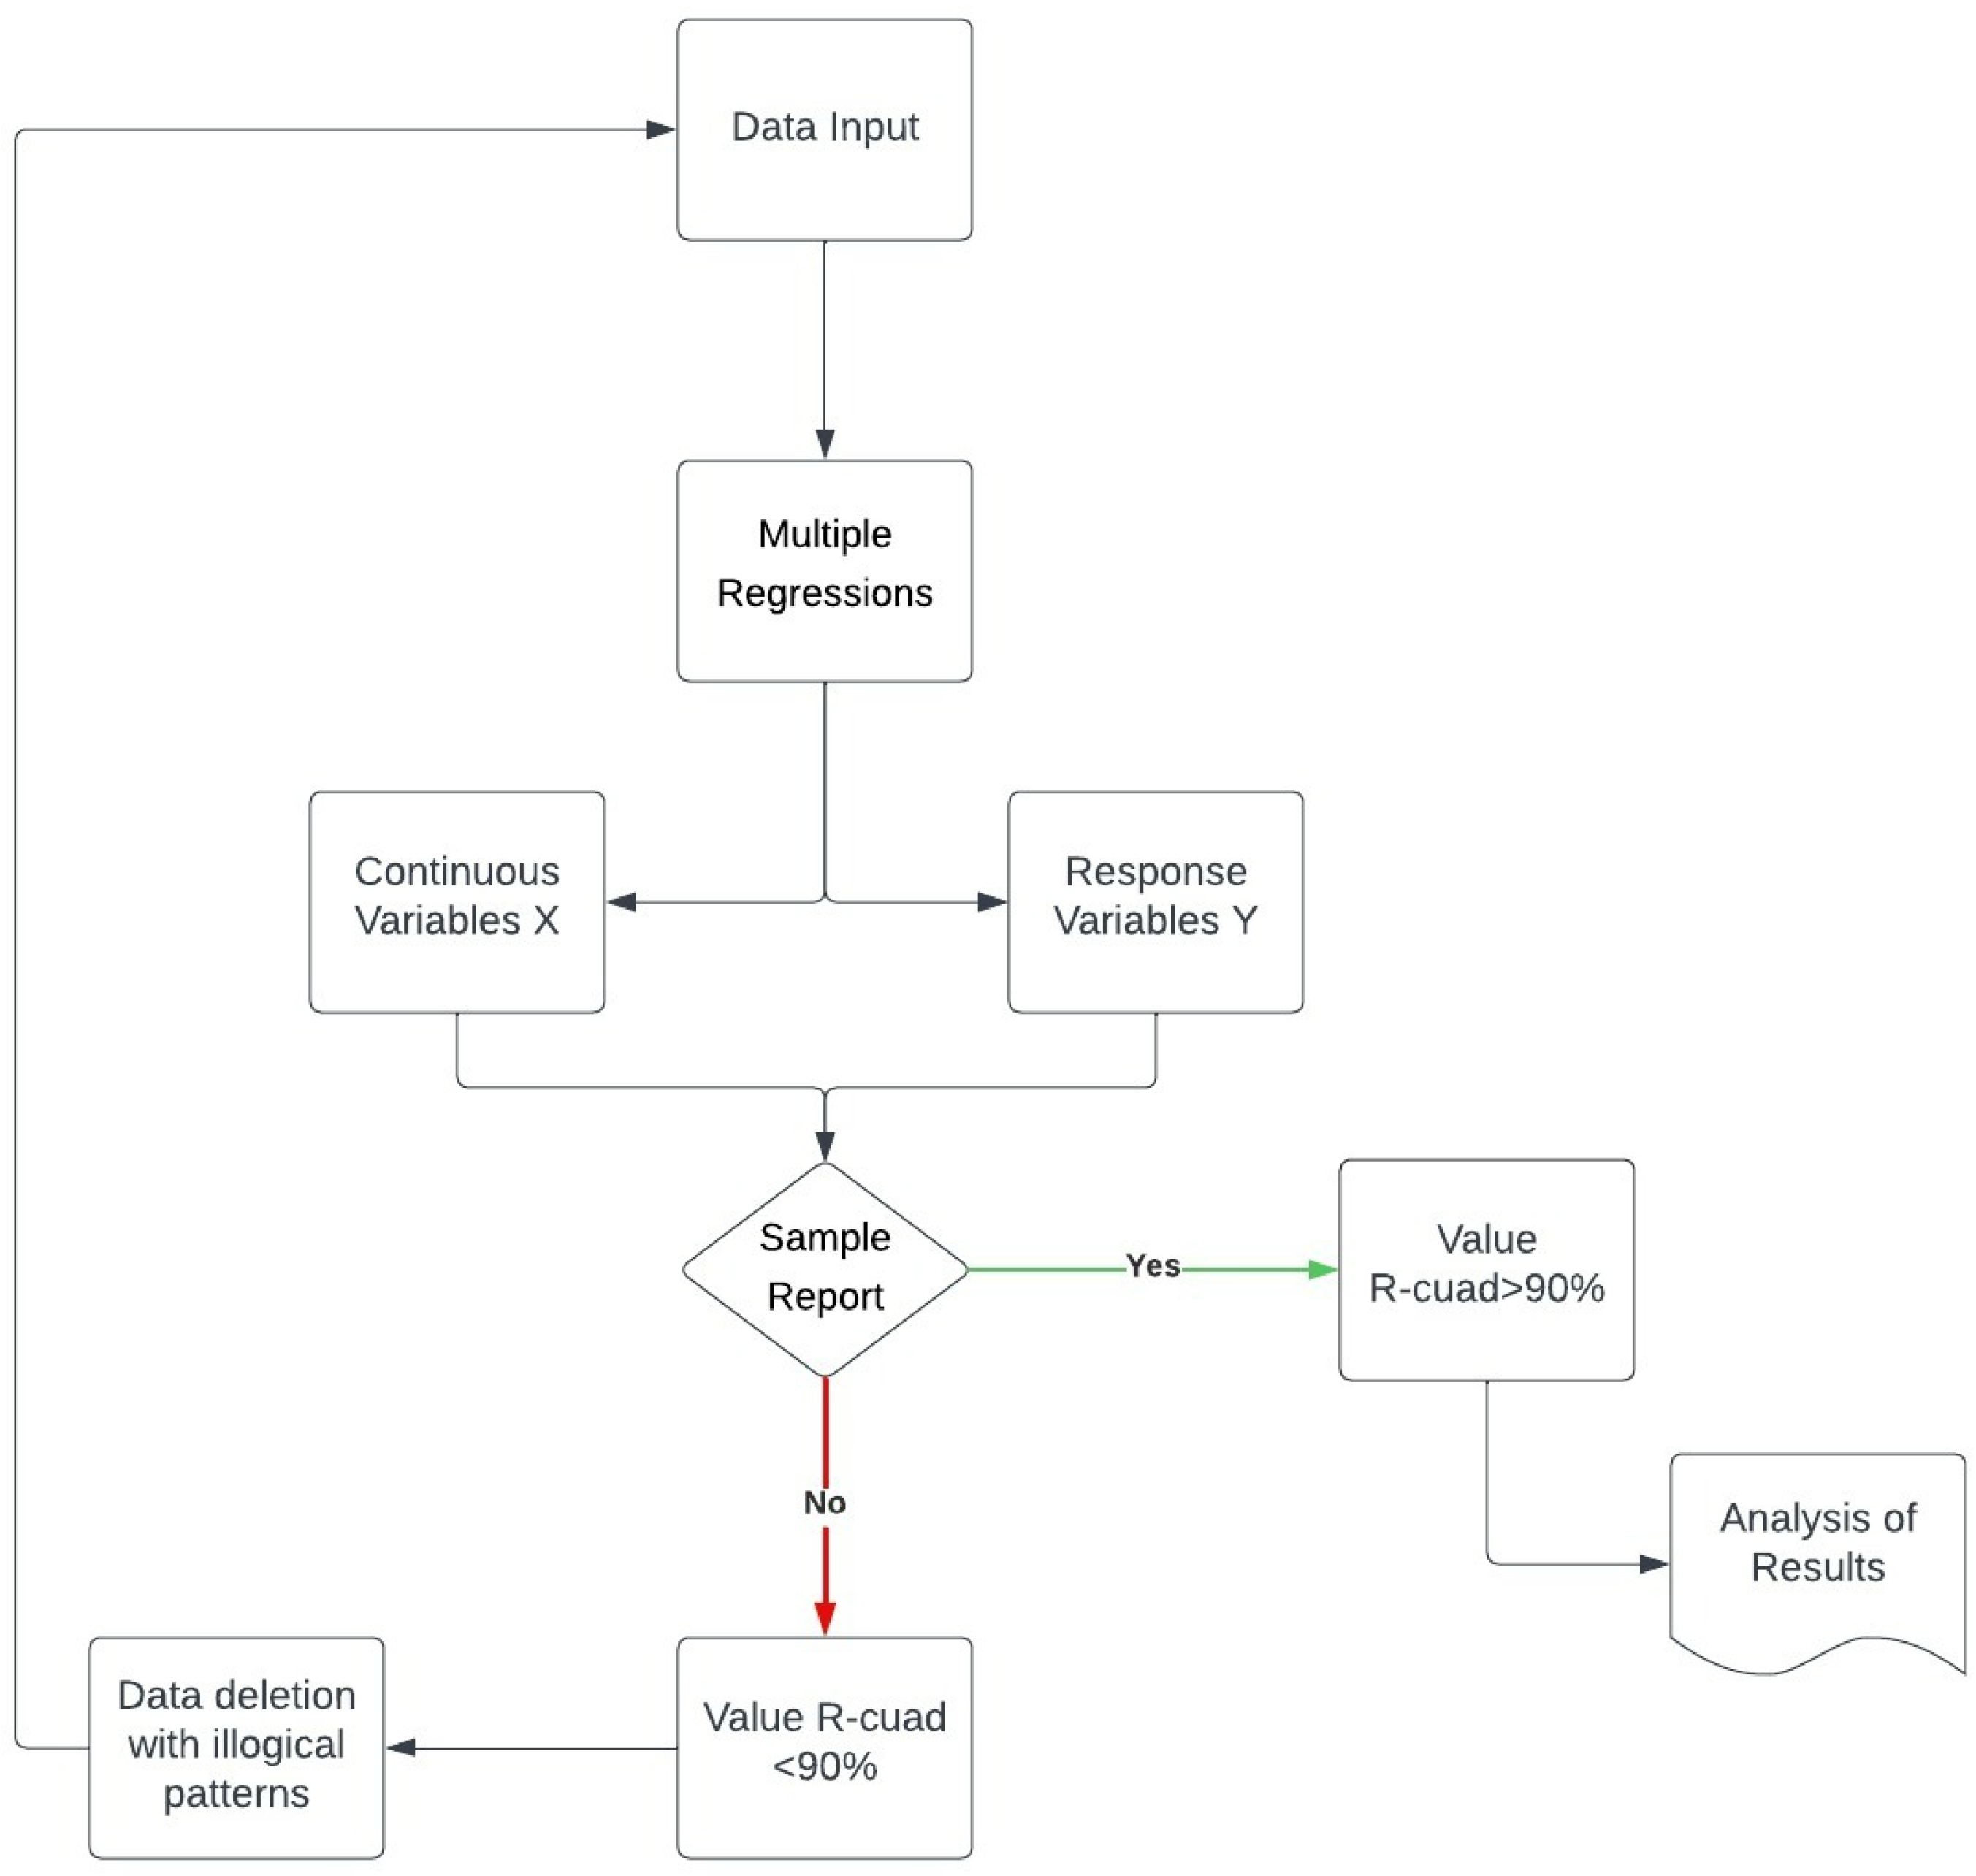
Figure 6 shows the validation diagram of the model applied in this study, for which Minitab (version 21.1.0) Software is used, in which the discretization of the data obtained in real-time through the OBD-II acquisition card is generated. The data are filtered and analyzed until a variance greater than 90% is obtained using a discrete cycle until results of prediction approximation are obtained.
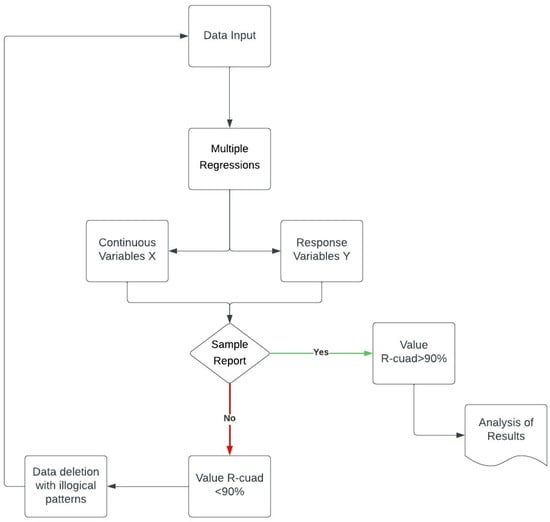
Figure 6.
Model Validation.
2.4. Uncertainty Analysis
The CAN network in vehicles typically operates with data flow rates ranging from 125 kbps to 1 Mbps, depending on the implementation and the communication requirement of the system. A rate of 500 kbps is common in control applications, whereas in diagnostic systems, a rate of 125 kbps is typical. The CAN FD (flexible rate) protocol makes it possible to increase the speed to a limit close to 5 Mbps for applications that demand faster data transmission, such as software updates or data from advanced sensors [45]. Regarding the uncertainty factor in measurements, the CAN network incorporates various error detection and correction mechanisms to increase accuracy, such as the application of cyclic redundancy check (CRC) and the inclusion of bits to prevent synchronization errors [46]. This system ensures communication reliability by reducing uncertainty in situations with electromagnetic interference or noise.
Data transfer via Bluetooth involves a level of uncertainty associated mainly with the transmission environment and the error correction systems applied. In optimal situations, the Bluetooth standard implements the cyclic redundancy check (CRC) and the frequency hopping technique to increase reliability by minimizing interference [47]. However, the transfer of information via Bluetooth can suffer from interference caused by the presence of other devices operating on the same 2.4 GHz frequency, but in this case, we can analyze that the working speed of a combustion engine is in the kHz range. Bluetooth Classic has an average transfer rate of 1 Mbps; in contrast, Bluetooth Low Energy (BLE) can reach speeds of up to 24 Mbps [48]. Despite the capabilities, the technology experiences transmission uncertainty due to data collisions. The use of frequency hopping helps to minimize errors, although it does not eliminate errors in complex or high-interference contexts.
3. Results
3.1. Proposed Model
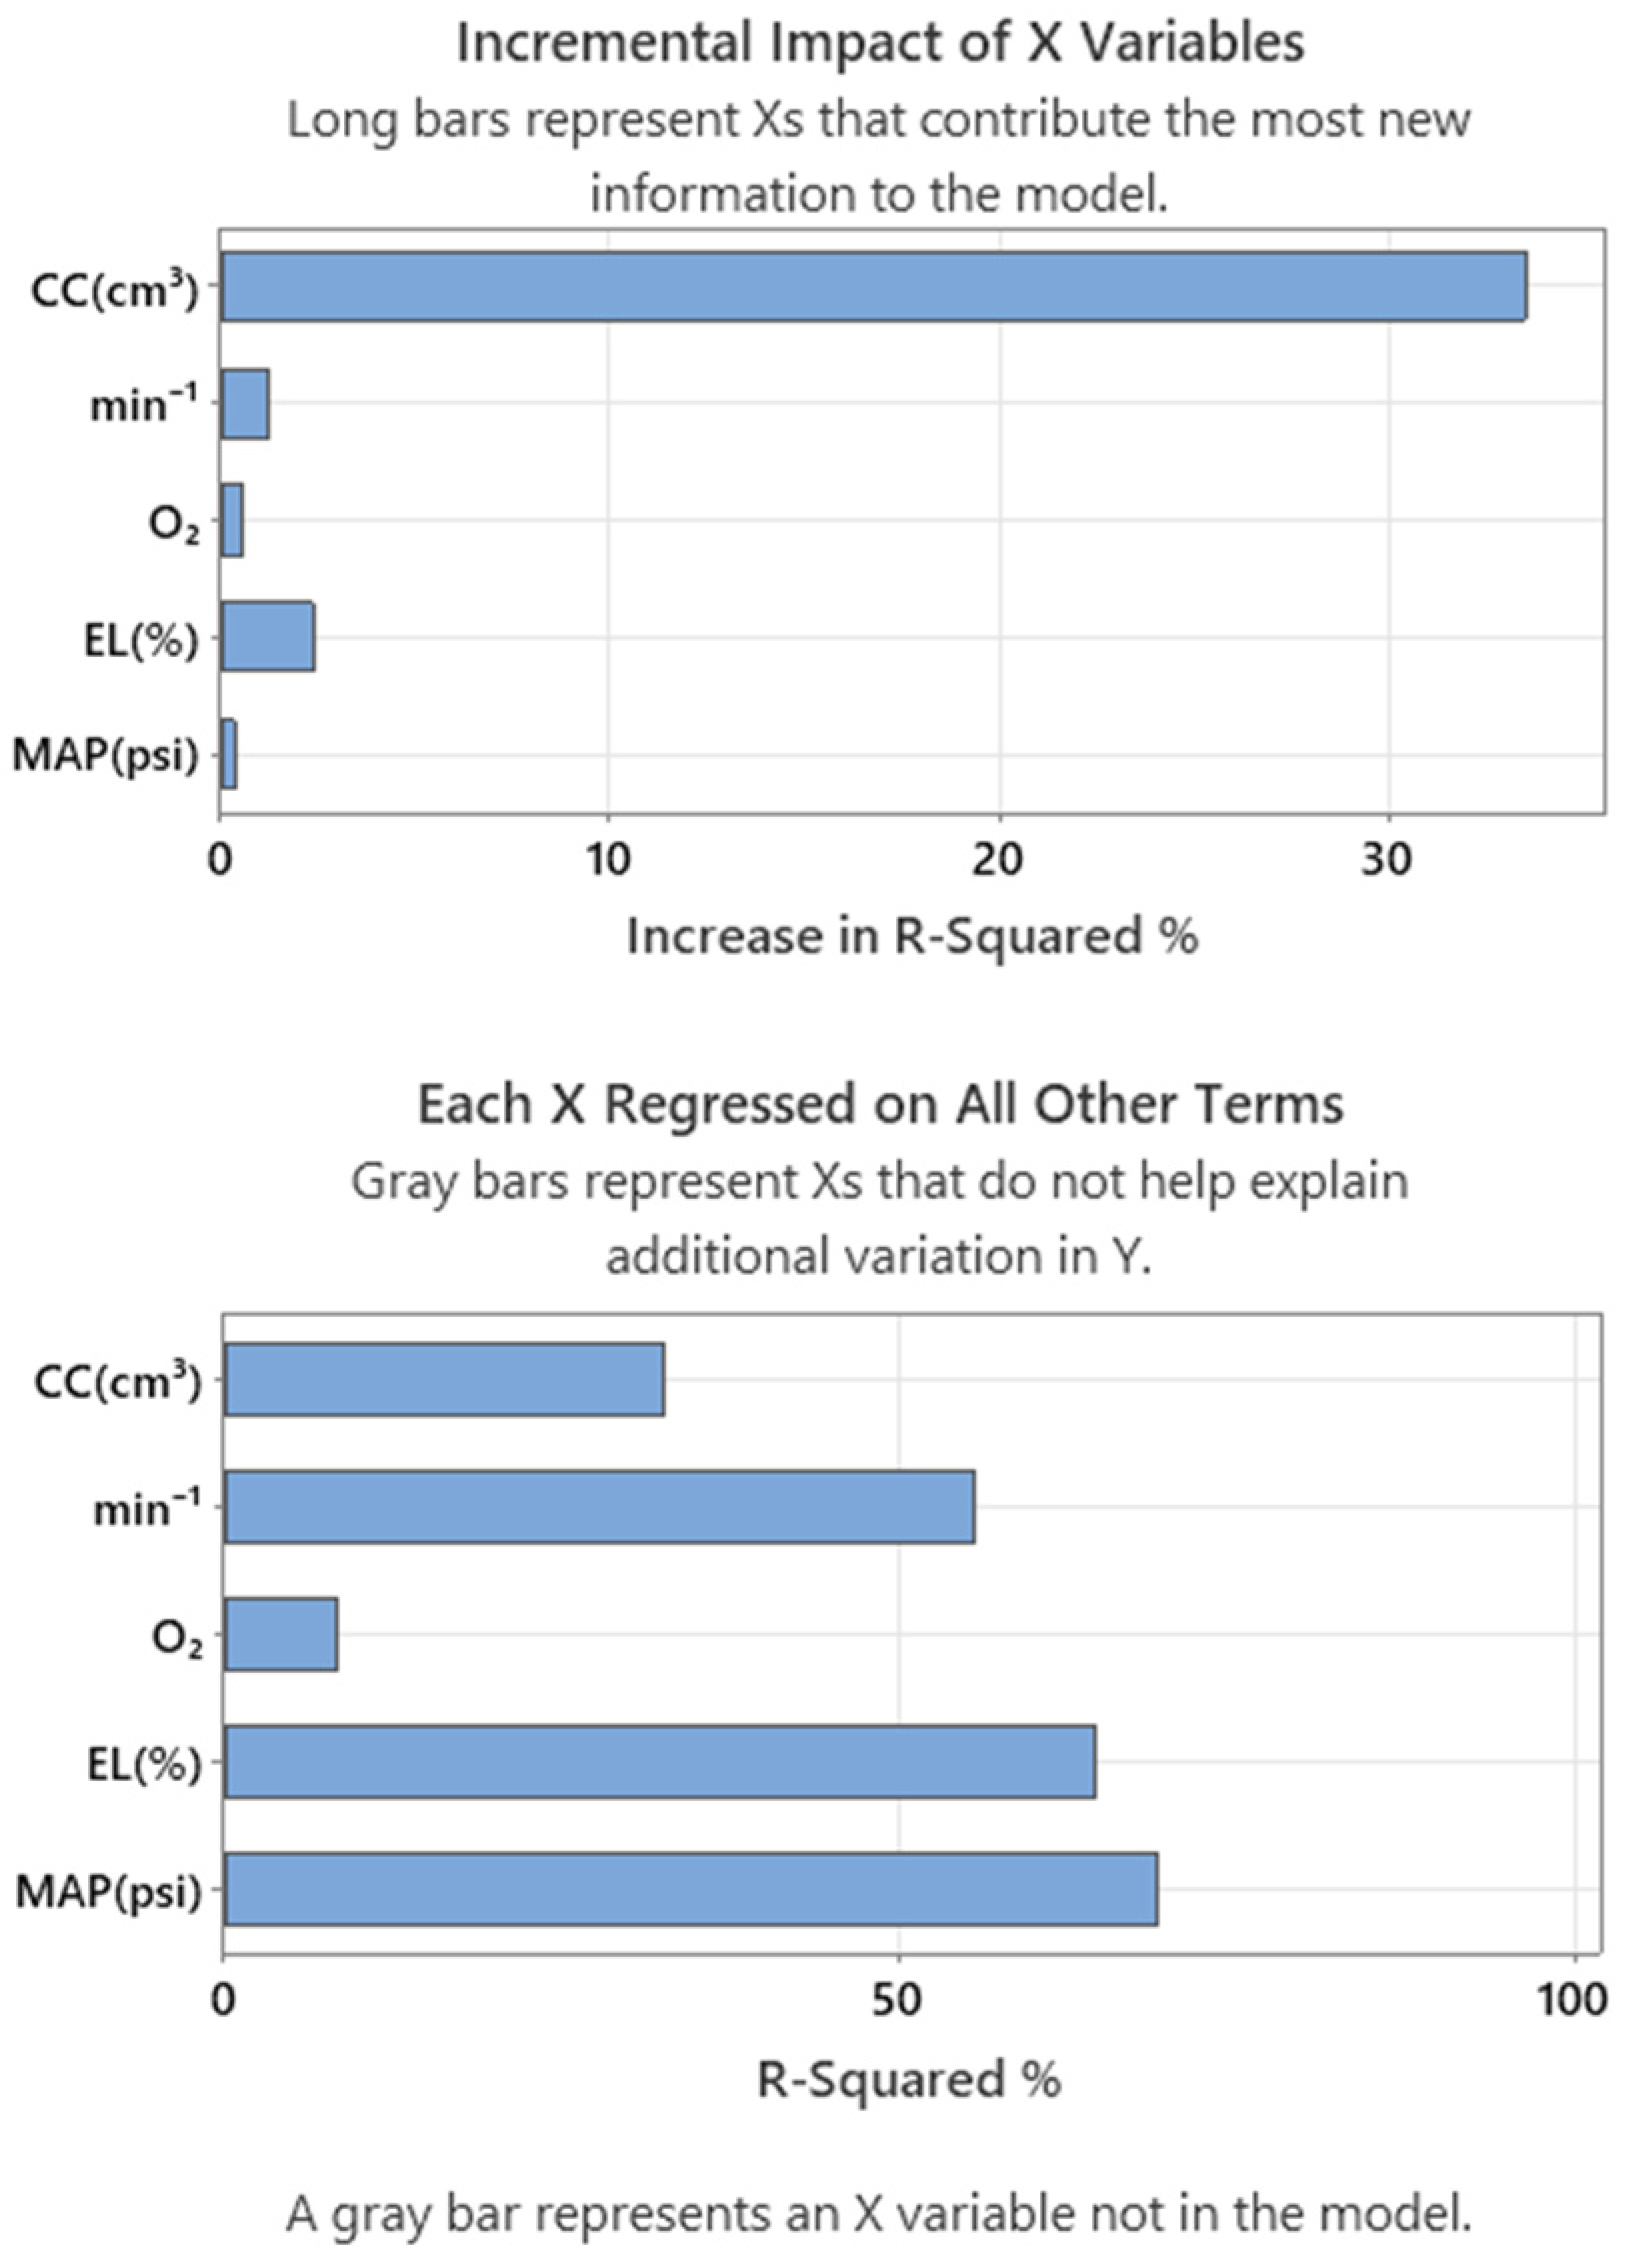
The proposed model is based on the fuel consumption (FC) performance of real driving of conventional vehicles and hybrid vehicles. The variables generated from the study are engine load, O2 signal, trip speed, trip distance, fuel consumption, CO2, map, engine speed, atmospheric pressure, forces Gx, Gy, and Gz, instantaneous consumption, engine power, torque, throttle position of acceleration, air temperature, volumetric efficiency, fuel cost, and cylinder. Of these, the most significant variables were found through variable relevance statistics through ANOVA. The variables for the calculation of FC were related based on cylinder capacity(cc), intake manifold pressure (MAP), O2 volt bank 1 Sensor 2 (O2), engine load (EL), and engine speed (min−1) of different vehicles used, whose units and abbreviations to work are expressed in Table 4. This is because when performing the analysis of the data flow of the CAN network of the vehicles, these were the most relevant change values according to the route cycles traced, as indicated in Figure 7.
Table 4.
Variables of X in the equation of the model.
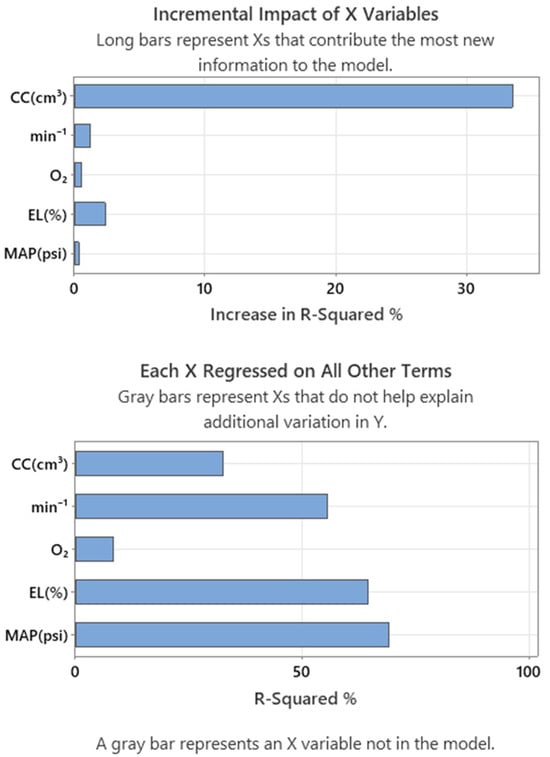
Figure 7.
Most relevant variables.
These parameters and variables are useful to understand the environment in which the vehicle is driven during recorded tests. It has been observed that for very low speeds when the vehicle is in a congested traffic environment, autonomy is maintained between 0 km/h and 50 km/h within the Quito Metropolitan District.
The adjusted Equation (1) models the relationship between kilometers per litter and the relevant variables. These variables are detailed in Table 4, which provides information about each one of them. These terms and variables are critical to understanding and predicting fuel efficiency based on the specific conditions in which the vehicle is located.
Considering these parameters and variables in the fitted equation, it is possible to obtain a more precise estimate of fuel consumption efficiency in the context of recorded tests. This helps to better understand how different factors, such as speed and traffic conditions, influence vehicle performance in terms of fuel consumption.
These findings and the adjusted equation provide a solid basis for analysis and decision-making related to energy efficiency and fuel consumption in the specific environment of the Quito Metropolitan District.
It is considered that if the model adequately adjusts to the data obtained in each test, this equation can be used to predict consumption for specific values of the X variables.
3.2. Model Consumption Interaction Plots
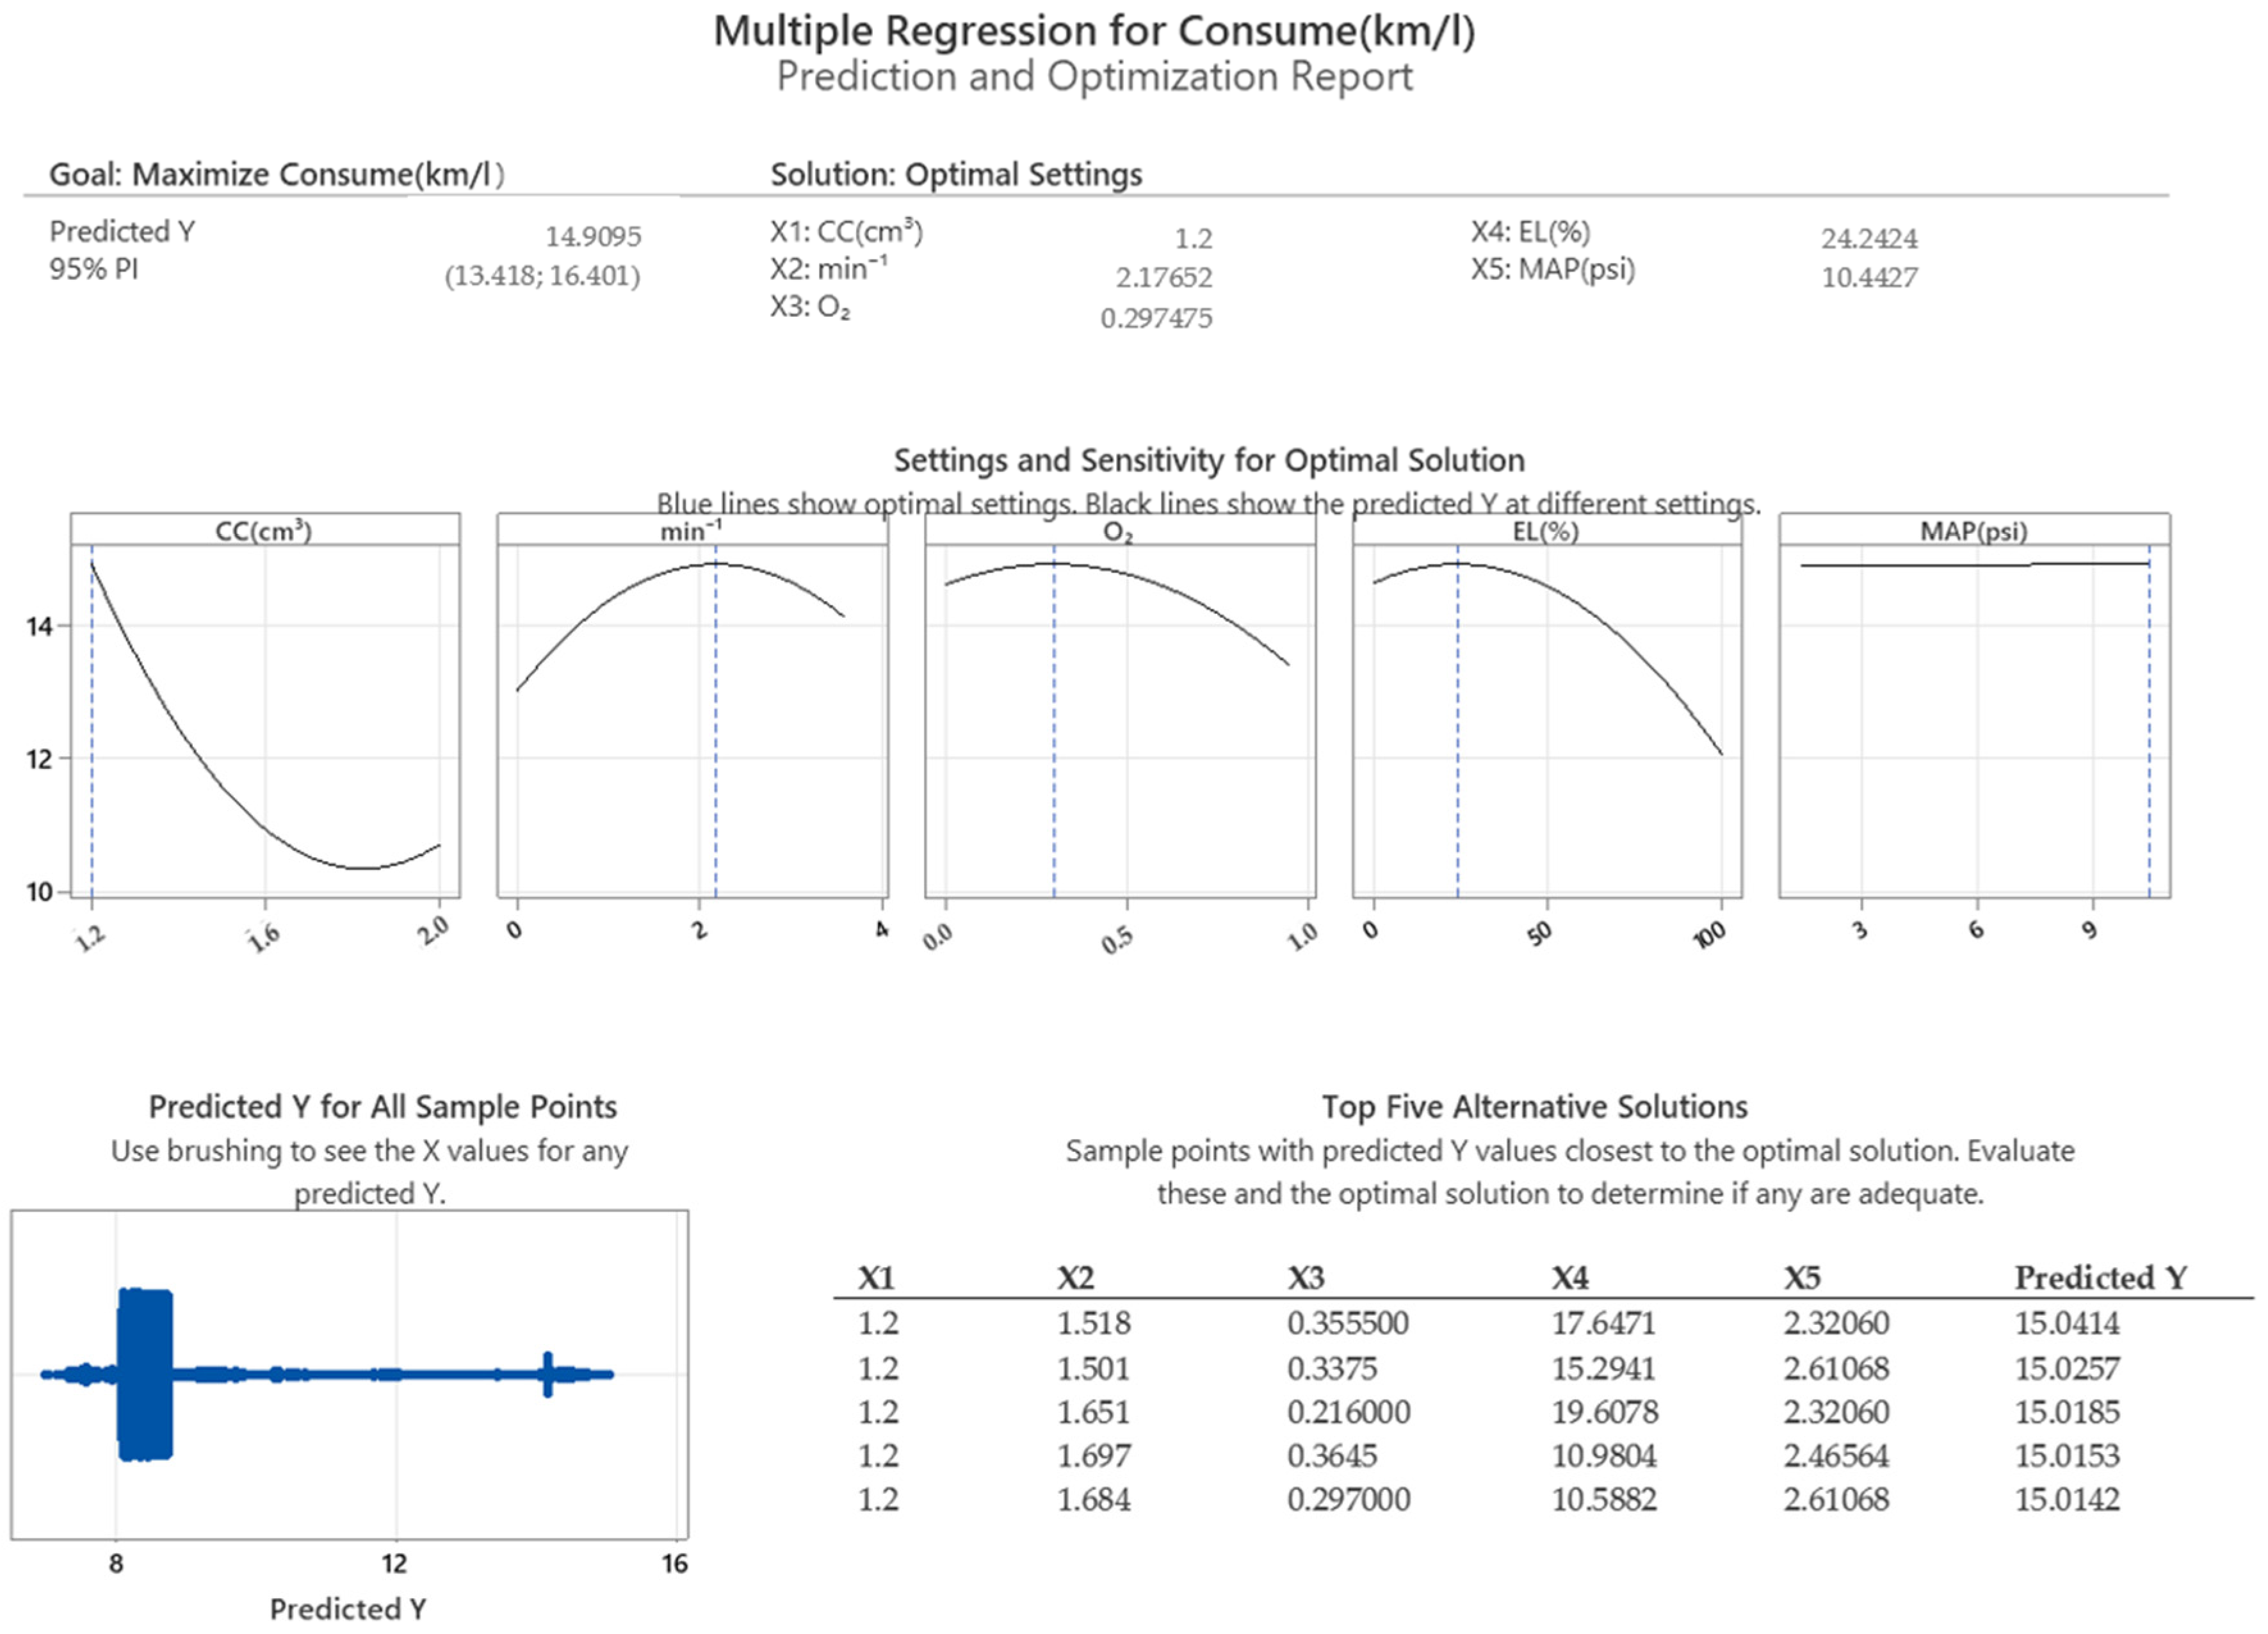
After performing the regression within the model proposed in Figure 8, an analysis of the five variables implemented in the model was carried out. It was found that the displacement variable stood out for contributing significantly to the adjustment of the model to the data recorded in each test. However, it was observed that the variable that best fitted the model was the intake manifold pressure variable, generating a model acceptability level of 98.10%.
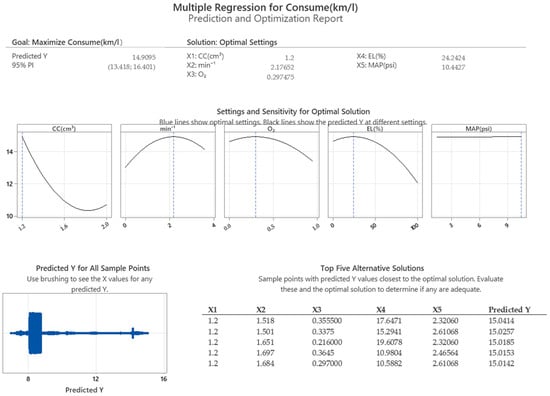
Figure 8.
Graph of consumption interaction of the model.
On the other hand, it was identified that one of the variables with the least impact in the model was the variable 1 Sensor 2 of the O2 volt bank within the FC variable. This suggests that this variable has a limited influence on the model’s accuracy and predictive ability in terms of fuel consumption.
These results highlight the importance of selecting the appropriate variables in a regression model to obtain an optimal fit for the data. In addition, the relevance of the variable displacement and intake manifold pressure in the prediction of fuel consumption is highlighted, while it is recognized that variable 1 Sensor 2 of the O2 volt bank has a minor impact on the model. These findings may be useful to refine and improve the model in future studies and analyses.
3.3. Average Consumption of Each Vehicle
After collecting all the data recorded using the onboard diagnostic system (OBD-2) on both routes, the average fuel consumption required to complete one lap on each of the specified routes was calculated. The results of these calculations are shown in Table 5.
Table 5.
Average fuel consumption.
The table shows the estimated average consumption for each vehicle in terms of the fuel needed to complete one lap on the established routes. These data are very relevant to understanding and comparing each vehicle’s performance on the specified routes.
The information in Table 5 provides an overview of the average consumption required by each vehicle to cover one lap on the established routes fully. These average values allow the efficiency of each vehicle to be evaluated and compared in terms of fuel consumption under the test conditions and can serve as a basis for making informed decisions related to the selection of vehicles based on their energy efficiency.
Table 5 shows the average fuel consumption (FC) data obtained through the measurements made with the onboard diagnostic system (OBD) [49], along with the FC values obtained through the model developed in Section 3.1. In addition, the last column shows the difference between both values, denoting a higher consumption parameter in the larger displacement vehicle regardless of the route, which is understood by the characteristics, especially of fuel and vehicle size (type M1 SUV style) [50], generating higher consumption by consecutive starts and stops on routes with more slow traffic, which is why the last column shows the difference between the two values.
The table allows a direct comparison of measured results with values predicted by the model. This difference between the measured and predicted values provides a measure of the model’s accuracy in estimating fuel consumption. A negative value indicates that the model predicts fuel consumption that is lower than the measured value, while a positive value indicates that the model predicts higher fuel consumption.
These data are of great importance for evaluating the ability of the model developed in Section 3.1 to accurately predict fuel consumption under test conditions. Furthermore, the information provided in the table allows us to identify deviations between the measured and predicted values, which could lead to improvements in the model or in the accuracy of the OBD II measurements.
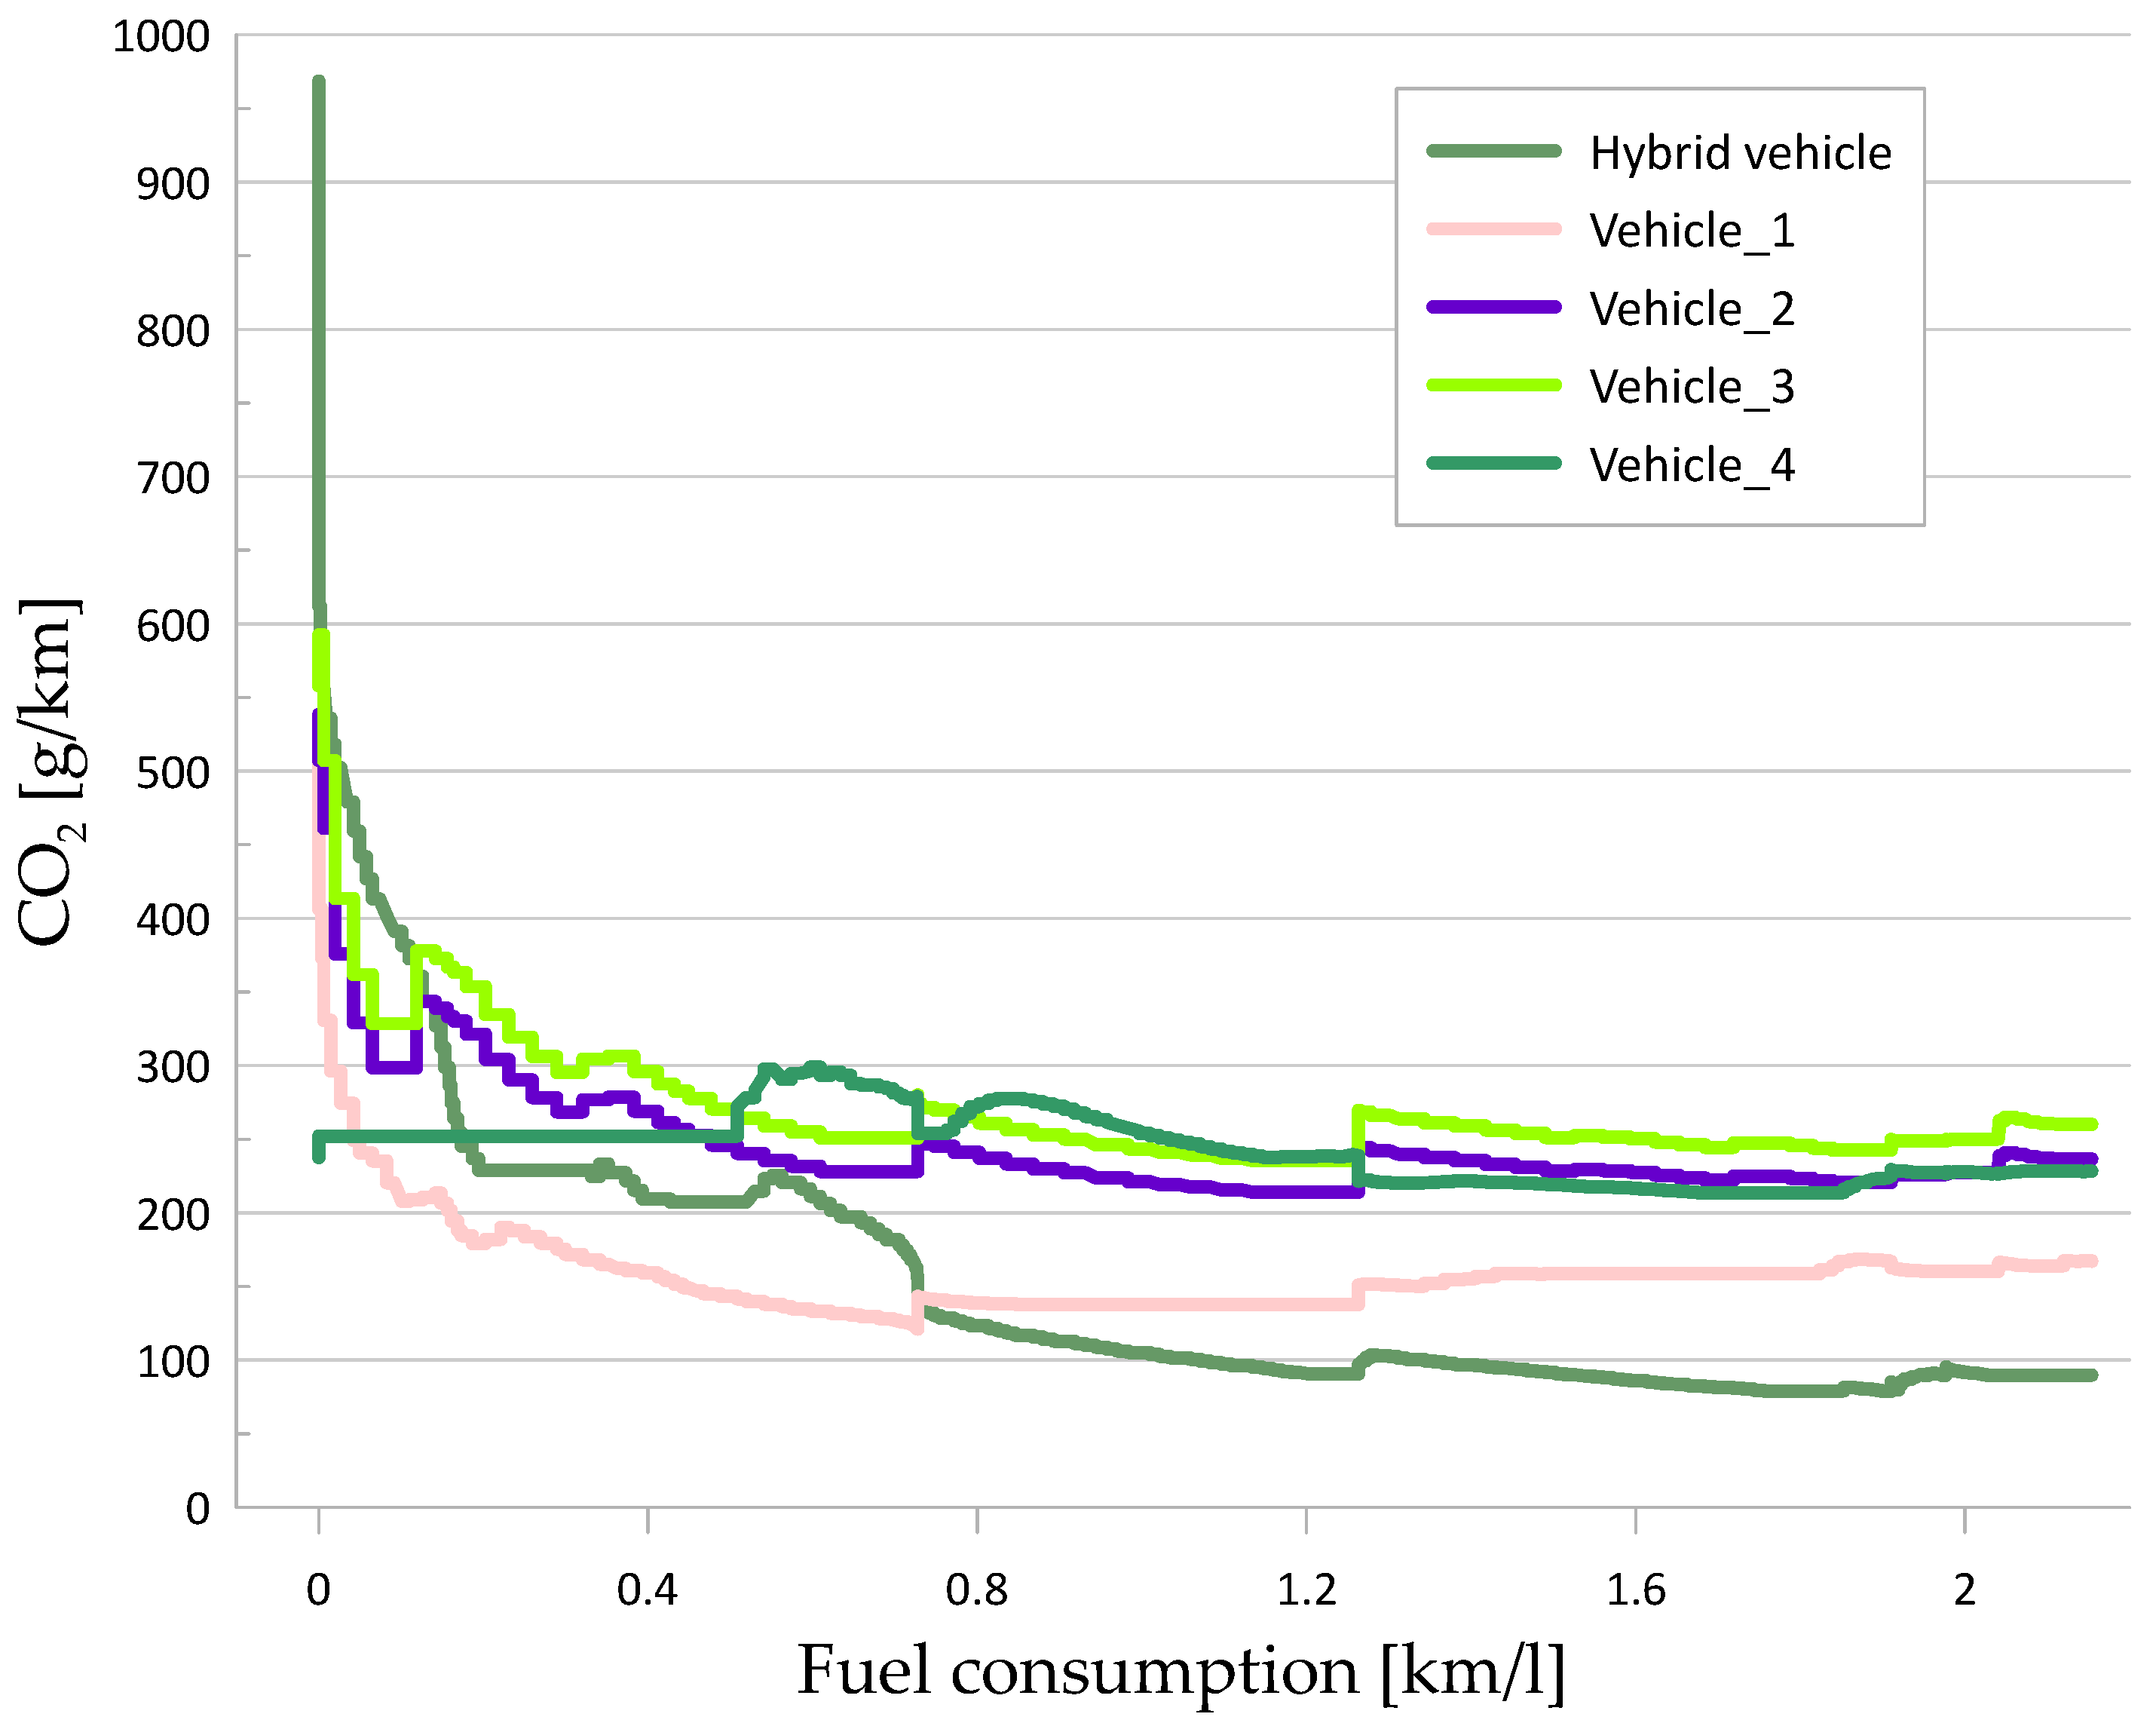
In addition, Figure 9 shows the behavior of carbon dioxide (CO2) emissions during the routes analyzed. The results show that the hybrid vehicle generates the least CO2 along each route in comparison with conventional combustion vehicles. However, it is observed that during the stops or at the beginning of the starting or displacement processes, the hybrid vehicle emits a greater amount of CO2 compared to the other vehicles. Despite this, in terms of fuel consumption, the hybrid vehicle is in third place compared to conventional combustion vehicles on all journeys under heavy traffic conditions.

Figure 9.
Graph of CO2 interaction of the fuel consumption model.
These results highlight the potential of hybrid vehicles to reduce CO2 emissions compared to conventional combustion vehicles along the routes analyzed. Although during stops and the start of journeys, they can generate more CO2, in general, their efficiency in fuel consumption allows them to position themselves as a more favorable alternative from an environmental point of view. This underscores the importance of considering both CO2 emissions and fuel consumption when assessing sustainable mobility options in heavy traffic conditions.
To calculate carbon dioxide emissions, the Torque software determines this value based on the analysis of intake airflow and fuel consumption, as stated by Payri et al. [51]. The ideal air/fuel ratio (approximately 14.7:1 for gasoline) indicates the amount of air required to achieve complete oxidation of the fuel. Under stoichiometric conditions, the carbon dioxide production is directly related to the fuel consumption and its carbon content. Using air flow sensors and fuel injection parameters, this process can be precisely quantified, allowing calculations to be adapted to varying situations, such as traffic in urban environments or heavy loads, which impact engine efficiency and emissions [52]. This calculation approach, which is used in several standardized studies and tests, underpins the environmental impact assessment of hybrid and internal combustion technologies.
4. Discussion
In this study, a comparison was carried out between the mean values of fuel consumption measured in different spark ignition vehicles and hybrid vehicles in traffic conditions. These measured values were compared to the consumption calculated using a mathematical model based on Equation (1). The results revealed that there was a percentage difference between the two values, which ranged between −12% and 15%. This indicates that, on average, the consumptions calculated through the mathematical model were close to the measured values, although variations were observed in each case. These differences may be due to various factors, such as specific traffic conditions, driving behavior, and the technical characteristics of each vehicle. However, overall, the mathematical model used provided a reasonably accurate estimate of fuel consumption under the traffic conditions analyzed.
Conventional combustion vehicles, in this case, the most common commercial ones in the Ecuadorian market, show a better performance in heavy traffic due to the characteristic of the combustion engine operating cycle (variable Otto cycle), which is designed to give torque at low RPM improving the performance of the Atkinson cycle, this according to the discharge of the batteries by the denoted decrease in speed and mobility cycle of the vehicle on the established routes.
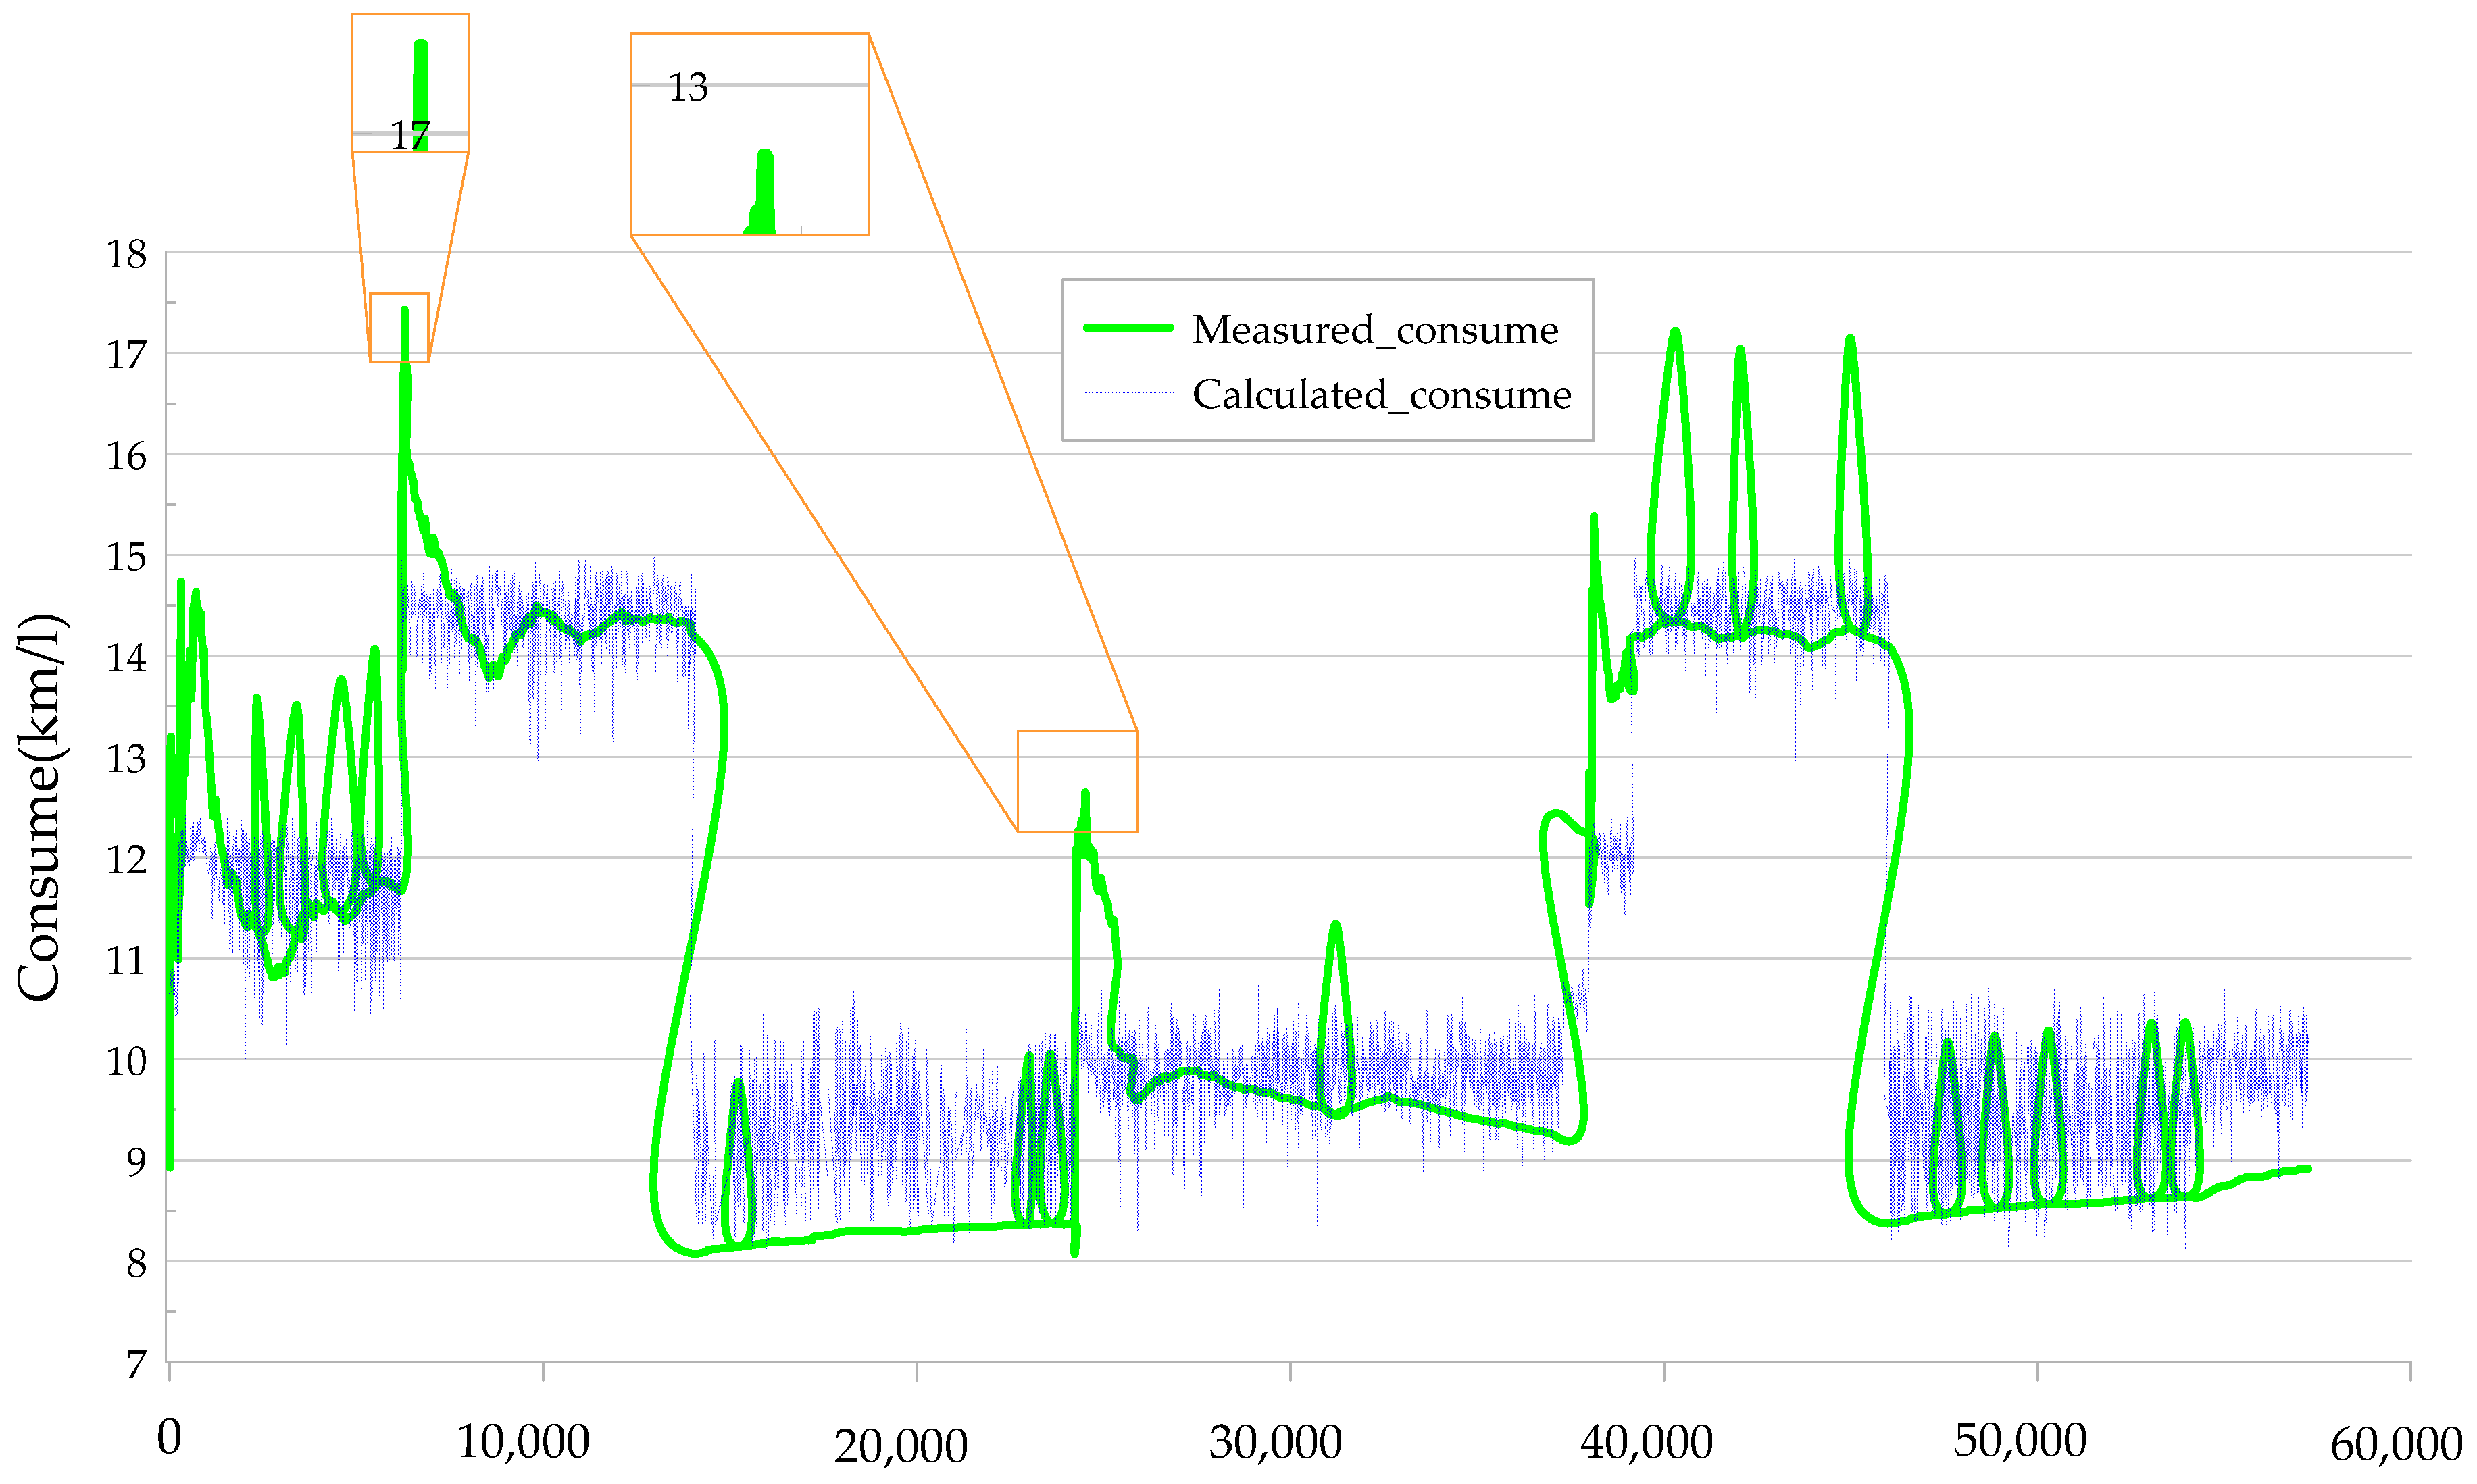
This can be compared with the work of Pielecha. et al. [50], in which they report the same behavior in energy consumption, albeit in speed conditions above 30 km/h, up to speeds of 120 km/h, whereas the behavior is completely inverse in speed conditions below 20 km/h. However, if one compares the instantaneous values for any of the routes and vehicles for the measured fuel input and the calculated fuel input, these differences are due to traffic situations that require a large variation in the amount of fuel, as shown in Figure 9.
Figure 10 provides an analysis of two specific variables measured second-by-second on the route “Av. Maldonado”, consolidating data from all tested vehicles. Under heavy traffic, the estimated average travel time for this route is around 3 h. Comparatively, on the Mariscal Sucre route, facing similar traffic congestion along with environmental and peak-hour factors, the estimated average travel time from one end to the other extends to approximately 4.5 h. These findings suggest that, given the high-demand conditions of these routes, a hybrid vehicle may not serve as an optimal mobility option.
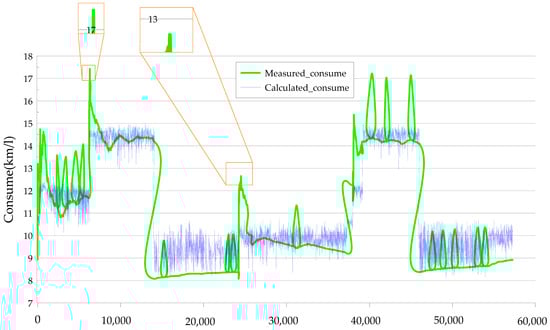
Figure 10.
Measured fuel consumption vs. calculated fuel consumption.
Based on the data presented in Table 4, it can be concluded that the vehicle with the highest fuel efficiency in traffic situations is Vehicle 1, which has a 1.2-L engine. It is well known that the higher the compression of the engine, the less power loss occurs, which in turn results in greater efficiency in terms of fuel consumption. Thus, Vehicle 1 proves to have the best fuel consumption efficiency compared to Vehicle 2, Vehicle 4, the hybrid vehicle, and Vehicle 3, which recorded higher fuel consumption under the same traffic conditions. These results underline the importance of considering engine displacement and its relation to fuel efficiency when evaluating vehicle options in terms of energy efficiency.
The obtained results reveal that in heavy traffic conditions, a hybrid vehicle is not the most optimal option. This is because, in highly congested situations, a hybrid vehicle’s battery charge does not provide the amount of power needed to operate efficiently. As a result, the internal combustion engine remains on for most of the time, and its duty cycle does not generate enough power to overcome traffic obstacles. Instead of running in its optimum efficiency mode, the internal combustion engine is activated primarily to charge the vehicle’s batteries. Consequently, in heavy traffic scenarios, other types of vehicles with more efficient internal combustion engines could be more appropriate in terms of performance and fuel consumption.
5. Conclusions
Within the vehicles tested under traffic conditions, Vehicle 1 exhibited the highest fuel efficiency, followed by Vehicle 2, Vehicle 4, the hybrid car, and finally, Vehicle 3, which recorded the highest fuel consumption. This indicates that conventional engines that are well-optimized could rival certain hybrid systems in efficiency under heavy traffic conditions. The mathematical model generated in the study revealed an acceptance rate of 98.1% when comparing measured and projected fuel consumption, with a margin of error of 1.9%. This result validates the model, although it is recognized that climatic conditions and other factors can generate variability in the measurement parameters.
A more in-depth study of hybrid systems could be conducted within Quito on its busiest roads, comparing only hybrid vehicles marketed within Ecuador. The vehicles should have similar technical characteristics considering the displacement range, which denotes a more important factor in the fuel consumption analysis process for better optimization, as the variation of these characteristics can affect the results of higher energy consumption, indicating that the CO2 generation is more differentiated.
In a future study, the same comparison of vehicles can be made with the only variation in the type of fuel used, replacing the Extra (85 octane) with the Super (95 octane), to achieve differences in the consumption results, efficiency, load engine, and emissions. At a research level, this work shows the importance of analyzing the parameters of circulation of hybrid vehicles in heavy traffic, as it shows that in heavy traffic conditions, a greater generation of emissions and a latent increase in fuel consumption due to the characteristics of the work cycle, for which, studies must be carried out on the minimum qualities of the vehicles.
This study contributes significantly to the analysis of fuel consumption in conventional and hybrid vehicles in dense traffic conditions, like those observed in the city of Quito, showing marked disparities in efficiency between the two categories. The validation of the model with an accuracy of 98.1% supports its applicability in real-life situations, while the results highlight the importance of improving the performance of hybrid vehicles in congested urban environments. This work lays the foundation for further research on the impact of fuel type and efficiency of hybrid systems in urban contexts.
Author Contributions
Conceptualization, E.V.R.-R. and C.M.; methodology, M.A.-F. and C.C.-Q.; software, M.A.-F.; validation, M.A.-F. and E.V.R.-R.; formal analysis, J.U.-A.; investigation, J.U.-A. and C.C.-Q.; resources, J.U.-A.; writing—original draft preparation, J.U.-A.; writing—review and editing, C.M.; visualization, M.A.-F. and C.C.-Q.; supervision, C.M.; project administration, E.V.R.-R.; funding acquisition, E.V.R.-R. All authors have read and agreed to the published version of the manuscript.
Funding
This research received no external funding.
Data Availability Statement
The original contributions presented in the study are included in the article, further inquiries can be directed to the corresponding author.
Conflicts of Interest
The authors declare no conflicts of interest.
References
- June 2022 Monthly Energy Review. Available online: https://www.eia.gov/totalenergy/data/monthly/archive/00352206.pdf (accessed on 27 April 2023).
- Global EV Outlook 2022—Analysis—IEA. Available online: https://www.iea.org/reports/global-ev-outlook-2022 (accessed on 27 April 2023).
- World Energy Outlook 2020—Analysis—IEA. Available online: https://www.iea.org/reports/world-energy-outlook-2020 (accessed on 27 April 2023).
- Verbelen, F.; Lhomme, W.; Vinot, E.; Stuyts, J.; Vafaeipour, M.; Hegazy, O.; Stockman, K.; Sergeant, P. Comparison of an Optimized Electrical Variable Transmission with the Toyota Hybrid System. Appl. Energy 2020, 278, 115616. [Google Scholar] [CrossRef]
- Li, J.; Liang, M.; Cheng, W.; Wang, S. Life Cycle Cost of Conventional, Battery Electric, and Fuel Cell Electric Vehicles Considering Traffic and Environmental Policies in China. Int. J. Hydrogen Energy 2021, 46, 9553–9566. [Google Scholar] [CrossRef]
- Sinigaglia, T.; Eduardo Santos Martins, M.; Cezar Mairesse Siluk, J. Technological Evolution of Internal Combustion Engine Vehicle: A Patent Data Analysis. Appl. Energy 2022, 306, 118003. [Google Scholar] [CrossRef]
- These Are The Best Selling Hybrid Cars in Ecuador, wth Prices Under USD 20,000. Available online: https://www.primicias.ec/economia/carros-hibridos-ecuador-precios-bajos-microhibridos-75675/ (accessed on 11 November 2024).
- Markets On The Rise! How Electric Vehicle Sales Closed in LATAM—ALAMOS—Latin American Association for Sustainable Mobility. Available online: https://alamoslatam.org/2024/ventas-vehiculos-electricos-hibridos-latam/ (accessed on 11 November 2024).
- Orecchini, F.; Santiangeli, A.; Zuccari, F.; Ortenzi, F.; Genovese, A.; Spazzafumo, G.; Nardone, L. Energy Consumption of a Last Generation Full Hybrid Vehicle Compared with a Conventional Vehicle in Real Drive Conditions. Energy Procedia 2018, 148, 289–296. [Google Scholar] [CrossRef]
- Maamria, D.; Gillet, K.; Colin, G.; Chamaillard, Y.; Nouillant, C. Optimal Predictive Eco-Driving Cycles for Conventional, Electric, and Hybrid Electric Cars. IEEE Trans. Veh. Technol. 2019, 68, 6320–6330. [Google Scholar] [CrossRef]
- Kiseleva, E.V.; Kaminskiy, N.S.; Presnykov, V.A. Study of Fuel Efficiency of Hybrid Vehicles. IOP Conf. Ser. Earth Environ. Sci. 2020, 459, 022086. [Google Scholar] [CrossRef]
- Balcı, Ö.; Karagöz, Y.; Gezer, O.; Kale, S.; Köten, H.; Pusat, S.; Yüksek, L. Numerical and Experimental Investigation of Fuel Consumption and CO2 Emission Performance for a Parallel Hybrid Vehicle. Alex. Eng. J. 2021, 60, 3649–3667. [Google Scholar] [CrossRef]
- Sher, F.; Chen, S.; Raza, A.; Rasheed, T.; Razmkhah, O.; Rashid, T.; Rafi-ul-Shan, P.M.; Erten, B. Novel Strategies to Reduce Engine Emissions and Improve Energy Efficiency in Hybrid Vehicles. Clean. Eng. Technol. 2021, 2, 100074. [Google Scholar] [CrossRef]
- Wang, Y.; Hao, C.; Ge, Y.; Hao, L.; Tan, J.; Wang, X.; Zhang, P.; Wang, Y.; Tian, W.; Lin, Z.; et al. Fuel Consumption and Emission Performance from Light-Duty Conventional/Hybrid-Electric Vehicles over Different Cycles and Real Driving Tests. Fuel 2020, 278, 118340. [Google Scholar] [CrossRef]
- WON, H.W. A Method and System for Combining the Advantages of Gasoline Compression Ignition (GCI) Engine Technologies into Hybrid Electric Vehicles (HEVs). Appl. Sci. 2021, 11, 9934. [Google Scholar] [CrossRef]
- Cutrignelli, F.; Saponaro, G.; Stefanizzi, M.; Torresi, M.; Camporeale, S.M. Study of the Effects of Regenerative Braking System on a Hybrid Diagnostic Train. Energies 2023, 16, 874. [Google Scholar] [CrossRef]
- Rios-Torres, J.; Liu, J.; Khattak, A. Fuel Consumption for Various Driving Styles in Conventional and Hybrid Electric Vehicles: Integrating Driving Cycle Predictions with Fuel Consumption Optimization. Int. J. Sustain. Transp. 2019, 13, 123–137. [Google Scholar] [CrossRef]
- Huiming, G.; Yuan, Z.; Qingkai, Y.; Jie, F.; Fengchun, S.; Dietmar, G. Generation of a driving cycle for battery electric vehicles: A case study of Beijing. Energy. 2018, 150, 901–912. [Google Scholar] [CrossRef]
- Huang, Y.; Surawski, N.C.; Organ, B.; Zhou, J.L.; Tang, O.H.H.; Chan, E.F.C. Fuel Consumption and Emissions Performance under Real Driving: Comparison between Hybrid and Conventional Vehicles. Sci. Total Environ. 2019, 659, 275–282. [Google Scholar] [CrossRef] [PubMed]
- Pukalskas, S.; Rimkus, A.; Melaika, M.; Peceliunas, R. Comparison of Conventional and Hybrid Cars Exploitation Costs. Adv. Sci. Technol. Res. J. 2018, 12, 221–227. [Google Scholar] [CrossRef] [PubMed]
- Tansini, A.; Fontaras, G.; Millo, F. A Multipurpose Simulation Approach for Hybrid Electric Vehicles to Support the European CO2 Emissions Framework. Atmosphere 2023, 14, 587. [Google Scholar] [CrossRef]
- Dong, H.; Fu, J.; Zhao, Z.; Liu, Q.; Li, Y.; Liu, J. A Comparative Study on the Energy Flow of a Conventional Gasoline-Powered Vehicle and a New Dual Clutch Parallel-Series Plug-in Hybrid Electric Vehicle under NEDC. Energy Convers. Manag. 2020, 218, 113019. [Google Scholar] [CrossRef]
- Kober, M. The High Potential for Waste Heat Recovery in Hybrid Vehicles: A Comparison Between the Potential in Conventional and Hybrid Powertrains. J. Electron. Mater. 2020, 49, 2928–2936. [Google Scholar] [CrossRef]
- Wang, A.; Xu, J.; Zhang, M.; Zhai, Z.; Song, G.; Hatzopoulou, M. Emissions and Fuel Consumption of a Hybrid Electric Vehicle in Real-World Metropolitan Traffic Conditions. Appl. Energy 2022, 306, 118077. [Google Scholar] [CrossRef]
- Bowyer, J.; Pepke, E.; Groot, H.W. Environmental Assessment of Conventional, Hybrid, and Battery electric Vehicles. Dovetail Partn. Consum. Responsibly Rep. 2019, 6, 18. Available online: https://www.dovetailinc.org/report_pdfs/2019/DovetailRespVehicles0315.pdf (accessed on 25 December 2024).
- Peng, F.; Zhang, Y.; Song, G.; Huang, J.; Zhai, Z.; Yu, L. Evaluation of Real-World Fuel Consumption of Hybrid-Electric Passenger Car Based on Speed-Specific Vehicle Power Distributions. J. Adv. Transp. 2023, 2023, 9016510. [Google Scholar] [CrossRef]
- Shvetsov, A.V. Change in Fuel Consumption of a Hybrid Vehicle When Operating in the Far North. World Electr. Veh. J. 2021, 12, 104. [Google Scholar] [CrossRef]
- Kato, H.; Ando, R.; Kondo, Y.; Suzuki, T.; Matsuhashi, K.; Kobayashi, S. Comparative Measurements of the Eco-Driving Effect between Electric and Internal Combustion Engine Vehicles. In Proceedings of the 2013 World Electric Vehicle Symposium and Exhibition, EVS 2014, Barcelona, Spain, 17–20 November 2013; Institute of Electrical and Electronics Engineers Inc.: New York, NY, USA, 2014. [Google Scholar]
- Thomas, J.; Huff, S.; West, B.; Chambon, P. Fuel Consumption Sensitivity of Conventional and Hybrid Electric Light-Duty Gasoline Vehicles to Driving Style. SAE Int. J. Fuels Lubr. 2017, 10, 672–689. [Google Scholar] [CrossRef]
- Tu, R.; Xu, J.; Wang, A.; Zhang, M.; Zhai, Z.; Hatzopoulou, M. Real-World Emissions and Fuel Consumption of Gasoline and Hybrid Light Duty Vehicles under Local and Regulatory Drive Cycles. Sci. Total Environ. 2022, 805, 150407. [Google Scholar] [CrossRef]
- Kumar, A.; Chandekar, A.; Deshmukh, P.W.; Ugale, R.T. Development of Electric Vehicle with Permanent Magnet Synchronous Motor and Its Analysis with Drive Cycles in MatLab/Simulink. Mater. Today Proc. 2023, 72, 643–651. [Google Scholar] [CrossRef]
- Charadsuksawat, A.; Laoonual, Y.; Chollacoop, N. Comparative Study of Hybrid Electric Vehicle and Conventional Vehicle under New European Driving Cycle and Bangkok Driving Cycle. In Proceedings of the 2018 IEEE Transportation Electrification Conference and Expo, Asia-Pacific (ITEC Asia-Pacific), Bangkok, Thailan, 6–9 June 2018. [Google Scholar] [CrossRef]
- Yuan, Z.; Fu, J.; Liu, Q.; Ma, Y.; Zhan, Z. Quantitative Study on Influence Factors of Power Performance of Variable Valve Timing (VVT) Engines and Correction of Its Governing Equation. Energy 2018, 157, 314–326. [Google Scholar] [CrossRef]
- OBDLink® MX+—Outstanding Bluetooth-Compatible OBD II Scan Tool. Available online: https://www.obdlink.com/products/obdlink-mxp/ (accessed on 13 March 2023).
- Rojas-Reinoso, V.; Alvarez-Loor, J.; Zambrano-Becerra, H.; Soriano, J.A. Comparative Study of Gasoline Fuel Mixture to Reduce Emissions in the Metropolitan District. Sustainability 2023, 15, 2921. [Google Scholar] [CrossRef]
- Jaiswal, A.; Manoj, M.; Tiwari, G. A Review of Studies on Service Quality of Intermediate Public Transport. IATSS Res. 2022, 46, 537–546. [Google Scholar] [CrossRef]
- National Assembly Regulation to the Land Transport, Transit and Road Safety Law. Ley 2012, 1–91. Available online: https://www.obraspublicas.gob.ec/wp-content/uploads/downloads/2015/03/Decreto-Ejecutivo-No.-1196-de-11-06-2012-REGLAMENTO-A-LA-LEY-DE-TRANSPORTE-TERRESTRE-TRANSITO-Y-SEGURIDAD-VIA.pdf (accessed on 23 December 2024).
- EL COMERCIO It Takes About 30 Minutes to Get Out of Congested Places In Quito 2022. Available online: https://www.elcomercio.com/actualidad/quito/minutos-demora-congestion-avenidas-quito-transito.html (accessed on 23 December 2024).
- Be a Mechanic…with Android and Linux!|Linux Journal. Available online: https://www.linuxjournal.com/content/be-mechanicwith-android-and-linux (accessed on 13 March 2023).
- EL UNIVERSO ARC Guarantees Extra and Super Gasoline Octane Ratings and Demonstrates the Measurement Process 2022. Available online: https://www.eluniverso.com/noticias/economia/como-se-mide-el-octanaje-de-las-gasolinas-extra-y-super-en-el-laboratorio-de-la-agencia-de-regulacion-y-control-de-energia-nota/ (accessed on 23 December 2024).
- Rojas-Reinoso, V.; Duque-Escobar, S.; Guapulema-Guapulema, C.; Soriano, J.A. Study of the Variation of Fuel Pressure to Improve Spraying and the Range of the Injection Jet. Energies 2023, 16, 5472. [Google Scholar] [CrossRef]
- Duan, X.; Fu, J.; Zhang, Z.; Liu, J.; Zhao, D.; Zhu, G. Experimental Study on the Energy Flow of a Gasoline-Powered Vehicle under the NEDC of Cold Starting. Appl. Therm. Eng. 2017, 115, 1173–1186. [Google Scholar] [CrossRef]
- Gebisa, A.; Gebresenbet, G.; Gopal, R.; Nallamothu, R.B. Driving Cycles for Estimating Vehicle Emission Levels and Energy Consumption. Future Transp. 2021, 1, 615–638. [Google Scholar] [CrossRef]
- Price of Extra and Ecopaís Gasoline Rises Starting November 12|Economy|News|El Universo. Available online: https://www.eluniverso.com/noticias/economia/precio-gasolina-extra-ecopais-super-ecuador-noviembre-2024-nota/ (accessed on 12 November 2024).
- What Is a CAN Bus: The Backbone of Modern Vehicle Communication. Available online: https://www.wevolver.com/article/what-is-a-can-bus (accessed on 11 November 2024).
- Understanding CAN Bus: A Comprehensive Guide. Available online: https://www.wevolver.com/article/understanding-can-bus-a-comprehensive-guide (accessed on 11 November 2024).
- How Bluetooth Technology Creates Reliability from Unreliable Foundations|Bluetooth® Technology Website. Available online: https://www.bluetooth.com/blog/how-bluetooth-technology-creates-reliability-from-unreliable-foundations/ (accessed on 11 November 2024).
- Transmission Rate vs. Bandwidth in Bluetooth Technology|Advanced PCB Design Blog|Cadence. Available online: https://resources.pcb.cadence.com/blog/2022-transmission-rate-vs-bandwidth-in-bluetooth-technology (accessed on 11 November 2024).
- Ou, S.; Yu, R.; Lin, Z.; He, X.; Bouchard, J.; Przesmitzki, S. Evaluating China’s Passenger Vehicle Market under the Vehicle Policies of 2021–2023. World Electr. Veh. J. 2021, 12, 72. [Google Scholar] [CrossRef]
- Pielecha, J.; Skobiej, K.; Kurtyka, K. Exhaust Emissions and Energy Consumption Analysis of Conventional, Hybrid, and Electric Vehicles in Real Driving Cycles. Energies 2020, 13, 6423. [Google Scholar] [CrossRef]
- Payri González, F.; Desantes Fernández, J.M. Motores de Combustión Interna Alternativos; Editorial Universitat Politècnica de València: Valencia, Spain, 2011; 1024p. [Google Scholar]
- Heywood, J.B. Internal Combustion Engine Fundamentals; McGraw-Hill Education: New York, NY, USA, 2018; ISBN 9781260116106. [Google Scholar]

Disclaimer/Publisher’s Note: The statements, opinions and data contained in all publications are solely those of the individual author(s) and contributor(s) and not of MDPI and/or the editor(s). MDPI and/or the editor(s) disclaim responsibility for any injury to people or property resulting from any ideas, methods, instructions or products referred to in the content. |
© 2024 by the authors. Published by MDPI on behalf of the World Electric Vehicle Association. Licensee MDPI, Basel, Switzerland. This article is an open access article distributed under the terms and conditions of the Creative Commons Attribution (CC BY) license (https://creativecommons.org/licenses/by/4.0/).