Article

Exploring Thermal Runaway: Role of Battery Chemistry and Testing Methodology

by
Sébastien Sallard
1,*,
Oliver Nolte
2,
Lorenz von Roemer
2,
Brahim Soltani
1,
Alexander Fandakov
2,
Karsten Mueller
2,
Maria Kalogirou
2 and
Marc Sens
2
1
IAV France S.A.S., 4 Rue Georges Guynemer, 78280 Guyancourt, France
2
IAV GmbH, Carnotstrasse 1, 10587 Berlin, Germany
*
Author to whom correspondence should be addressed.
World Electr. Veh. J. 2025, 16(3), 153; https://doi.org/10.3390/wevj16030153
Submission received: 18 December 2024 / Revised: 15 February 2025 / Accepted: 20 February 2025 / Published: 6 March 2025

Abstract

:
One of the major concerns for battery electric vehicles (BEVs) is the occurrence of thermal runaway (TR), usually of a single cell, and its propagation to adjacent cells in a battery pack. To guarantee sufficient safety for the vehicle occupants, the TR mechanisms must be known and predictable. In this work, we compare thermal runaway scenarios using different initiation protocols (heat–wait–seek, constant heating, nail penetration) and battery chemistries (nickel manganese cobalt oxide, NMC; lithium iron phosphate, LFP; and sodium-ion batteries, SIB) with the cells in a fully charged state. Our goal is to specifically trigger a variety of different possible TR scenarios (internal failure, external hotspot, mechanical damage) with different types of chemistries to obtain reliable data that are subsequently employed for modeling and prediction of the phenomenon. The safety of the tested cells depending on their chemistry can be summarized as LFP > SIB >> NMC. The data of the TR experiments were used as the basis for high-fidelity modeling and predicting of TR phenomena in 3D. The models simulated reaction rates, represented by the typically employed Arrhenius approach. The effects of the investigated TR triggering methods and cell chemistries were represented with sufficient accuracy, enabling the application of the models for the simulation of thermal propagation in battery packs.

1. Introduction

In the past decade, BEVs have emerged as challengers to vehicles relying on conventional internal combustion engines (ICEs). In 2022, BEV sales represented more than 10% of all car sales worldwide [1]. The increasing share of BEVs is, however, also leading to an increase in safety-related incidents with these vehicles that can be traced back to their batteries, which is concomitant with an increasing public awareness of BEV safety issues. Even though an accident-related BEV fire may not originate from the battery pack, the biggest safety concern is the occurrence of a thermal event, starting with the thermal runaway of a single cell and its propagation within the battery pack.
The safety of the vehicle occupants is paramount for the vehicle and battery manufacturers. The international regulation E/ECE/Rev.2/Add.99/Rev.3 stipulates a warning signal 5 min before the occurrence of a hazardous situation inside the passenger compartment [2]. In this context, it should be noted that a considerable extension of the time from the advance warning and the hazardous situation for passengers is currently under consideration. However, based on today’s state of the art, the prevention and the warning of a cell thermal runaway and its propagation is facing several challenges.
The TR behavior of batteries is highly complex and involves multiple factors, for example, the cell chemistry and format, the cell integration approach in the battery module or pack, the thermal management system layout as well as the implemented active safety measures such as thermal sensing and emergency cooling system operation mode, and finally, the battery management system (BMS). This yields a highly complex system strongly affecting the already complex phenomenon of cell TR in multiple ways.
Battery technology is continuously evolving, with improved LIB chemistries (Ni-rich, LMFP, …) as well as post-lithium-ion and post-lithium chemistries that are completely new in the field of automotive applications (e.g., solid-state, sodium-ion, respectively). This necessitates an equal evolution of safety-related knowledge for these battery materials.
The goal of this contribution is hence to establish the solid experimental basis needed for modeling—and crucially predicting—thermal runaways for different battery materials and chemistries.
The principle of an electrochemical alkali–metal ion battery cell can be summarized as such: The cell is composed of a positive electrode (typically designated as cathode), a negative electrode (typically designated as anode), and a dielectric separator between them, filled with an ion-conducting electrolyte. The electrodes are connected electrically via a load or source (electrical circuit). During cell discharge, the reduced graphite LiC6 present in the charged anode is oxidized, and the alkali metal ions are removed from the anode host lattice. At the same time, the generated electrons are collected by the anode current collector so that they can reach the cathode via the electrical circuit where the electrons are able to reduce transition metal cations in the cathode host lattice.
To keep the overall charge balance, the alkali cations generated at the anode/electrolyte interface are transported through the separator, eventually reaching the cathode surface to be incorporated into the reduced cathode host material lattice. During charging, inverse reactions occur. These processes and the underlying electrochemical reactions can be summarized into global reactions, for example, for a typical Li-ion cell:
Anode   ( charging ) :   Li 1 x C n + x · e + x · Li +   Li C n
Cathode   ( charging ) :   LiNi 0.6 Mn 0.2 Co 0.2 O 2   Li 1 x Ni 0.6 Mn 0.2 Co 0.2 O 2 + x · e + x · Li
Among the various electrode materials used in automotive LIB cells, the most common ones are layered oxides, such as NMC (nickel manganese cobalt oxide) or NCA (nickel cobalt aluminum oxide), followed by LFP (lithium iron phosphate) as cathode materials and graphite as anode material. Layered oxide materials are usually considered to offer the best energy density while the LFP is cheaper, more stable, safer, and cobalt-free (i.e., limited socio-ecological footprint). However, LFP cells typically suffer from lower energy density, especially on a volumetric basis (Wh/L).
The battery industry is now increasingly facing concerns regarding the need for sustainable battery technologies. Among the different “post-lithium” battery technologies, sodium-ion batteries (SIBs) can be reasonably considered to be among the most promising. This technology has a very high level of maturity, as it is already used in commercial products, for example, electric tools and micro-cars. SIBs are even considered to potentially represent 15% of all batteries used for passenger vehicles in 2030 [3]. The principle of the SIB is fundamentally comparable to that of the LIB, with the charge carrier alkali metal cation being sodium instead of lithium. SIBs have a considerably lower energy density than the LIB; however, they offer other advantages thanks to employing abundant and cheap sodium as a replacement for the comparably scarce and expensive lithium. Sodium-ion batteries are further characterized by enabling safe transport (transportation at 0 V is possible), long lifetime, limited ecological footprint and compatibility for high power applications, even at low temperatures [4,5,6,7]. In numbers, while having a limited energy density that is typically below 200 Wh/kg, they have rate capabilities of 4C and above, even at negative ambient temperatures [4].
The correlations between stress factors and the occurrence of thermal runaway and propagation are summarized in Figure 1. Even if the thermal runaway is, to the best of our knowledge, explained by two main degradation modes (short-circuit and exothermic self-heating), the chemical mechanisms involved are numerous and occur at five different levels in the cell with a possible cascading effect between them. Each mechanism can be induced by different causes and each cause can trigger several different degradation mechanisms.
The presence of an NMC transition metal oxide in the cathode induces specific self-degradation phenomena in addition to the complex interplay of causes and mechanisms for LIBs during the cycling of the cells. Figure 2 illustrates in detail the chain reaction triggered by the NMC self-degradation, visualizing these reactions and their influence on the amplification of the cascading effect leading to a cell thermal runaway.
The process of a thermal runaway is influenced by many parameters. A well-known and important one is the chemistry of the cathodic material present in the LIB. The trend toward higher cell energy content and power has led to the use of high nickel content fractions in the NMC cathode materials usually labeled nickel-rich NMC materials. In terms of safety, NMC materials have important disadvantages. During a thermal runaway, the material-related specific heat release is one of the most important figures of merit [8]. Batteries containing LFP show a lower energy density, but the LFP material is characterized by superior chemical and thermal stability compared to transition metal oxide materials. LFP cathodes have been described to be stable for temperatures of up to 500 °C even in a charged state [9]. It has been observed that the higher energy density of NMC-based batteries relates to a higher risk of thermal runaway and more severe related consequences (peak temperature, gas exhaust, speed of propagation) [10,11]. This highlights the importance of building a knowledge basis for safety-related issues of these new battery technologies.
Compared to post-lithium chemistries such as sodium-ion, the thermal runaway mechanisms of LPF and especially NMC are considered well understood. A recent report noted the instability of the NMC811 material even under normal conditions [12]. When an NMC811/graphite battery is being charged, the NMC811 material starts to degrade at a voltage of 4.15 V by heat release, oxygen and transition metal ion solubilization in the electrolyte, crystal phase modification as well as creations of inactive and isolating layers [7,9]. Thus, the battery suffers from capacity loss and an increase in resistance. In addition, the dissolved oxygen and metal ions diffuse to the anode surface where they lead to further undesired reactions. The latter contributes to an accelerated aging of the Li-ion cell, a phenomenon recently described as “crosstalk” mechanism [13]. The heat released by the crosstalk mechanism is added to the heat released by other phenomena (see Figure 1 and Figure 2) and can easily lead to the cell (or parts of it) reaching the critical self-heating temperature via a cascading effect of successive reactions.
The TR of a Li-ion cell is considered to take place following a typical pattern [14].
When the self-heating temperature for a typical Li-ion cell in the range of 90–120 °C is exceeded, the SEI on the anode surface (graphite and/or silicon) needed to passivate the anode, becomes unstable and degrades. The anodic material is consequently in direct contact with the carbonate electrolyte. Thus, a new SEI is continuously reformed and degraded with an important gas emission including carbon oxides, ethylene, ethane, and oxygen, resulting in an increase in internal cell pressure and cell swelling. These reactions are highly exothermic [15].
The heating of the cell is consequently self-perpetuating until reaching the trigger temperature where the polymeric polyolefin separator melts, leading rapidly to an internal short-circuit of the cell with a drop of its voltage as well as a discharge-related temperature rise. A huge electrolyte decomposition and consequent gas emission are initiated in the corresponding temperature range [14].
Consequently, temperature and pressure within the cell continue to increase, eventually reaching the venting point where the pressure valve of the cell opens, and venting occurs. The cell is still experiencing uncontrolled reactions and heating. The temperature can become sufficiently high so that cell materials, i.e., transition metal oxides, graphite, binders and electrolytes, decompose rapidly.
The thermal runaway starts rapidly at ca. 200 °C, triggering and/or amplifying the combustion of all reactive solid products present in the cell, leading to a quasi-exponential increase in cell temperature until reaching a maximum [13,14,16].
The TR scenario in the case of mechanical damage to the cell is slightly different. The heat source is created by the local short circuit, described as an internal hot spot by Ren et al. [17]. Finegan et al. [18] reported the penetration of the cell in the longitudinal direction of 18,650 cylindrical cell and its effects. The TR initiates in the jellyroll around the nail location and expands to the whole cell in several seconds. Yoshima et al. [19] reported that the Joule heating at the short circuit location was due to the current flowing between the contact of the nail and the electrode. The heating causes gas generation.
Consequently, it appears logical to consider that the local short circuit formed by any sufficient mechanical damage generates enough heat to lead to the cascade reaction of the TR scenario, as described in the previous paragraph, in the vicinity of the short circuit, eventually expanding to the whole cell.
The cathode chemistry also has a high influence on the TR scenario. Liu et al. report that when the thermal runaway of NMC started, it could not be stopped, even by putting the 25 Ah single cell in liquid nitrogen (T ≈ −196 °C) [13]. The same cooling procedure was effective just before the start of the thermal runaway. This information confirms that the thermal runaway of an NMC/graphite cell can be prevented but when started, it can hardly be controlled (“point of no return”). This behavior can be explained by the NMC high-temperature degradation reactions generating sufficient heat and oxygen to fuel its own and other combustion reactions until the reactions have consumed all reactive materials in the cell. The reaction in NMC materials is so violent that solid particles are emitted, while this is not the case with LFP [8,11,13,16,20]. Note that this last remark is based on a report with an isolated single-cell protocol.
Huge amounts of released heat and gas combined with the emission of particulate matter are very likely the reason why NMC cells, and more particularly Ni-rich NMC compositions, show a more dramatic thermal runaway behavior [11]. Generally, a higher Ni content in the cathode correlates with higher cell temperatures during TR and an increased gas volume [11]. The risk of propagation in a battery module and/or pack is consequently high and raises safety concerns for passengers of EVs. The state of charge of the cell (SoC) is an important factor impacting the thermal runaway scenario [15,17,21,22]. Even though differences can occur depending on the cell design and cell chemistry, it seems reasonable to consider that the higher the SoC of the cell, the more likely a TR is to occur (in a shorter time and/or at a lower temperature), and the more energy is released.
The goal of this work, in the first step, is to create an experimental base to evaluate the influence of both battery chemistry and trigger method on the characteristics of the thermal runaway. The trigger methods chosen aim to investigate scenarios representing the three main triggers of a thermal runaway event: (a) the heat–wait–seek method, mimicking internal self-heating, mainly due to internal failure, (b) the continuous heating method, representing the effect of an intense external heat source (i.e., close to a hot spot in the vicinity of the cell) and (c) nail penetration mimicking mechanical damage, for example, in case of a vehicle crash. The cell chemistries selected are NMC811, LFP, and SIB. NMC and LFP are the most popular LIB chemistries used to power BEVs and are expected to remain so at least until the end of this decade [3,23]. As previously mentioned, SIBs are an emerging technology and are projected to potentially account for 15% of the battery market used for BEVs by 2030 [3].
In the second step, the experimental results are used to develop a methodology to simulate, and thus predict, thermal runaway events even for advanced battery technologies, enabling the transfer of the presented methodology to investigations of thermal propagation phenomena in multi-cell configurations. Due to the high complexity of the thermal runaway phenomenon, we employ a combination of physical testing procedures with virtual development methods to drastically reduce the number of tests needed for the development of a “no thermal propagation” battery system and thus accelerate the development of safe and cheap electrical vehicles.

2. Materials and Methods

The cells considered in the experimental campaign presented in this work are cylindrical, manufactured in 18,650 format and have the main characteristics listed in Table 1. All cells tested were fully charged (SoC = 100%), which is state-of-the-art [8,9,11,16,24], and it is considered the worst possible case as explained in the introduction [15,21,22].
The cells are positioned vertically in an autoclave filled with nitrogen with seven temperature sensors (thermocouples) mounted at different locations on the cell surface as shown in Figure 3. For the heating protocol, the cells are heated up with a heating pad (11 cm2 surface area) directly positioned on the lateral surface. In addition, different (cell-type specific) thermal insulation measures have been applied to the cell canning as shown in Figure 3.
Two separate heating protocols were used for each cell chemistry to trigger the thermal runaway taking inspiration from the literature [2,8,11,16,24]:
  • Constant heating (CH) with a continuously applied heating power of 27 W. The constant heating was applied until the occurrence of the thermal runaway
  • Heat–wait–seek (HWS) tests with heating steps of 5 K and step time of 300 s.
Additionally, a standard nail penetration test was performed with the NMC and the SIB cells, penetrating the cell slightly off-centered in the bottom area (Figure A1).
The autoclave was equipped with temperature sensors (type-K sheath thermocouples) and a pressure transmitter. Processing and recording of the analog sensor readouts were performed with standard analog-to-digital data conversion software. For the qualification of the emitted volatile species, an MKS 2030 FTIR analyzer from MKS Instruments, Inc., Andover, MA, USA and an HSense mass spectrometer from V&F Analyse- und Messtechnik GmbH, Absam, Austria, were used. Furthermore, a camera was used to observe the visual progress during the thermal runaway tests. For the cell heating, standard polyimide heating pads were used. Control of the heating power for the heat–wait–seek tests was realized by a PID controller referenced to the thermocouple located on the heating pad. Nail penetration tests were performed with a feed rate of 1 mm/s employing an in-house developed nail penetrator using a 3 mm steel nail with a 30° taper. For quantification of the gas amount after TR, the gas volume was calculated based on the ideal gas law using the autoclave pressure and temperature as input.
Modeling thermal runaway based on different, chemistry-specific reaction mechanisms in a high-fidelity 3D environment as typically employed for investigations of thermal propagation phenomena in multi-cell configurations was performed with the software CONVERGE CFD (Version 3.1.) [26]. The geometry employed in this study is a representation of the single-cell measurement setup as shown in Figure 3 and Figure A2. It mainly includes the cell, the heating pad, the holding clamps, and insulation material if needed, as illustrated in Figure 4. For the simulation of TR triggered by nail penetration, a heat source was used to simulate the initially created short circuit. More specifically, no short circuits are considered in the simulation as such, but the heat generated is accounted for within the Arrhenius approach for the cell reactions. The model used has addressed heat loss from the cell to the environment by incorporating heat transfer to the ambient gas phases as well as heat transfer to the materials surrounding the cell, such as clamps and cell holders.

3. Results and Discussion

3.1. Individual Cell TR Tests

3.1.1. Cell Characteristics in Constant Heating Tests

Figure 5 depicts the thermocouple traces recorded during constant heating (CH) tests for the three investigated cell chemistries. The LFP cell shows the least critical thermal runaway behavior, as expected from the literature, with the lowest peak temperature [8,9]. However, the temperature still reaches 350–400 °C on the cell body, as evident from Figure 5. The smoke emission remains limited during the entire experiment. Figure 5a shows the different temperatures recorded along the cell body. Sensor TC6 on the heating pad records, as expected, the fastest warming and highest temperature during the heating step. The bottom and top of the cell remain significantly colder, attributed to the longer distance from the heating pad and possible cooling as they are not insulated. Regardless of the differences depending on the sensor location, a continuous and quasi-monotonous increase in the cell body temperature is recorded during the first 420 s of the test. The first noticeable event is a rapid increase in heating for TC6 at t ≈ 420 s and the start of venting at t = 460 s. The rapid increase in the temperature of the other parts of the cell body (TC1 to TC5 and TC7) is noticeable only after t ≈ 510 s. A limited amount of smoke occurs after t ≈ 540 s, which is the peak temperature for sensors TC6 (heating pad) and TC7 (closest to TC6) but not for the other sensors, TC1 to TC5. The latter reach their maximum temperature at t ≈ 575 s (except TC1). All sensors finally cool down slowly at a similar rate. We interpret these phenomena as the CH leading to a local hot spot in the cell directly in contact with the heating pad (t ≈ 420 s). The hot spot initiates electrolyte degradation, venting (t ≈ 540 s), and a local TR event (maximum temperature for TC6 and TC7). The latter rapidly propagates through the cell and heats its whole body (t ≈ 575 s). When the TR event ends, the cell cools down slowly.
The SIB cell behavior is comparable to the LFP cell, with a more pronounced heating of the cell surface and temperatures reaching values between 400 and 450 °C. Venting and smoke emission of the SIB cell start after 390 s and 460 s, respectively. The latter is more pronounced compared to the LFP, even though no ignition of the volatile gases occurs (see Figure 5). Despite the limited differences observed, we believe that a similar TR scenario occurred in the SIB than the one described previously for the LFP. While having the earlier start of the venting at 320 s, the NMC811 cell needs a considerably longer time to heat up and to show a measurable effect of the TR Event with t = 720 s when compared to 540 s for LFP and 470 s for SIB. We believe the missing thermal insulation for the NMC811 on the outside of the canning can partially contribute to heat losses to the environment. The NMC cell is violently emitting sparks and flames through the venting opening (see Figure 5) with gas temperatures reaching 1100 °C (TC1 and TC2) while the cell body (TC2 to TC7) reaches peak temperatures above 650 °C (TC7; see Figure 5). These observations are in agreement with the literature [10,11,12], i.e., the nickel-rich NMC811 is a very reactive material, prone to react with and amplify the TR scenario. Note, the possible contribution to the TR scenario of the silicon present in the anode of the NMC811 cell should also be considered [27], even if its quantity in the anode is limited to several percent, is very likely to limit its impact.
The cell weight loss after TR shows a proportionality to the peak temperature of the cells, with the LFP cell losing around 14% of its mass, followed by the SIB with around 19% mass loss. The NMC cell showed the highest mass loss with nearly 65% of its mass ejected, supporting the contribution of the NMC811 material to the TR event, i.e., the NMC811 reacts and is consumed while the cathodic materials of the LFP and SIB cells appear stable. Venting events are present for all cells but are more visible for the SIB cells. These observations are also confirmed by the visual appearance of the TR events, as discussed earlier. Furthermore, we observe internal cell short-circuits, i.e., a potential drop of at least 3 V, occurring way before the venting and TR events, in agreement with the literature [14,15,16]. At this point, the observed cell surface temperatures are typically between 100–150 °C while the heating pad temperature reaches 220 and 250 °C.
Note that the LFP cell is finally emitting an important quantity of smoke at a significant time, starting ca. 928 s (15.5 min), after the occurrence of the thermal runaway; see Figure A3. Rapidly, the autoclave is full of smoke.

3.1.2. Cell Performance in Heat–Wait–Seek Tests

The results of the HWS tests, Figure 6, appear generally similar to the CH tests, with a gradual increase in the cell temperature up to a sudden increase in temperature at the point of thermal runaway. However, due to the test protocol, it takes longer for the thermal runaway to occur. The stair shape of the temperature warming is clearly visible on the TC6 sensor. The temperature dispersion for TC3 to TC7 appears narrower than for the CH test (Figure 5), in agreement with the difference between the warming protocols. TC1 and TC2 suffer from significant heat loss due to their positions. The LFP cell has the lowest lateral surface peak temperature (approx. 330 °C), followed by the SIB (around 500 °C) and NMC (around 600 °C) cells. For the latter, the gases emitted via the venting opening reached temperatures surpassing 1200 °C, comparable with the CH experiment (see Figure 5) with a similarly violent runaway behavior (see Figure 5). The observed weight loss of the LFP cell amounted to nearly 19%, while the SIB cell lost more than half of its weight. The NMC cell had the highest weight loss with more than 60% of its mass ejected during the test. The quantification of the mass loss recorded is similar between the CH and HWS tests for the LFP and NMC cells. However, it differs significantly for the SIB cell, suggesting the occurrence of another TR scenario for this cell chemistry depending on the triggering method. This point is discussed later in Section 3.2 and Section 3.3.

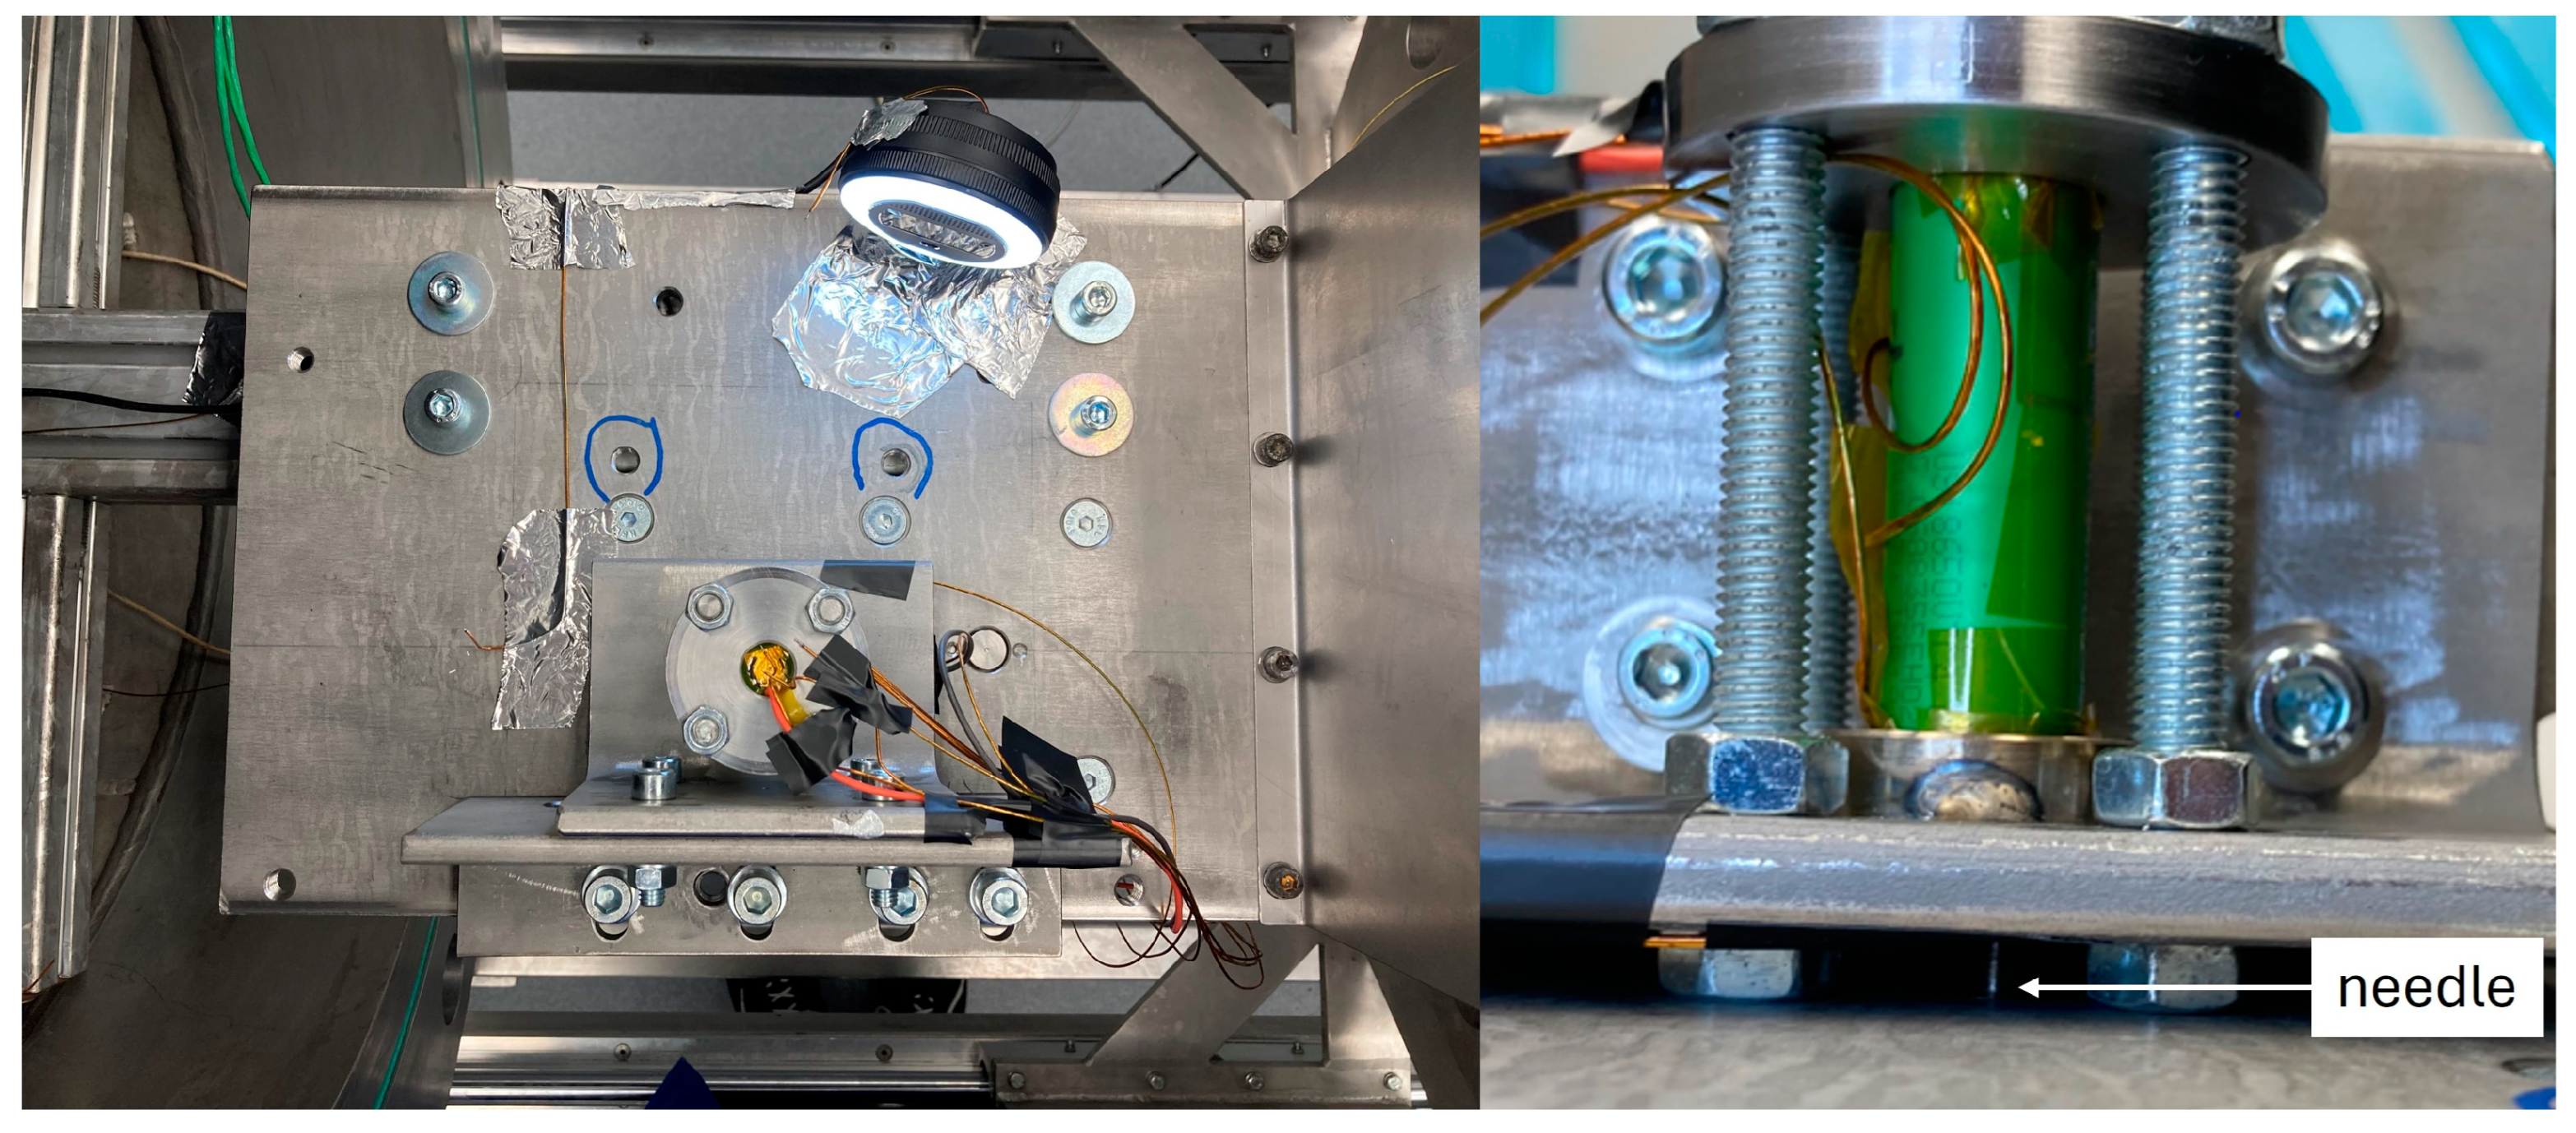
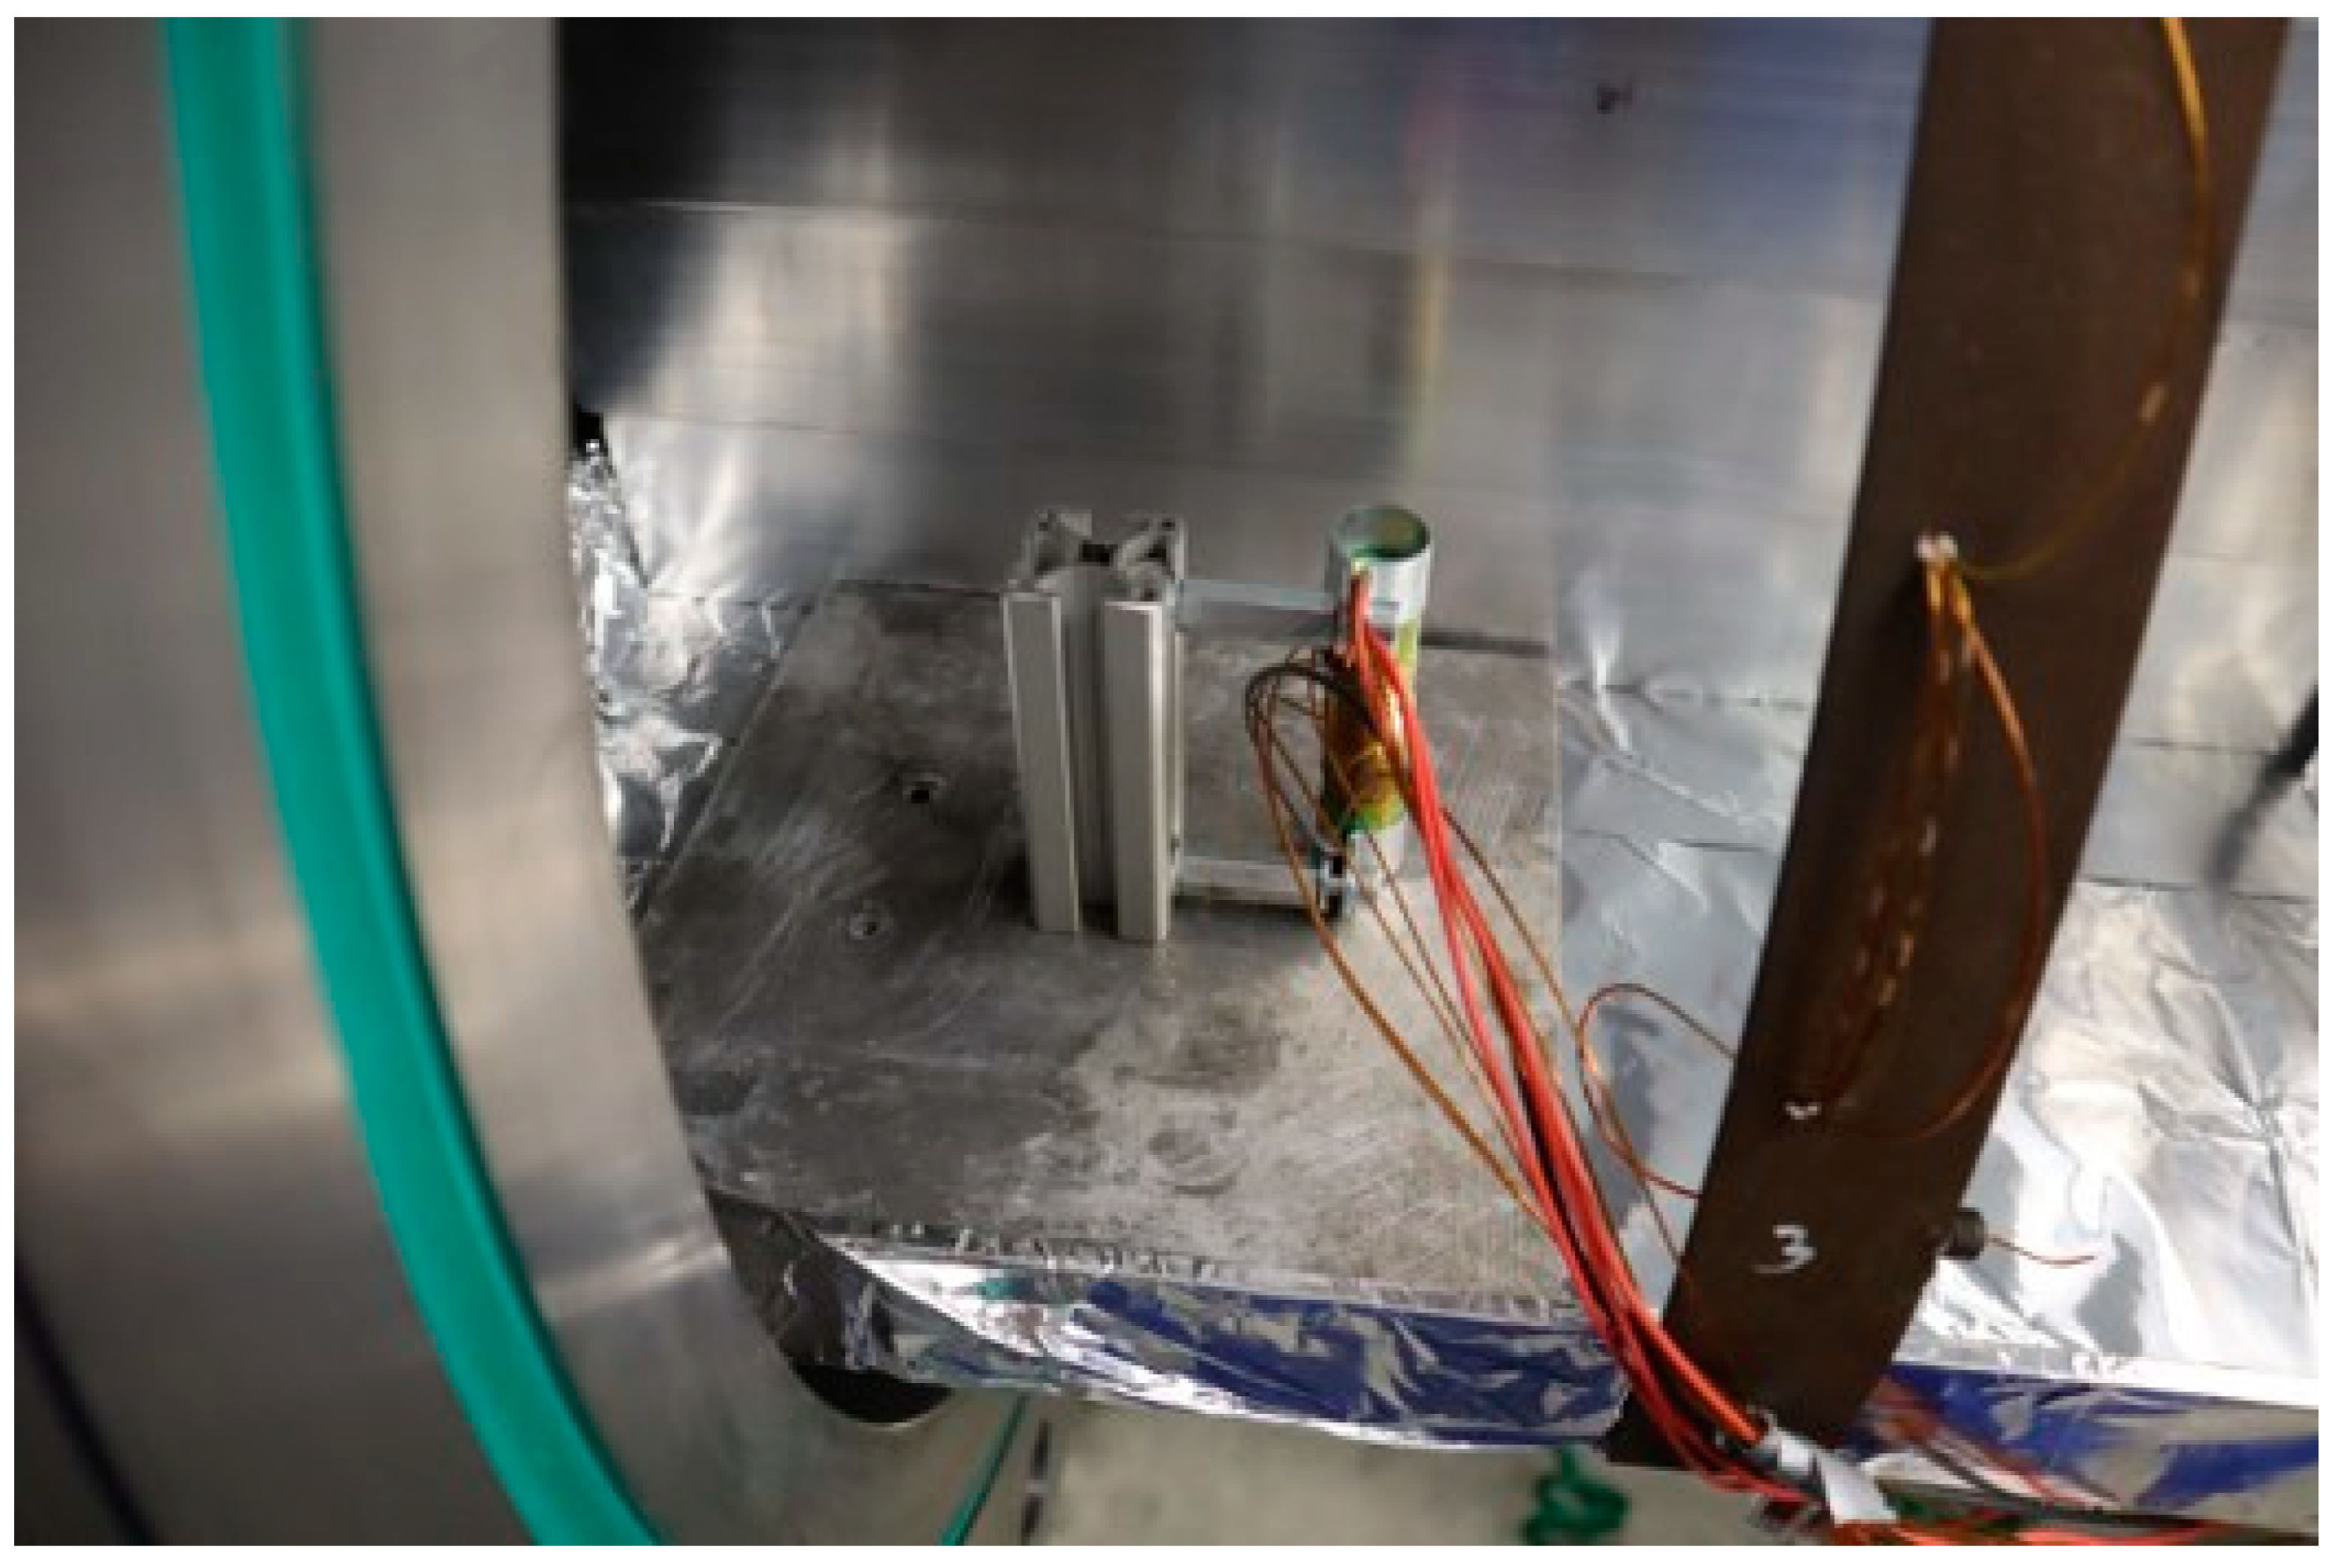
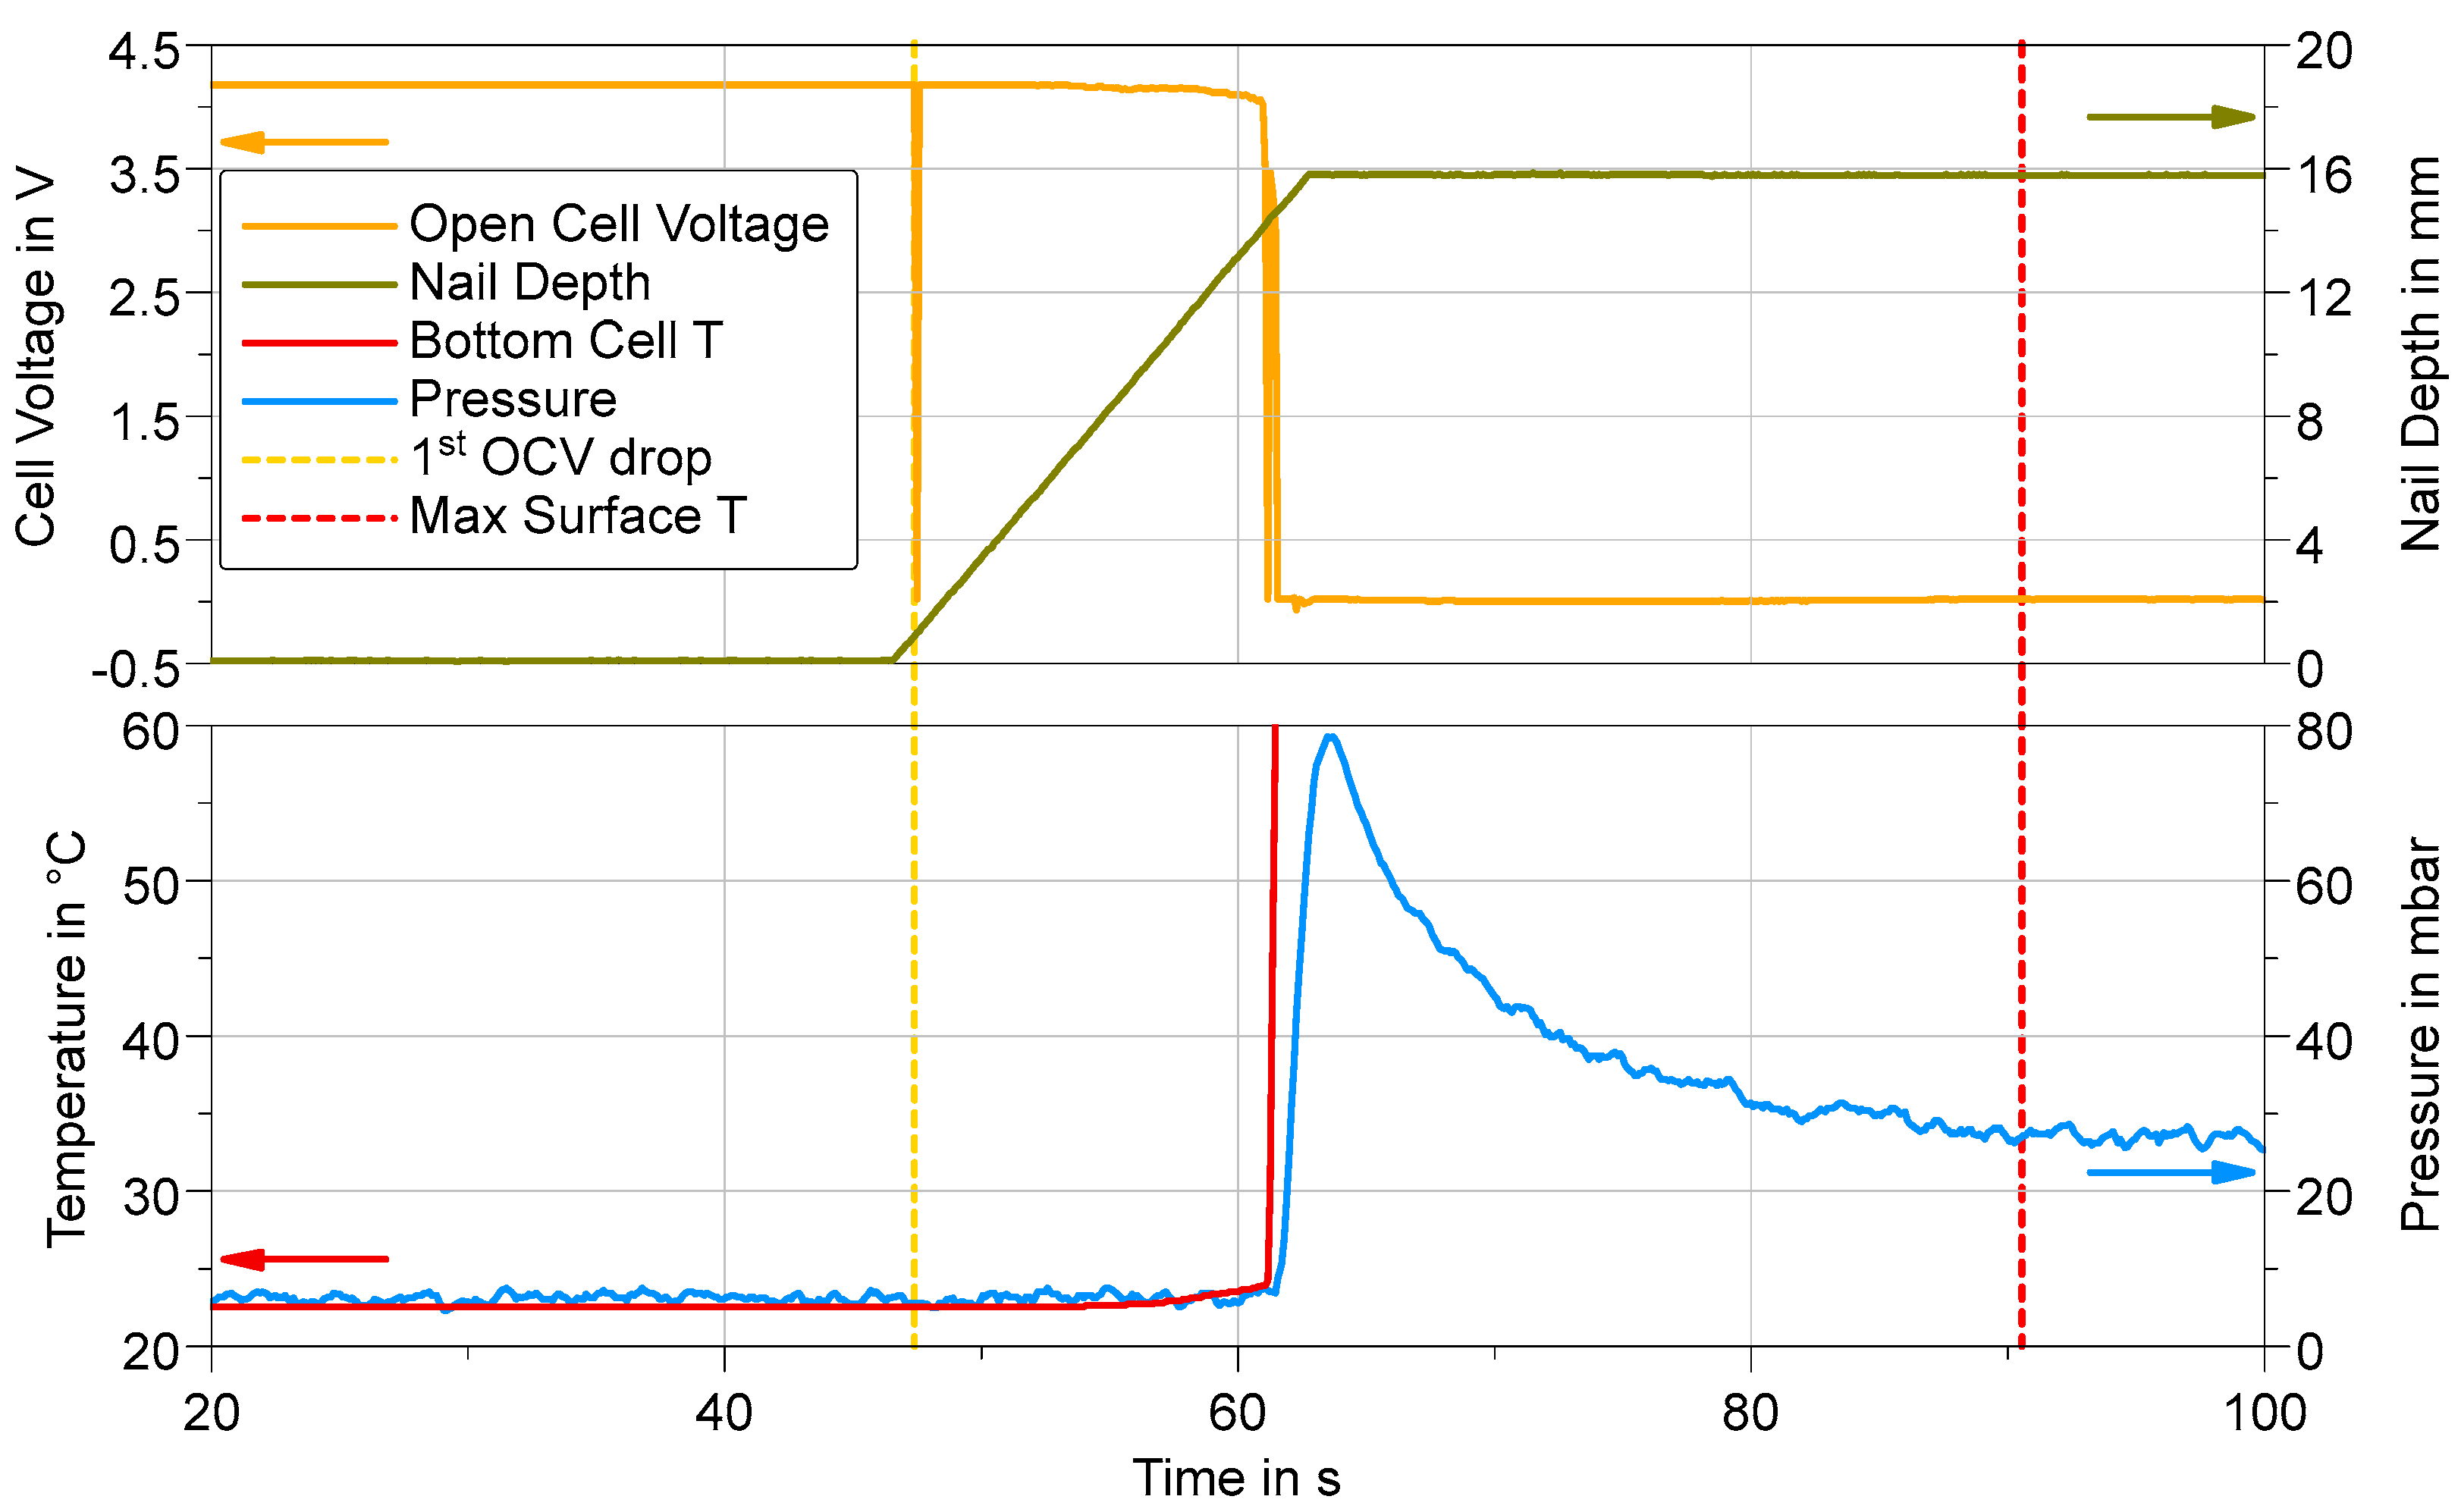
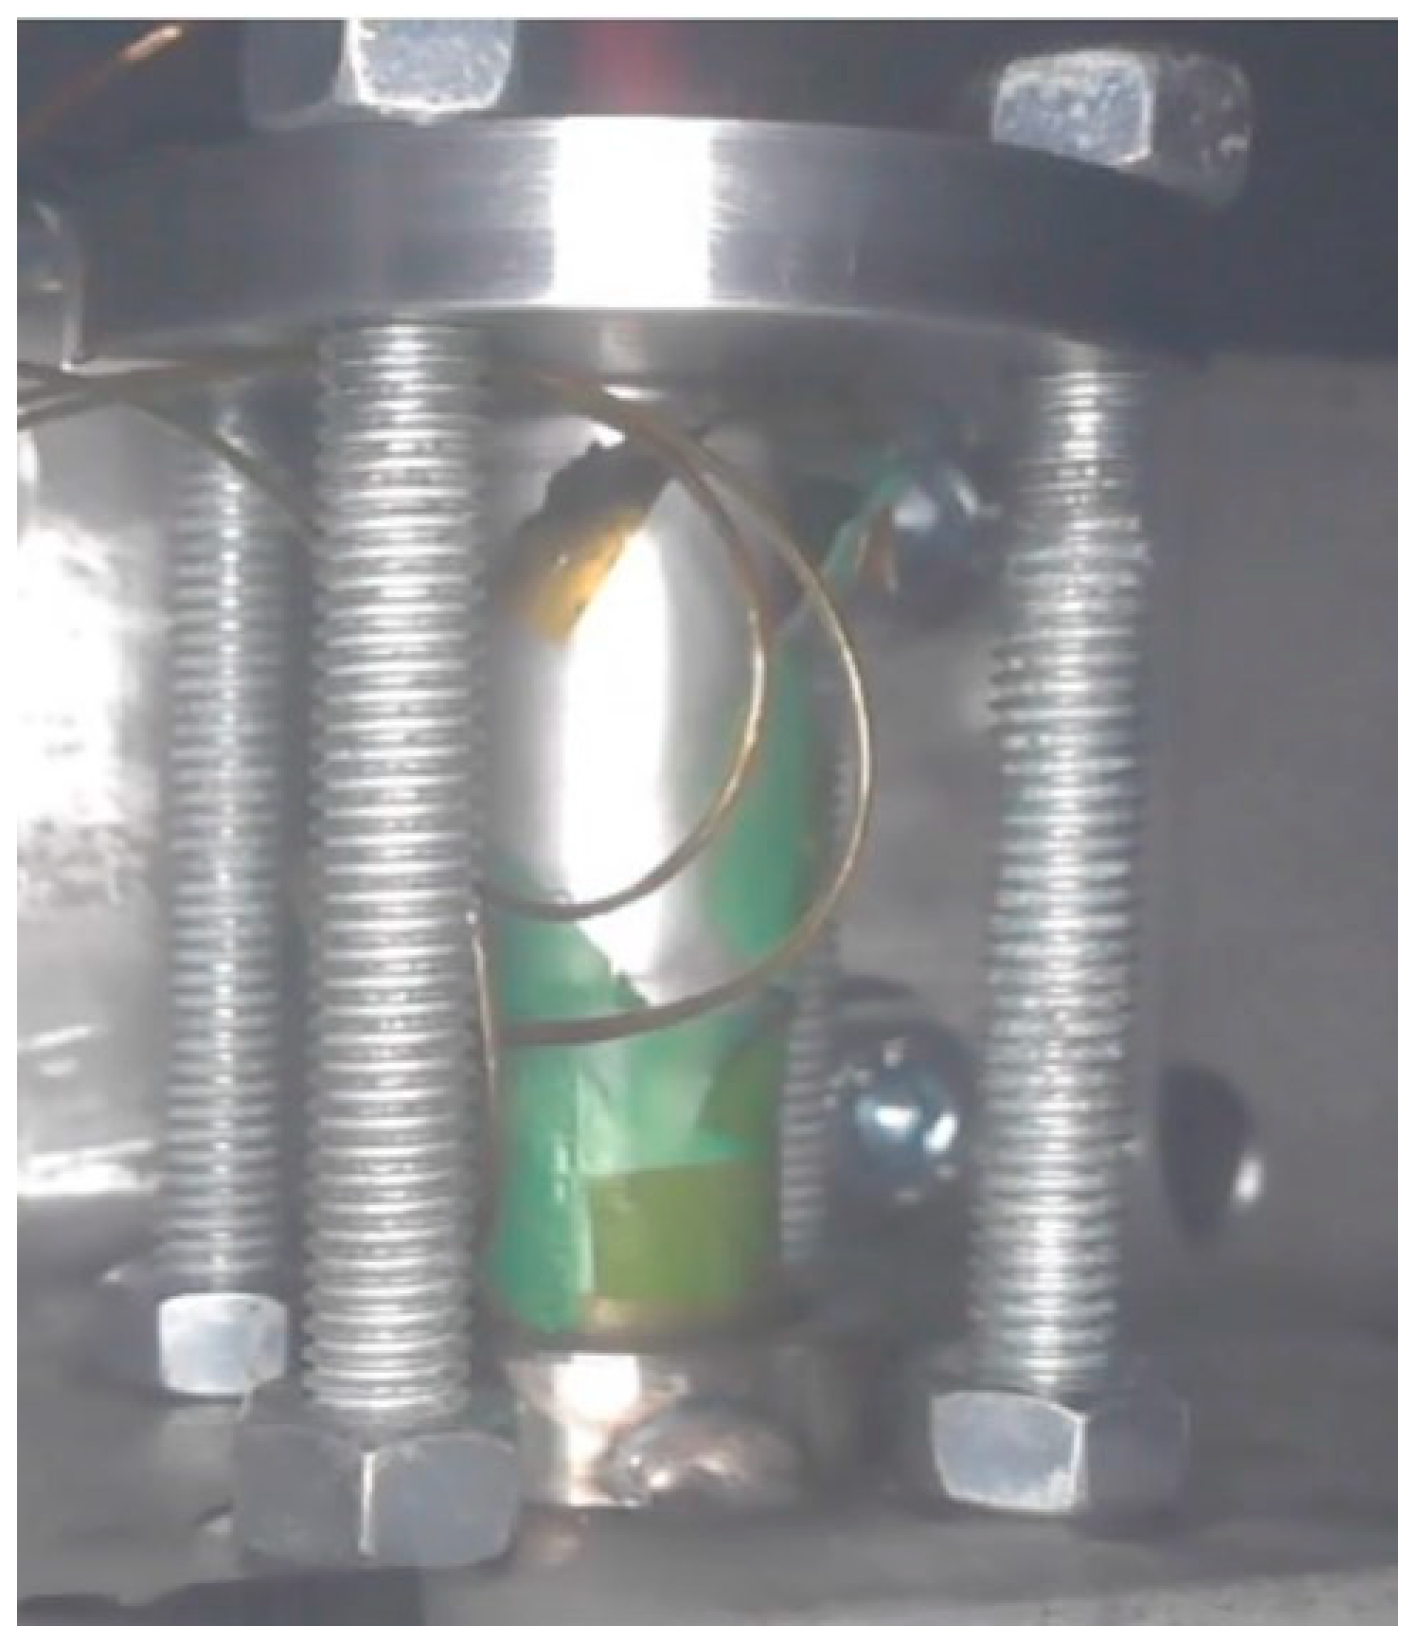
3.1.3. Cell Performance in Nail Penetration Tests

Nail penetration tests were performed for both SIB and NMC chemistries (see Figure 7). The cell TR starts with the cells at an ambient temperature and is induced by the internal heat-up of the cell due to the short circuit caused by the nail. For both cells, the open circuit voltage (OCV) shows anomalies around 15 s before TR, visible as a deviation from its steady value before the nail penetration (see top panels of Figure A4 and Figure A5), confirming the reliability of this test. Sensors on the bottom of both cells showed an exponential increase in temperature, followed by simultaneously occurring venting and TR events, as indicated by the sudden increase in pressure as well as temperature (see bottom panels of Figure A4 and Figure A5). The cells reached peak temperatures shortly after nail penetration (see Figure A5 and Figure A6). The peak temperature on the lateral surface of the SIB cell was recorded at around 380 °C (see Figure 7), while the NMC cell showed peak surface temperatures of nearly 450 °C (see Figure 7). Both cells ejected hot gas streams from the venting and puncture openings shortly after penetration in agreement with Finegan et al. [18] for similar nail penetration through longitudinal penetration of cylindrical cells. In addition, the NMC cell showed a very violent TR behavior, with sparks and flames emitted from the venting and puncture opening due to the violent reaction of the cell’s internals (see Figure 7, Figrue A6 and Figure A7). The high reactivity of the NMC chemistry compared to LFP and SIB is confirmed, regardless of the thermal trigger method used to initiate the TR.

3.2. Trigger Method Performance Across Different Cell Chemistries

In order to compare the cell chemistries during tests with a respective trigger method, the temperature gradient (temperature rise rate) as a function of the temperature was used, Figure 8.
During CH tests (see Figure 8), the NMC cell shows the highest temperature gradient (around 70 K/s), while SIB and LFP cells heat up more slowly and show comparable temperature gradients (below 20 K/s). LFP has been described to show stability superior to 500 °C [9], and we consequently consider that the LFP has not reacted during this TR event. Few data are available for the SIB cathodic material but based on the similarity of the data from the SIB and LFP cells in Figure 8a, it appears reasonable to consider that the Na0.8Ni0.32Fe0.34Mn0.34O2 material has not reacted, or at least not significantly. Furthermore, the NMC cell shows a significant temperature rise rate above 400 °C, indicating an ongoing heat generation due to the reaction of the materials within the cell in this temperature range. Such observation agrees with an NMC 811 combustion phenomenon, taking into account the material stability limit to be inferior to 240 °C in a charged state [10]. Furthermore, Figure 8 shows two distinct local maxima of the temperature rise rate for the cells. This feature is most visible for the SIB and NMC chemistries, and only marginally appears for the LFP cell. We attribute this behavior to the non-uniform heating of the lateral surface of the cells. This leads to a partial overheating of the cell in the vicinity of the heating pad, initiating the TR locally. When the TR occurs, we intuitively consider that other parts of the cell body must be further heated before they can contribute to the TR too.
The temperature gradients recorded during the HWS tests (see Figure 8) again show the highest gradient for the NMC cell (peaking around 100 K/s). Additionally, the temperature rise rate is increasing at lower temperatures (at around 170–190 °C) compared to the SIB and LFP chemistries (above 200 °C), while the temperature is further increasing at higher temperatures (above 500 °C) than for LFP and SIB cells. The SIB cell shows temperature gradients of up to 40 K/s, while the LFP cell shows temperature gradients peaking at 10 K/s. The results of both CH and HWS experiments are comparable in terms of the occurrence of the venting event prior to the TR of the cells. The temperature rise vs. temperature appears relatively unchanged for the LFP and the NMC cells between Figure 8a,b, but it is obviously not the case for the SIB cell. This will be discussed in the next Section 3.3. Furthermore, it is evident that the time between the occurrence of the venting and TR events is significantly higher for the HWS tests, owing to the moderate heating ramp.
During nail penetration tests, the NMC cell again shows the fastest temperature increase on its lateral surface with the temperature rise rate peaking at nearly 165 K/s. The SIB cell on the other hand shows a lower temperature rise rate peaking at around 60 K/s. In any case, the nail penetration triggering method allows the earliest and fastest temperature increase in all experiments. Again, the NMC cell is still showing a temperature increase in a temperature region where the SIB cell is not heated up further (above 380 °C). It agrees with the visual observations, the NMC cell shows sparks and a flame (Figure 7d and Figure A7) while only gas and smoke are released with the SIB cell (Figure 7c and Figure A6). Due to the nature of the testing protocol, the nail penetration experiments conducted with SIB and NMC cells show a different temperature evolution than CH and HWS tests with steady temperature signals before TR. Furthermore, as venting and TR events appear to happen simultaneously, both pressure and temperature are not applicable as early detection methods. For these tests, the open cell voltage seems to be a reliable indicator of the impending thermal event (see Figure A5 and Figure A6).
Comparing the peak lateral surface temperatures reached during the experiments of all three initiation methods, the measured peak temperatures during the nail penetration experiments are comparable to the CH tests and around 150 K lower than for the HWS tests, as the heat sources (internal for nail penetration and external for CH) are not homogeneously heating the cells during these tests. In terms of weight loss, no clear trend could be identified for the distinct trigger methods, as this parameter is highly influenced by cell chemistry.
The temperature rise rate of the HWS tests shows the highest homogeneity (see Figure 8), in agreement with the observation reported in Section 3.1, with the lateral surface sensors showing a close evolution for each chemistry. This homogeneity is not visible for the other initiation methods. We attribute this narrow temperature distribution within the cell to the highly homogeneous temperature distribution induced by the HWS method, in agreement with Figure 6. This allows more material to be able to reach a critical state simultaneously and thus contributes to heat generation at the same time.

3.3. Chemistry Performance Across Different Trigger Methods

Generally, the LFP cells showed the least severe TR behavior during the tests, followed by the SIB and NMC cells (see Figure 5, Figure 6 and Figure 7). In terms of mass loss, this order is also evident, with the lowest mass loss for the LFP cells and the highest mass loss for the NMC cells. However, while the mass losses of both LFP and NMC cells are comparable for CH and HWS tests, the mass loss of the SIB cell during the HWS-initiated TR was significantly higher (more than half of the cell’s mass) than that during the CH tests (less than 20%) as reported in Section 3.1. We attribute this to the more uniform heating of the cell during the HWS test, resulting in a more uniform conversion of the cell materials during TR.
Figure 9 confirms the very similar and limited temperature rise rate for the LFP cells both for the CH and HWS tests. We can claim the TR events of the LFP cell do not appear to be affected by the choice of the thermal trigger method. This limited temperature gradient is beneficial in terms of safety and thus enables reductions in temperature dissipation and thermal insulation measures, while significantly lowering the risk of thermal runaway propagation.
As previously stated in Section 3.1 and Section 3.2, the SIB cell shows an obvious difference in behavior between the CH and HWS tests. The temperature gradient is very limited, <20 K/s, with the CH test. The values are even close to zero for temperatures above 410 °C. For the HWS test, a temperature gradient greater than 30 K/s is recorded at 450 °C. The highest temperature rise is observed with the nail penetration test, at 70 K/s. These differences in reactivity between the CH and HWS tests are also in agreement with the gas, as discussed in Section 3.4. (see Figure 9). These figures are considerably higher than for the LFP cells, necessitating more sophisticated measures in terms of heat dissipation and propagation mitigation.
The first observations always reported violent reactions of the TR scenarios with the NMC811 cells, i.e., sparks, flame and even explosion for the CH and HWS tests. The NMC811 cell shows the highest temperature rise rates with values higher than 160 K/s for the nail penetration, ca. 100 K/S for the HWS test and greater than 60 K/s for the CH test (see Figure 9). The temperature gradient is significant in all cases above 400 °C. Consequently, NMC811 cells are the most demanding cells among all tested when considering the safety measures to be planned in a BEV application.
For all conducted NMC811 tests, the measured peak temperatures as well as the computed temperature rise rates align with the scenario of a very energetic auto-combustion of the NMC material, as reported by Liu et al. [10] and the very high temperature reached at the TR. The limited temperature of the TR as well as the low temperature rise rate during the TR of the LFP cell can be explained by the very stable thermal properties of the LFP cathode up to 500 °C even when fully charged [9]. Assuming a similar reactivity for the anode materials of LIBs and SIBs, a contribution of the SIB cathode material to the TR characteristics of the herein-tested SIB cell can be concluded. This is further supported by studies showing metal oxides other than NMC contributing to the cell TR [8,10].
To help the reader, a summary of the main data for different TR events is presented in Table 2. The weight loss illustrates the difference between cathodic material chemistry and the triggering method on the thermal runaway of the cells. Intuitively, we consider that high weight loss corresponds to an important loss of materials, either by combustion or by ejection, i.e., the more reactive the material, the more limited its thermal stability.
From the previous paragraph, we can summarize the cathodic material stability as LFP >> Na0.8Ni0.32Fe0.34Mn0.34O2 (SIB) > NMC:
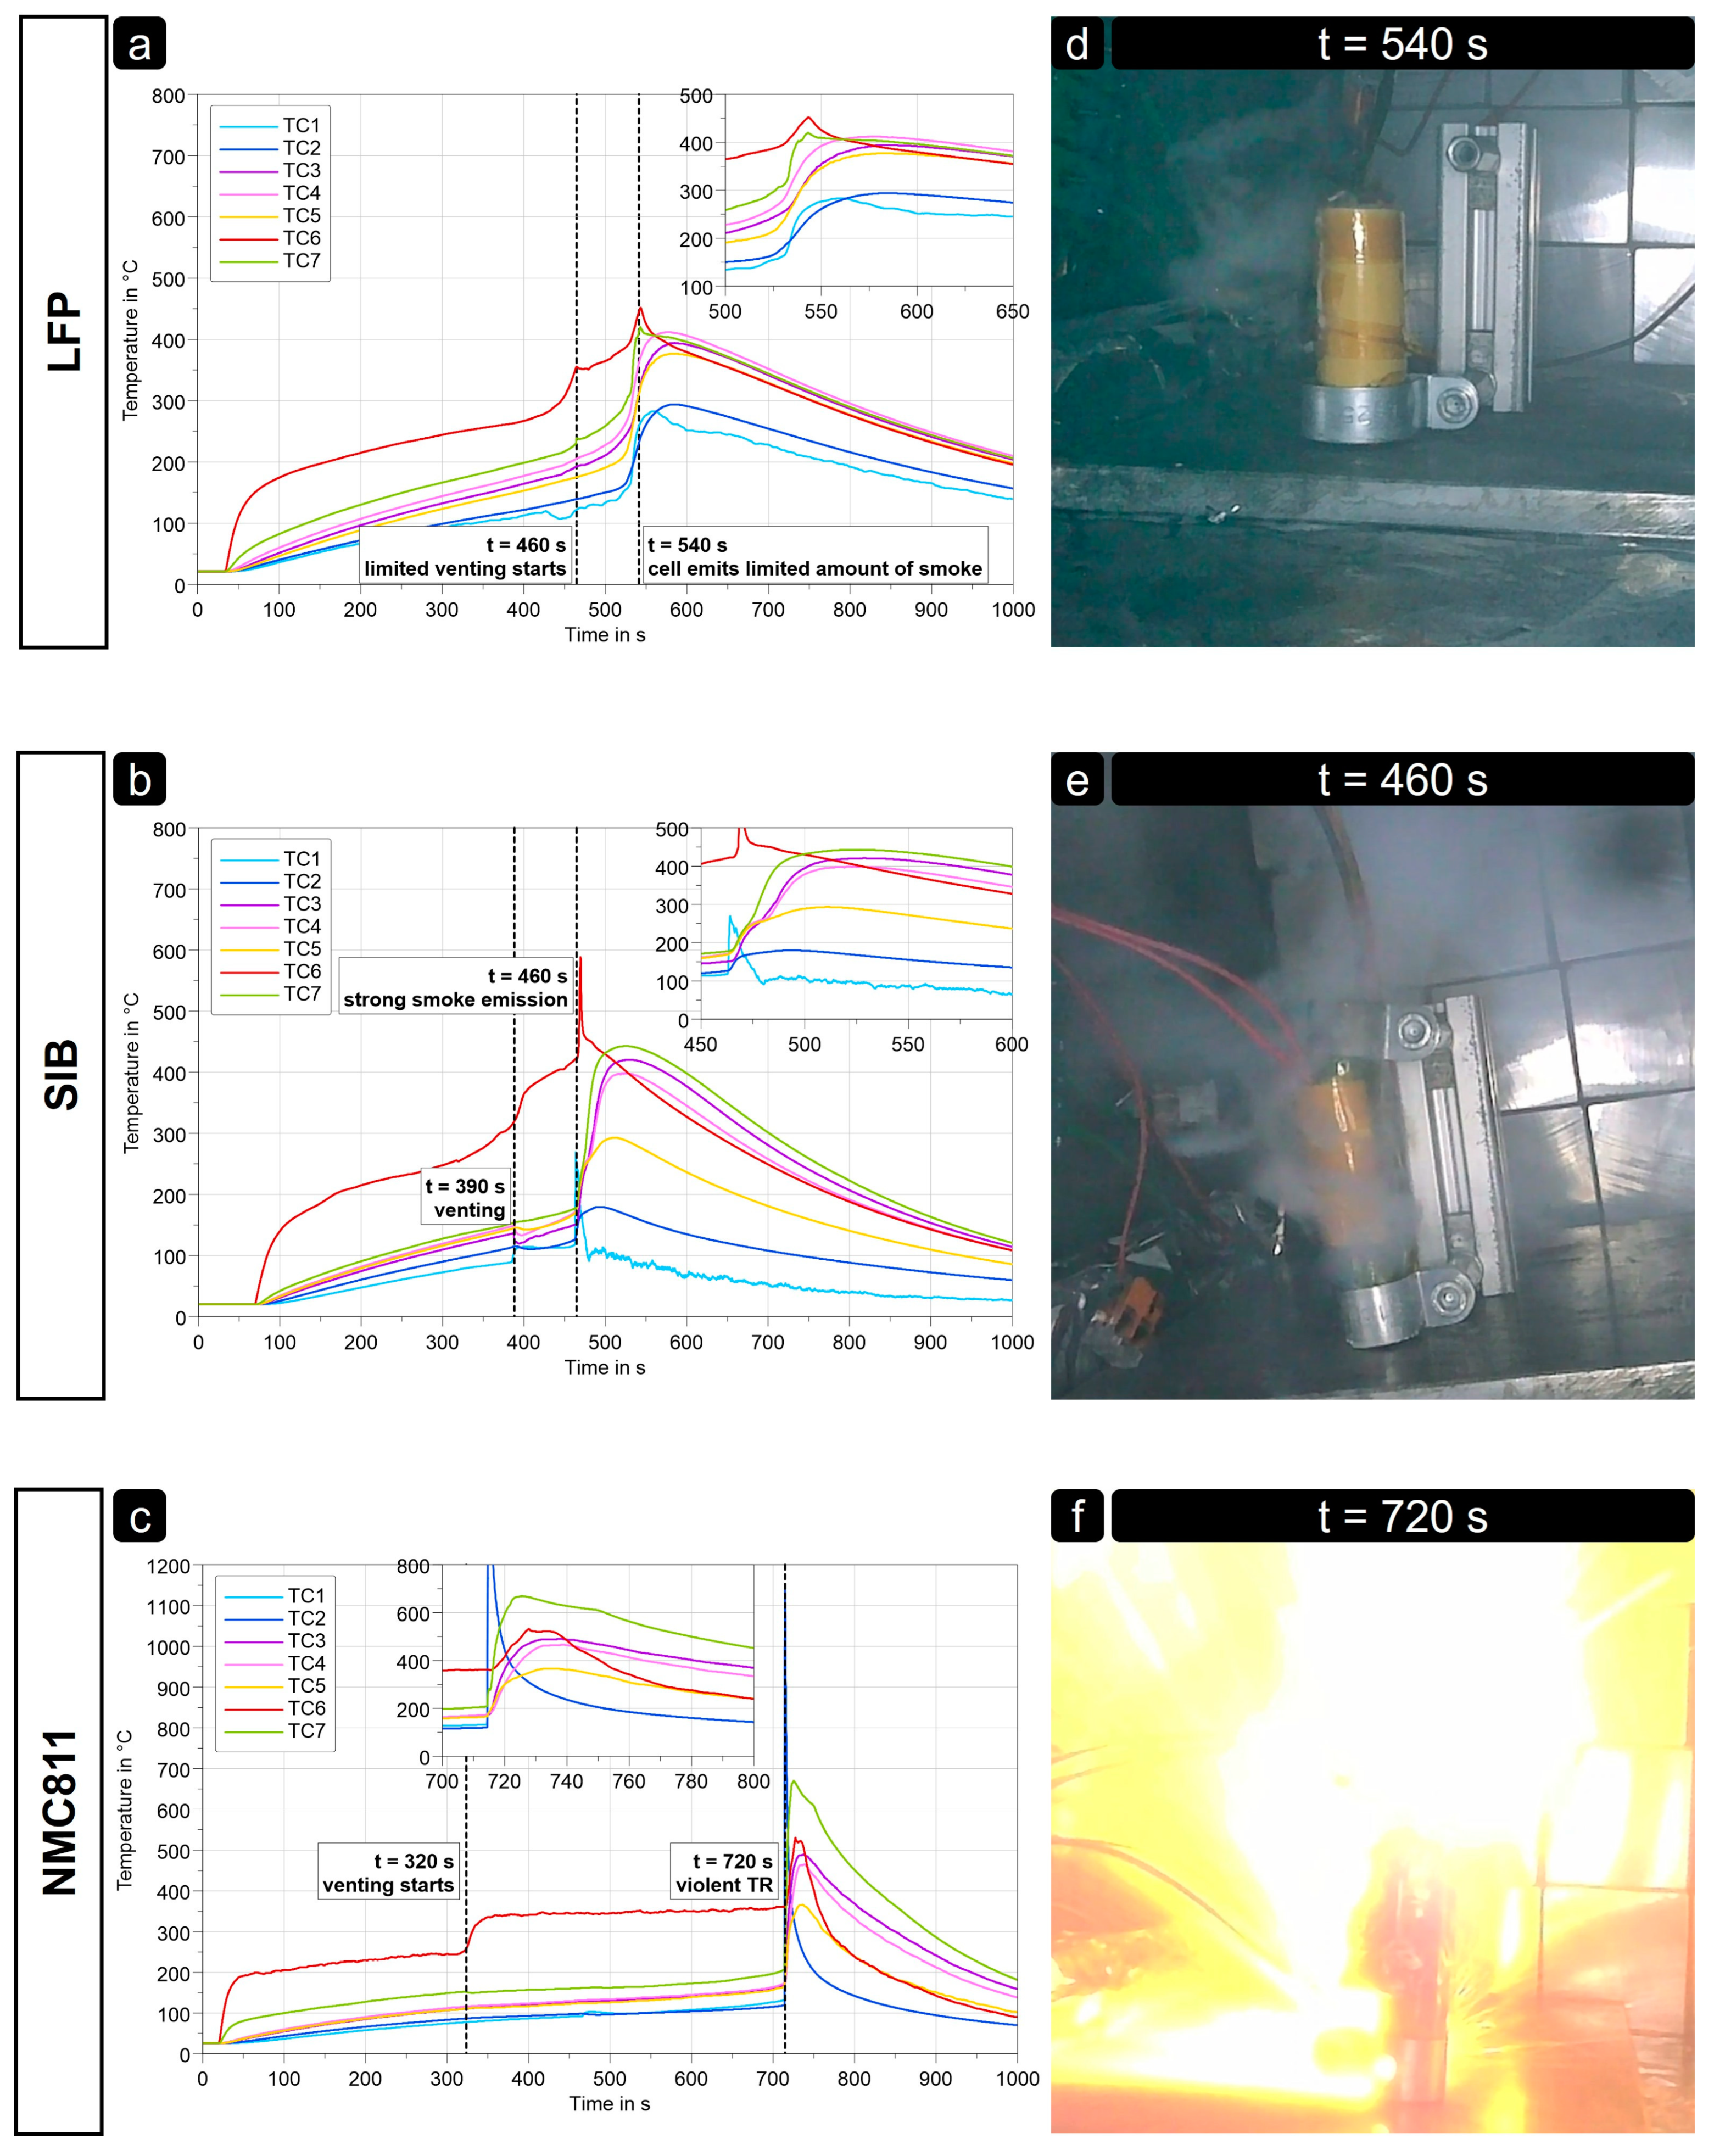
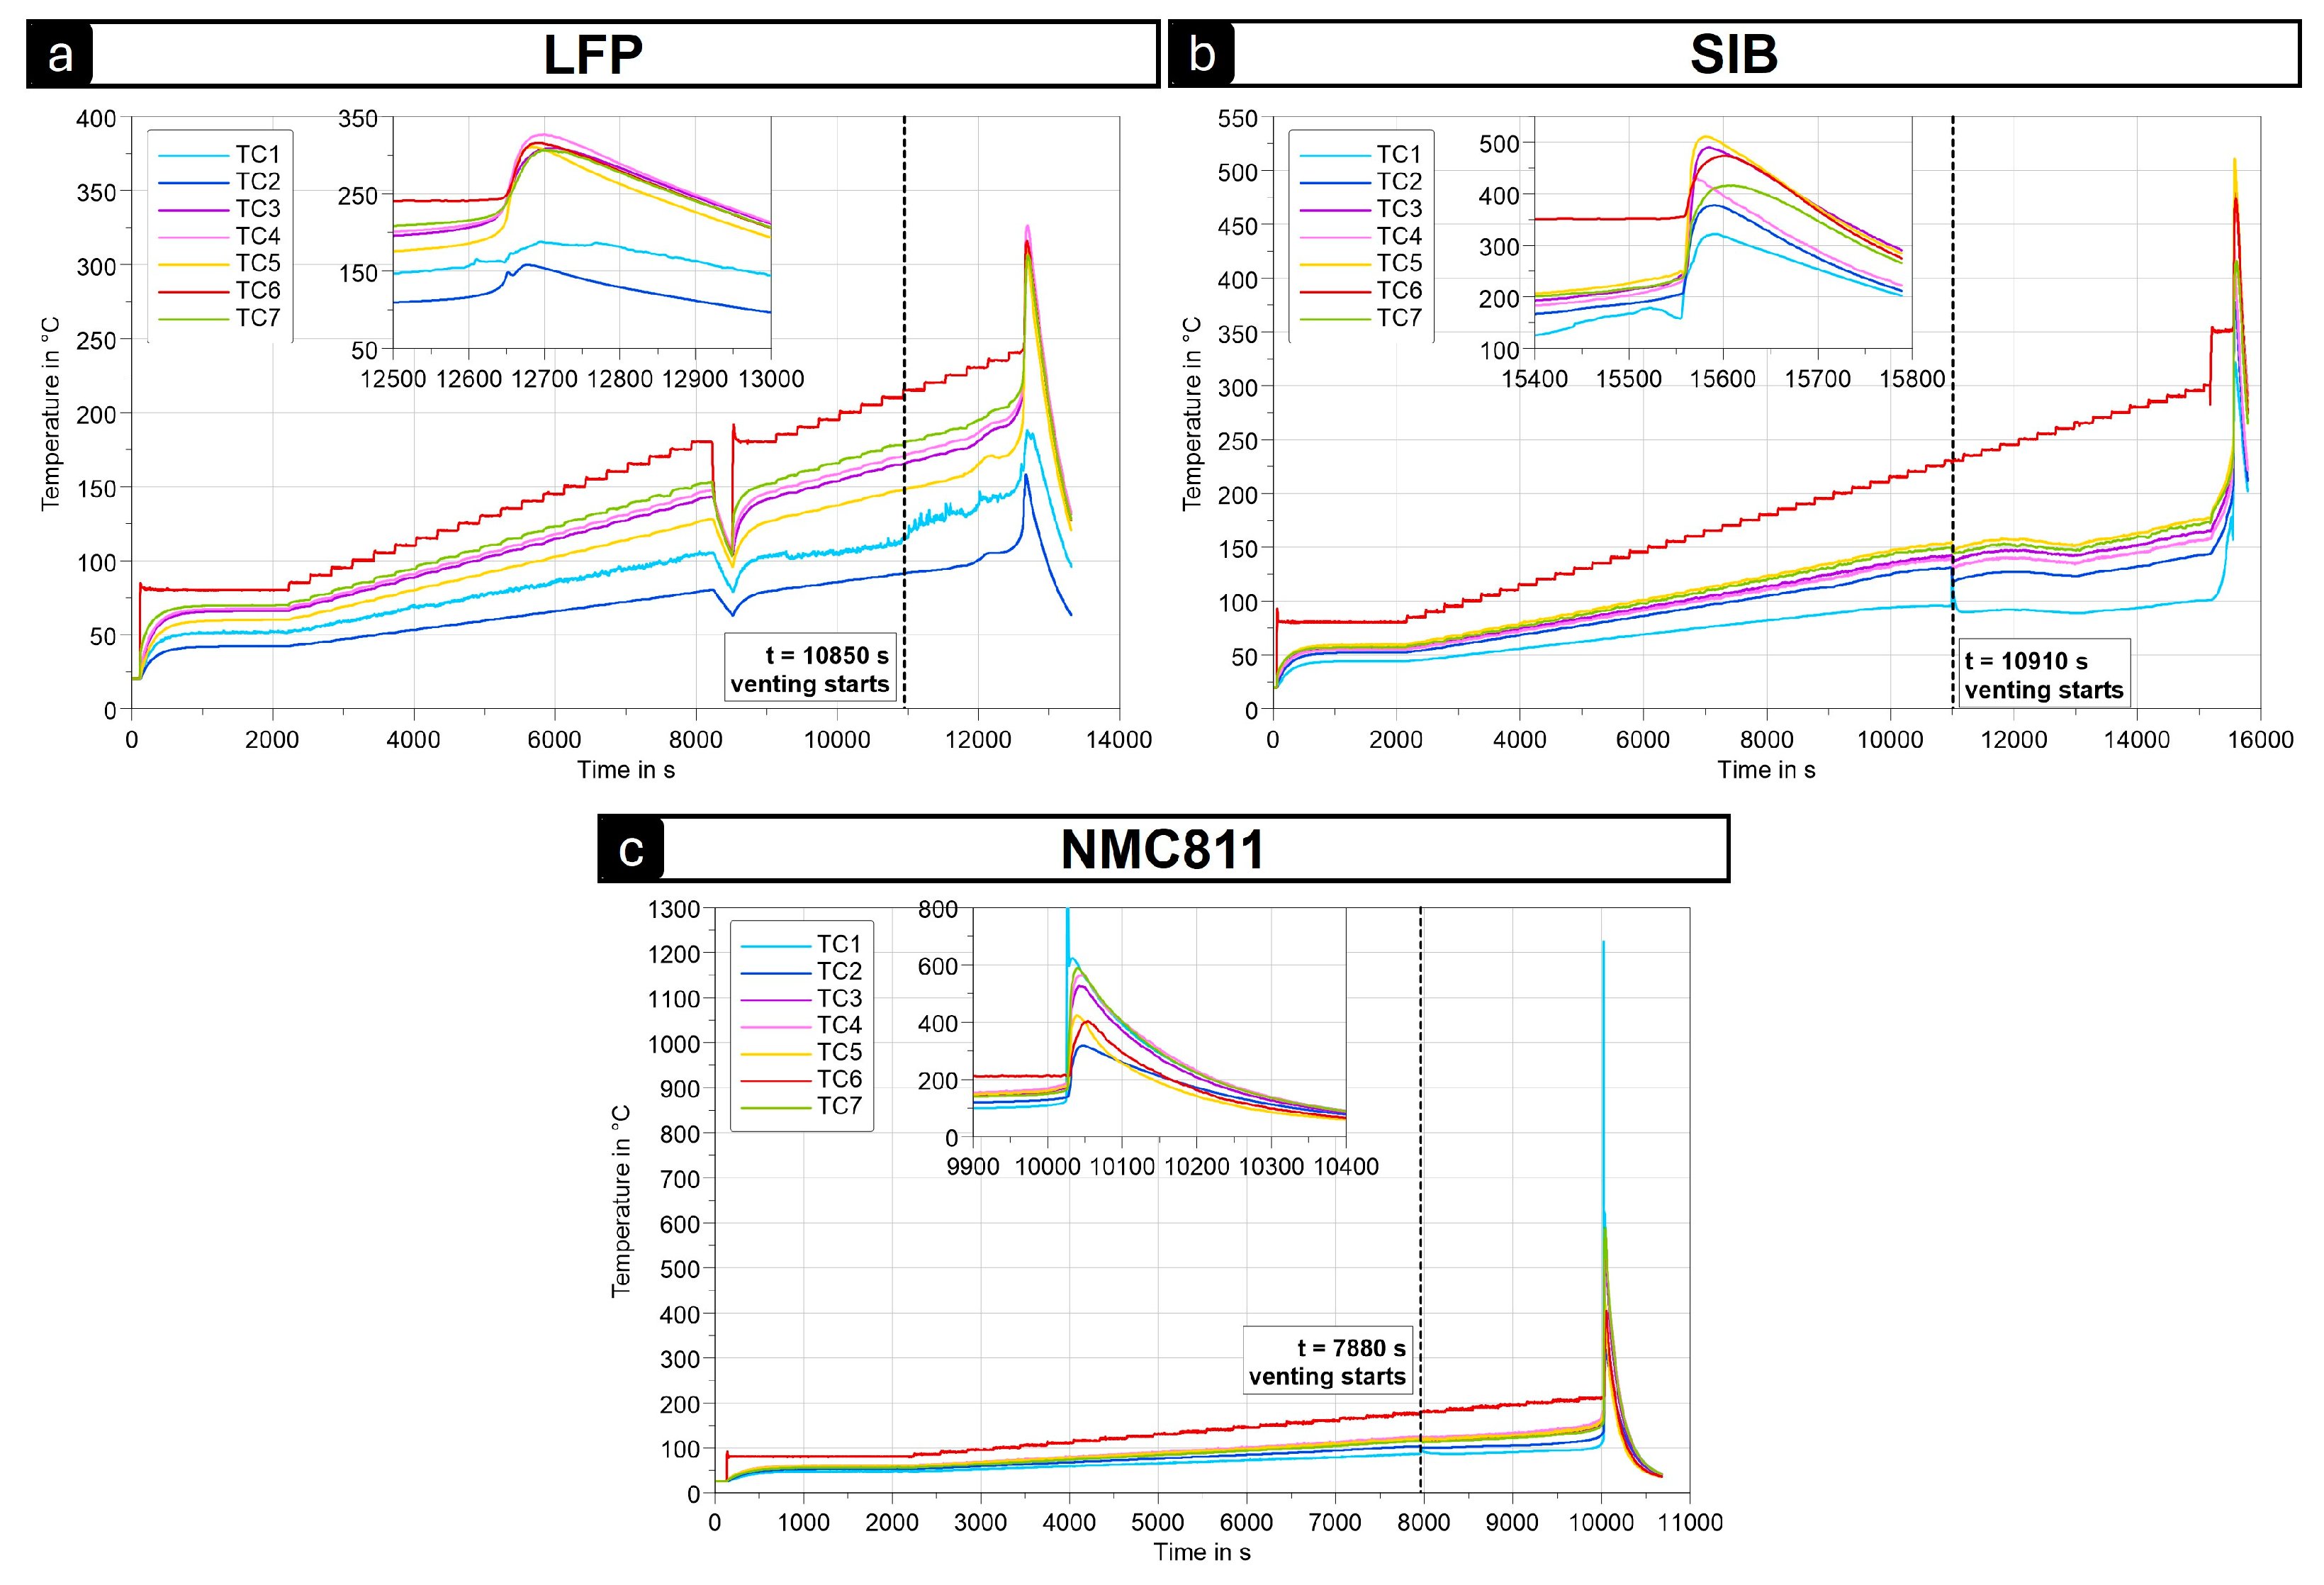
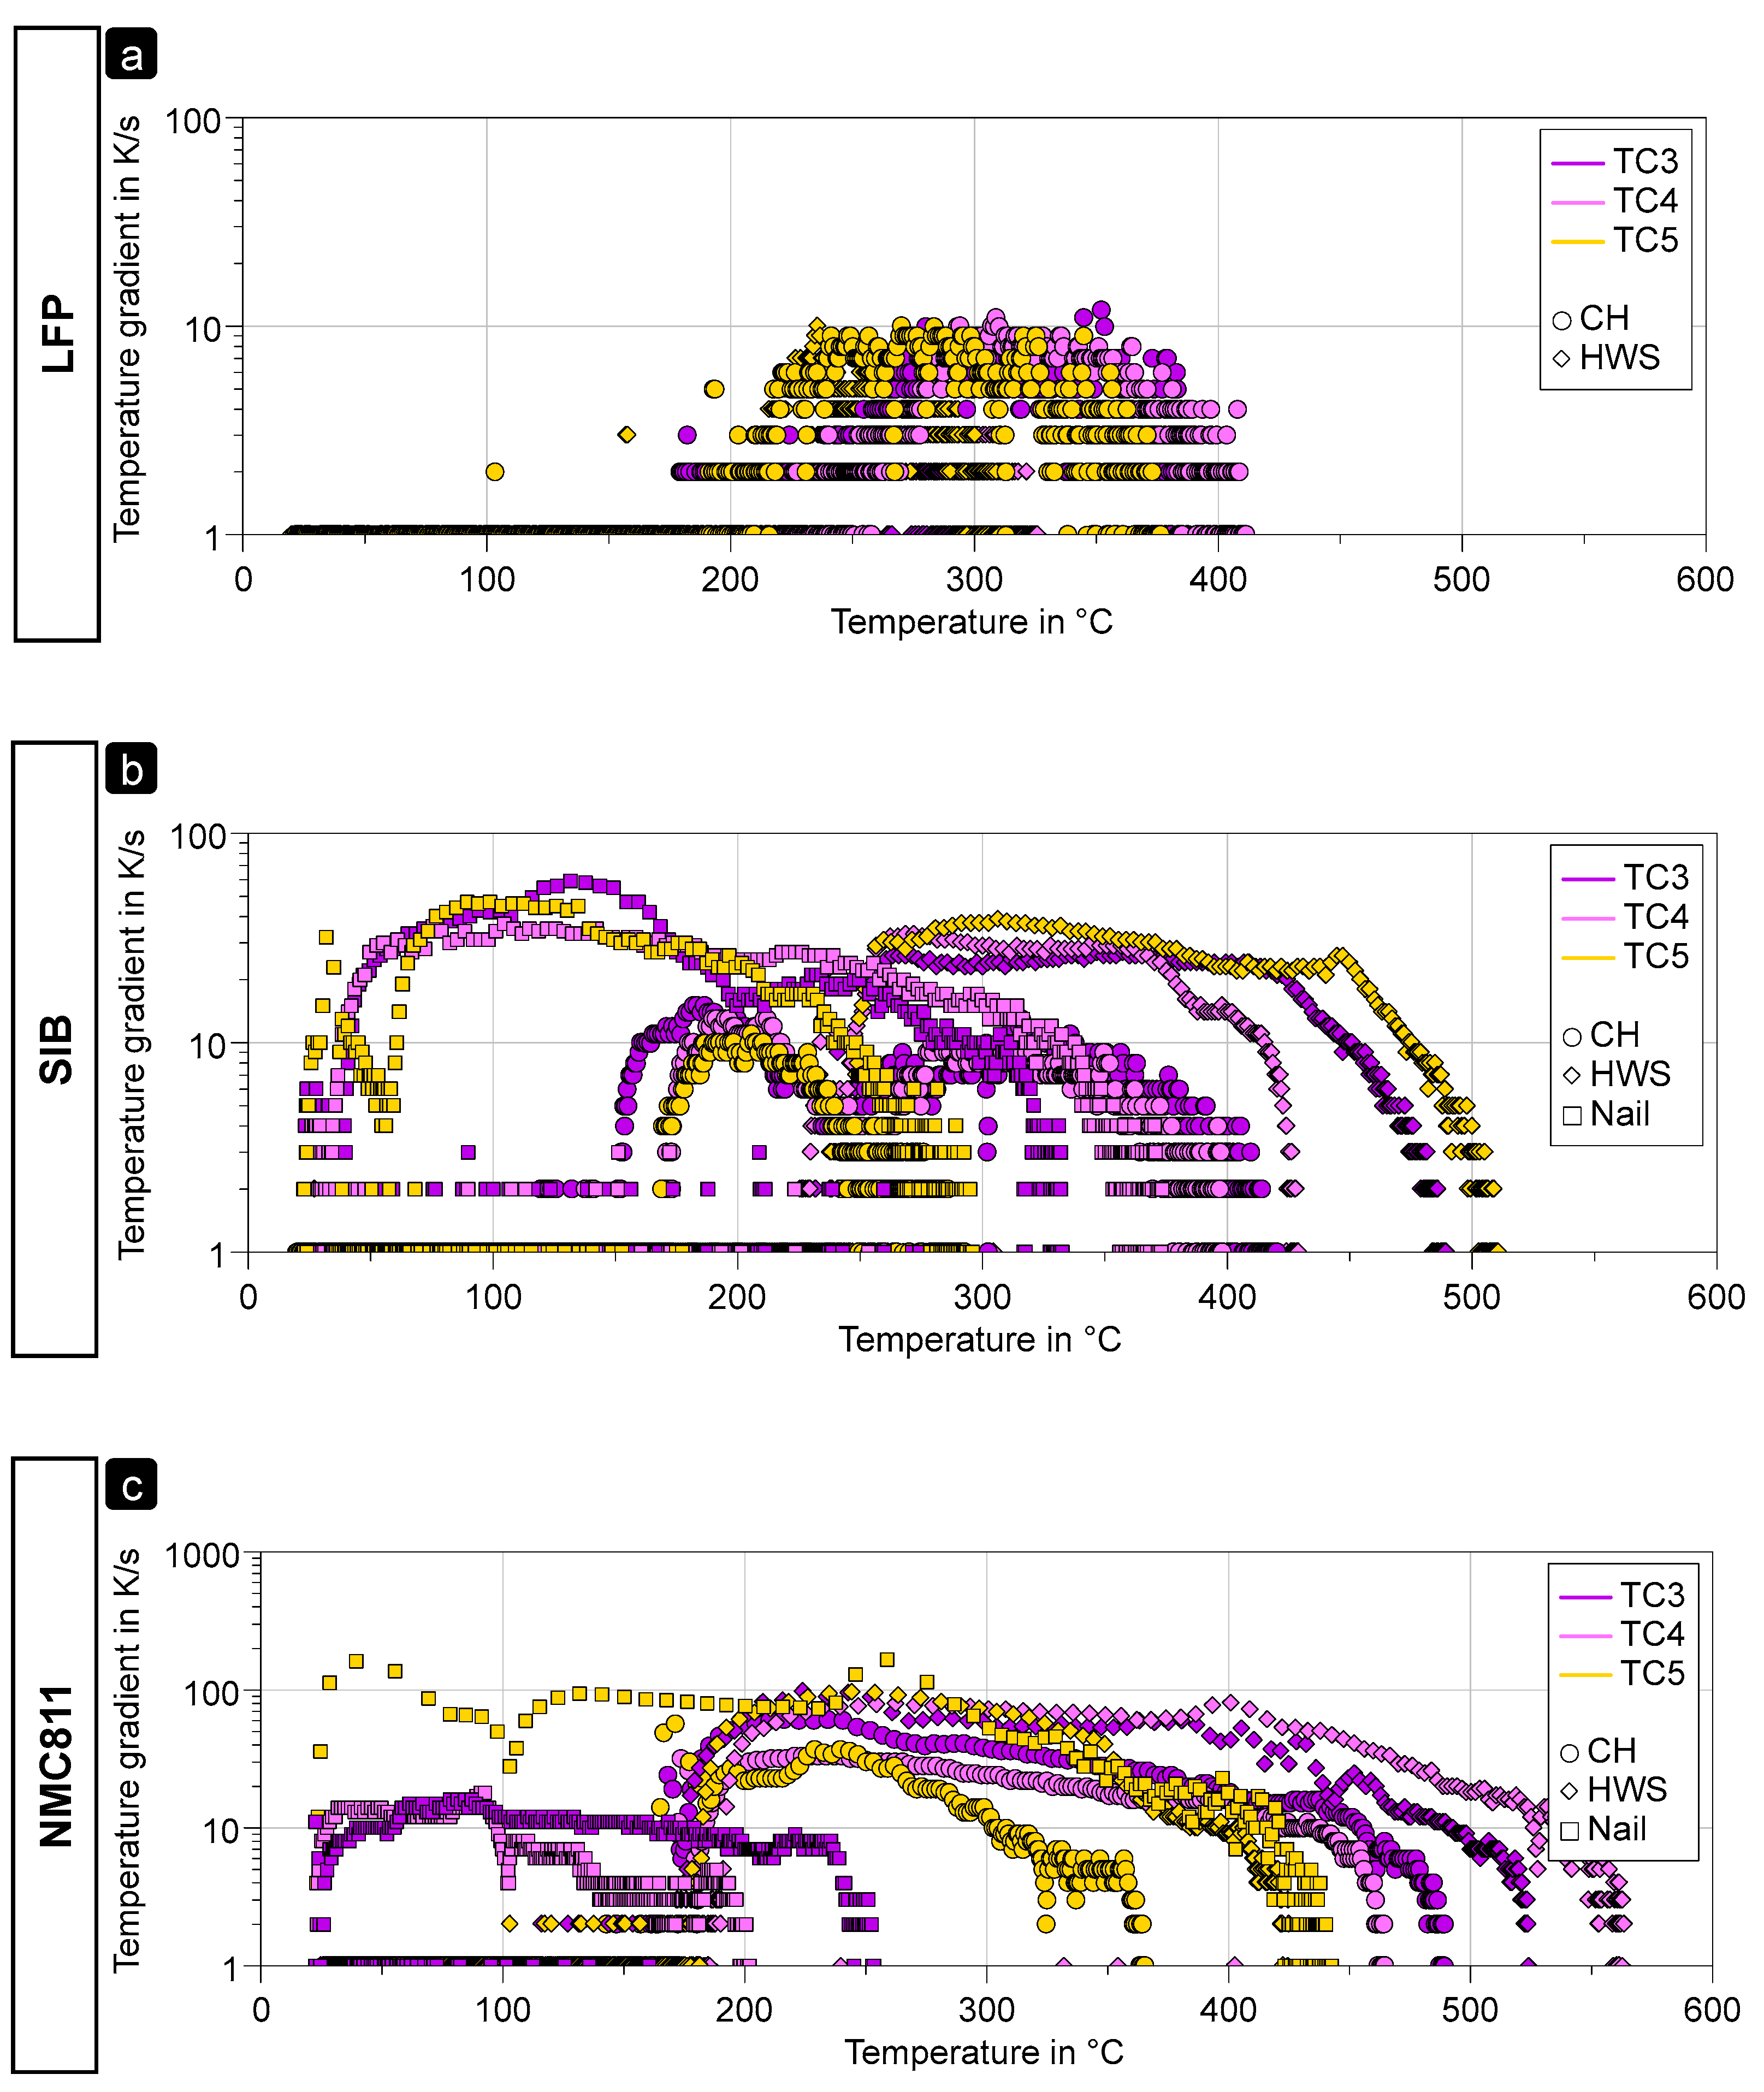
  • The LFP, as a lithium metal phosphate, has a thermal stability superior to 500 °C [9] even in a fully charged state. Based on the maximum cell body temperature recorded, we can reasonably suppose that LFP did not contribute to any TR event (both CH and HWS) or very little, which agrees with the limited temperature gradient of ca. ≤10 K/s (Figure 9a and related discussion) and weight loss < 20%.
  • NMC811 is described as very reactive, especially when fully charged, with thermal stability inferior to 240 °C [10], while the maximum temperature recorded of the cell body is always superior to 650 °C. Thus, combustion and/or ejection of the NMC811 during the TR events (see Figure 5f) are very likely to have occurred, in agreement with a high-temperature gradient (>60 K/s for CH and >90 K/s for HWS; see Figure 9c and related discussion) and a weight loss always superior to 60%.
  • We suppose that the cathodic material of the SIB, Na0.8Ni0.32Fe0.34Mn0.34O2, has a thermal stability relatively close to that of the alkali metal oxides used in the LIB:
    With the CH trigger method, the temperature in the SIB cell is probably not sufficient to lead to any significant degradation of the cathodic material, leading to a limited temperature gradient ≤ 20 K/s (Figure 9b and related discussion) and a weight loss inferior to 20%.
    With the HWS trigger method, the SIB cell is homogeneously heated, and more energy is released during the TR event, with a temperature gradient of ≈40 K/s (Figure 9b), allowing a reaction of the cathodic metal oxide, in agreement with a weight loss > 50% and significant gas release.

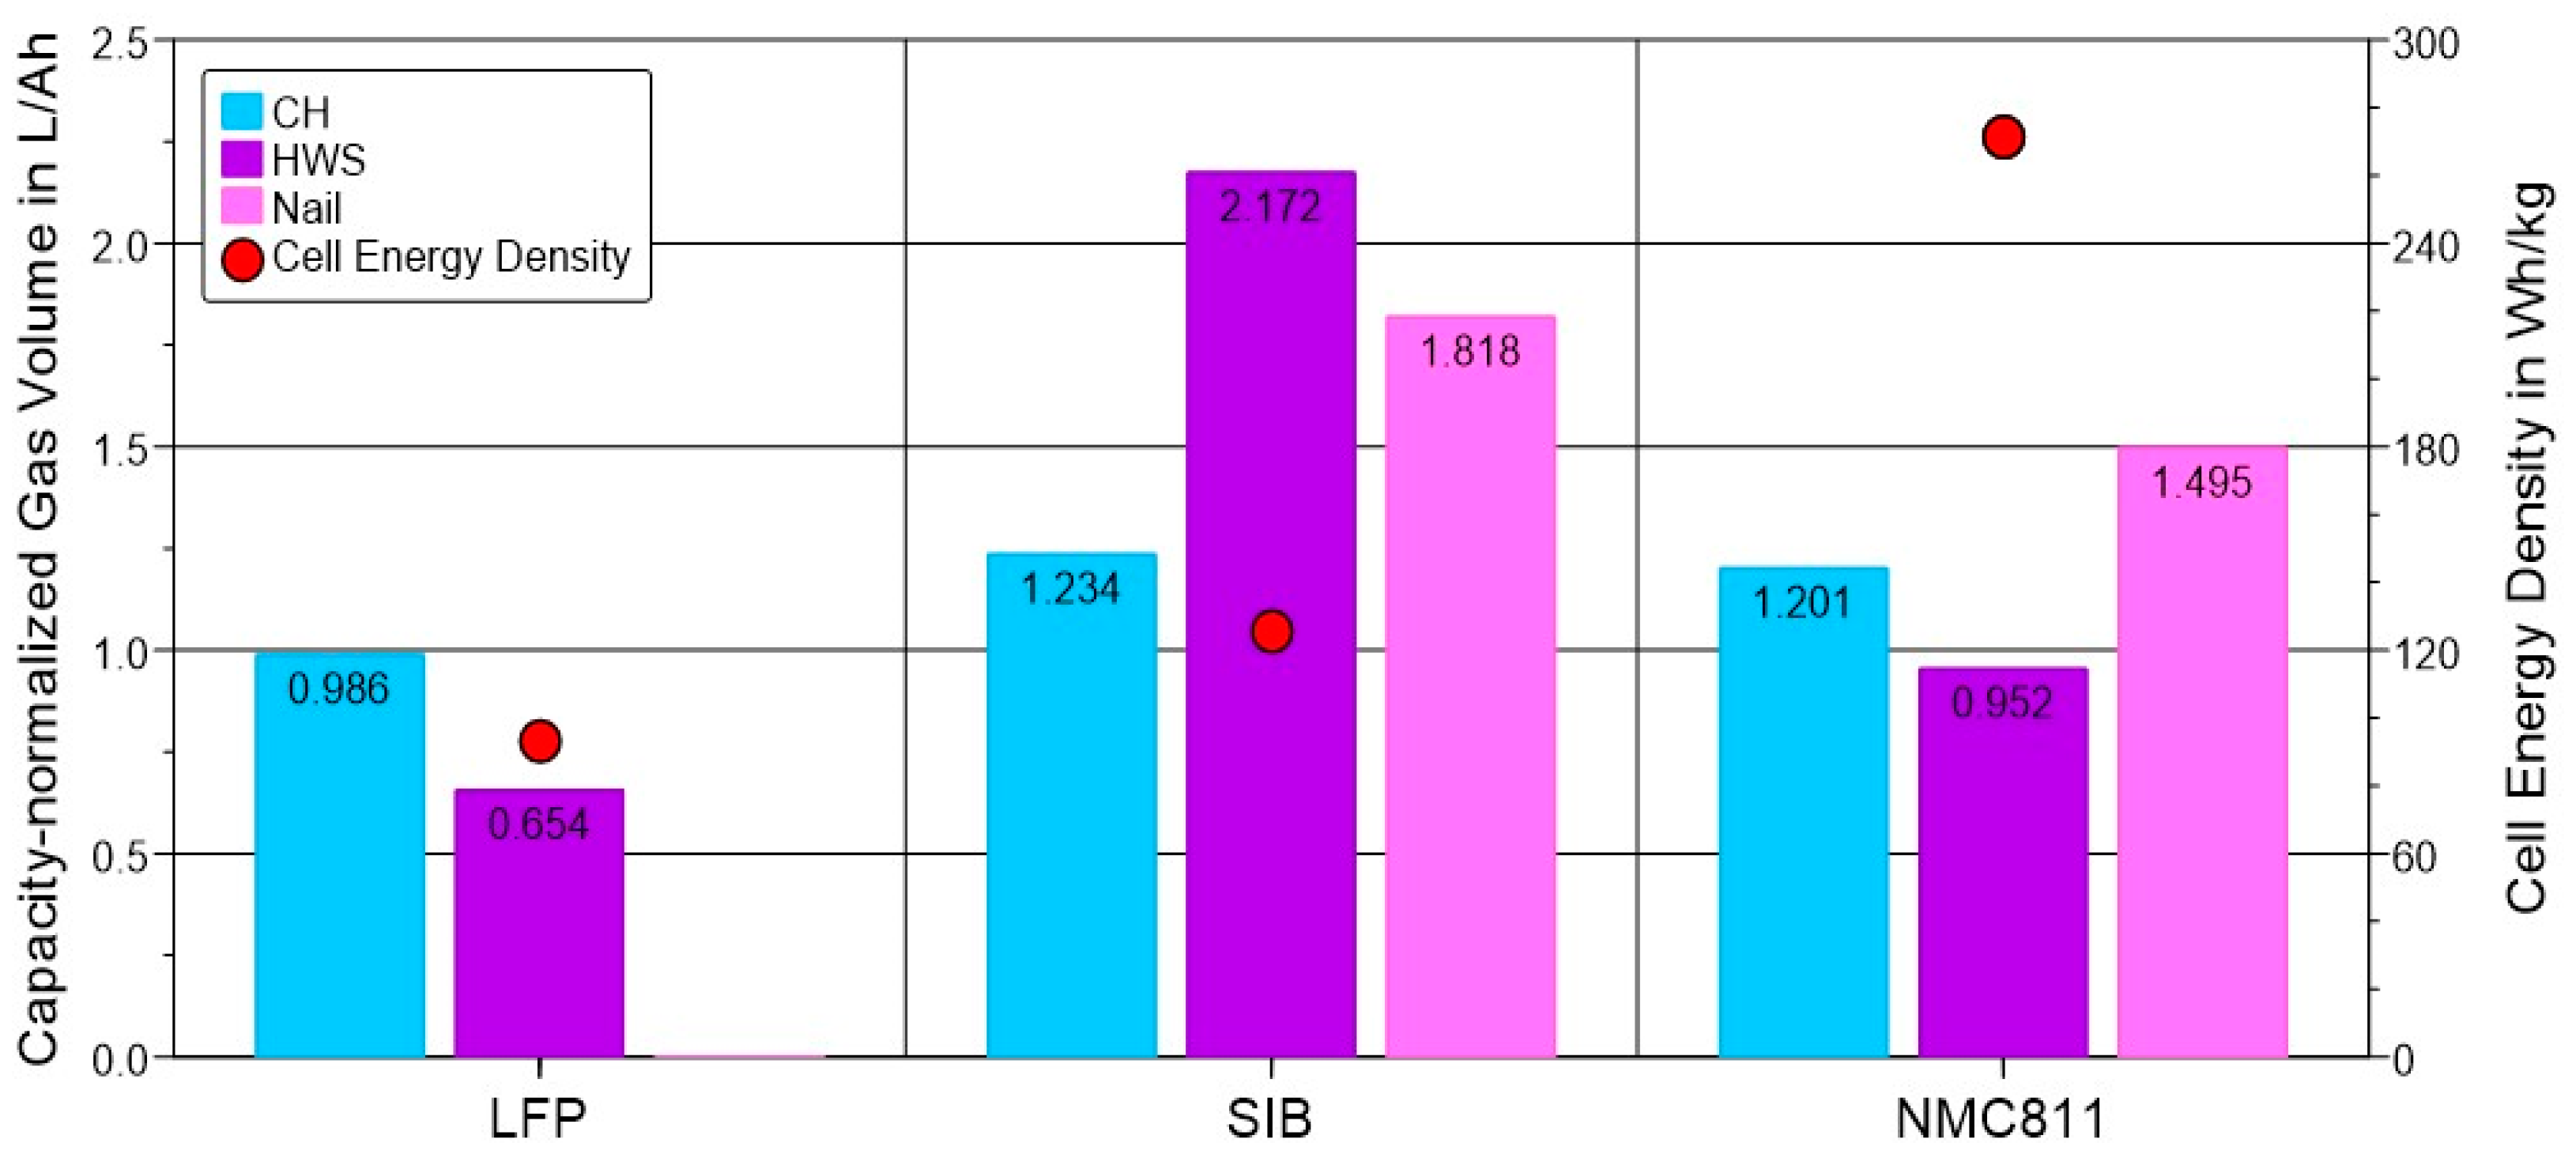
3.4. Gas Emission: Combined Impact of the Cell Chemistry and Trigger Method

The gases emitted during the venting of the cells were for all cells mostly composed of dimethyl carbonate (DMC), ethyl methyl carbonate (EMC), hydrogen (H2), carbon dioxide (CO2), and carbon monoxide (CO), with the rest represented by other hydrocarbons. These results are in line with the electrolytes being composed of organic carbonate compounds for all investigated chemistries [25,26,28].
The quantification of the amount of gas emitted by the cells during the test protocols shown in Figure 10 reveals unexpected results. Note that the values for the HWS tests have a higher margin of error due to the short sampling time after TR. As expected, the gas volume emitted by the cells after TR is dependent on both testing protocol and cell chemistry. The amount of gas is affected by the degradation path of the electrolyte. In agreement with the literature, the LFP cells show a much smaller capacity-normalized gas emission (L/Ah) compared to the NMC811 cells.
Unexpectedly, the normalized gas emission of the SIB chemistry is for all testing protocols higher or at least equal to that of NMC cells and significantly higher than that of the LFP cells. The SIB cells are usually considered safer than the Li-ion cells, as evidenced by enhanced stability at 0 V [29,30]. However, our tests indicate that this may not be the case in the charged state. As previously reported, the electrolytes and anodes of the SIB [31], even if not identical, are very similar to their LIB counterparts [32], being carbonate-based and carbon-based, respectively. In the case of the investigated samples, however, the charged cathodic materials are quite different—a transition metal oxide for the SIB and the NMC811—while the LFP cell features polyanionic Li1−xFePO4. It is very difficult to predict the amount of gas released for each cell as it is influenced by numerous factors that remain unknown for the final user of the cell, for example, the cell design, the active materials and the electrolyte present in the cell and their respective quantity, and the surface area of the electrodes.
Based on the established knowledge [14,15], during the heating of the cells, gas is emitted first by the continuous reaction of the electrolyte with the anode material when the SEI is not thermally stable anymore (T > 110–120 °C). Subsequently, when a short circuit is created by the separator melting (this is also the case of nail penetration), the additional heat generated accelerates the electrolyte/anode reaction and electrolyte evaporation. At high temperatures, typically above 200 °C, the hot metal oxide present in the SIB contributes to the gas emissions during thermal runaway, similar to the reported degradation of NMC [8,11]. On the other hand, LFP-based cathode materials are known to be stable up to 500 °C and thus to contribute poorly to the heat and gas release during thermal runaway [8,11].
When looking at the safety issues of thermal runaways, especially the safety of passengers, it appears obvious that there is no completely safe battery technology today. However, based on our experimental tests, the LFP cells appear to be less at risk compared to the SIB and NMC811 cells. SIBs are considered a safe technology compared to LIBs, but we have shown in the present study that this is not necessarily the case. Safety knowledge must always be adapted to the evolution of battery technology. Another important safety factor for BEVs is how the battery is designed to prevent, delay, or limit the consequences of TR and propagation phenomena, but this is not the topic of this work.

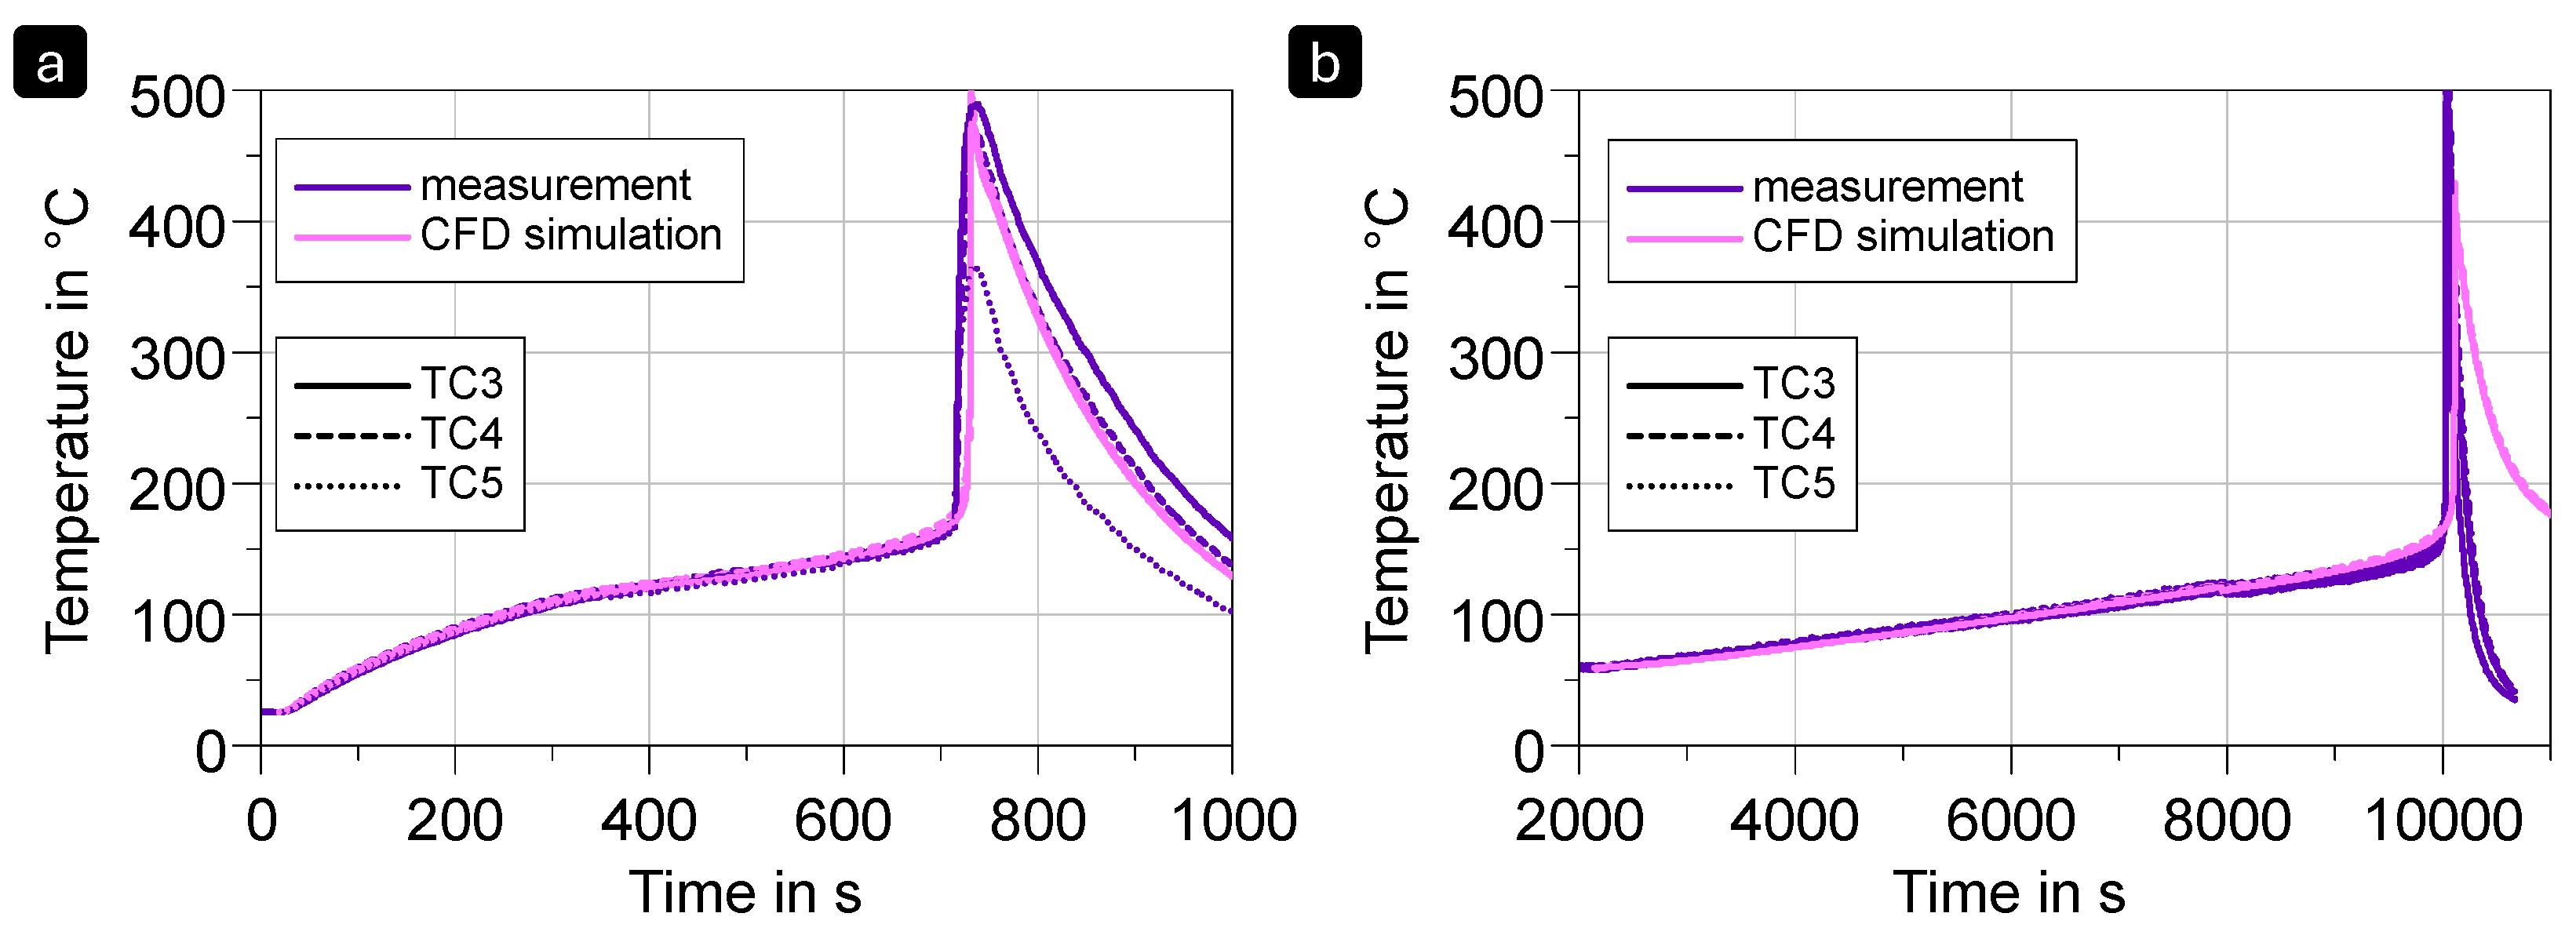
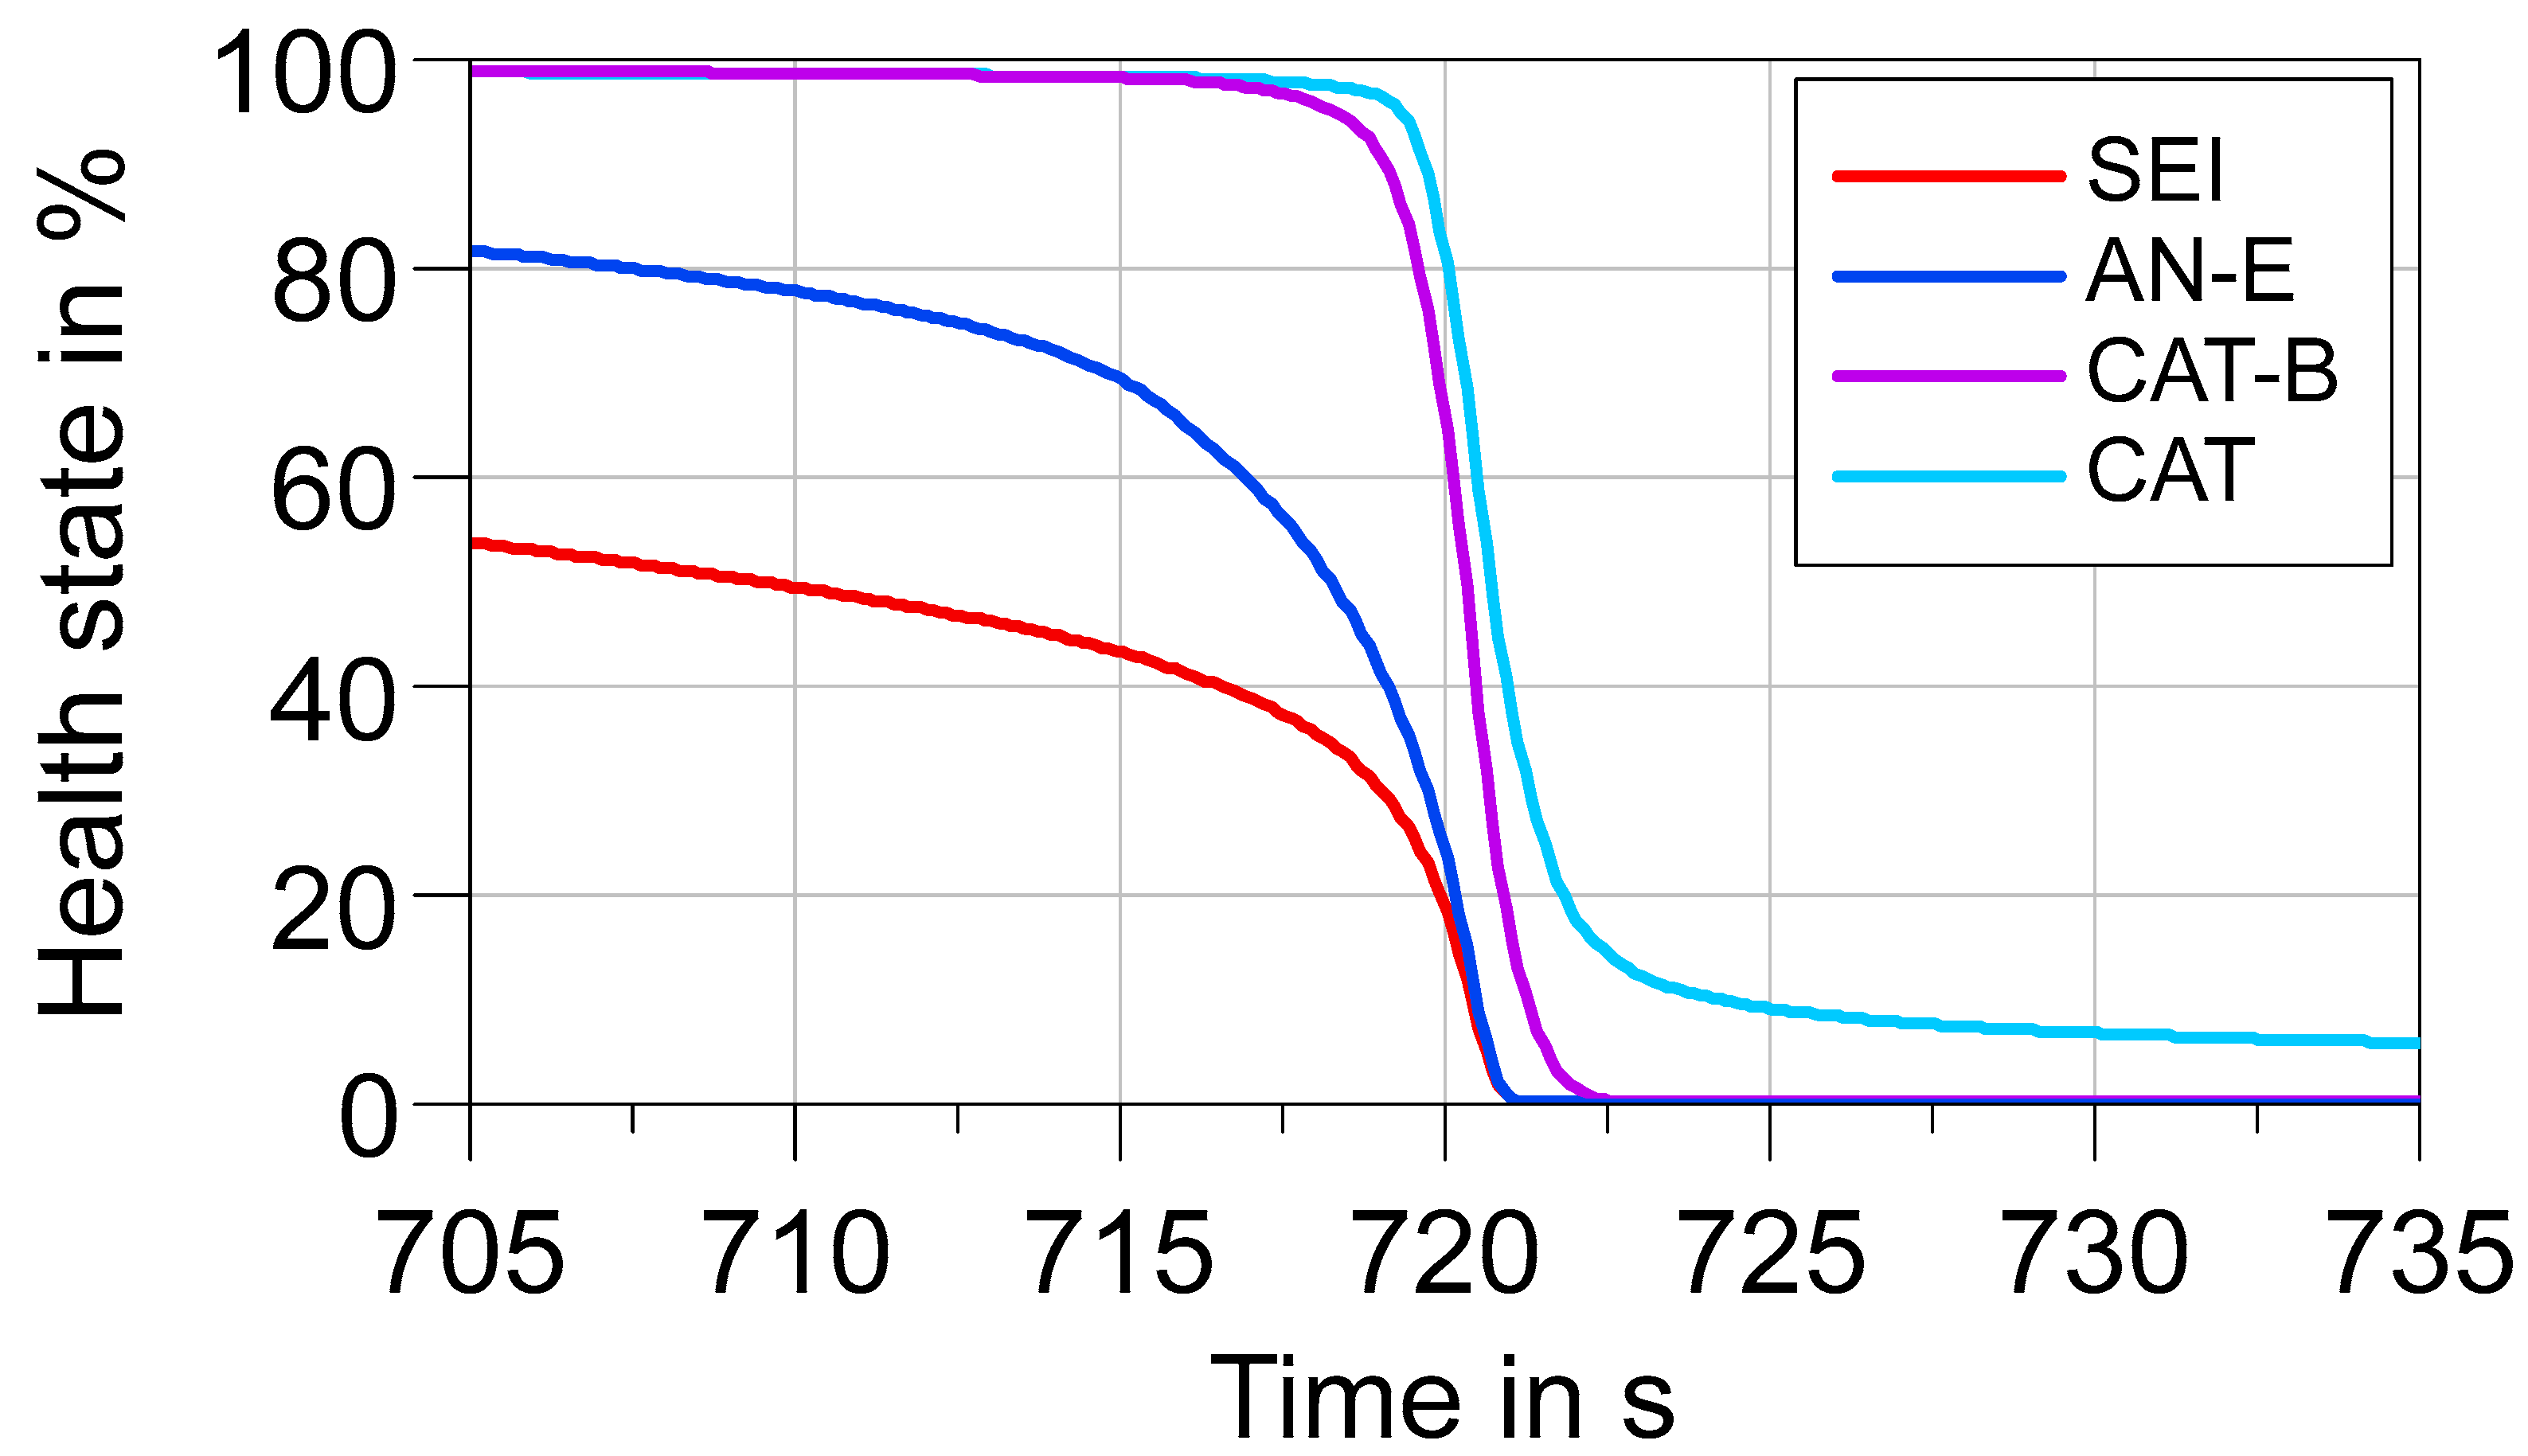
3.5. Thermal Runaway Simulation as a Basis for Propagation Studies

Modeling thermal runaway is performed based on different, chemistry-specific reaction mechanisms in a high-fidelity 3D environment as typically employed for investigations of thermal propagation phenomena in multi-cell configurations. In the modeling process, various solids are assigned temperature-dependent material properties such as density, specific heat, and thermal conductivity. The cell, Figure 4, is represented as a single solid with anisotropic thermal conductivity along the cell layers. Heat transfer is facilitated through interfaces between the heating foil and the cell, as well as between the clamps and the cell. The transport of heat is influenced by the geometry and material properties of the objects involved. Contact with the ambient fluid, e.g., nitrogen, is modeled using a convection boundary condition, incorporating a heat transfer coefficient and far-field temperature derived from experimental data. When the cell or clamps are insulated, the heat transfer coefficient is reduced to reflect the insulation.
To model chemical reactions during battery thermal runaway, detailed chemical mechanisms for gas-phase combustion kinetics are utilized [33]. Furthermore, established mechanisms, such as those by Hatchard and Kim [34] and Ren [35], are used to evaluate local reaction rates and the associated heat release during thermal runaway. These reaction rates follow the Arrhenius format, depending on local temperatures and material concentrations. Accurate representation of thermal abuse within the cell requires calibration of the employed chemical mechanism. For the NMC811 cell, the reaction mechanism proposed by Ren et al. [35] for NMC Li-ion batteries is selected. Due to the specific nature of thermal runaway behavior, calibration of individual reaction kinetic parameters is essential, using data from controlled tests such as differential scanning calorimetry (DSC), accelerated-rate calorimetry (ARC), heat–wait–seek, or constant heating tests. The goal is to develop a mechanism that, once calibrated, can represent thermal runaway behavior for any initiation method without re-adapting calibration parameters.
In this study, CH test results are used for calibration due to the faster thermal runaway process and lower computational effort. Additionally, a well-represented constant heating test model is expected to better match the thermal runaway triggered by nail penetration. The calibrated model setup is subsequently employed for simulating the HWS and NP tests and thus confirms the validity of the selected calibration parameter values. To accurately calibrate the thermal runaway mechanism, the thermal behavior of the system—including thermal properties of different solids, heat transfer pathways, and heat losses—must be precisely modeled. Initial calibration involves adjusting the heat transfer coefficient along external walls to model convective heat losses to the ambient fluid, matching the initial temperature rise rate in the absence of exothermic reactions. Monitor points are selected to correspond with thermocouple positions in the experimental setup, ensuring adequate comparison (cf. Figure 3).
The convective evaporation process of the electrolyte, triggered after vent activation, plays a significant role in thermal runaway, as explained by Parhizi et al. [36]. The endothermic process of electrolyte vaporization, however, is absent in the Ren mechanism. To simulate this, a calibrated heat sink term is applied post-venting. The calibrated value aligns with the typical electrolyte heat of vaporization and available mass for 18,650 batteries. If detailed electrolyte data are available, alternatively, a dedicated custom reaction equation can be incorporated into the Ren mechanism [36,37]. While the Ren mechanism is calibrated to NMC811 cell data, a different NMC grade (NMC333, NMC622, etc.) would necessitate re-calibration of the cathode reaction [38]. Adaptations to reliably extend the mechanism’s capabilities for various cathode chemistries are under investigation by the authors.
Validation of the NMC cell model employs a 3D single-cell model setup and calibrated Ren mechanisms for NMC811 CH, HWS, and NP single-cell experiments. Figure 11 illustrates a comparative analysis of temperature traces obtained from both measurement and CFD simulation for two distinct experimental setups: constant heating (a) and heat–wait–seek (b). The temperature traces are evaluated at various thermocouple positions, specifically TC3, TC4, and TC5, as depicted in Figure 3. The primary distinction between these two initiation scenarios, from a modeling standpoint, lies in the heating strategy employed in the boundary conditions, which is either continuous or stepwise. Temperature traces from measurements and CFD simulations for constant heating and heat–wait–seek experiments exhibit a good fit, with the model calibrated on CH tests accurately representing thermal runaway in HWS tests. The CH simulation accounts for the mass loss of the cell occurring during the TR due to venting, thereby ensuring that the cooldown phase aligns with the experimental data. The results of the CFD simulation in these two cases appear to be validated.
For the nail penetration simulations, the same mechanism and model setup, calibrated for using the CH test data, are employed. The nail penetration event induces a local short-circuit, initiating the thermal runaway process within the battery, which initially remains localized [18]. This phenomenon is replicated in the 3D simulations by utilizing a calibrated short-circuit energy source in the vicinity of the nail to locally trigger the thermal runaway. Figure 12 presents a comparison between the measured and CFD-simulated temperature traces for the monitoring positions nearest to the penetrating nail, for the NMC811 (a) and SIB (b) cells. Both chemistries were simulated under identical boundary conditions and geometrical configurations, with the only variation being the cell chemistry model. The results demonstrate a strong correlation between the measured and simulated temperature data, validating our model.
Figure 13 depicts the temperature traces recorded by each thermocouple on the lateral cell surface during the heat–wait–seek measurement, alongside the corresponding values obtained from the CFD simulation at the respective monitoring points. Thermocouple TC6, located on the heating pad (cf. Figure 3), is significantly influenced by the electrical energy input and is therefore deemed irrelevant for this analysis. Additionally, thermocouples TC1 and TC2, positioned on the top and bottom canning surfaces of the cell, exhibit considerably lower temperatures during the cell heat-up phase due to their proximity to the clamps (refer to Figure 3). The clamps conduct heat away from the cell, resulting in lower temperatures in their vicinity, which significantly affects the temperature readings and renders the TC1 and TC2 traces unreliable indicators of the internal cell processes. Although thermocouple TC7 is also situated near the heating pad and thus affected by it, it is included in the comparison shown in Figure 13, along with the three thermocouples located on the side canning surface opposing the heating pad (TC3, TC4, and TC5). Among these, TC4 registers the highest temperature due to its central position along the height axis.
Overall, Figure 13 reveals that the order of thermocouples from hottest to coldest in the CFD simulation aligns with the experimental observations. The scatter between the lowest and highest temperature values is also well-matched between the simulation and the experiment. This concordance underscores the CFD simulation’s accurate representation of the heat exchange processes and the resulting temperature distribution within the cell. The standard Ren mechanism models six distinct reaction domains, each representing interactions within and between various materials present in the Li-ion battery. These domains include SEI decomposition (SEI), reactions between anode and electrolyte (AN-E), cathode and anode (CAT-AN), anode and binder (AN-B), cathode and binder (CAT-B), and cathode decomposition (CAT). The employed simulation approach enables the tracking of individual reaction progress, as illustrated in Figure 14 for the NMC811 constant heating test. The initial self-heating reactions that trigger the thermal runaway process are anticipated to be the SEI decomposition and the anode–electrolyte (An-E) reactions, which occur at lower temperatures [15]. Subsequently, the binder-related reactions and the cathode decomposition reaction lead to the rapid temperature increase characteristic of the thermal runaway process, resulting in the observed peak temperature levels [15].
It is important to note that in this study, the NMC thermal runaway mechanism was calibrated using results from a single CH test of a single battery cell. Previous studies have demonstrated significant variation in thermal runaway behavior, even among cells with the same battery chemistry and from the same manufacturer [39]. Therefore, when applying a thermal runaway mechanism calibrated from one experiment to another, this inherent variation must be considered when compared with experimental data. If repeated tests or cell manufacturing tolerance data are available, statistical modeling of the thermal runaway behavior can also be performed [39,40]. In this study, the calibrated Ren mechanism shows good agreement when applied to different thermal runaway trigger methods, as evidenced in Figure 11 and Figure 12, thereby confirming the validity of the calibration for multiple cell units of the same type.
Due to the differences in chemistry, simulating the thermal runaway of LFP and SIB cells necessitates the use of dedicated mechanisms that account for chemistry-specific effects. For this purpose, the Hatchard-Kim mechanism [34] has been investigated in previous works [41] and is employed for simulating the thermal runaway of LFP cells. The calibration process follows a similar approach to that described for the NMC cell, with model parameter adaptation performed solely for the CH experiment. The results, presented in Figure 15 demonstrate a good representation of the measured LFP thermal runaway behavior in both the CH (used for calibration) and HWS tests for a randomly selected thermocouple.
The absence of a dedicated mechanism for sodium-ion battery (SIB) chemistry in the literature can make the thermal runaway simulation of this chemistry challenging. Considering the numerous similarities between the chemistries of LIB and SIB, the simplest approach is to use an existing model for LIB, which is expected to provide sufficiently usable results for TR simulation. To demonstrate versatility in fitting different thermal runaway mechanisms to various, including new battery chemistries, the SIB model was calibrated using three different mechanisms, including one-step, two-step, and the complete Hatchard-Kim (four-step) mechanisms. Ultimately, the one-step Hatchard–Kim mechanism was selected as it provides good enough results and is less computationally expensive. Figure 16 illustrates an adequate agreement between the temperature traces of arbitrarily chosen thermocouples from both measurement and CFD simulation in the CH and HWS tests of the sodium-ion cell. While this approach provides a solid foundation for simulating thermal runaway in sodium-ion battery cells as an emerging chemistry, achieving a highly accurate representation of the phenomenon that is comparable to the NMC and LFP modeling results necessitates the development of dedicated mechanisms.

4. Conclusions

The concept of this study was divided into two steps. The first step was to create an experimental database to evaluate the role of both the battery chemistry and trigger method on the characteristics of the thermal runaway. The second step consisted of using experimental results to develop a simulation methodology for thermal runaway events and thus be able to predict them. The virtual development is flexible; the effect of different cell chemistries and formats, trigger methods, and other parameters can be simulated in a faster and cheaper way than the equivalent experimental tests.
Different thermal runaway tests have been conducted to simulate the various possible causes for thermal runaway and propagation occurrence in electric vehicle batteries. The experimental campaign is based on three different battery chemistries—LIBs employing either LFP or NMC811 as cathodic material, and an SIB cell employing a cathode based on a transition metal oxide. The presented results clearly confirm the high influence of both the testing conditions and battery chemistry on the thermal runaway phenomenon, i.e., the duration, the venting, the peak temperature and gas release.
Among the three types of cells tested, only the NMC811 showed the most violent reaction with sparks and flames being emitted. As expected, the LFP chemistry appears more compatible with arising safety concerns compared to NMC811. Surprisingly, the fully charged SIB appears less safe than an LFP-based Li-ion battery in the same 18,650-cell format, which shows a considerably lower peak temperature and capacity-normalized gas release. This unexpected finding confirms the necessity for a comprehensive understanding of new battery technologies, with this knowledge necessary for guaranteeing the safety of battery applications.
The presented measurement results are a solid experimental basis that has been further employed for modeling in 3D and predicting the thermal runaway with chemistry-specific reaction mechanisms, with individual reaction rates represented by the typically employed Arrhenius approach. Especially considering the typical manufacturing tolerances and fluctuations of individual cells, it seems to be sufficient to model the cells with mass-averaged, but still cell-specific material properties to keep the data procurement and modeling effort as low as possible while omitting inherent stochastic effects. Coupled with accurate thermal properties of different solids, heat transfer pathways and heat losses, this approach yields an accurate 3D temperature field providing insight into physical processes that are not accessible with typical experimental methods.
Ultimately, this enables the models to accurately represent the occurrence of the thermal runaway phenomenon for different triggering methods (i.e., timing) and cell chemistries (i.e., temperatures) as a fundamental prerequisite for capturing the thermal propagation phenomenon in battery packs. Even though models will always be reliant on data gathered from real-world tests, our approach represents another step towards a reliable model-based battery module and pack development with optimized safety and a limited number of physical tests and decreases the cost, thus enhancing the overall economic viability of the development process.

Author Contributions

Conceptualization, K.M., M.S. and A.F.; methodology, M.K., A.F. and L.v.R.; validation, S.S., B.S. and L.v.R.; formal analysis, S.S. and O.N.; investigation, M.K. and L.v.R.; data curation, S.S., O.N. and L.v.R.; writing—original draft preparation, S.S. and L.v.R.; writing—review and editing, O.N., B.S. and A.F.; visualization, O.N., L.v.R. and S.S.; supervision, K.M., M.K. and M.S.; project administration, A.F. All authors have read and agreed to the published version of the manuscript.

Funding

This research received no external funding.

Institutional Review Board Statement

Not applicable.

Informed Consent Statement

Not applicable.

Data Availability Statement

The datasets presented in this article are not readily available because the data are part of an ongoing study. Requests to access the datasets should be directed to the authors.

Acknowledgments

The work presented could only be conducted thanks to the collaboration of many domain-specific specialists with the number of parties involved going beyond the authors list. The authors would like to express their sincere thanks to all colleagues involved.

Conflicts of Interest

Sébastien Sallard and Brahim Soltani are employees of IAV France S.A.S, 4 rue Guynemer, 78280 Guyancourt, France. Oliver Nolte, Lorenz von Roemer, Alexander Fandakov, Karsten Mueller, Maria Kalogirou, and Marc Sens are employees of IAV GmbH, Carnotstrasse 1, 10587 Berlin, Germany. The research was conducted in the absence of any commercial or financial relationships that could be construed as a potential conflict of interest.

Appendix A

Figure A1. NMC811 cell located in the autoclave and with a specific cell holder for the nail penetration test.
Wevj 16 00153 g0a1
Figure A2. NMC811 cell with temperature sensors and one heating pad located in the autoclave before the thermal runaway experiment.
Wevj 16 00153 g0a2
Figure A3. LFP cell during CH experiment at ca. 928 s after beginning of the experiment.
Wevj 16 00153 g0a3
Figure A4. Overview of important sensor traces during the SIB nail penetration test. The top panel shows cell voltage and nail penetration depth, while the bottom panel shows the temperature at the cell bottom and the autoclave pressure, all as a function of time. The first detection of cell voltage deviations as well as the point of maximum temperature on the lateral cell surface are indicated by dashed lines.
Wevj 16 00153 g0a4
Figure A5. Overview of important sensor traces during the NMC nail penetration test. The top panel shows cell voltage and nail penetration depth, while the bottom panel shows the temperature at the cell bottom and the autoclave pressure, all as a function of time. The first detection of cell voltage deviations as well as the point of maximum temperature on the lateral cell surface are indicated by dashed lines.
Wevj 16 00153 g0a5
Figure A6. SIB cell during nail penetration test, ca. 1 s after Figure 7c. A small but dense white smoke emission is visible on the bottom left of the cell.
Wevj 16 00153 g0a6
Figure A7. NMC811 cell during nail penetration test, ca. 1.5 s after Figure 7d. Flames become visible on the top of the cell holder and last for 2 more seconds. A tenuous smoke, emitted from the cell since the start of the TR, explains the blurry nature of the recording.
Wevj 16 00153 g0a7

References

  1. Volta Foundation. Annual Battery Report 2023. Available online: www.volta.foundation/annual-battery-report (accessed on 31 January 2025).
  2. United Nations. Regulation No. 100: Uniform Provisions Concerning the Approval of Vehicles with Regard to Specific Requirements for the Electric Power Train; E/ECE/Rev. 2/Add.99/Rev.3; United Nations: Geneva, Switzerland, 2015. [Google Scholar]
  3. IRENA. Critical Materials: Batteries for Electric Vehicles, International Renewable Energy Agency, Abu Dhabi. 2024. Available online: https://www.irena.org/-/media/Files/IRENA/Agency/Publication/2024/Sep/IRENA_Critical_materials_Batteries_for_EVs_2024.pdf (accessed on 31 January 2025).
  4. Sens, M.; Fandakov, A.; Clauß, M.; Werfel, J.; Tourlonias, P.; Prüger, M.; Özkan, E.; Danzer, C.; Kruschel, C.; Meyer, S.; et al. Towards a Sustainable Vehicle Concept, Part 1: The High-Voltage Battery—Technologies and Methods. In Proceedings of the 44th International Vienna Motor Symposium, Vienna, Austria, 26–28 April 2023. [Google Scholar]
  5. Tarascon, J.-M. Na-ion versus Li-ion batteries: Complementarity rather than competitiveness. Joule 2020, 4, 1616–1620. [Google Scholar]
  6. Tapia Ruiz, N.; Armstrong, A.R.; Alptekin, H.; Amores, M.A.; Au, H.; Barker, J.; Boston, R.; Brant, W.R.; Brittain, J.M.; Chen, Y.; et al. 2021 roadmap for sodium-ion batteries. J. Phys. Energy 2021, 3, 031503. [Google Scholar]
  7. Song, T.; Kishore, B.; Lakhdar, Y.; Chen, L.; Slater, P.R.; Kendrick, E. Effect of storage voltage upon sodium-ion batteries. Batteries 2024, 10, 361. [Google Scholar] [CrossRef]
  8. Lei, B.; Zhao, W.; Ziebert, C.; Uhlmann, N.; Rohde, M.; Seifert, H.J. Experimental analysis of thermal runaway in 18650 cylindrical Li-ion cells using an accelerating rate calorimeter. Batteries 2017, 3, 14. [Google Scholar] [CrossRef]
  9. Barkholtz, H.M.; Preger, Y.; Ivanov, S.; Langendorf, J.; Torres-Castro, L.; Lamb, J.; Chamala, B.; Ferreira, S.R. Multi-scale thermal stability study of commercial lithium-ion batteries as a function of cathode chemistry and state-of-charge. J. Power Sources 2019, 435, 226777. [Google Scholar]
  10. Tang, Z.; Feng, D.; Xu, Y.; Chen, L.; Zhang, X.; Ma, Q. Safety issues of layered nickel-based cathode materials for lithium-ion batteries: Origin, strategies and prospects. Batteries 2023, 9, 156. [Google Scholar] [CrossRef]
  11. Yang, X.; Wang, H.; Li, M.; Li, Y.; Li, C.; Zhang, Y.; Chen, S.; Shen, H.; Qian, F.; Feng, X.; et al. Experimental study on thermal runaway behavior of lithium-ion battery and analysis of combustible limit of gas production. Batteries 2022, 8, 250. [Google Scholar] [CrossRef]
  12. Jung, R.; Metzger, M.; Maglia, F.; Stinner, C.; Gasteiger, H.A. Oxygen release and its effect on the cycling stability of LiNixMnyCozO2 (NMC) cathode materials for Li-ion batteries. J. Electrochem. Soc. 2017, 164, A1361. [Google Scholar]
  13. Liu, X.; Ren, D.; Hsu, H.; Feng, X.; Xu, G.L.; Zhuang, M.; Gao, H.; Lu, L.; Han, X.; Chu, Z.; et al. Thermal runaway of lithium-ion batteries without internal short circuit. Joule 2018, 2, 2047. [Google Scholar]
  14. Tran, M.K.; Mevawalla, A.; Aziz, A.; Panchal, S.; Xie, Y.; Fowler, M. A review of lithium-ion battery thermal runaway modeling and diagnosis approaches. Processes 2022, 10, 1192. [Google Scholar] [CrossRef]
  15. Roth, E.P.; Crafts, C.C.; Doughty, D.H.; McBreen, J. Advanced Technology Development Program for Lithium-Ion Batteries: Thermal Abuse Performance of 18650 Li-Ion Cells. Sandia Report SAND2004-0584, 1 March 2004. Available online: https://www.osti.gov/servlets/purl/918751 (accessed on 31 January 2025).
  16. Tang, X.; Zhang, G.; Wang, X.; Wei, G.; Han, G.; Zhu, J.; Wei, X.; Dai, H. Investigating the critical characteristics of thermal runaway process for LiFePO4/graphite batteries by a ceased segmented method. iScience 2020, 24, 103088. [Google Scholar] [CrossRef] [PubMed]
  17. Ren, Y.; Zhang, H.; Wei, L.; Feng, X.; Xu, W. Multi-layer internal short-circuit mechanism and thermal runaway risk assessment of lithium-ion batteries using nail penetration simulation. J. Energy Storage 2024, 97, 112824. [Google Scholar] [CrossRef]
  18. Finegan, D.P.; Tjaden, B.; Heenan, T.M.M.; Jervis, R.; Di Michiel, M.; Rack, A.; Hinds, G.; Brett, D.J.L.; Shearing, P.R. Tracking internal temperature and structural dynamics during nail penetration of lithium-ion cells. J. Electrochem. Soc. 2017, 164, A3285. [Google Scholar] [CrossRef]
  19. Yokoshima, T.; Mukoyama, D.; Maeda, F.; Osaka, T.; Takazawa, K.; Egusa, S. Operando analysis of thermal runaway in lithium ion battery during nail-penetration test using an x-ray inspection system. J. Electrochem. Soc. 2017, 166, A1243. [Google Scholar] [CrossRef]
  20. Joshi, T.; Azam, A.; Lopez, C.; Kinyon, S.; Jeevarajan, J. Safety of lithium-ion cells and batteries at different states-of-charge. J. Electrochem. Soc. 2020, 167, 140547. [Google Scholar] [CrossRef]
  21. Golubkov, A.W.; Scheikl, S.; Planteu, R.; Voitic, G.; Wiltsche, H.; Snagi, C.; Fauler, G.; Thaler, A.; Hacker, V. Thermal runaway of commercial 18650 Li-ion batteries with LFP and NCA cathodes -impact of the state of charge and overcharge. RSC Adv. 2015, 5, 57171–57186. [Google Scholar]
  22. Kurzaski, A.; Gray, L.; Torres-Castra, L.; Hewson, J. An investigation into the effects of state of charge and heating rate on propagating thermal runaway in Li-ion batteries with experiments and simulations. Fire Saf. J. 2023, 140, 103885. [Google Scholar] [CrossRef]
  23. Volta Foundation. Annual Battery Report 2024. Available online: https://volta.foundation/battery-report-2024 (accessed on 31 January 2025).
  24. Wei, N.; Li, M. Experimental study of thermal runaway process of 256 Ah prismatic nickel-rich battery. Frontiers 2023, 11, 1230429. [Google Scholar]
  25. Bischof, K.; Marangon, V.; Kasper, M.; Regalado, A.A.; Wohlfahrt-Mehrens, M.; Hölzle, M.; Bresser, D.; Waldmann, T. Evaluation of commercial 18650 and 267000 sodium-ion cells and comparison with well-established lithium-ion cells. J. Power Sources 2024, 27, 100148. [Google Scholar]
  26. Richards, K.J.; Senecal, P.K.; Pomraning, E. CONVERGE, 3.1; Convergent Science: Madison, WI, USA, 2024. [Google Scholar]
  27. Hahn, A.; Müller, J.; Doose, S.; Kwade, A. Impact of silicon content mechanical abuse and thermal runaway of Li-ion battery cells. J. Power Sources 2025, 628, 235840. [Google Scholar] [CrossRef]
  28. Xu, K. Nonaqueous liquid electrolytes for lithium-based rechargeable batteries. Chem. Rev. 2004, 104, 4303–4417. [Google Scholar] [CrossRef]
  29. Desai, P.; Huang, J.; Foix, D.; Tarascon, J.-M.; Mariyappan, S. Zero volt storage of Na-ion batteries; Performances dependence on cell chemistry. J. Power Sources 2022, 551, 232177. [Google Scholar] [CrossRef]
  30. Rudola, A.; Rennie, A.J.R.; Shayan Meysami, S.; Lowbridge, A.; Mazzali, F.; Sayers, R.; Wright, C.J.; Barker, J. Commercialisation of high energy density sodium-ion batteries: Faradion’s journey and outlook. J. Mater. Chem A 2021, 9, 8279–8302. [Google Scholar] [CrossRef]
  31. Zhang, J.; Li, J.; Wang, H.; Wang, M. Research progress of organic liquid electrolyte for sodium ion battery. Front. Chem. 2023, 11, 1253959. [Google Scholar] [CrossRef]
  32. Sturm, J.; Rheinfeld, A.; Zilberman, I.; Singler, F.B.; Kosch, S.; Frie, F.; Jossen, A. Modeling and simulation of inhomogeneities in 18650 nickel-rich, silicon-graphite lithium-ion cell during fast charging. J. Power Sources 2019, 412, 204–233. [Google Scholar] [CrossRef]
  33. Wijeyakulasuriya, S.; Kim, J.; Probst, D.; Srivastava, K.; Yang, P.; Scarcelli, R.; Senecal, P.K. Enabling powertrain technologies for euro 7/VII vehicles with computational fluid dynamics. Trans. Eng. 2022, 9, 100127. [Google Scholar] [CrossRef]
  34. Kim, G.H.; Pesaran, A.; Spotnitz, R. A three-dimensional thermal abuse model of lithium-ion cells. J. Power Sources 2007, 170, 476. [Google Scholar] [CrossRef]
  35. Ren, D.; Liu, X.; Feng, X.; Lu, L.; Ouyang, M.; Li, J.; He, X. Model-based thermal runaway prediction of lithium-ion batteries from kinetics analysis of cell components. Appl. Energy 2018, 228, 633. [Google Scholar] [CrossRef]
  36. Parhizi, M.; Crompton, K.R.; Ostanek, J. Probing the role of venting and evaporative cooling in thermal runaway for small format Li-ion cells. In Proceedings of the ASME 2021 International Mechanical Engineering Congress and Exposition, Virtual, 1–5 November 2021; Volume 8A: Energy. [Google Scholar]
  37. Ostanek, J.; Li, W.; Mukherjee, P.P.; Crompton, K.R.; Hacker, C. Simulating onset and evolution of thermal runaway in Li-ion cells using a coupled thermal and venting model. Appl. Energy 2020, 268, 114972. [Google Scholar] [CrossRef]
  38. Wang, Y.; Ren, D.; Feng, X.; Wang, L.; Ouyang, M. Thermal kinetics comparison of delithiated Li[NixCoyMn1−x−y]O2 cathodes. J. Power Sources 2021, 514, 230582. [Google Scholar] [CrossRef]
  39. Zhang, L.; Yang, S.; Liu, L.; Zhao, P. Cell-to-cell variability in Li-ion battery thermal runaway: Experimental testing, statistical analysis, and kinetic modeling. J. Energy Storage 2022, 56, 106024. [Google Scholar] [CrossRef]
  40. Srivastava, K.; Burton, T.; Probst, D. Capturing battery thermal runaway and venting phenomena using detailed 3D CFD solutions. In Proceedings of the 2022 NASA Aerospace Battery Workshop, Huntsville, TX, USA, 15–17 November 2022. [Google Scholar]
  41. Hang, Y.; Mei, W.; Qin, P.; Duan, Q.; Wang, Q. Numerical modeling on thermal runaway triggered by local overheat for lithium iron phosphate battery. Appl. Therm. Eng. 2021, 192, 116928. [Google Scholar]
Figure 1. Overview of the relationships between causes and the thermal runaway and propagation mechanisms of a Li-ion battery (SEI = Solid Electrolyte Interphase, T = Temperature).
Wevj 16 00153 g001
Figure 2. Overview of the relationships between NMC aging and degradation mechanisms in a Li-ion cell.
Wevj 16 00153 g002
Figure 3. Position of the seven thermocouples (TCs) on an 18,650 cell. The yellow area represents the heating pad.
Wevj 16 00153 g003
Figure 4. Geometry of single cell with clamps as employed in the 3D CFD simulation environment.
Wevj 16 00153 g004
Figure 5. Temperature evolution during the CH experiments of (a) the LFP, (b) the SIB (b,c) the NMC811 cell, photo of (d) the LFP cell at 540 s, limited fuming, (e) the SIB cell at the thermal runaway at 460 s, and, (f) the NMC811 cell at the thermal runaway at 720 s. Note the fume was so dense for the SIB that rapidly nothing else was visible with the camera.
Wevj 16 00153 g005
Figure 6. Temperature evolution during the HWS experiment of (a) the LFP, (b) the SIB cell and (c) the NMC811 cell.
Wevj 16 00153 g006
Figure 7. Temperature evolution during nail penetration test of (a) the SIB and (b) the NMC811 cells. Photos of the cells when visual change are recorded attributed to the TR event, i.e., (c) visible smoke for the SIB (from the top only) or (d) visible smoke (bottom left) and sparks for the NMC811.
Wevj 16 00153 g007
Figure 8. Temperature rise rates at the lateral surface depending on the cell chemistry (LFP, SIB and NMC) during a thermal runaway for each trigger method ((a) constant heating, (b) heat-wait-seek, (c) nail penetration). Note the logarithmic scaling of the temperature gradient as well as the different scaling of the temperature gradient in diagram °C.
Wevj 16 00153 g008
Figure 9. Temperature rise rates at different side surface locations during a thermal runaway depending on the trigger method for each cell chemistry ((a) LFP, (b) SIB, (c) NMC). Note the logarithmic scaling of the temperature gradient as well as the different scaling of the temperature gradient in diagram °C.
Wevj 16 00153 g009
Figure 10. Cell energy density (red dots) in Wh/kg for the LFP, SIB and NMC811 cells as well as the capacity-normalized gas volume in L/Ah emitted during thermal runaway tests using different trigger methods.
Wevj 16 00153 g010
Figure 11. MC811 (a) constant heating, used for NMC model calibration, and (b) heat–wait–seek comparison between measurement and CFD.
Wevj 16 00153 g011
Figure 12. Nail penetration comparison for NMC811 (a) and SIB (b) between measurement and CFD.
Wevj 16 00153 g012
Figure 13. NMC811 heat–wait–seek comparison between different thermocouples in measurement (a) and CFD simulation (b).
Wevj 16 00153 g013
Figure 14. Health state evolution of the NMC811 cell CH thermal runaway reaction progress described with the calibrated Ren mechanism; 100% = pristine state material, 0% = wrecked material.
Wevj 16 00153 g014
Figure 15. LFP constant heating ((a), used for LFP model calibration) and heat–wait–seek (b) comparison between measurement and CFD.
Wevj 16 00153 g015
Figure 16. SIB constant heating ((a), used for SIB model calibration) and heat–wait–seek (b) comparison between measurement and CFD.
Wevj 16 00153 g016
Table 1. Details of the three types of cells used for the TR investigations.
CellManufacturerDescriptionNominal
Capacity
Nominal VoltageCell Mass
[mAh][V][g]
LFPA123APE18650M1-A11003.2–3.339
SIB *HAKADI18650E-150015003.037
NMC811LG ChemINR18650-MJ1535003.649
* Note that based on analysis of the SIB, the cathodic material is assumed to be a layered transition metal oxide with a chemical composition close to Na0.8Ni0.32Fe0.34Mn0.34O2 [25].
Table 2. Main data for different TR events. $: in case of the nail penetration, t = 0 corresponds to the beginning of the nail penetration itself (see Figure A6 and Figure A7).
CellsTrigger MethodVent Time
(s)
TR Time
(s)
Max. Tgradient
(K/s)
Tmax
Cell Body (°C)
Tmax
Gases
(°C)
Weight Loss
(%)
LFPCH46054010410-14
HWS10,85012,65010330-19
SIBCH390460<2045027519
HWS10,91015,56040500->50
Nail-18 $60370450-
NMCCH32072060680>110065
HWS788010,030100600>1200>60
Nail-15 $>100440--
Disclaimer/Publisher’s Note: The statements, opinions and data contained in all publications are solely those of the individual author(s) and contributor(s) and not of MDPI and/or the editor(s). MDPI and/or the editor(s) disclaim responsibility for any injury to people or property resulting from any ideas, methods, instructions or products referred to in the content.

