


A Case Study on Gas Venting Events in NCM523 Batteries During Thermal Runaway Under Different Pressures in a Sealed Chamber †


Abstract
1. Introduction
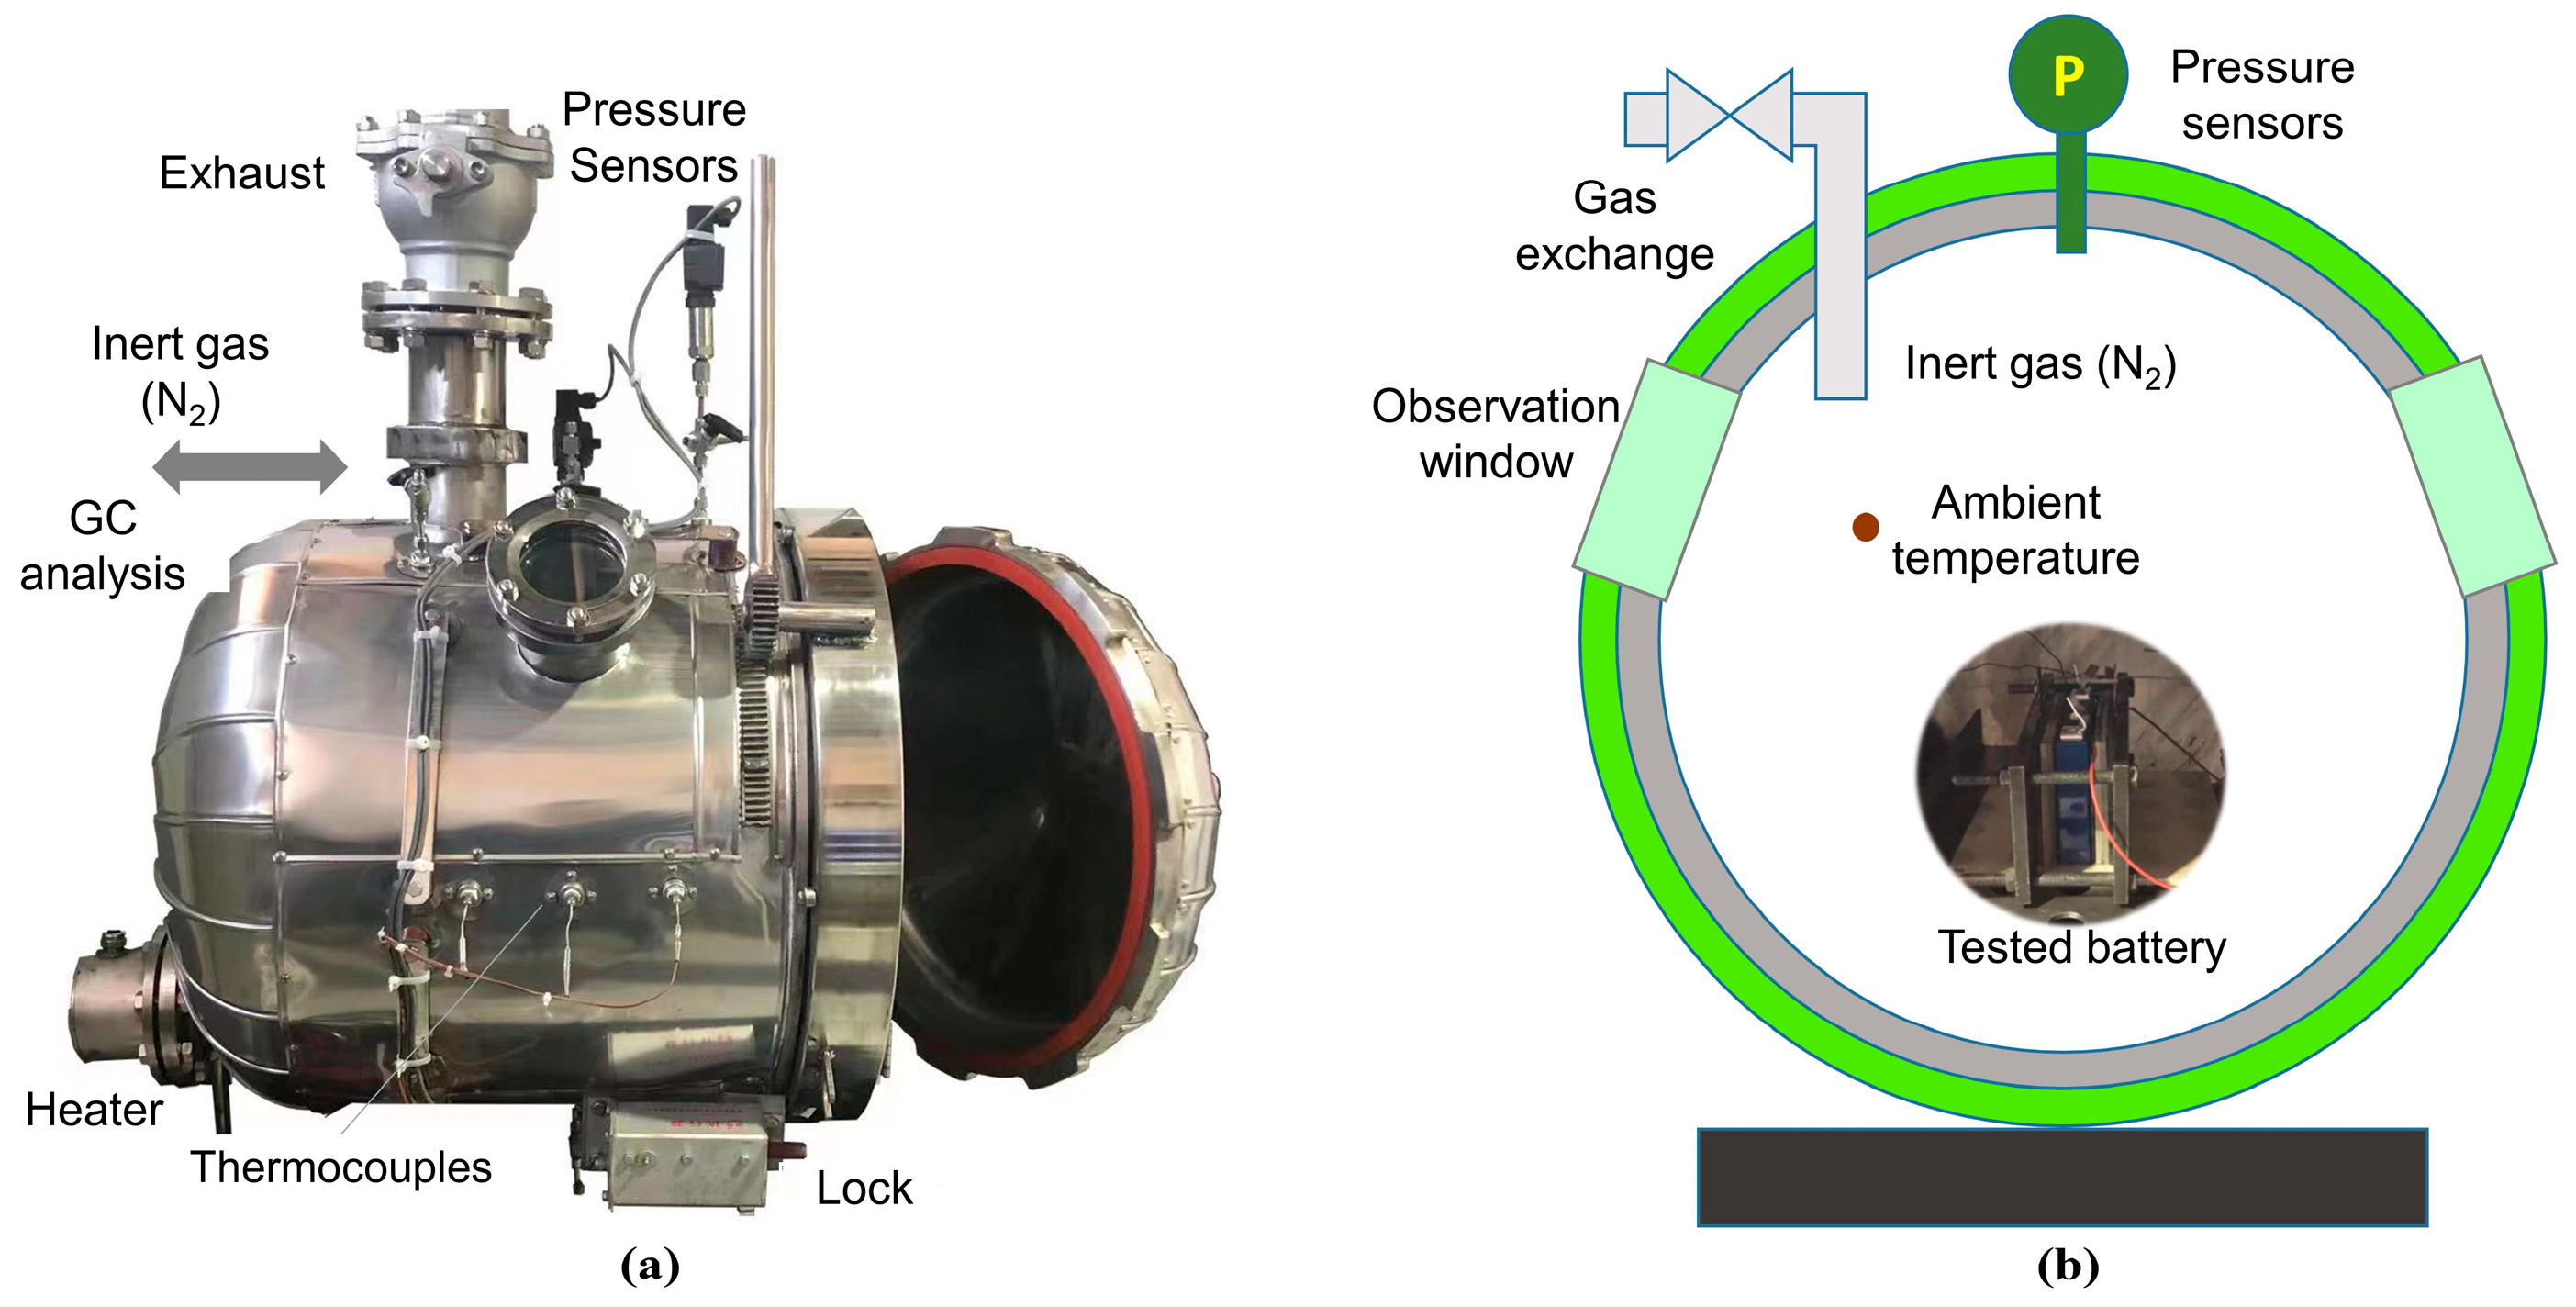
2. Experiment
3. Results
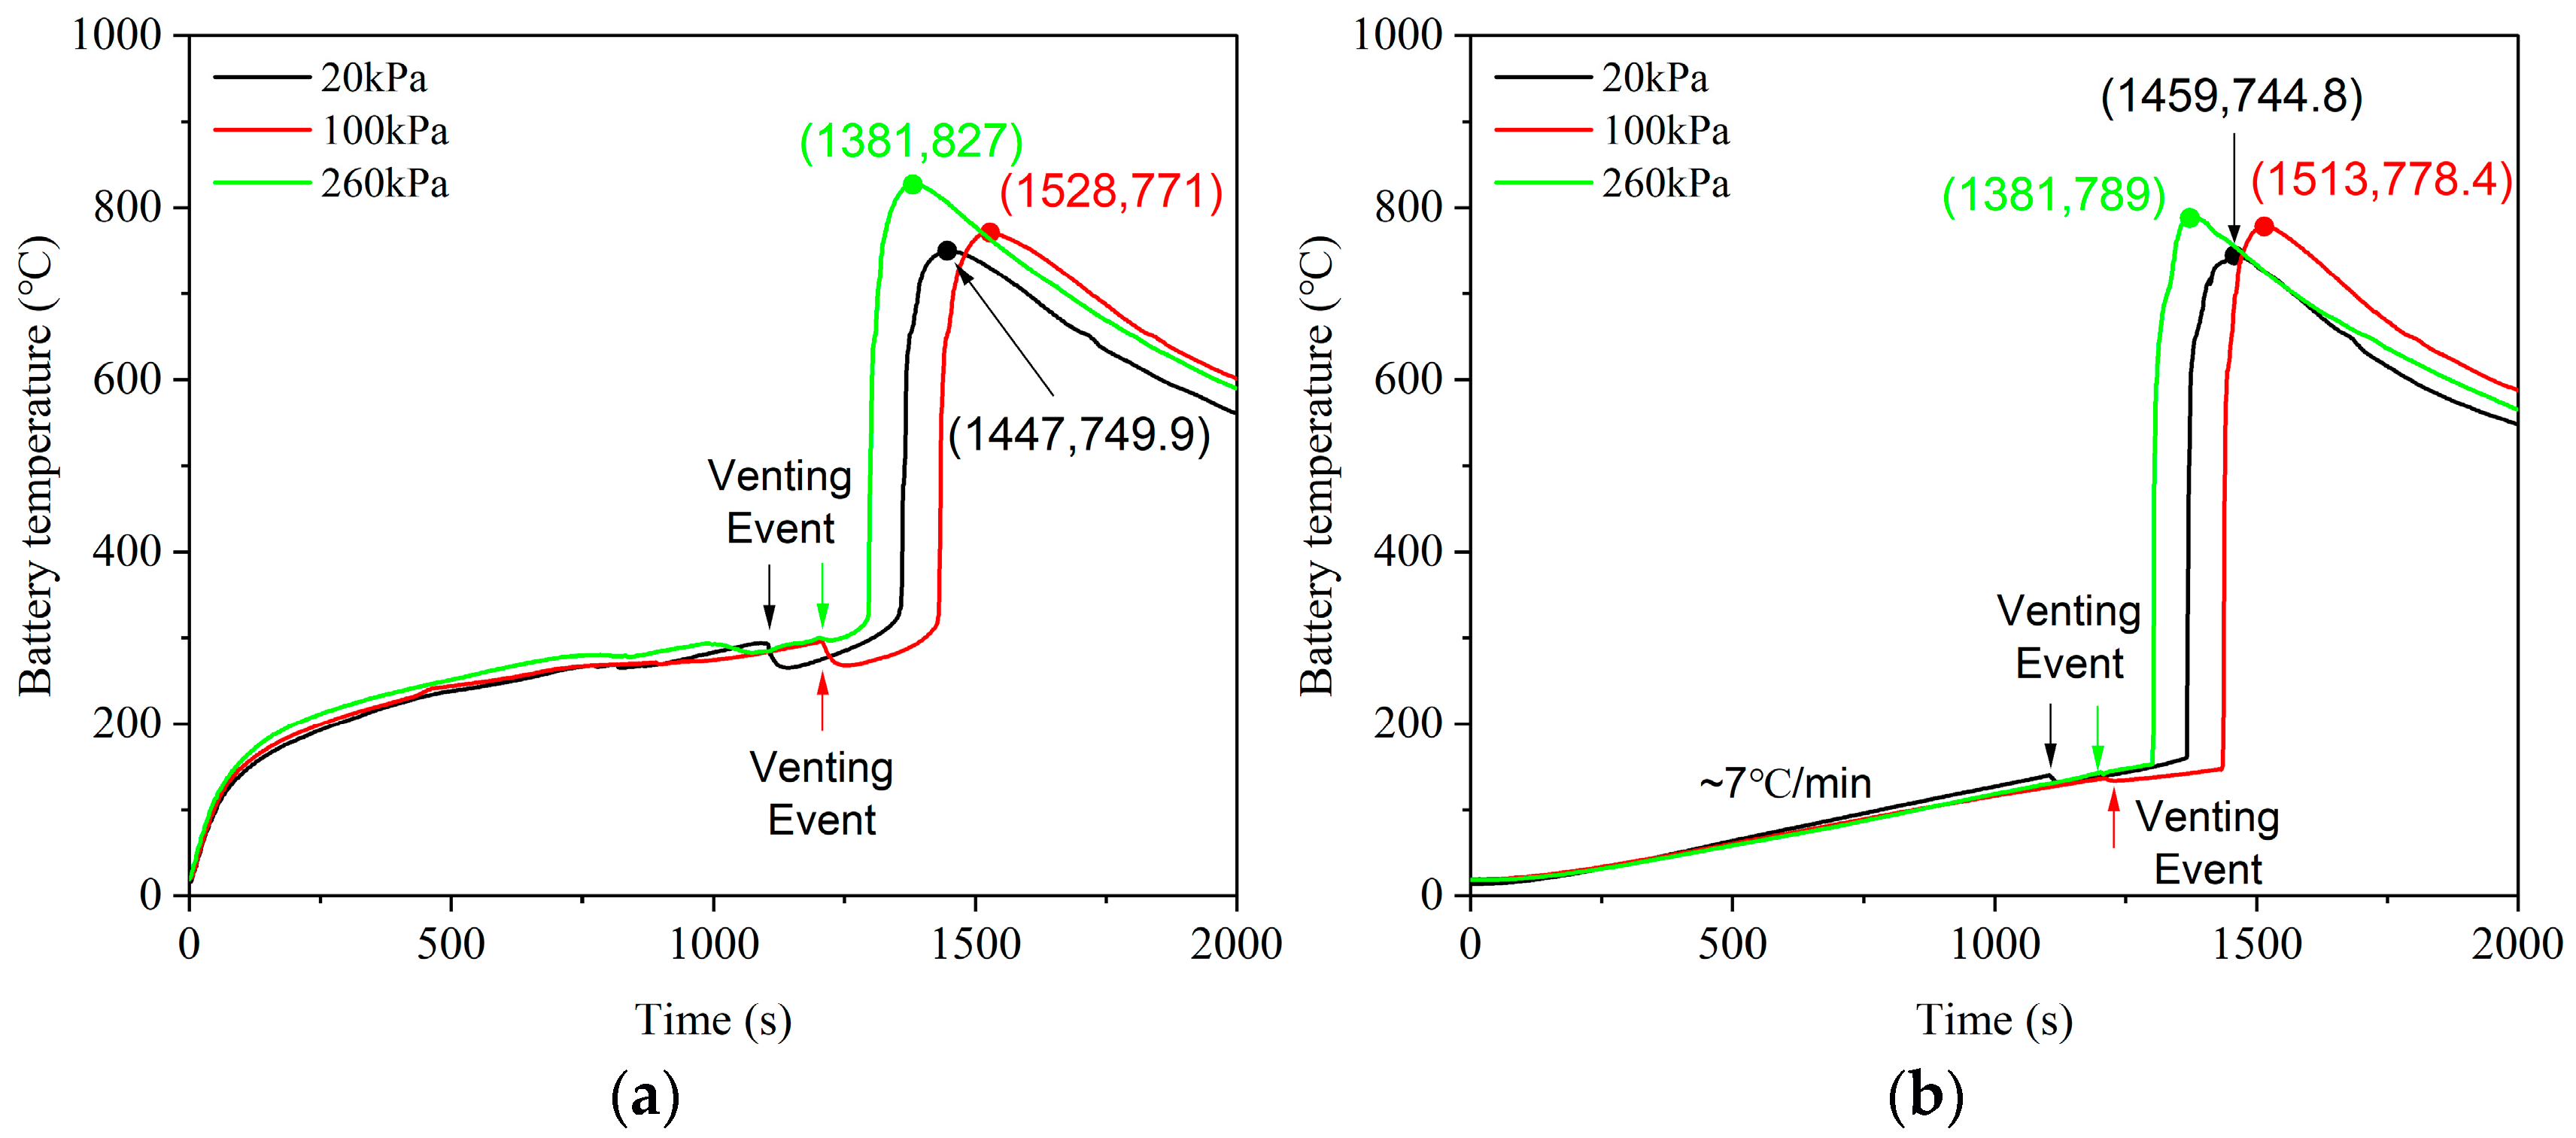
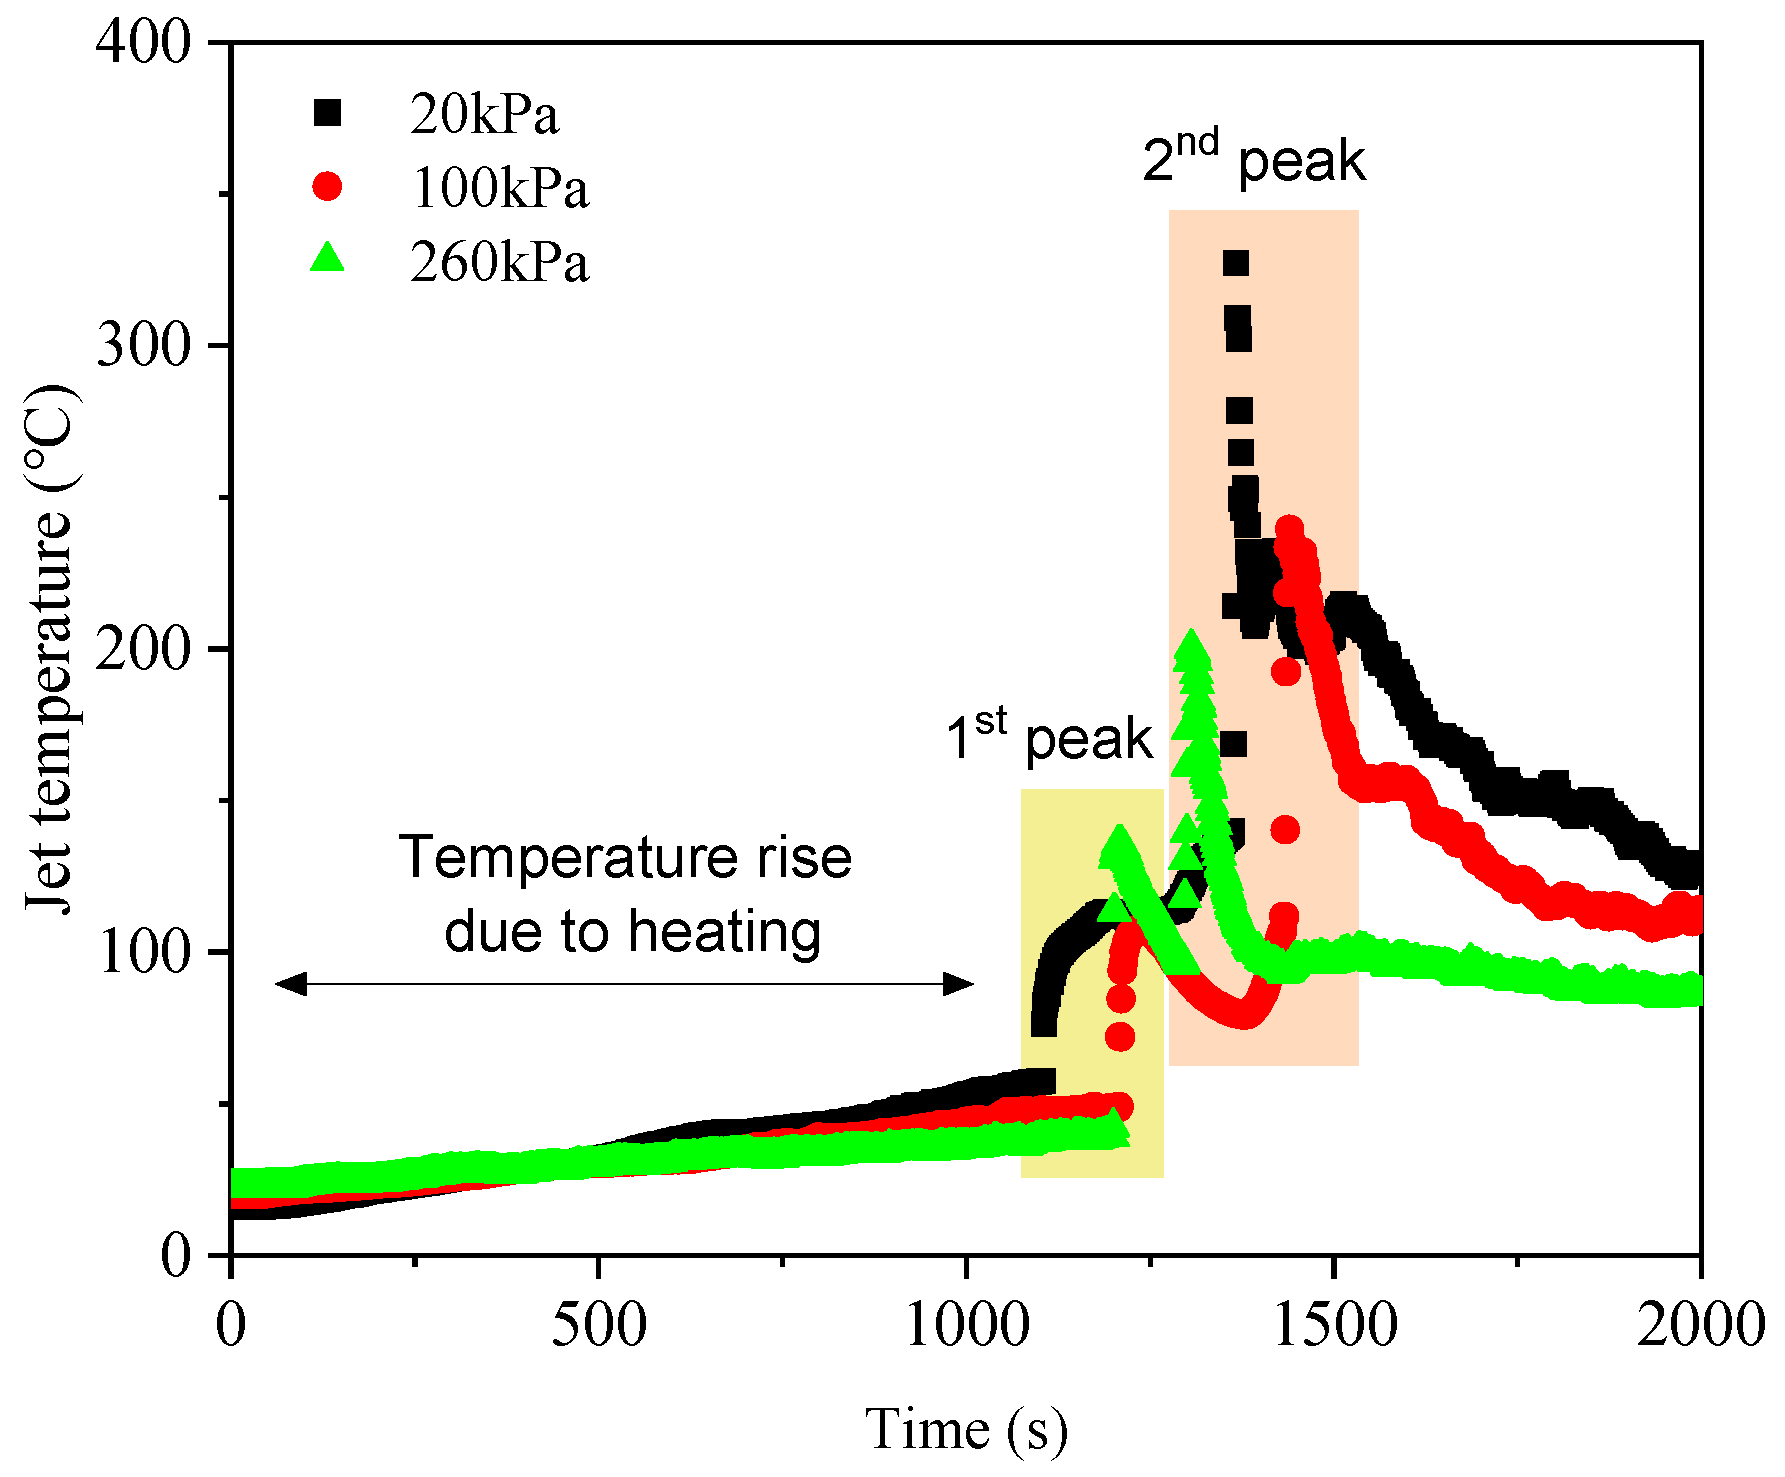
3.1. Thermal Behavior
3.2. Gas Venting Behavior
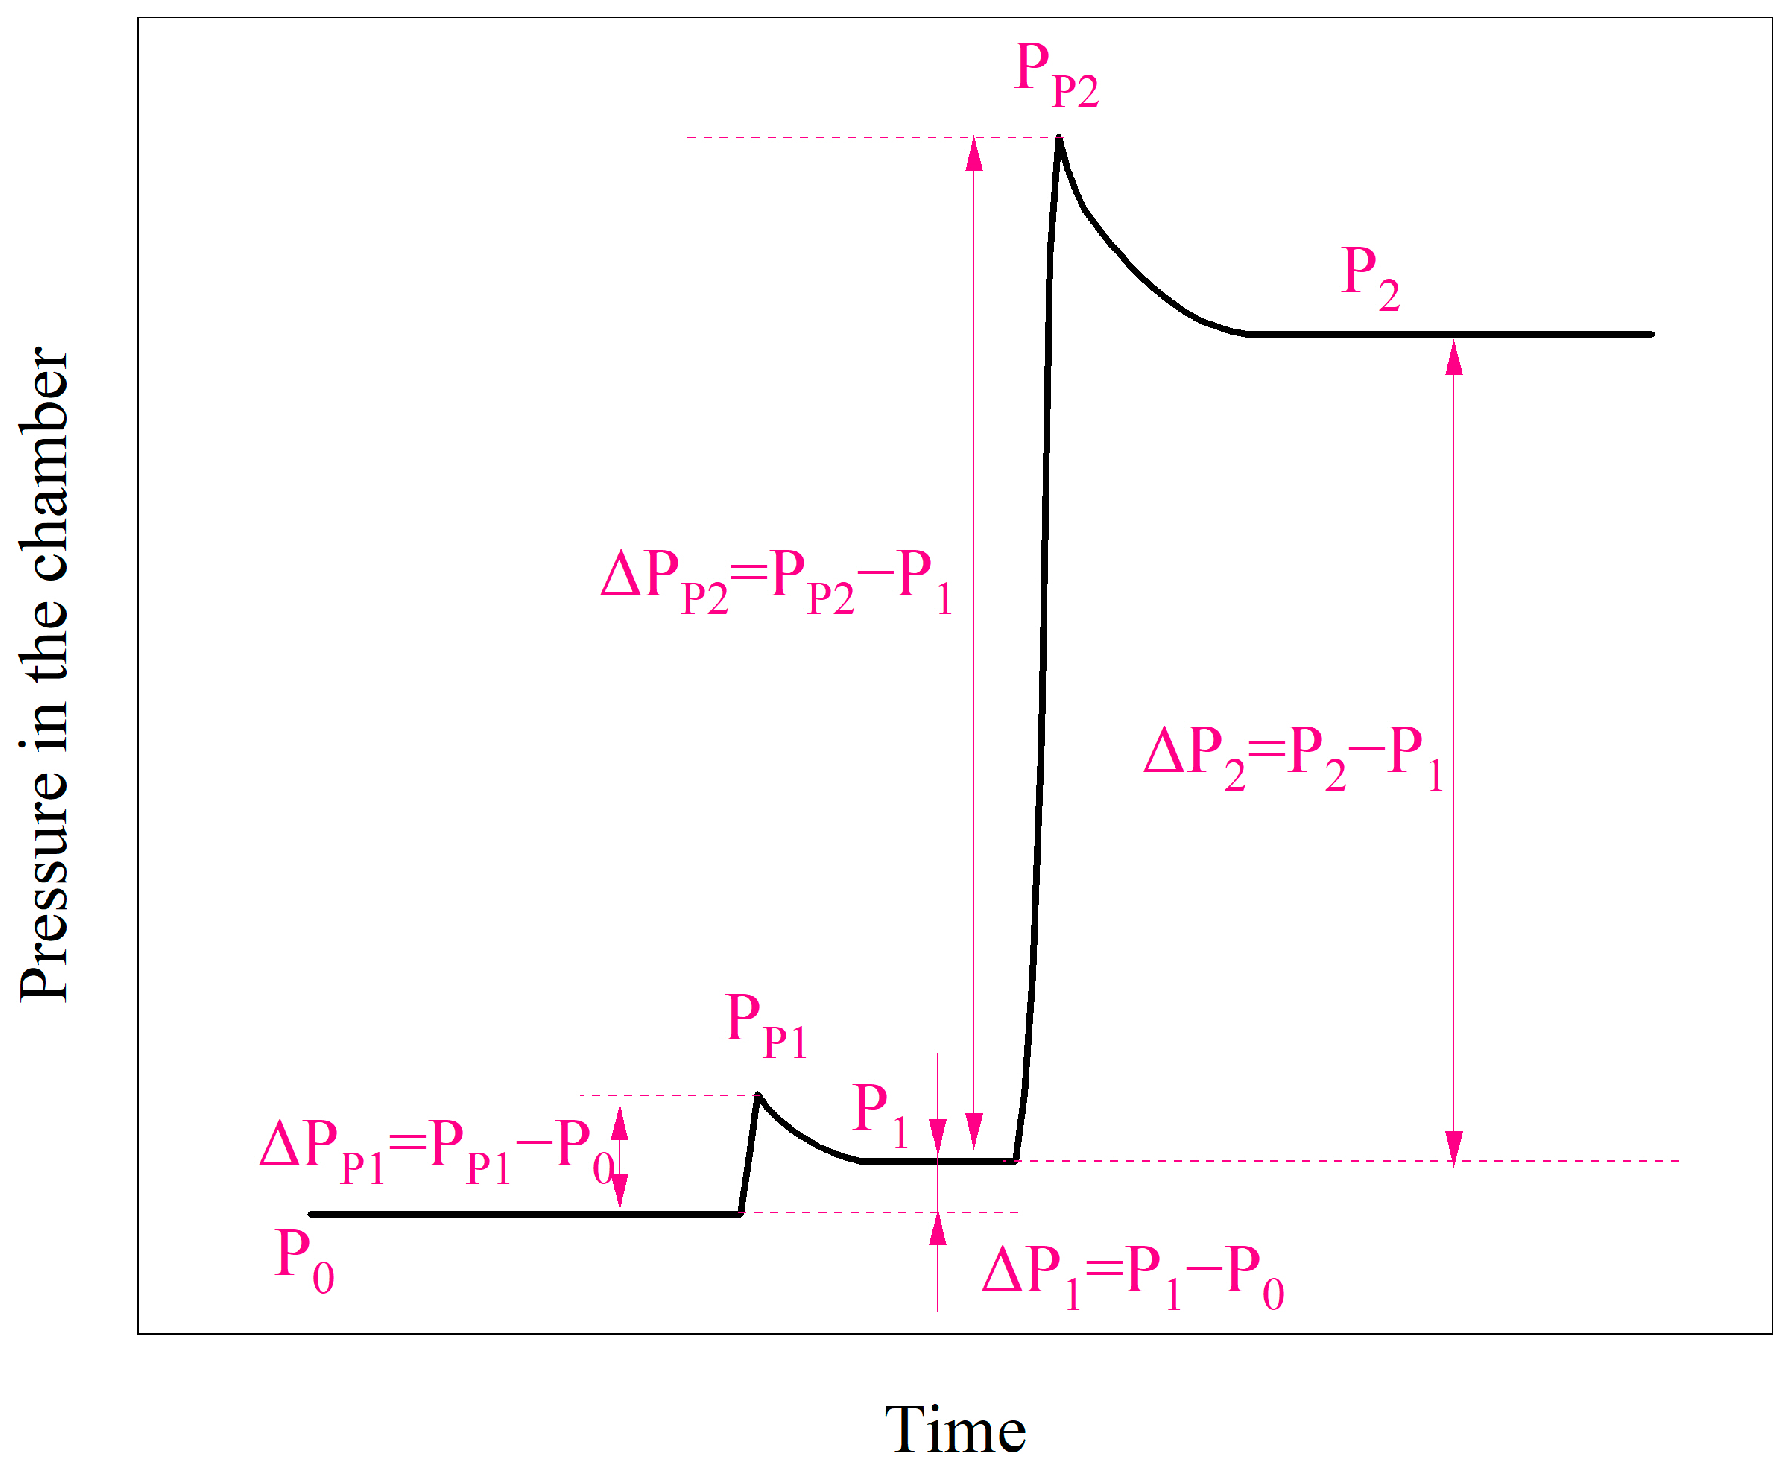
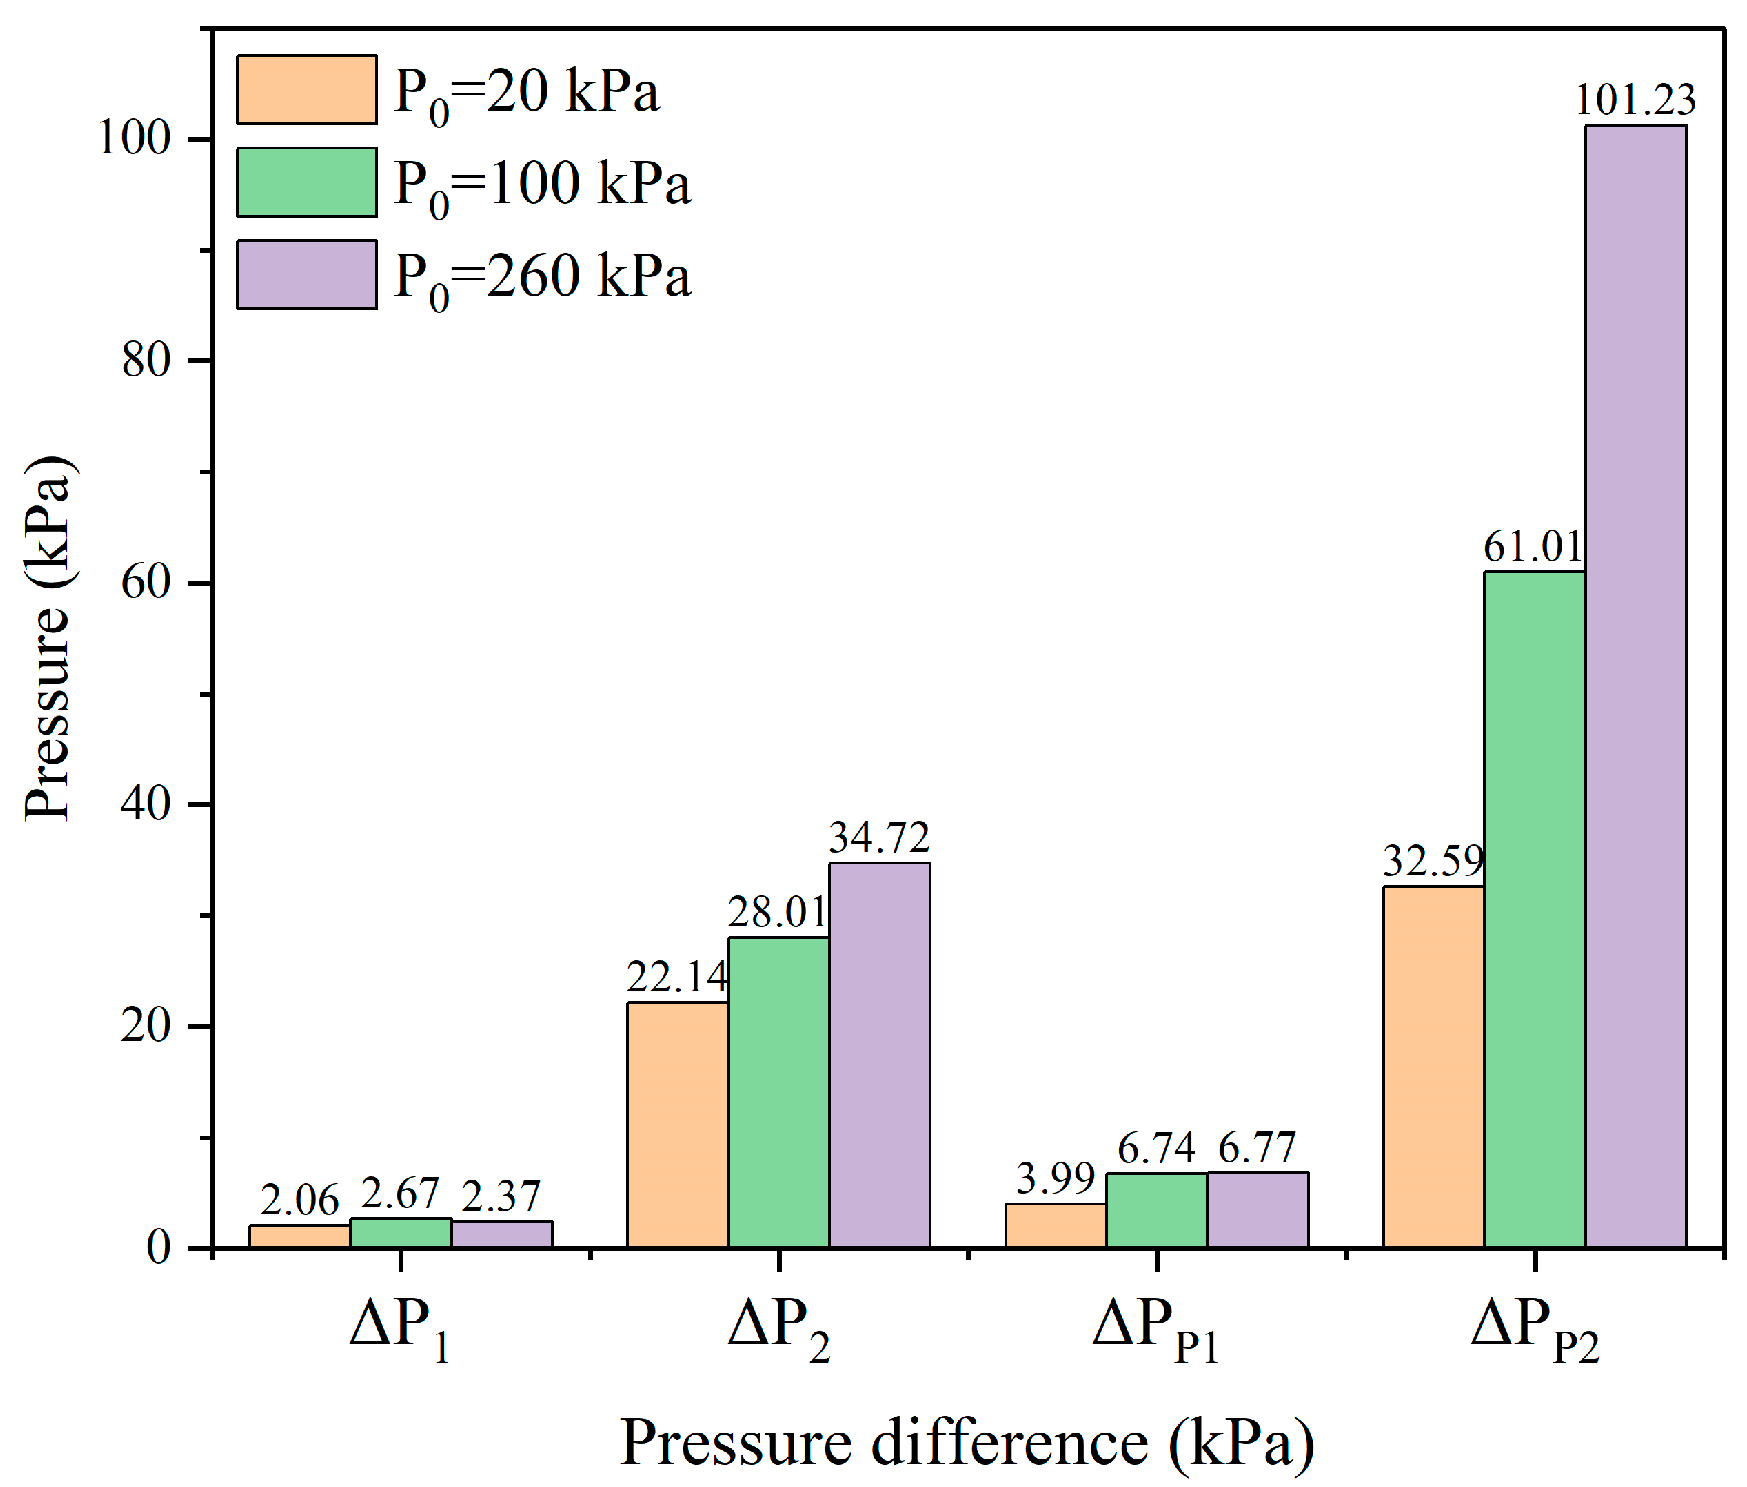
3.2.1. Evolution of Pressure in the Chamber
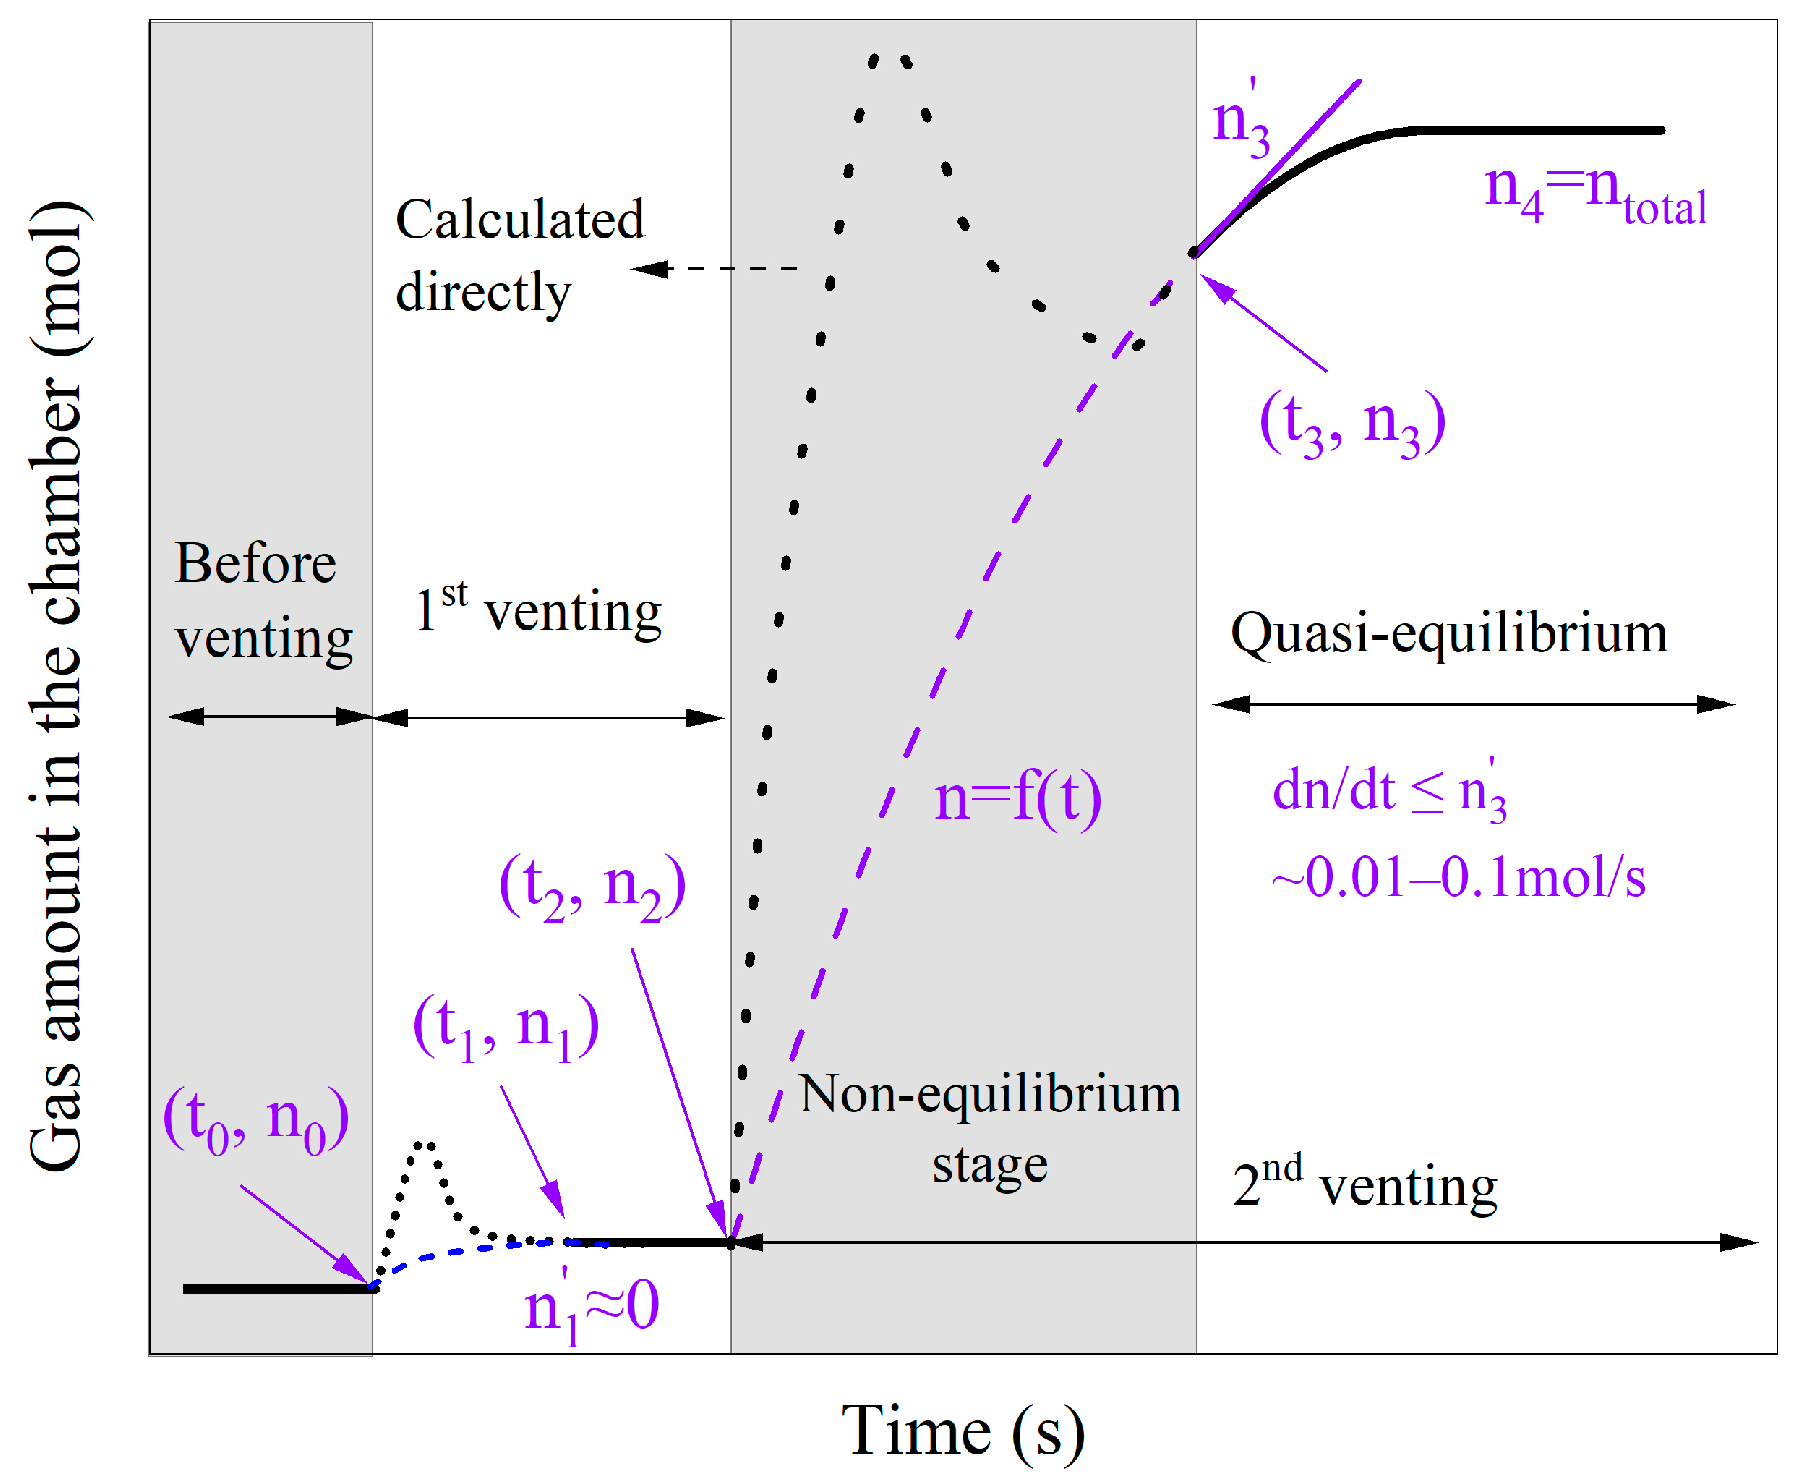
3.2.2. Evaluation of Gas Amount
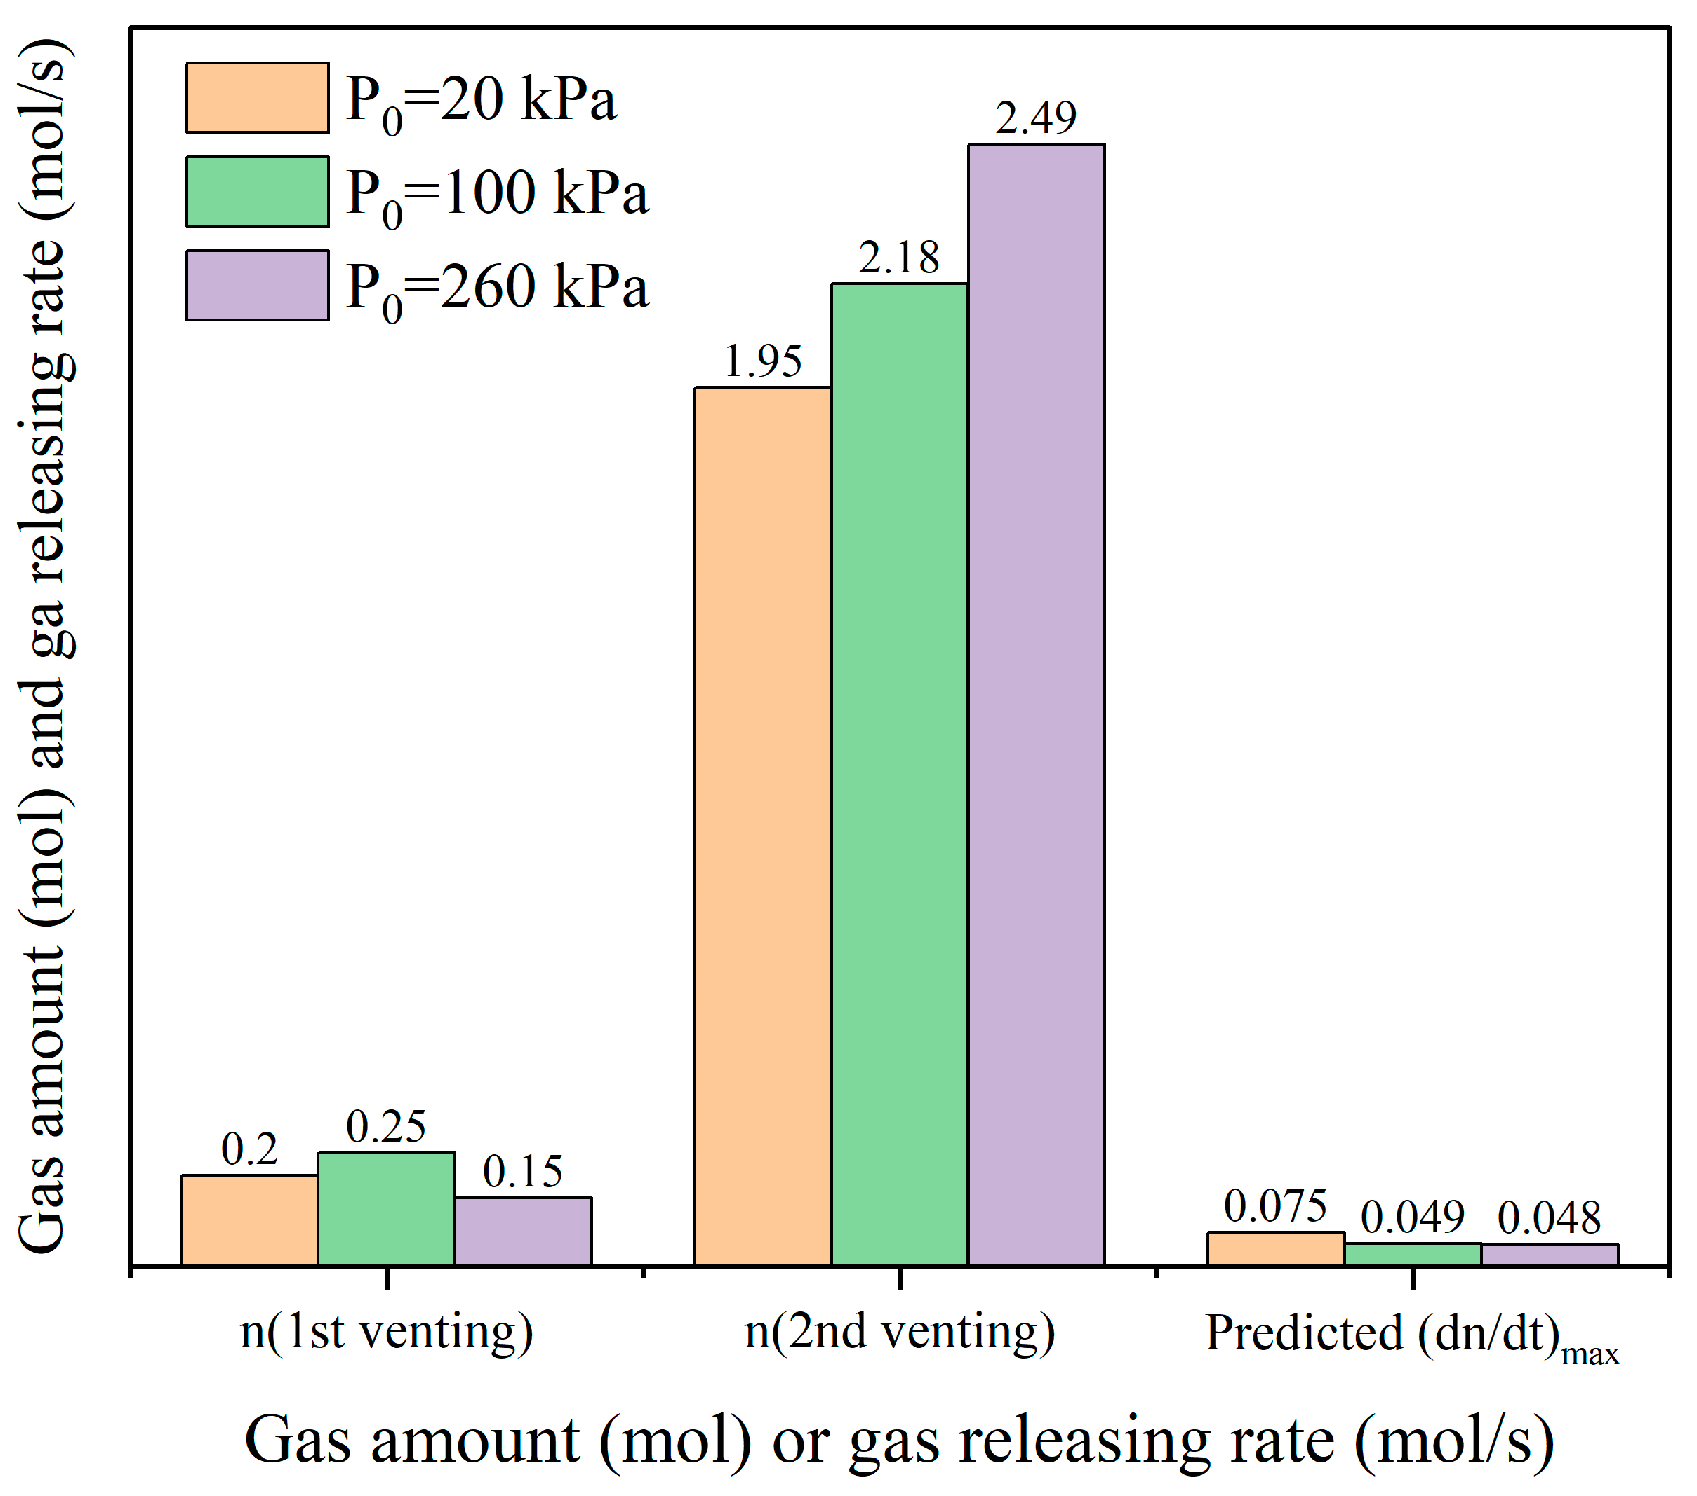
3.2.3. Venting Characteristic Parameters
3.3. Gas Analysis
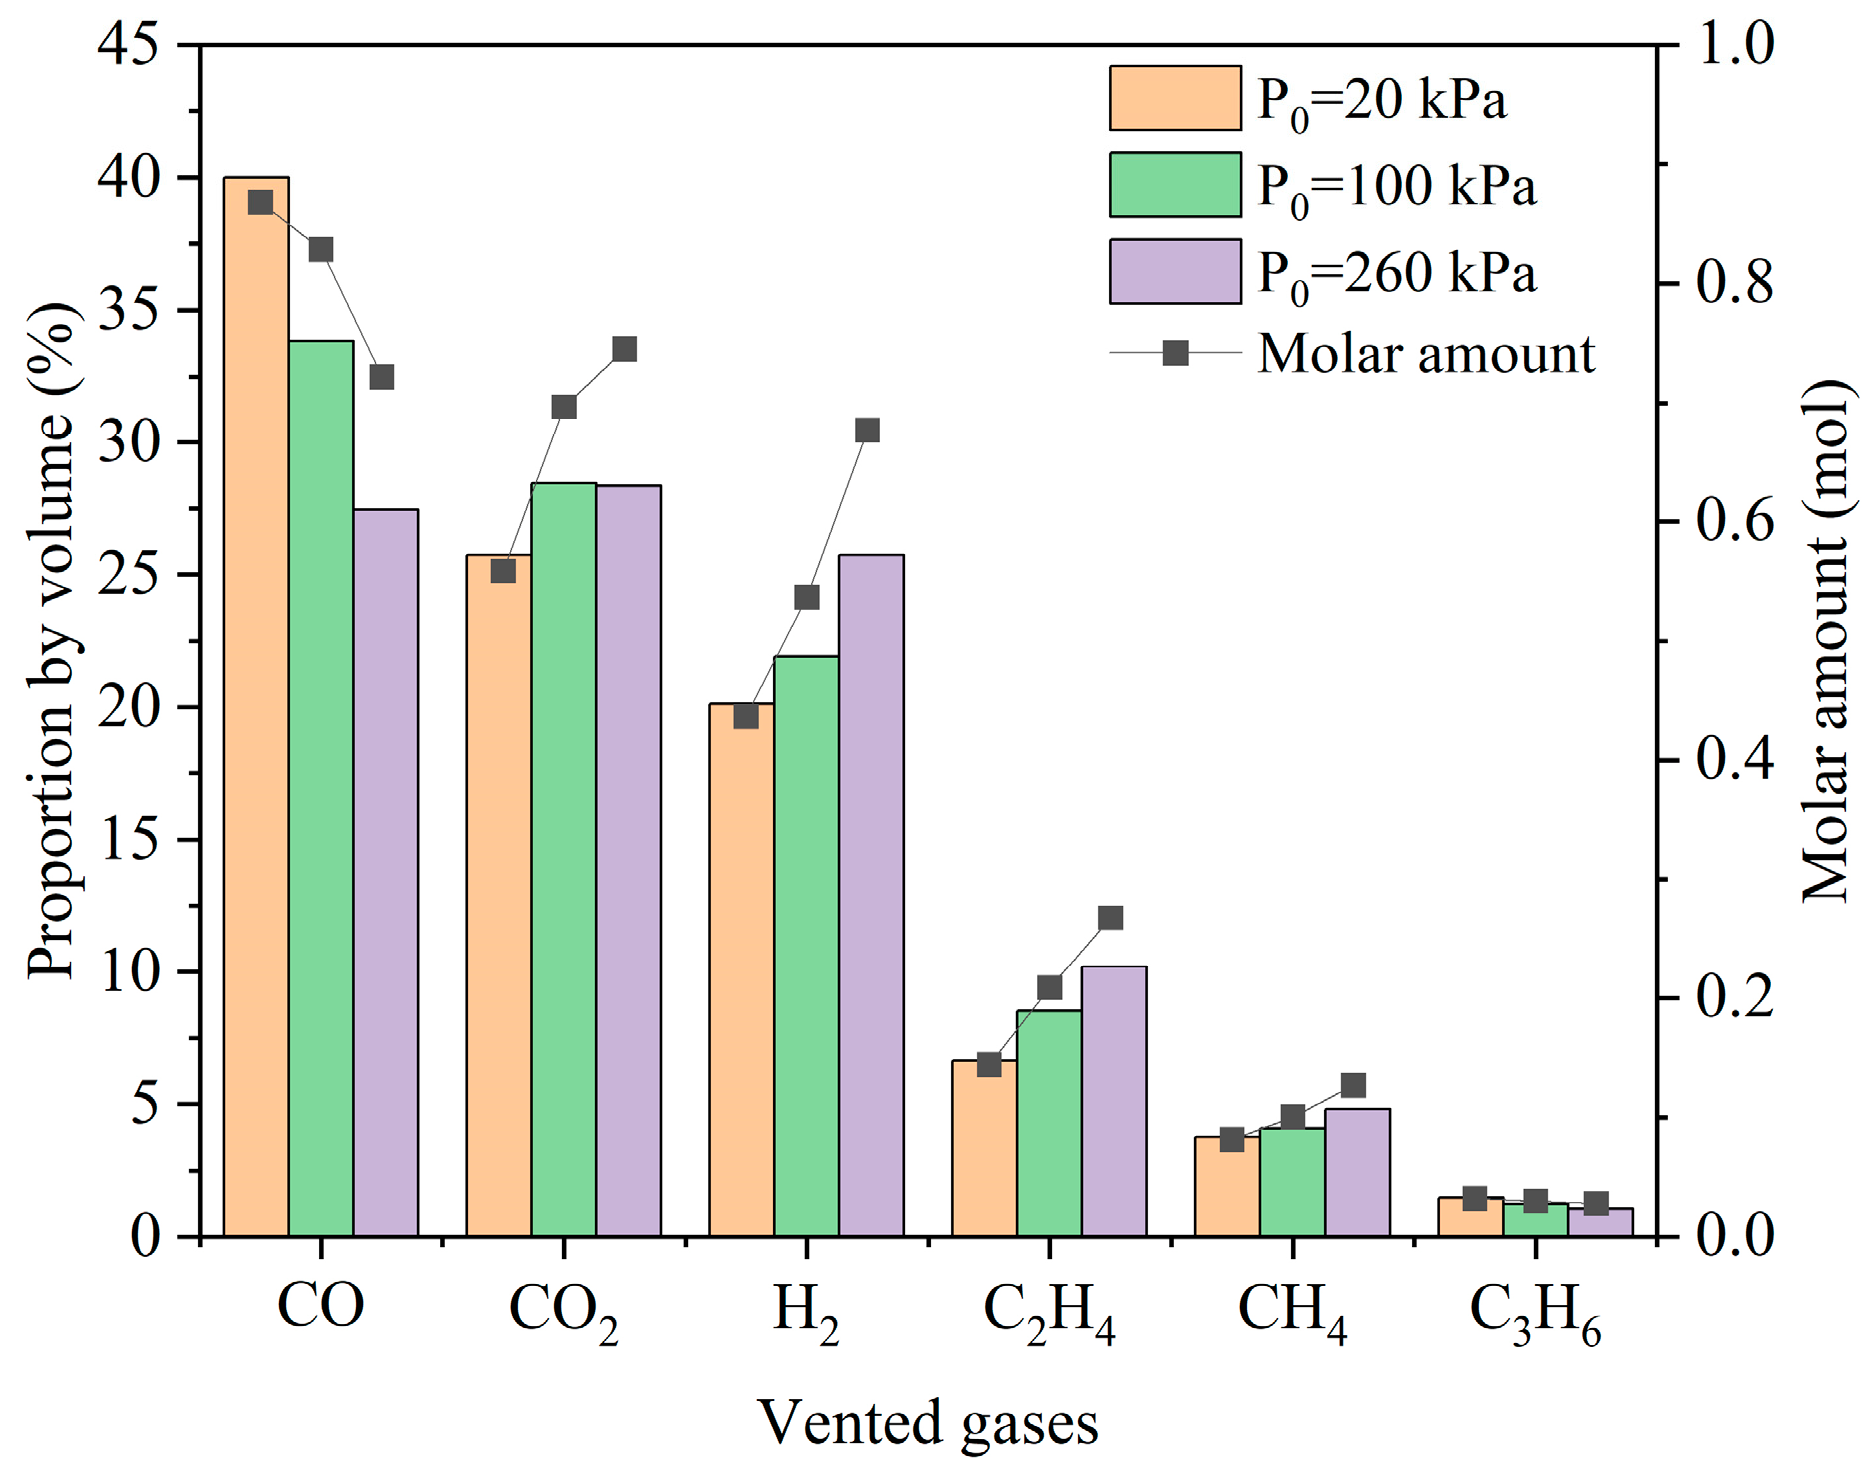
3.3.1. Compositions of Vented Gases
3.3.2. Flammability Characteristics of Vented Gases
4. Discussion
5. Conclusions
- (1)
- Different ambient pressures significantly affect the TR process and gas venting behaviors.
- (2)
- In this study, lower ambient pressure leads to an earlier venting event, mitigates the intensity of TR in terms of maximum battery temperature, and reserves more response time for hazard prevention. Simultaneously, lower ambient pressure reduces the total gas amount and increases the mass loss ratio.
- (3)
- Pressure effects and shocks are remarkable at elevated ambient pressures, particularly during the second venting event. The first venting event contributes minimally to the overall venting process, except for providing early warnings for TR.
- (4)
- The six most common gas species above 1% by volume were detected under different pressures, including CO, CO2, H2, C2H4, CH4, and C3H6, accounting for over 97% of all vented gases by volume. Lower ambient pressure implies more incomplete reactions during the process of TR and releases less CO2.
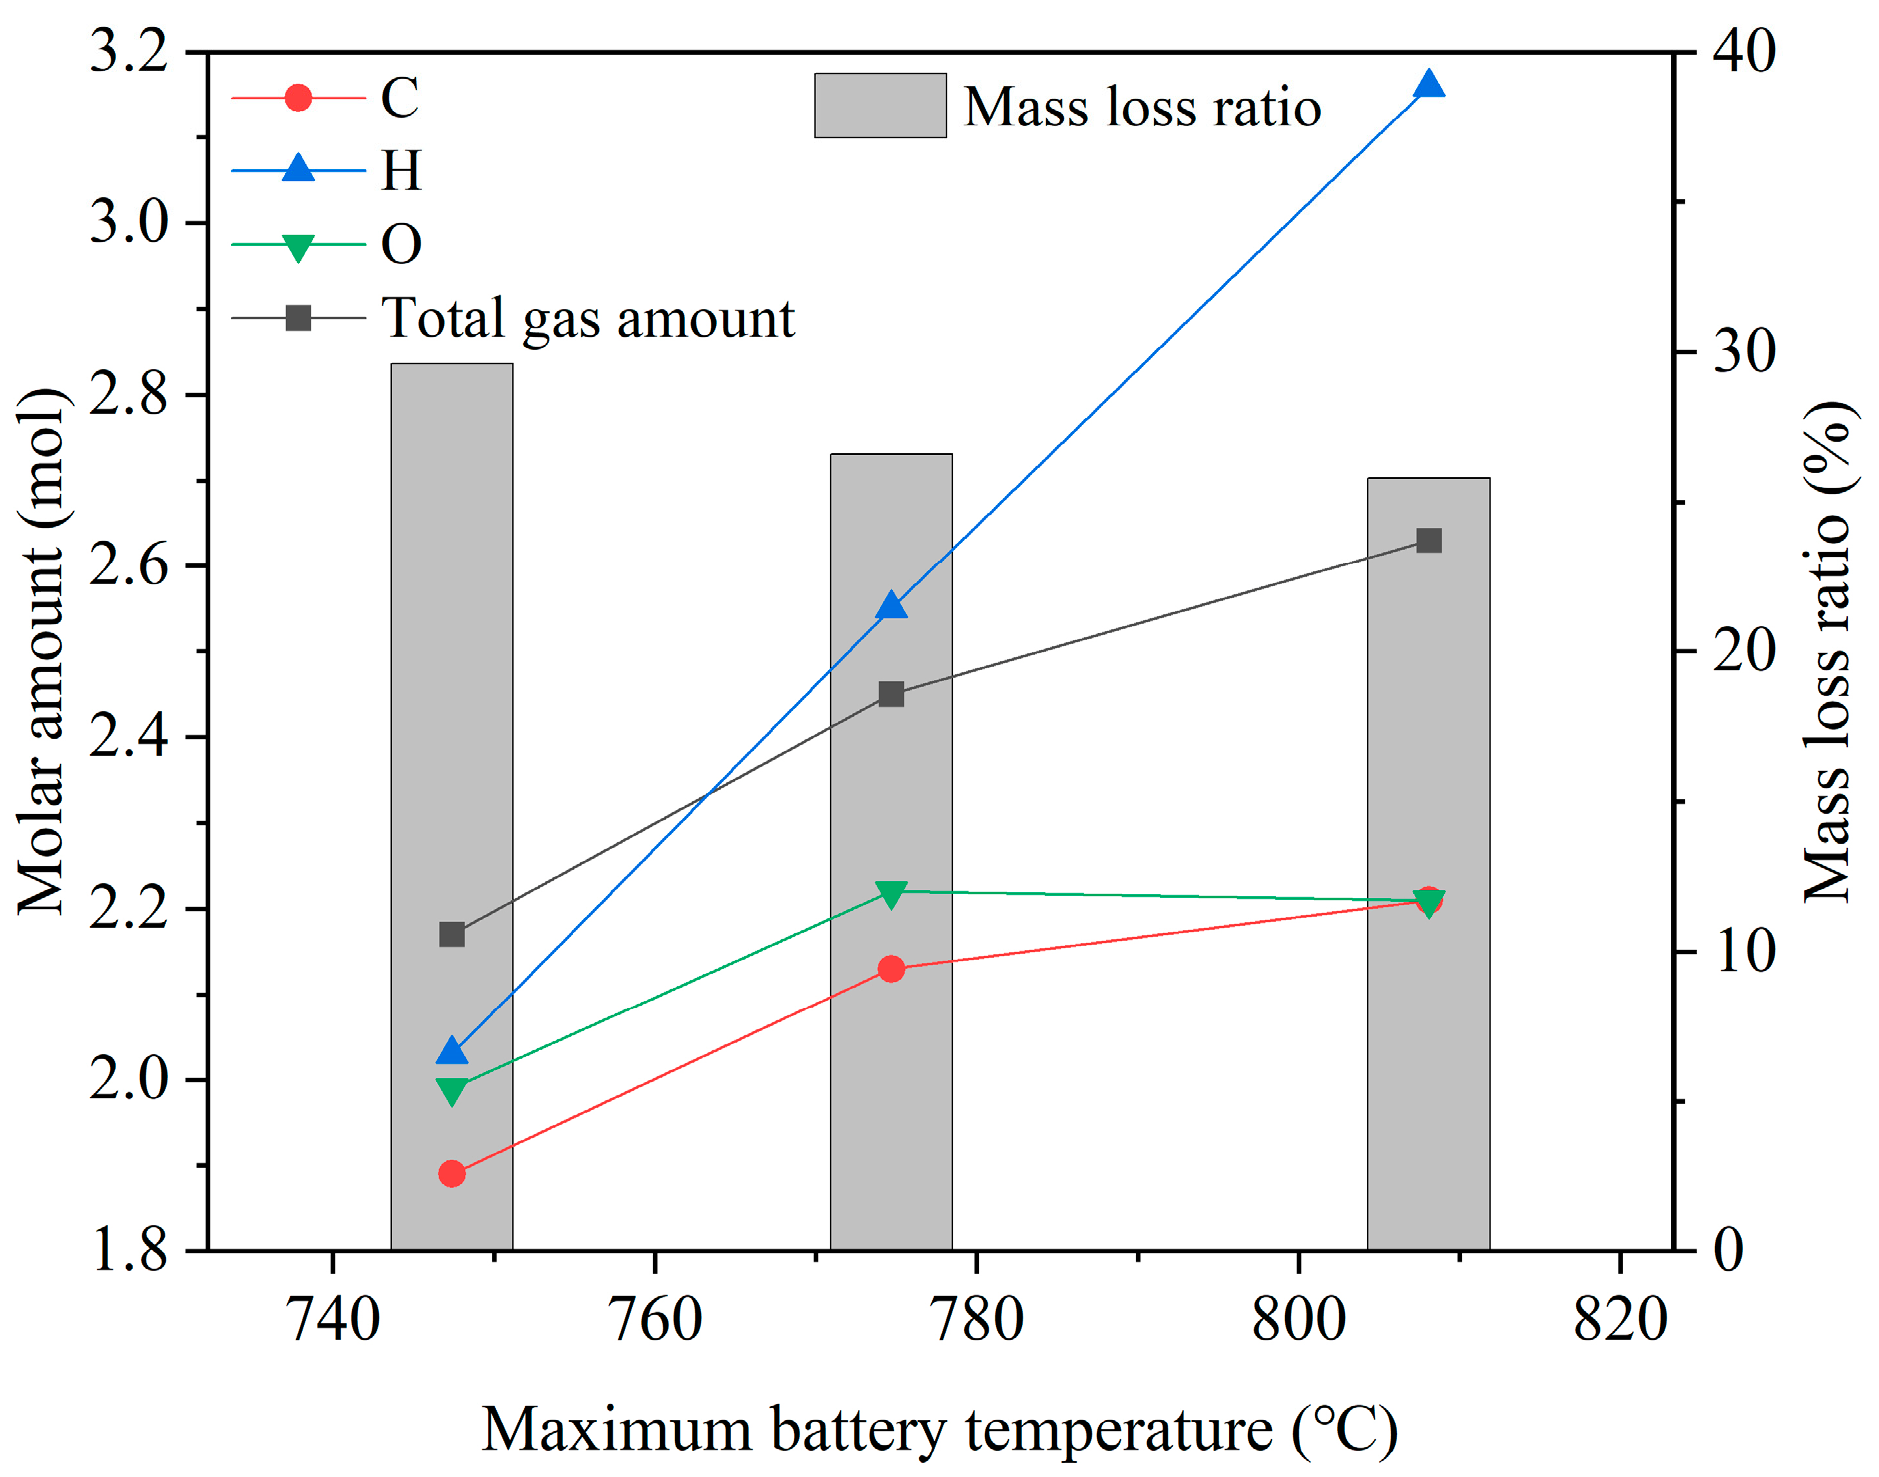
- (5)
- Among the main vented gases, element H increases significantly with ambient pressure, indicating that electrolytes and separators contribute more to gas generation during TR under higher pressures.
- (6)
- Reducing ambient pressure or burst pressure of the safety valve enhances the safety design of battery systems.
Author Contributions
Funding
Data Availability Statement
Conflicts of Interest
References
- Li, X.; Yuan, C.; Wang, Z.; He, J.; Yu, S. Lithium battery state-of-health estimation and remaining useful lifetime prediction based on non-parametric aging model and particle filter algorithm. eTransportation 2022, 11, 100156. [Google Scholar] [CrossRef]
- Steinstraeter, M.; Buberger, J.; Minnerup, K.; Trifonov, D.; Horner, P.; Weiss, B.; Lienkamp, M. Controlling cabin heating to improve range and battery lifetime of electric vehicles. eTransportation 2022, 13, 100181. [Google Scholar] [CrossRef]
- Widmer, F.; Ritter, A.; Duhr, P.; Onder, C.H. Battery lifetime extension through optimal design and control of traction and heating systems in hybrid drivetrains. eTransportation 2022, 14, 100196. [Google Scholar] [CrossRef]
- Wang, Q.; Mao, B.; Stoliarov, S.I.; Sun, J. A review of lithium ion battery failure mechanisms and fire prevention strategies. Prog. Energy Combust. 2019, 73, 95–131. [Google Scholar] [CrossRef]
- Sun, P.; Bisschop, R.; Niu, H.; Huang, X. A Review of Battery Fires in Electric Vehicles. Fire Technol. 2020, 56, 1361–1410. [Google Scholar] [CrossRef]
- Wang, Q.; Ping, P.; Zhao, X.; Chu, G.; Sun, J.; Chen, C. Thermal runaway caused fire and explosion of lithium ion battery. J. Power Sources 2012, 208, 210–224. [Google Scholar] [CrossRef]
- Finegan, D.P.; Darcy, E.; Keyser, M.; Tjaden, B.; Heenan, T.M.M.; Jervis, R.; Bailey, J.J.; Vo, N.T.; Magdysyuk, O.V.; Drakopoulos, M. Identifying the Cause of Rupture of Li-Ion Batteries during Thermal Runaway. Adv. Sci. 2018, 5, 329. [Google Scholar] [CrossRef]
- Bordes, A.; Papin, A.; Marlair, G.; Claude, T.; El-Masri, A.; Durussel, T.; Bertrand, J.-P.; Truchot, B.; Lecocq, A. Assessment of Run-Off Waters Resulting from Lithium-Ion Battery Fire-Fighting Operations. Batteries 2024, 10, 118. [Google Scholar] [CrossRef]
- Chen, S.; Wang, Z.; Yan, W. Identification and characteristic analysis of powder ejected from a lithium ion battery during thermal runaway at elevated temperatures. J. Hazard. Mater. 2020, 400, 123169. [Google Scholar] [CrossRef]
- Li, C.; Wang, H.; Li, Y.; Lu, L. Venting particle-induced arc of lithium-ion batteries during the thermal runaway. eTransportation 2024, 22, 100350. [Google Scholar] [CrossRef]
- Coman, P.T.; Mátéfi-Tempfli, S.; Veje, C.T.; White, R.E. Modeling Vaporization, Gas Generation and Venting in Li-Ion Battery Cells with a Dimethyl Carbonate Electrolyte. J. Electrochem. Soc. 2017, 164, A1858–A1865. [Google Scholar]
- Fernandes, Y.; Bry, A.; Persis, S.D. Identification and quantification of gases emitted during abuse tests by overcharge of a commercial Li-ion battery. J. Power Sources 2018, 389, 106–119. [Google Scholar]
- Larsson, F.; Bertilsson, S.; Furlani, M.; Albinsson, I.; Mellander, B.-E. Gas explosions and thermal runaways during external heating abuse of commercial lithium-ion graphite-LiCoO2 cells at different levels of ageing. J. Power Sources 2018, 373, 220–231. [Google Scholar] [CrossRef]
- Finegan, D.P.; Scheel, M.; Robinson, J.B.; Tjaden, B.; Hunt, I.; Mason, T.J.; Millichamp, J.; Di Michiel, M.; Offer, G.J.; Hinds, G. In-operando high-speed tomography of lithium-ion batteries during thermal runaway. Nat. Commun. 2015, 6, 6924. [Google Scholar] [CrossRef] [PubMed]
- Zhang, Y.; Wang, H.; Li, W.; Li, C. Quantitative identification of emissions from abused prismatic Ni-rich lithium-ion batteries. eTransportation 2019, 2, 100031. [Google Scholar] [CrossRef]
- Golubkov, A.W.; Fuchs, D.; Wagner, J.; Wiltsche, H.; Stangl, C.; Fauler, G.; Voitic, G.; Thaler, A.; Hacker, V. Thermal-runaway experiments on consumer Li-ion batteries with metal-oxide and olivin-type cathodes. Rsc. Adv. 2014, 4, 3633–3642. [Google Scholar] [CrossRef]
- Koch, S.; Fill, A.; Birke, K.P. Comprehensive gas analysis on large scale automotive lithium-ion cells in thermal runaway. J. Power Sources 2018, 398, 106–112. [Google Scholar] [CrossRef]
- Golubkov, A.W.; Scheikl, S.; Planteu, R.; Voitic, G.; Wiltsche, H.; Stangl, C.; Fauler, G.; Thaler, A.; Hacker, V. Thermal runaway of commercial 18650 Li-ion batteries with LFP and NCA cathodes—Impact of state of charge and overcharge. Rsc. Adv. 2015, 5, 57171–57186. [Google Scholar]
- Wang, G.; Kong, D.; Ping, P.; Wen, J.; He, X.; Zhao, H.; He, X.; Peng, R.; Zhang, Y.; Dai, X. Revealing particle venting of lithium-ion batteries during thermal runaway: A multi-scale model toward multiphase process. eTransportation 2023, 16, 100237. [Google Scholar] [CrossRef]
- Yang, Y.; Fang, D.; Maleki, A.; Kohzadi, S.; Liu, Y.; Chen, Y.; Liu, R.; Gao, G.; Zhi, J. Characterization of Thermal-Runaway Particles from Lithium Nickel Manganese Cobalt Oxide Batteries and Their Biotoxicity Analysis. ACS Appl. Energy Mater. 2021, 4, 10713–10720. [Google Scholar] [CrossRef]
- Ubaldi, S.; Conti, M.; Marra, F.; Russo, P. Identification of Key Events and Emissions during Thermal Abuse Testing on NCA 18650 Cells. Energies 2023, 16, 3250. [Google Scholar] [CrossRef]
- Barone, T.L.; Dubaniewicz, T.H.; Friend, S.A.; Zlochower, I.A.; Bugarski, A.D.; Rayyan, N.S. Lithium-ion battery explosion aerosols: Morphology and elemental composition. Aerosol Sci. Technol. 2021, 55, 1183–1201. [Google Scholar] [CrossRef] [PubMed]
- Le Chatelier, H.; Boudouard, O. Limits of Flammability of Gaseous Mixtures. Bulletin de la Société Chimique de France 1898, 19, 483–488. [Google Scholar]
- Ma, B.; Liu, J.; Yu, R. Study on the Flammability Limits of Lithium-Ion Battery Vent Gas under Different Initial Conditions. ACS Omega 2020, 5, 28096–28107. [Google Scholar] [PubMed]
- Li, W.; Wang, H.; Zhang, Y.; Ouyang, M. Flammability characteristics of the battery vent gas: A case of NCA and LFP lithium-ion batteries during external heating abuse. J. Energy Storage 2019, 24, 100775. [Google Scholar] [CrossRef]
- Chen, M.; Liu, J.; He, Y.; Yuen, R.; Wang, J. Study of the fire hazards of lithium-ion batteries at different pressures. Appl. Therm. Eng. 2017, 125, 1061–1074. [Google Scholar] [CrossRef]
- Coman, P.T.; Rayman, S.; White, R.E. A lumped model of venting during thermal runaway in a cylindrical Lithium Cobalt Oxide lithium-ion cell. J. Power Sources 2016, 307, 56–62. [Google Scholar] [CrossRef]
- Chen, Y.; Gong, W.; Zhang, W. Life Cycle Prediction Model of Safety Vent Based on Two-Phase Degradation Process. IEEE Access 2018, 6, 19034–19043. [Google Scholar]
- Li, C.; Wang, H.; Shi, C.; Wang, Y.; Li, Y.; Ouyang, M. A Fitting Method to Characterize the Gaseous Venting Behavior of Lithium–Ion Batteries in a Sealed Chamber during Thermal Runaway. Energies 2023, 16, 7874. [Google Scholar] [CrossRef]

| Parameters | Value |
|---|---|
| Nominal capacity (Ah) | 50 |
| State of charge (%) | 75 |
| Nominal weight (g) | 865 |
| Size (mm) | 148 × 27 × 102 |
| Type | Prismatic |
| Cathode | Li(Ni0.5Co0.2Mn0.3)O2 |
| Anode | Graphite |
| Specific energy density (Wh/kg) | 212 |
| Ambient pressure (kPa) | 20, 100, 260 |
| Parameters | P0 = 20 kPa | P0 = 100 kPa | P0 = 260 kPa |
|---|---|---|---|
| Maximum battery temperature (°C) | 749.9 | 778.4 | 827 |
| Maximum jet temperature of 1st peak (°C) | 113.5 | 107.7 | 135.8 |
| Maximum jet temperature of 2nd peak (°C) | 309.2 | 239.4 | 200.2 |
| Parameters | P0 = 20 kPa | P0 = 100 kPa | P0 = 260 kPa |
|---|---|---|---|
| t0 (s) | 0 | 0 | 0 |
| n0 (mol) | 2.28 | 9.75 | 24.54 |
| t1 (s) | 66 | 57 | 51 |
| n1 (mol) | 2.42 | 9.89 | 24.63 |
| n1′ (mol/s) | 0.00018 | 0.0011 | 0.0024 |
| t2 (s) | 250 | 219 | 94 |
| n2 (mol) | 2.48 | 9.99 | 24.69 |
| t3 (s) | 289 | 269 | 148 |
| n3 (mol) | 4.09 | 11.58 | 26.42 |
| n3′ (mol/s) | 0.0075 | 0.015 | 0.016 |
| n4 (mol) | 4.43 | 12.17 | 27.18 |
| Parameters | P0 = 20 kPa | P0 = 100 kPa | P0 = 260 kPa |
|---|---|---|---|
| t50 (s) | 264 | 243 | 124 |
| t50,1 (s) | 32 | 24 | 45 |
| t50,2 (s) | 16 | 28 | 33 |
| Parameters | P0 = 20 kPa | P0 = 100 kPa | P0 = 260 kPa |
|---|---|---|---|
| UFL (%) | 53.41 | 52.37 | 50.81 |
| LFL (%) | 8.53 | 8.20 | 7.49 |
| RF (%) | 44.88 | 44.17 | 43.33 |
| HF | 5.26 | 5.39 | 5.79 |
| Parameters | P0 = 20 kPa | P0 = 100 kPa | P0 = 260 kPa |
|---|---|---|---|
| Maximum battery temperature | + | o | − |
| Jet temperature | − | o | + |
| Pressure shock | + | o | − |
| Total gas amount | + | o | − |
| Gas releasing rate | − | o | + |
| Venting duration | + | o | − |
| Early warning | + | o | − |
| Flammability risk | + | o | − |
Disclaimer/Publisher’s Note: The statements, opinions and data contained in all publications are solely those of the individual author(s) and contributor(s) and not of MDPI and/or the editor(s). MDPI and/or the editor(s) disclaim responsibility for any injury to people or property resulting from any ideas, methods, instructions or products referred to in the content. |
© 2025 by the authors. Published by MDPI on behalf of the World Electric Vehicle Association. Licensee MDPI, Basel, Switzerland. This article is an open access article distributed under the terms and conditions of the Creative Commons Attribution (CC BY) license (https://creativecommons.org/licenses/by/4.0/).
Share and Cite
Li, C.; Wang, H.; Li, Y.; Ouyang, M. A Case Study on Gas Venting Events in NCM523 Batteries During Thermal Runaway Under Different Pressures in a Sealed Chamber. World Electr. Veh. J. 2025, 16, 189. https://doi.org/10.3390/wevj16040189
Li C, Wang H, Li Y, Ouyang M. A Case Study on Gas Venting Events in NCM523 Batteries During Thermal Runaway Under Different Pressures in a Sealed Chamber. World Electric Vehicle Journal. 2025; 16(4):189. https://doi.org/10.3390/wevj16040189
Chicago/Turabian StyleLi, Cheng, Hewu Wang, Yalun Li, and Minggao Ouyang. 2025. "A Case Study on Gas Venting Events in NCM523 Batteries During Thermal Runaway Under Different Pressures in a Sealed Chamber" World Electric Vehicle Journal 16, no. 4: 189. https://doi.org/10.3390/wevj16040189
APA StyleLi, C., Wang, H., Li, Y., & Ouyang, M. (2025). A Case Study on Gas Venting Events in NCM523 Batteries During Thermal Runaway Under Different Pressures in a Sealed Chamber. World Electric Vehicle Journal, 16(4), 189. https://doi.org/10.3390/wevj16040189