
Affordable Road Obstacle Detection and Active Suspension Control Using Inertial and Motion Sensors

 , , ,
, , ,  and
and 
Abstract
1. Introduction
2. Road Profile Estimation
2.1. Half-Car Dynamics
2.2. Vehicle Setup
2.3. Bump Test Experiments
2.4. Road Profile Observer
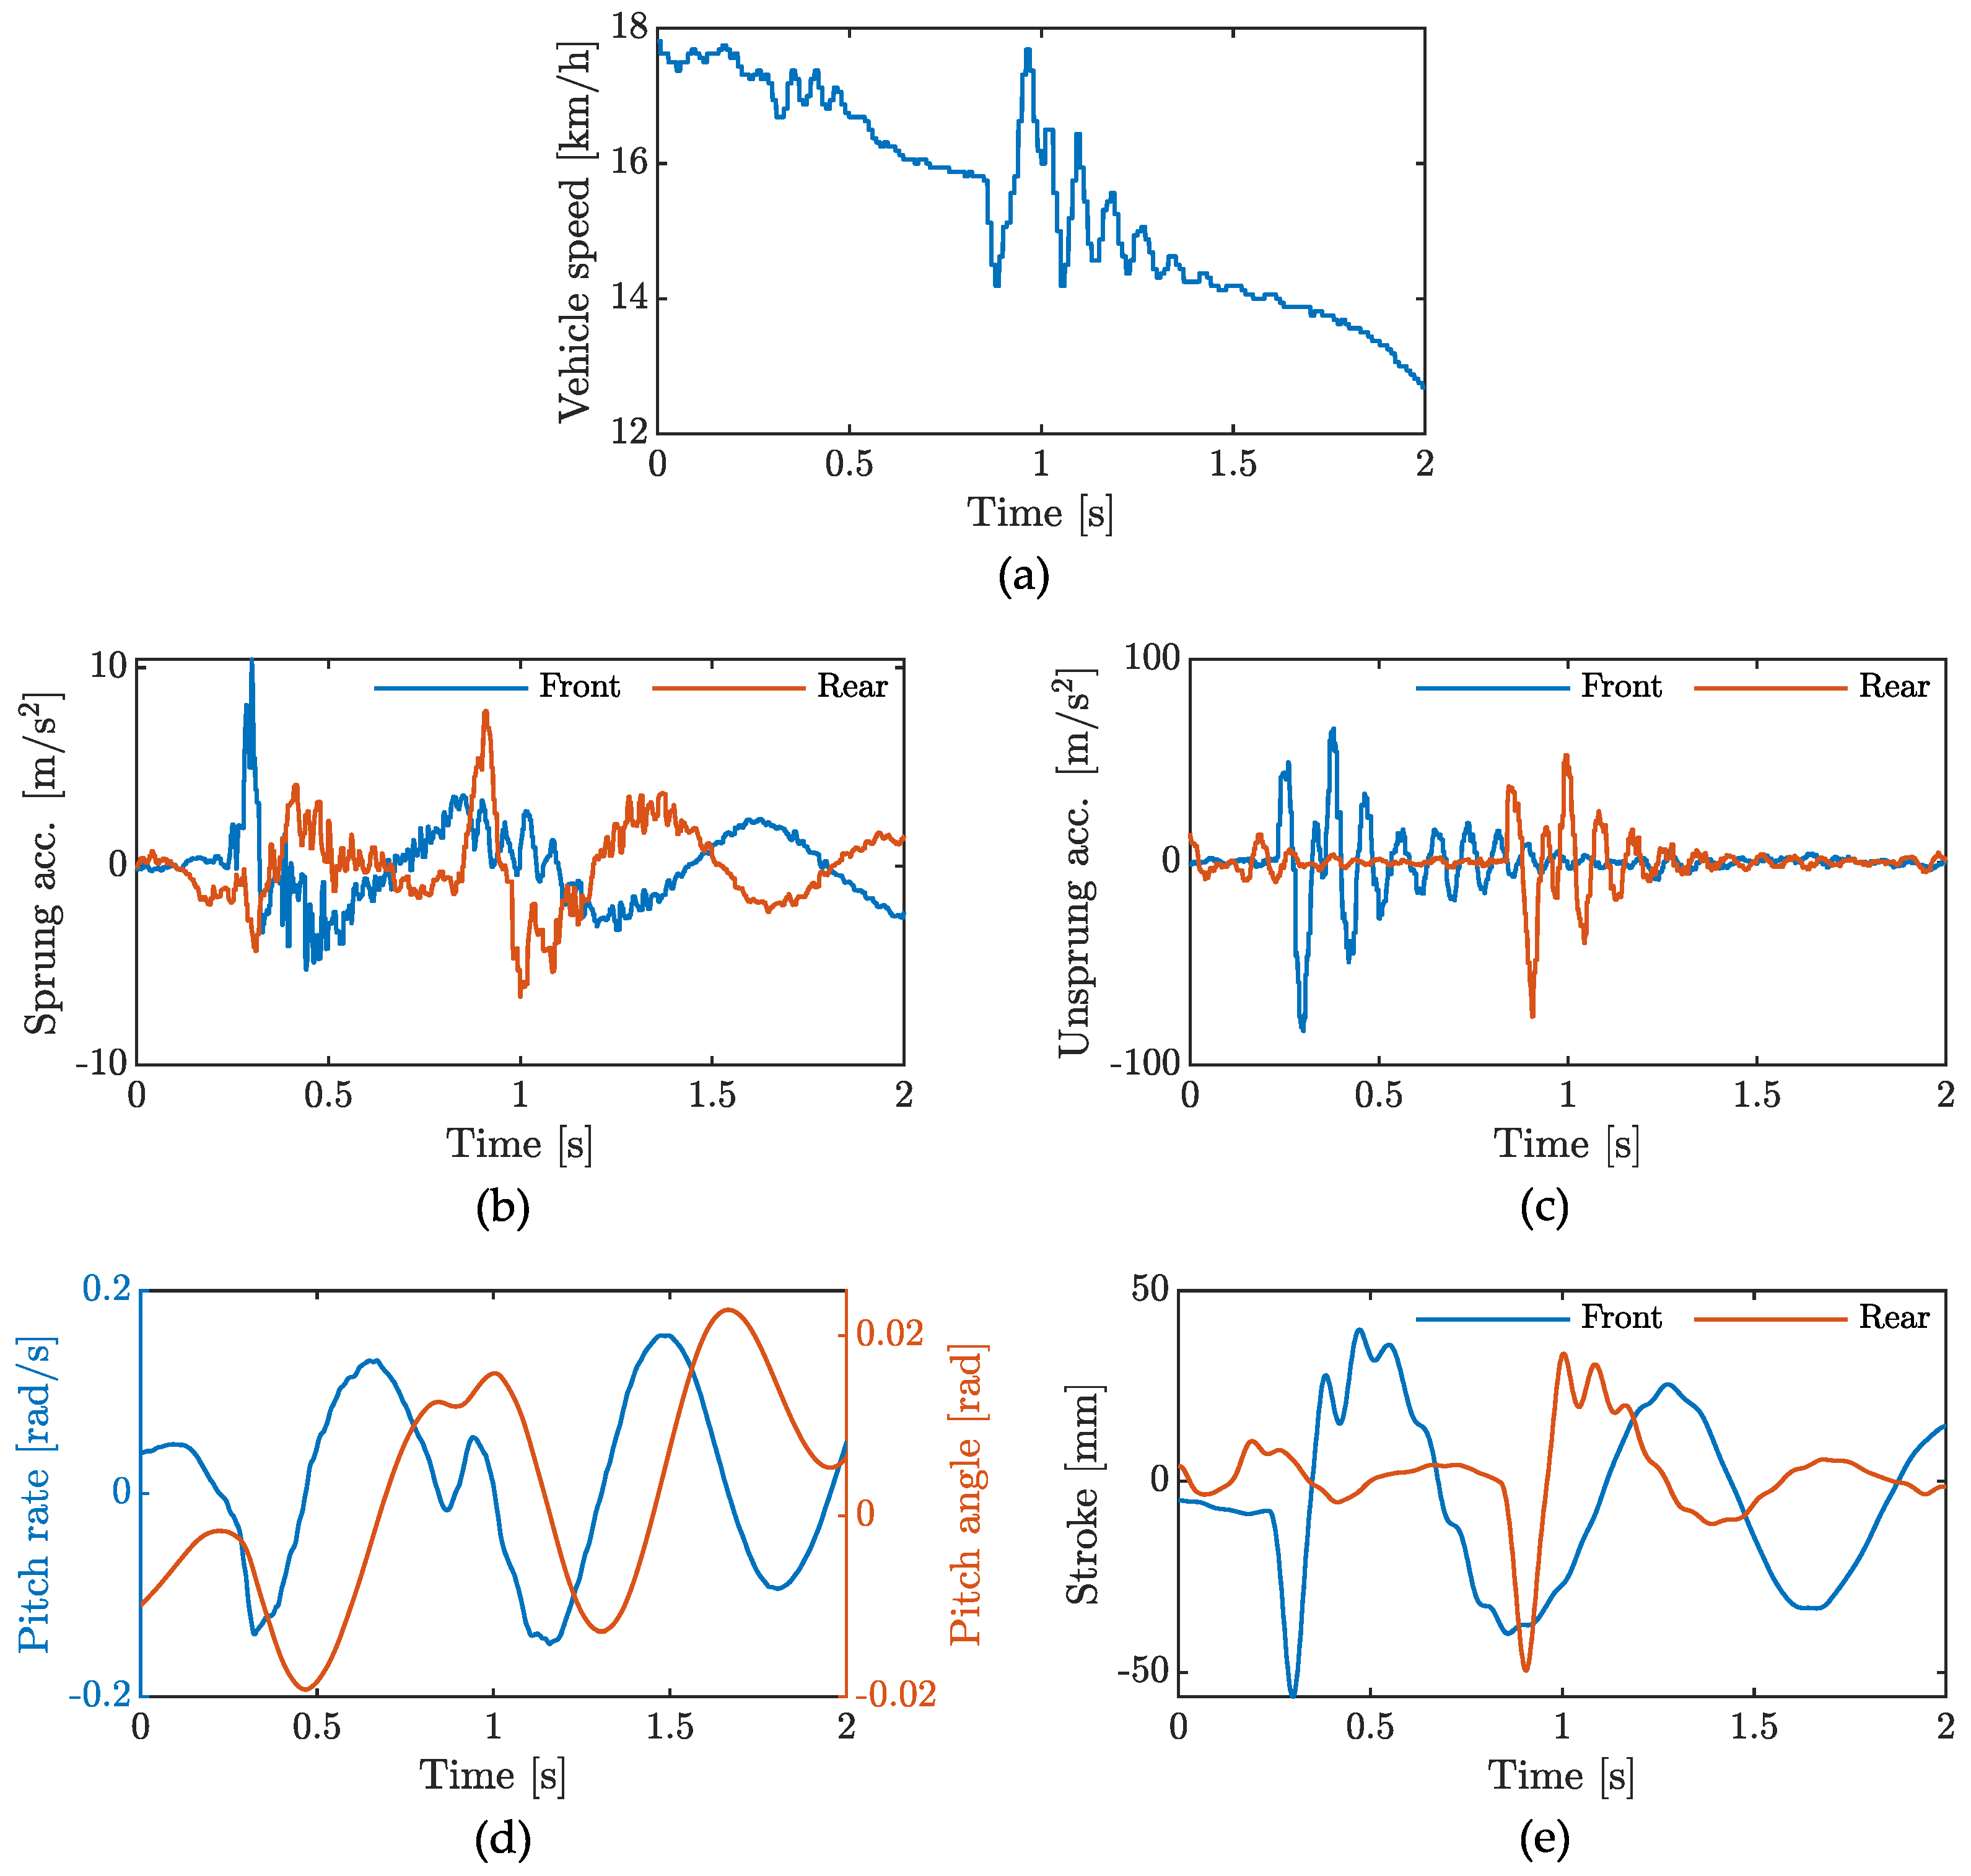
2.5. Experimental Validation
3. Control Strategies for the Bump Maneuver
3.1. Benchmark Control Strategies
3.2. Predictive Control Strategy
3.3. Key Performance Indicators for Bump Scenario
4. Results
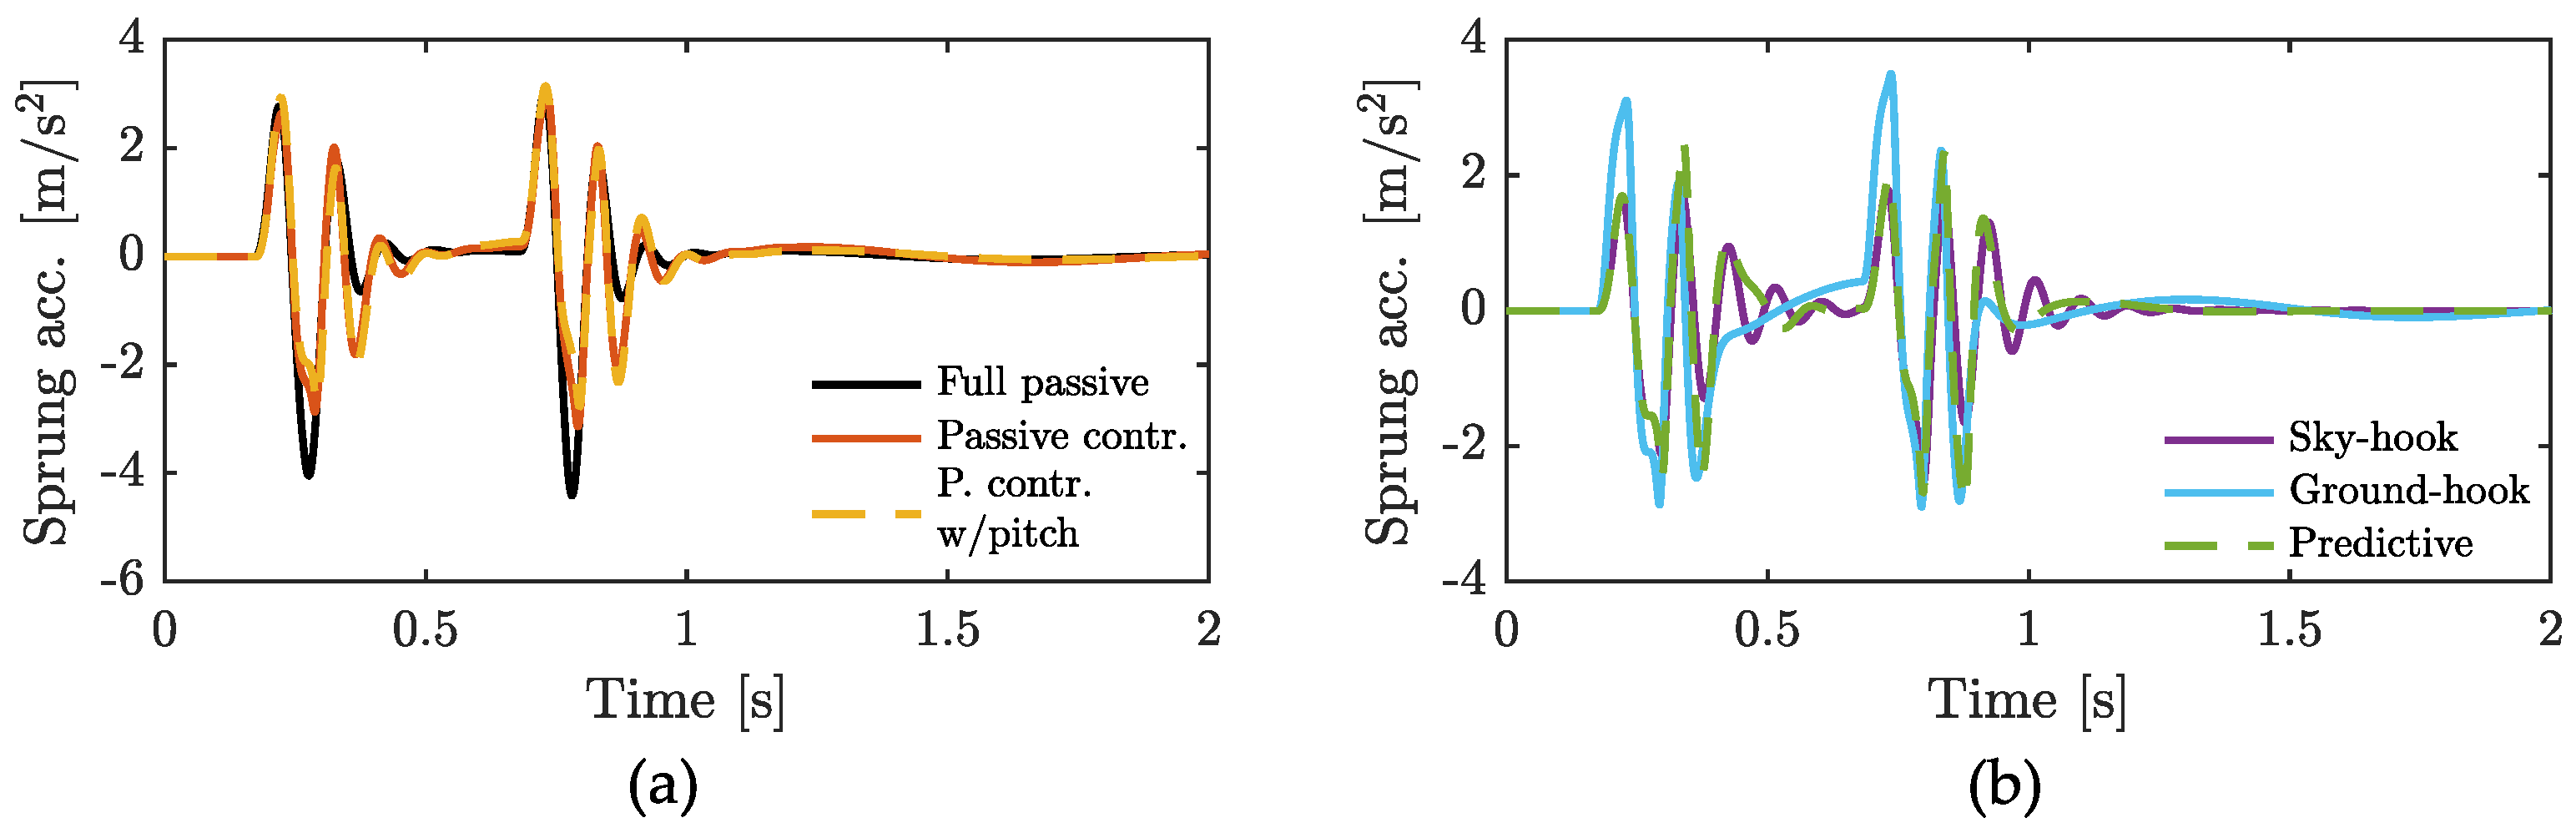
4.1. Comfort
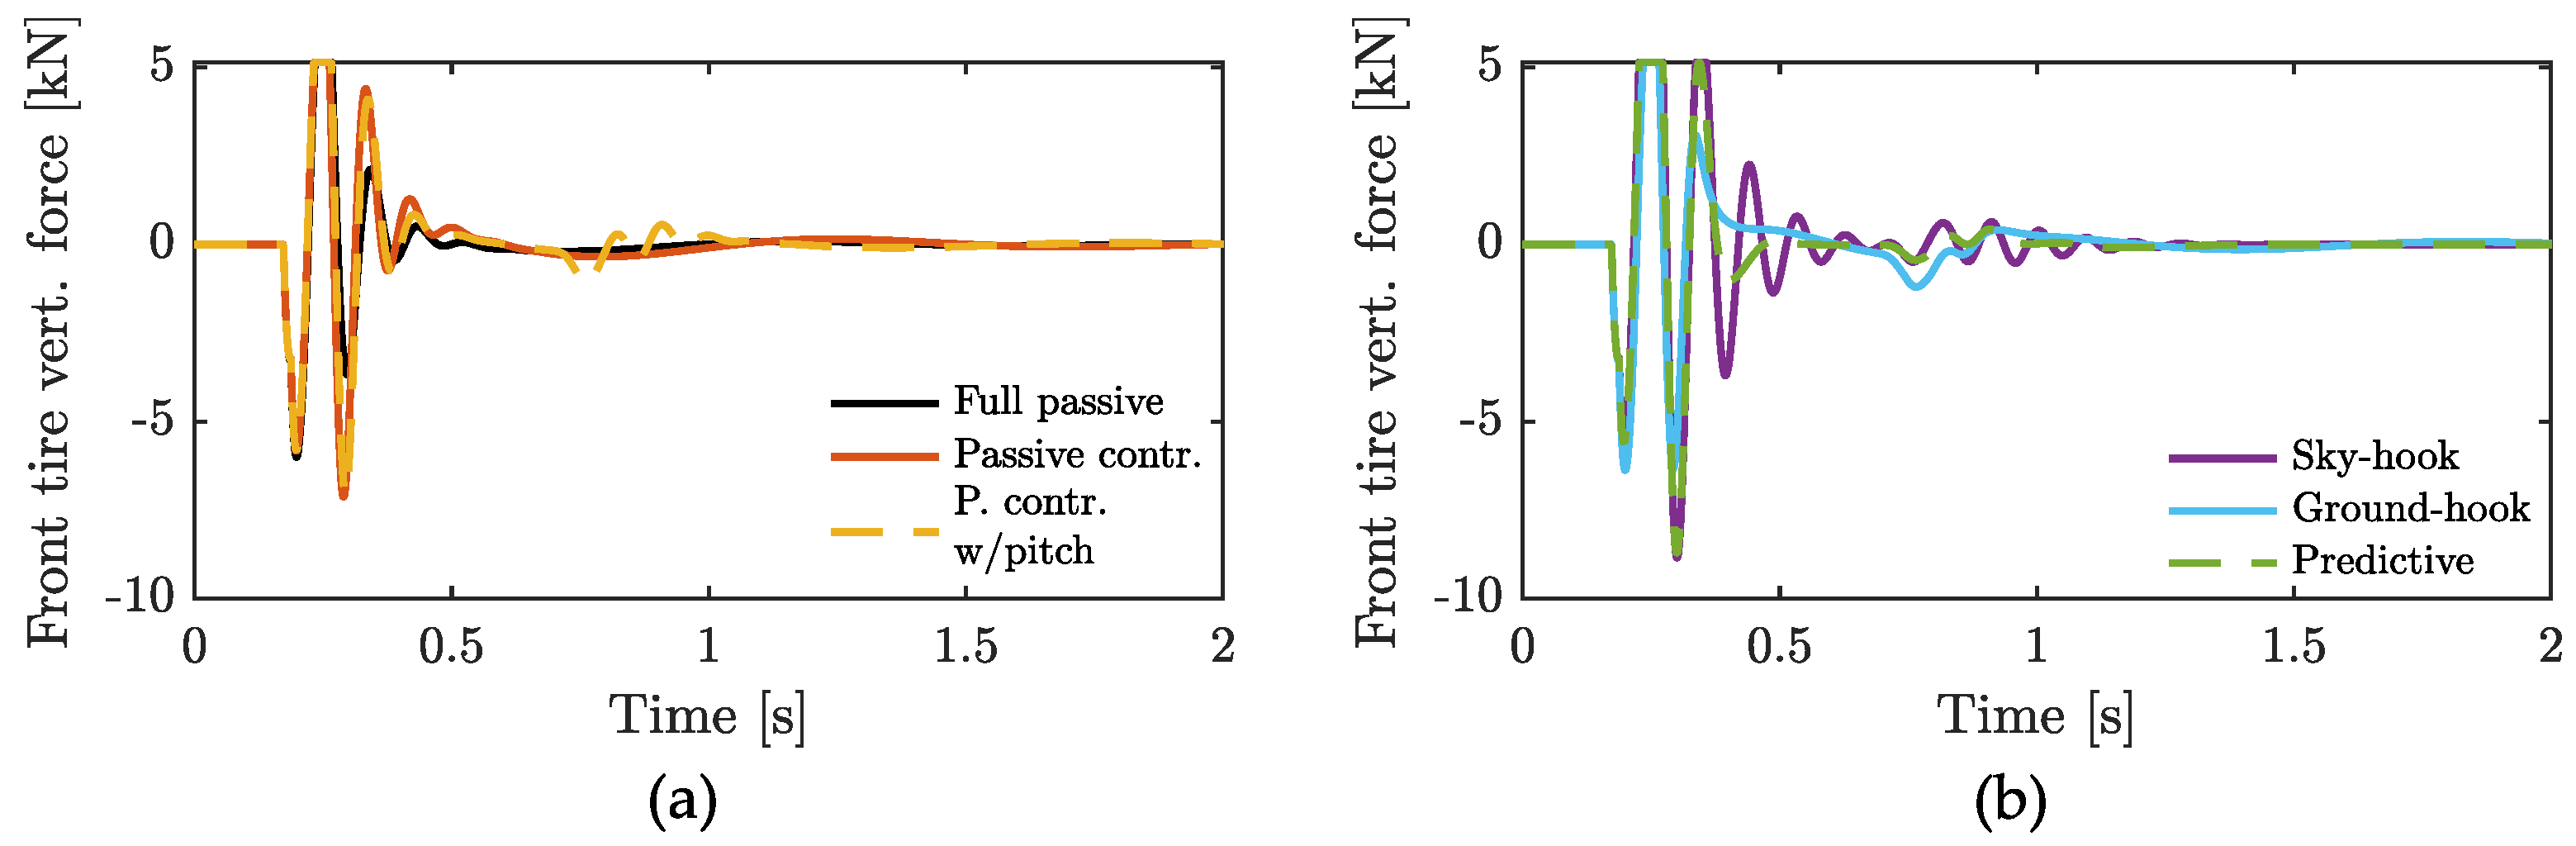
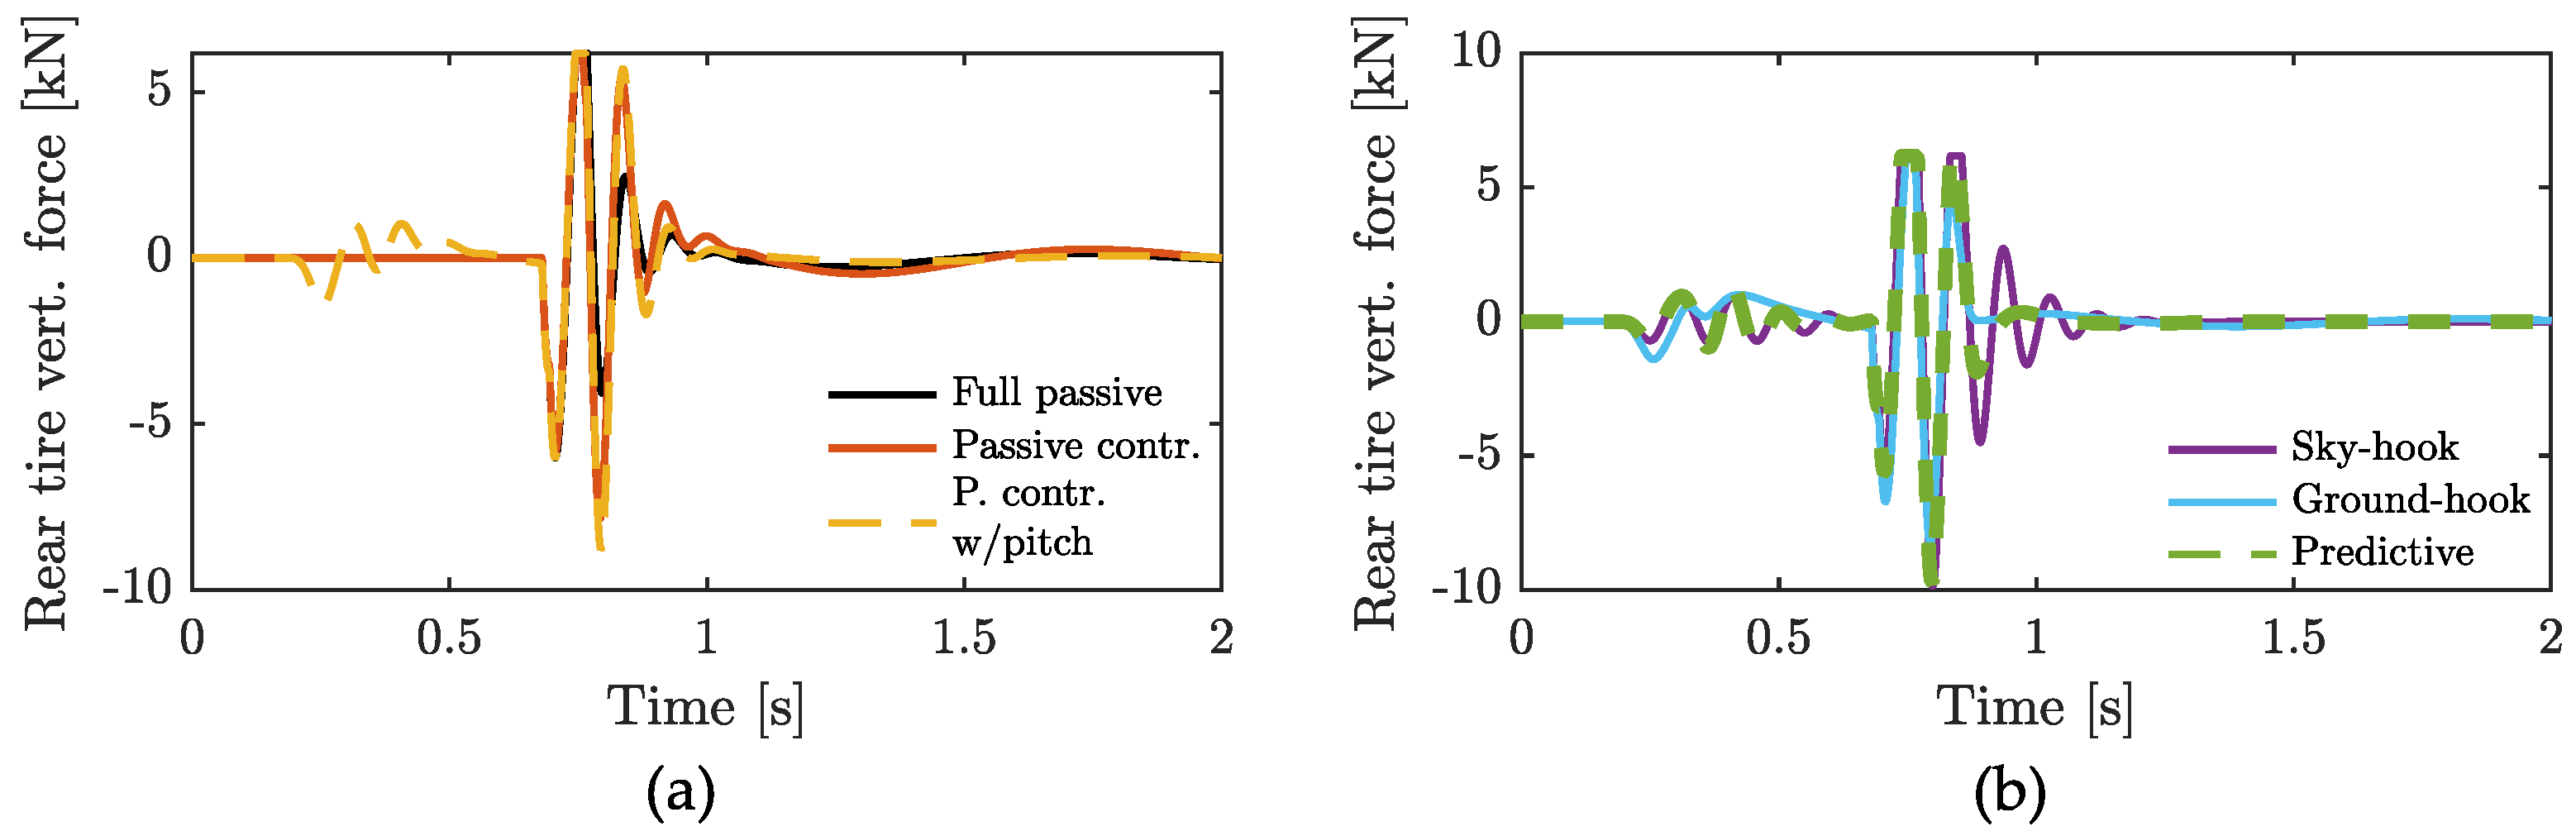
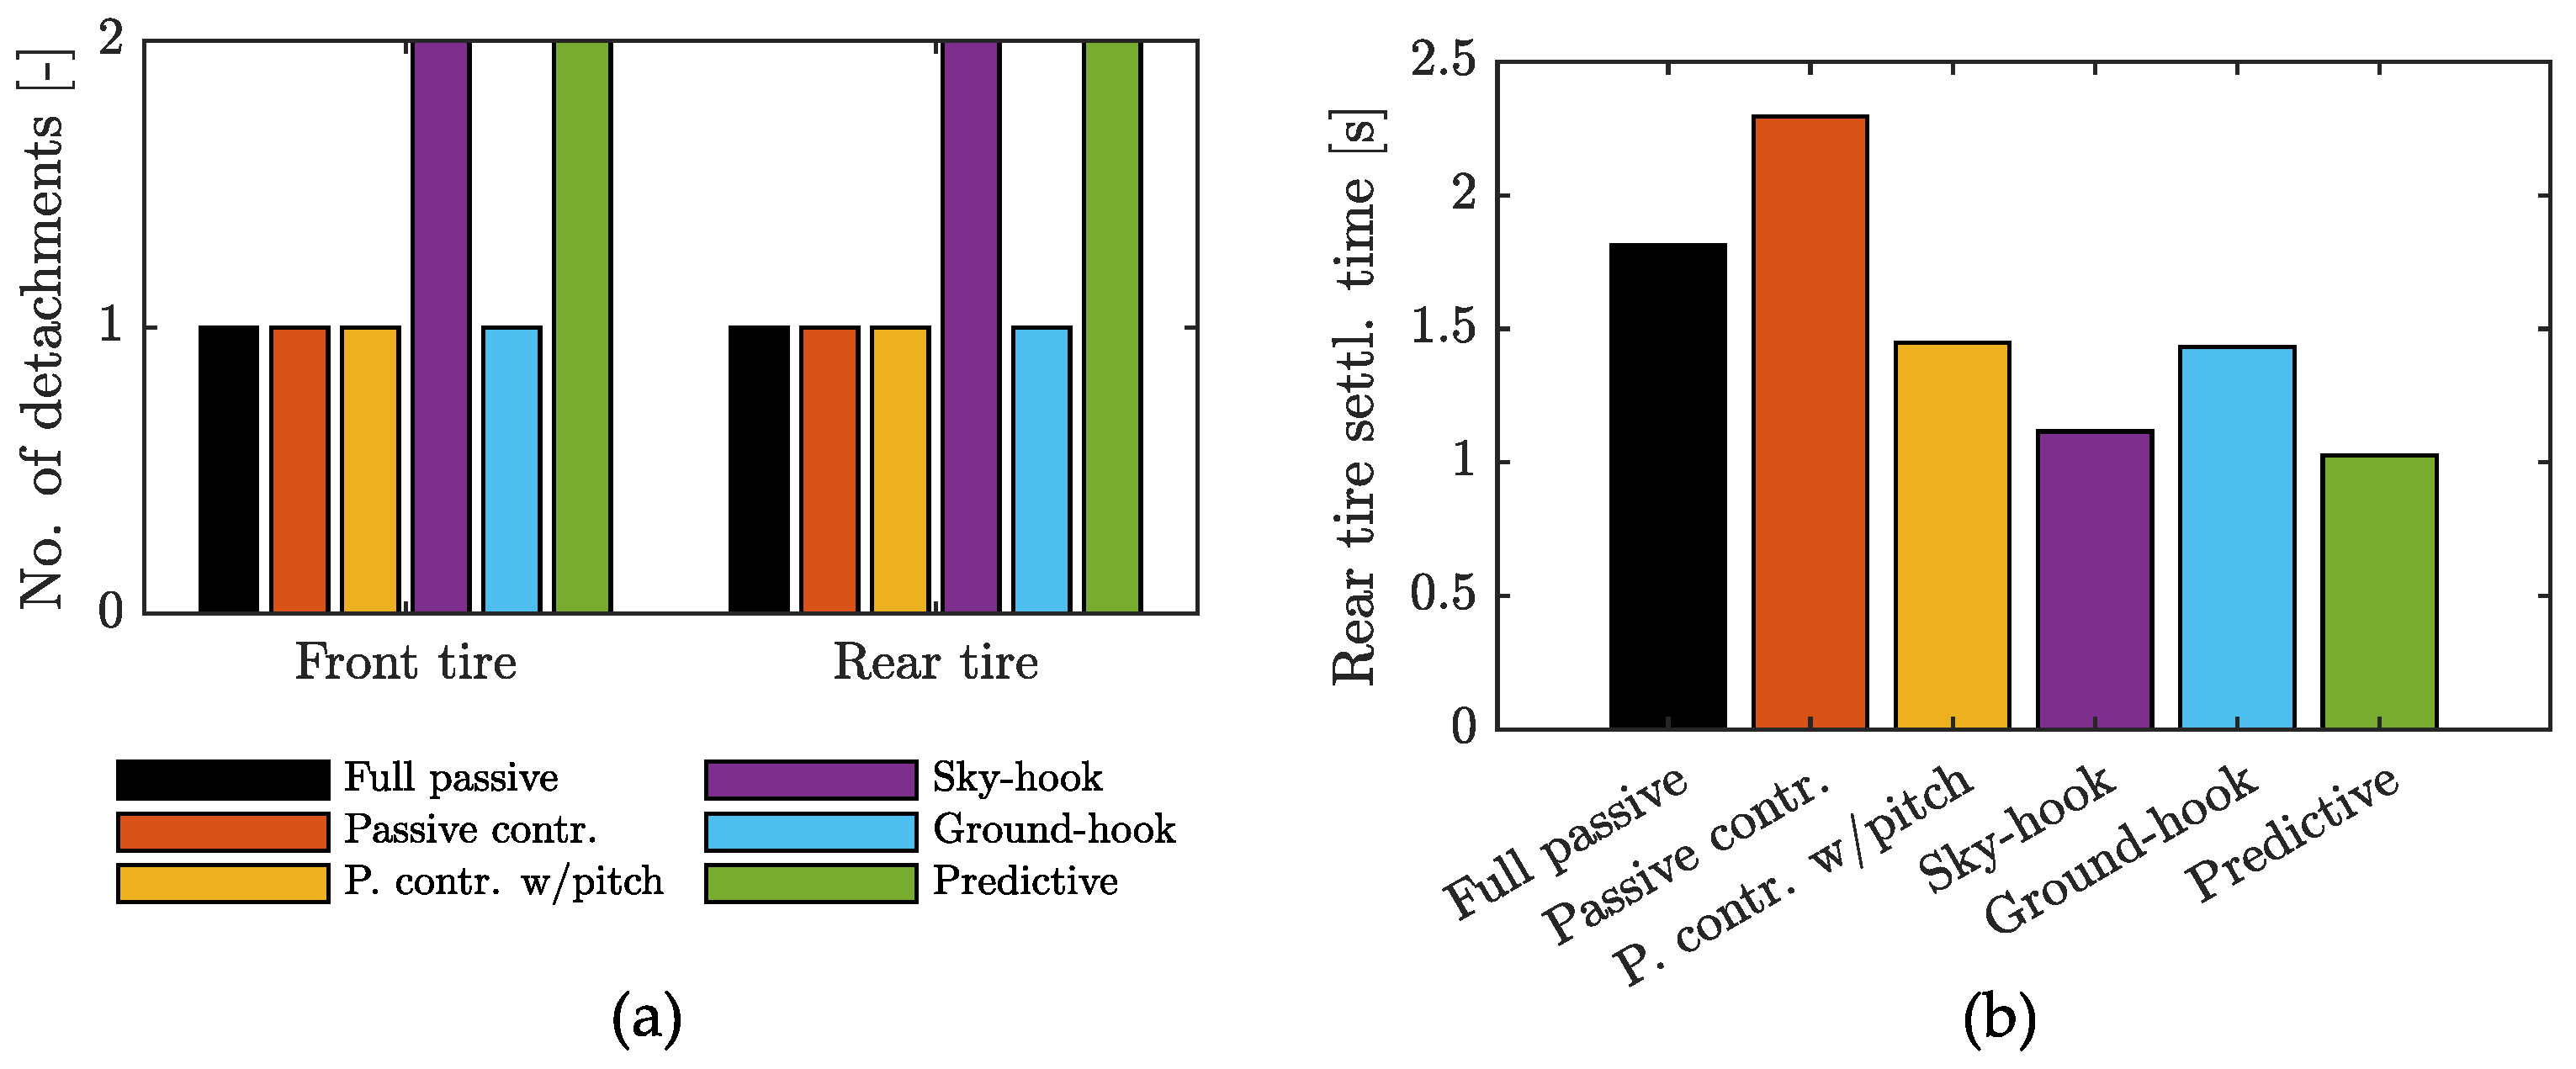
4.2. Ride Handling
4.3. Discussion
5. Conclusions
Author Contributions
Funding
Data Availability Statement
Acknowledgments
Conflicts of Interest
List of Symbols
| Front unsprung mass | |
| Front suspension spring stiffness | |
| Front tire stiffness | |
| Front axle suspension actuator force | |
| Front axle semi-wheelbase | |
| Front road roughness | |
| Front damping coefficient | |
| Front vertical damping control module actuation force | |
| Front axle pitch control module actuation force | |
| Front axle vertical tire force | |
| Front axle sprung mass velocity | |
| Ground-hook damping coefficient | |
| Kalman gain | |
| x | Longitudinal displacement of sprung mass |
| Model uncertainty vector | |
| Measurement uncertainty vector | |
| Model noise covariance matrix | |
| Measurement noise covariance matrix | |
| Observation vector | |
| Observation matrix | |
| Power saturation | |
| Pitch moment of inertia | |
| Rear unsprung mass | |
| Rear suspension spring stiffness | |
| Rear tire stiffness | |
| Rear axle suspension actuator force | |
| Rear axle semi-wheelbase | |
| Rear road roughness | |
| Rear damping coefficient | |
| Rotational damping coefficient | |
| Rear vertical damping control module actuation force | |
| Rear axle pitch control module actuation force | |
| Rear axle vertical tire force | |
| Rear axle sprung mass velocity | |
| Sprung mass | |
| Sky-hook damping coefficient | |
| State vector | |
| State matrix | |
| State prediction vector at time | |
| State estimation vector at time | |
| State estimate covariance error | |
| Time when the peak bump occurs | |
| Time when the bump ends | |
| ℓ | Total Wheelbase |
| z | Vertical displacement of sprung mass |
| Vertical velocity of sprung mass | |
| Vertical acceleration of sprung mass | |
| Vertical displacement of rear axle unsprung mass | |
| Vertical velocity of rear axle unsprung mass | |
| Vertical acceleration of rear axle unsprung mass | |
| Vertical displacement of front axle unsprung mass | |
| Vertical velocity of front axle unsprung mass | |
| Vertical acceleration of front axle unsprung mass | |
| Vehicle pitch angle | |
| Vehicle pitch rate | |
| Vertical weighted acceleration of sprung mass | |
| Vertical weighted acceleration of front axle sprung mass | |
| Vertical weighted acceleration of rear axle sprung mass | |
| Weighted vertical acceleration of sprung mass |
Acronyms
| CoG | Center of gravity |
| KPI | Key performance indicator |
| LQR | Linear Quadratic Regulator |
| MPC | Model predictive control |
| PID | Proportional integral derivative |
| RMS | Root mean square |
| SUV | Sport utility vehicle |
References
- Genta, G.; Morello, L. The Automotive Chassis: Volume 1: Components Design; Mechanical Engineering Series; Springer International Publishing: Cham, Switzerland, 2020. [Google Scholar] [CrossRef]
- Savaresi, S.M. (Ed.) Semi-Active Suspension Control Design for Vehicles; Elsevier: Amsterdam, The Netherlands, 2010. [Google Scholar]
- Karnopp, D.; Crosby, M.J.; Harwood, R.A. Vibration Control Using Semi-Active Force Generators. J. Eng. Ind. 1974, 96, 619–626. [Google Scholar] [CrossRef]
- Valášek, M.; Novák, M.; Šika, Z.; Vaculín, O. Extended Ground-Hook - New Concept of Semi-Active Control of Truck’s Suspension. Veh. Syst. Dyn. 1997, 27, 289–303. [Google Scholar] [CrossRef]
- Lu, Y.; Zhen, R.; Liu, Y.; Zhong, J.; Sun, C.; Huang, Y.; Khajepour, A. Practical solution for attenuating industrial heavy vehicle vibration: A new gain-adaptive coordinated suspension control system. Control Eng. Pract. 2025, 154, 106125. [Google Scholar] [CrossRef]
- Theunissen, J.; Tota, A.; Gruber, P.; Dhaens, M.; Sorniotti, A. Preview-based techniques for vehicle suspension control: A state-of-the-art review. Annu. Rev. Control 2021, 51, 206–235. [Google Scholar] [CrossRef]
- Wang, J.; Yang, C.; Liu, S.; Zhang, L.; Fang, J. Vehicle posture wheelbase preview control of in-wheel motors drive intelligent vehicle on potholed road. In Proceedings of the Institution of Mechanical Engineers, Part D: Journal of Automobile Engineering; Sage: Los Angeles, CA, USA, 2024; p. 09544070241287247. [Google Scholar] [CrossRef]
- Gohrle, C.; Schindler, A.; Wagner, A.; Sawodny, O. Road Profile Estimation and Preview Control For Low-Bandwidth Active Suspension Systems. IEEE/ASME Trans. Mechatron. 2015, 20, 2299–2310. [Google Scholar] [CrossRef]
- Doumiati, M.; Victorino, A.; Charara, A.; Lechner, D. Estimation of road profile for vehicle dynamics motion: Experimental validation. In Proceedings of the 2011 American Control Conference, San Francisco, CA, USA, 29 June–1 July 2011; pp. 5237–5242. [Google Scholar] [CrossRef]
- Doumiati, M.; Erhart, S.; Martinez, J.; Sename, O.; Dugard, L. Adaptive control scheme for road profile estimation: Application to vehicle dynamics. IFAC Proc. Vol. 2014, 47, 8445–8450. [Google Scholar] [CrossRef]
- Yang, T.; Li, P.; Li, Q.; Li, Z. Active suspension control strategy for vehicles based on road surface recognition. Nonlinear Dyn. 2024, 112, 11043–11065. [Google Scholar] [CrossRef]
- Kurz, C.; Stangenberg, L.; Gauterin, F. A Generic Approach to Modeling Vehicle Pitch Dynamics on a Vehicle Test Bench. IEEE Open J. Veh. Technol. 2023, 4, 739–748. [Google Scholar] [CrossRef]
- Jazar, R.N. Vehicle Dynamics: Theory and Applications, 3rd ed.; Springer: New York, NY, USA, 2009. [Google Scholar]
- Galluzzi, R.; Circosta, S.; Amati, N.; Tonoli, A. Rotary regenerative shock absorbers for automotive suspensions. Mechatronics 2021, 77, 102580. [Google Scholar]
- ISO. Mechanical Vibration and Shock—Evaluation of Human Exposure to Whole-Body Vibration—Part 1: General Requirements; ISO: Geneva, Switzerland, 1997. [Google Scholar]
- Zuo, L.; Zhang, P.S. Energy Harvesting, Ride Comfort, and Road Handling of Regenerative Vehicle Suspensions. J. Vib. Acoust. 2013, 135, 011002. [Google Scholar] [CrossRef]


| Description | Symbol | Value | Unit |
|---|---|---|---|
| Sprung mass | 2087 | ||
| Unsprung mass | 110 | ||
| Front semi-wheelbase | 1.549 | ||
| Rear semi-wheelbase | 1.269 | ||
| Total wheelbase | ℓ | 2.818 | |
| Front spring stiffness | 51 | ||
| Rear spring stiffness | 66.8 | ||
| Front damping coefficient | 360 | ||
| Rear damping coefficient | 606 | ||
| Tire stiffness | 510 | ||
| Pitch inertia | 4101.9 |
| Control Strategy | [kNs/m] | [kNs/m] | [kNs/m] | [kNs/rad] |
|---|---|---|---|---|
| Full passive/passive control | 4 | 0 | 0 | 0 |
| Passive control with pitch | 4 | 0 | 0 | 86.3 |
| Sky-hook | 2 | 20 | 0 | 86.3 |
| Ground-hook | 4 | 0 | 6 | 86.3 |
| Control Strategy | RMS Value | Peak Value | Settling Time | ||||
|---|---|---|---|---|---|---|---|
| [m/s2] | [m/s2] | [m/s2] | [deg] | [m/s2] | [m/s2] | [s] | |
| Full passive | 0.75 | 1.15 | 0.99 | 0.16 | 8.99 | 8.13 | 1.22 |
| Passive control | 0.66 | 1.01 | 0.88 | 0.29 | 6.36 | 5.97 | 1.71 |
| Passive control with pitch | 0.65 | 0.99 | 0.86 | 0.09 | 5.71 | 5.30 | 1.33 |
| Sky-hook | 0.51 | 0.74 | 0.67 | 0.05 | 4.18 | 4.40 | 1.12 |
| Ground-hook | 0.76 | 1.15 | 0.99 | 0.12 | 6.63 | 5.91 | 1.43 |
| Predictive | 0.59 | 0.89 | 0.78 | 0.05 | 5.54 | 4.99 | 1.18 |
| Control Strategy | RMS Value | No. of Detachments | Settling Time | ||
|---|---|---|---|---|---|
| [kN] | [kN] | [–] | [–] | [s] | |
| Full passive | 0.88 | 0.92 | 1 | 1 | 1.81 |
| Passive control | 1.05 | 1.14 | 1 | 1 | 2.30 |
| Passive control with pitch | 1.06 | 1.23 | 1 | 1 | 1.45 |
| Sky-hook | 1.30 | 1.44 | 2 | 2 | 1.12 |
| Ground-hook | 1.04 | 1.19 | 1 | 1 | 1.43 |
| Predictive | 1.20 | 1.34 | 2 | 2 | 1.03 |
Disclaimer/Publisher’s Note: The statements, opinions and data contained in all publications are solely those of the individual author(s) and contributor(s) and not of MDPI and/or the editor(s). MDPI and/or the editor(s) disclaim responsibility for any injury to people or property resulting from any ideas, methods, instructions or products referred to in the content. |
© 2025 by the authors. Published by MDPI on behalf of the World Electric Vehicle Association. Licensee MDPI, Basel, Switzerland. This article is an open access article distributed under the terms and conditions of the Creative Commons Attribution (CC BY) license (https://creativecommons.org/licenses/by/4.0/).
Share and Cite
Valdivieso-Soto, A.; Sorrentino, G.; Moscone, G.; Galluzzi, R.; Amati, N. Affordable Road Obstacle Detection and Active Suspension Control Using Inertial and Motion Sensors. World Electr. Veh. J. 2025, 16, 197. https://doi.org/10.3390/wevj16040197
Valdivieso-Soto A, Sorrentino G, Moscone G, Galluzzi R, Amati N. Affordable Road Obstacle Detection and Active Suspension Control Using Inertial and Motion Sensors. World Electric Vehicle Journal. 2025; 16(4):197. https://doi.org/10.3390/wevj16040197
Chicago/Turabian StyleValdivieso-Soto, Andrew, Gennaro Sorrentino, Giulia Moscone, Renato Galluzzi, and Nicola Amati. 2025. "Affordable Road Obstacle Detection and Active Suspension Control Using Inertial and Motion Sensors" World Electric Vehicle Journal 16, no. 4: 197. https://doi.org/10.3390/wevj16040197
APA StyleValdivieso-Soto, A., Sorrentino, G., Moscone, G., Galluzzi, R., & Amati, N. (2025). Affordable Road Obstacle Detection and Active Suspension Control Using Inertial and Motion Sensors. World Electric Vehicle Journal, 16(4), 197. https://doi.org/10.3390/wevj16040197