Article

Patent Analysis of the Electric Vehicle Battery Management Systems Based on the AHP and Entropy Weight Method

by
Dan Wan
1,*,
Ling Peng
2 and
Hao Zhan
3
1
Chinese Ethical Civilization Research Center, Changsha New Generation Lab for Artificial Intelligence Ethical Governance and Public Policy, Department of Philosophy, Hunan Normal University, Changsha 410006, China
2
Department of Philosophy, Hunan Normal University, Changsha 410081, China
3
Department of Philosophy, Xiamen University, Xiamen 361005, China
*
Author to whom correspondence should be addressed.
World Electr. Veh. J. 2025, 16(4), 218; https://doi.org/10.3390/wevj16040218
Submission received: 3 March 2025 / Revised: 31 March 2025 / Accepted: 3 April 2025 / Published: 5 April 2025

Abstract

:
With the rapid development of the electric vehicle (EV) industry, the importance of battery management systems (BMS) in ensuring the safety, reliability, and efficiency of batteries has significantly increased. This study explores the technological development trends and market layout of EV BMS through patent analysis, focusing on patent quantity, geographic distribution, and technical classification. By integrating the analytic hierarchy process (AHP) and entropy weight method, a patent value evaluation model was constructed to identify key patents and assess their quality across four dimensions: technical, market, economic, and legal. The results reveal that BMS patents are primarily concentrated in China, the United States, and South Korea, with major contributors including LG Energy Solution, BYD, and Hyundai. While BMS patent applications grew rapidly from 2015 to 2020, the pace has slowed since 2021, indicating a possible shift in market focus. The analysis identified 14 high-quality patents, mainly focused on battery safety and compactness, while fewer patents addressed battery lifespan extension and anti-interference capabilities. The study suggests that although significant progress has been made in BMS technology, there is still substantial room for innovation, particularly in areas such as battery lifespan management, charging efficiency, and intelligent energy scheduling. This research provides valuable insights for future technological innovation and market decision-making in the EV BMS sector.

1. Introduction

The automotive industry has long been dedicated to reducing emissions from internal combustion engine (ICE) vehicles, but their long-term environmental burden remains significant [1,2]. Traditional emission control measures, however, are insufficient to effectively mitigate this issue [3,4]. In this context, electric vehicles (EVs) have emerged as another disruptive innovative technology, rapidly expanding in the market and showing great potential for development [5]. As an extension of the automotive industry, EVs are closely integrated with the battery industry and deeply dependent on battery systems [6]. As Mehmet Kurucan et al. stated, the key technology for EVs is battery technology, and the battery system of EVs plays a crucial role in optimizing performance and ensuring safety [7]. The battery system, as the core of EV development, becomes more complex as the number of batteries increases. An excessive number of batteries during charging or discharging cycles can negatively affect battery health [8]. In severe cases, this can lead to a sudden drop in the EV’s charge [9]. Electric vehicles rely on compact, efficient, lightweight, safe, reliable, and durable battery systems, and the performance and management of these batteries are crucial for the transformation of the entire industry [10]. Considering the need for safe and reliable battery operation, Gabbar, Othman and Abdussami apointed out that the battery management system (BMS) is essential for ensuring effective operational control, protection, and energy management in electric vehicles [11].
As a critical component of electric vehicles (EVs), the primary goal of a battery management system (BMS) is to ensure the safe, reliable operation of the vehicle’s battery and to provide the required power [12]. The BMS continuously adjusts various battery parameters to accurately estimate battery state, mitigating risks such as overcharging or deep discharge, thus preventing damage to the battery and the system [13]. Liu et al. emphasized that developing an effective and intelligent BMS is crucial, as it can estimate battery internal state, such as state of charge (SoC), state of temperature (SoT), and state of health (SoH), and predict the aging trajectory and lifespan of the battery [14]. A robust BMS not only extends the battery’s life, but also improves its efficiency per unit distance, thus reducing the replacement frequency and associated costs [15,16]. In addition, data related to electric vehicle battery models are collected in real time by the BMS, which supports the training and adjustment of various model parameters [17]. Currently, for companies aiming to expand their EV market share, safety and reliability are of paramount concern to users, which are closely tied not only to battery production but also to the BMS [18].
BMS is a key technology in the technical architecture of EVs and a key driver in the achievement of the environmental goals of electric vehicle companies [19]. From an industry integration perspective, EVs combine traditional automotive and battery technologies, and BMS plays a key role in connecting and optimizing these two sectors [20]. By precisely managing battery performance, EV companies ensure the efficiency and safety of batteries during charging and discharging, thereby achieving the environmental goals of electric vehicles [21]. Therefore, R&D and innovation in BMS—particularly in areas such as improving energy efficiency, extending battery lifespan, and reducing environmental impact—have become critical factors in the green transformation of the EV industry.
It should be noted that a significant body of literature has explored EV BMS. For instance, from the perspective of BMS functionality distribution and system configuration, Liu and Etengoff analyzed three architectures applied to EVs [22,23]. Schärtel et al. discussed BMS optimization algorithms and fault issues, proposing frameworks to optimize these functions, along with corresponding implementation methods [24]. Ansari et al. highlighted issues arising from inefficient algorithms in EV BMS, examining battery performance and lifespan from a materials perspective [25]. Furthermore, Hannan et al. proposed enhancing the functions and performance of BMS in EVs using artificial intelligence (AI) methods [26]. Recent studies, such as those by Ghazali, Nor, and Hassan, have explored the latest algorithm trends in BMS [27]. Additionally, some scholars have conducted qualitative analyses of key technologies in the field of pure electric vehicle power batteries from patent texts, including tracking the evolution of electric vehicle charging technology through patent citations [28]. These studies emphasize the importance of the BMS in electric vehicles and stress the urgent need for BMS optimization for the advancement of EVs [29]. The above studies explore the importance of BMS in EVs from different perspectives and emphasize the urgent need for BMS optimization in the development of EVs. However, the existing literature focuses primarily on the overall development of the BMS technology itself, with less attention given to systematically evaluating the evolving trends of BMS when integrated into EVs. Moreover, current studies have not fully utilized quantitative indicators such as patent numbers, growth trends, and patent classification to comprehensively assess the development trajectory of EV BMS. Most of the current research on the R&D quality of EV BMS relies on qualitative analysis methods and lacks a quantitative evaluation framework, which makes the research conclusions susceptible to cognitive biases and difficult to quantify the dynamic relationship between technological maturity and market demand.
Therefore, this paper aims to fill this gap by conducting a patent analysis (including patent numbers, regional distribution, and technological distribution) to identify the technological trends and market layout of EV BMS. By analyzing core patents and extracting relevant indicators from technological, market, economic, and legal dimensions, we establish a patent indicator identification system for EV BMS. Using a combination of the analytical hierarchy process (AHP) and the entropy weight method (EWM), we integrate expert opinions and objective data to determine the weights of various patent indicators and construct a patent value assessment model for EV BMS. This study not only enriches existing literature by providing a quantitative framework for evaluating BMS technology in the EV sector but also offers critical insights for future research and practical applications. By evaluating the technological evolution of BMS in the EV market through patents, this work provides a comprehensive understanding of its role in shaping the future of EVs and offers deep insights into the BMS patent strategies of EV companies. Additionally, this paper explores the key role of BMS in aligning the EV industry with environmental protection goals, providing automotive companies, particularly EV companies, with an effective strategic perspective for developing patent strategies in line with sustainable development objectives.

2. Research Methods

Patent analysis is regarded as a tool for conducting techno-economic analysis of enterprise R&D management and productivity [30]. It utilizes statistical and quantitative data to maximize the extraction of information related to technological activities, while minimizing statistical noise and bias [31]. Patent data not only contain rich technological, legal, and economic information, but also effectively represents the level of technological development and industrial evolution [32]. Within patent data, the World Intellectual Property Organization (WIPO) classifies and identifies patents using international patent classification (IPC) codes, reflecting research themes across different technological fields [33]. This IPC classification system aids patent holders, researchers, and businesses worldwide in patent retrieval and technology trend analysis [29,34]. Furthermore, existing patent analysis methods can generally be categorized into four types: the single patent indicator method, multiple indicator combination recognition method, patent indicator system construction method, and complex network-based recognition method [35]. The single patent indicator method relies on a single quantitative indicator to quickly analyze patent information, such as analyzing specified indicators like patent citation frequency, patent family size, and the number of claims [36]. This method can rapidly screen targets and facilitate horizontal data comparison. However, the single patent indicator method is clearly one-sided [36]. On this basis, the multiple-indicator combination identification method improves the accuracy of the single-indicator method by selecting multiple individual patent indicators and constructing a combination of multiple indicators to evaluate the value of the patent [36]. The core logic of the patent indicator system construction method is to systematically classify, integrate and assign weights to multiple combination of indicators in different dimensions, ultimately forming a comprehensive hierarchical evaluation system [37]. The complex network identification method, on the other hand, treats patents, applicants, technical keywords, etc., as network nodes, analyzing their relational structure and dynamic evolution [38,39]. Studies suggest that complex networks are often modeled after various systems in the real world, characterized by disorder, self-similarity, and small-world properties [40]. This results in modeling challenges and reliance on subjective or single objective weighting methods within the recognition system, which can lead to some subjectivity and inaccuracies in the identified patents [40].
Therefore, considering the applicability of these four methods, this study first selects three single patent indicators, analyzing the development status of electric vehicle battery management systems (BMS) through the three dimensions of patent quantity, geographic distribution, and IPC classification. Subsequently, the multiple indicator combination identification method is applied to construct four sets of indicator combinations containing 11 indicators. Based on the value characteristics of patents, a patent indicator identification system is constructed that encompasses four dimensions, technology, market, economics, and law. The analytic hierarchy process (AHP) and entropy weight method are used to determine the weights of each indicator combination, and a patent value evaluation model is established. Finally, this study will use the model to conduct an empirical analysis of electric vehicle battery management systems, further exploring their technological development trends and innovation directions.

2.1. Results of the Indicator System Construction

Existing studies have shown that the core technological capabilities of high-tech industries are key factors in the development of enterprises [41]. As a core technology in the electric vehicle sector, the patents or patent portfolios of electric vehicle battery management systems (BMS) play a vital role in meeting production demands, adapting to market developments, driving technological progress, and promoting the growth of the industrial chain [42,43]. These patents possess significant technological, legal, and market value and have high economic value, as they improve commercial application efficiency and drive overall economic growth [44]. Therefore, this study comprehensively evaluates BMS from the perspectives of technology, economy, market, and law.
Regarding technological value, BMS patents contain a wealth of critical technological information, with the advancement and importance of patent technology within the industry being the core factors in assessing its technological value [45]. The market value dimension focuses on the patents’ commercialization potential and market application outcomes [46]. The economic value dimension primarily evaluates the financial contributions of the patent technology to the industry or market [47]. The dimension of legal value emphasizes the innovation, protection, and legal effectiveness of patents, examining whether they provide effective legal protection, prevent imitation, and ensure that the patent holder maintains a competitive edge, thus protecting the patent from being challenged by competitors [48]. Based on these four dimensions, this study selects core technology identification indicators from the perspectives of technology, economy, market, and law. The indicators were chosen based on expert opinions and by referencing previous studies, following the principles of accessibility and scientific validity. The relevant indicators were ultimately determined (see Table 1).

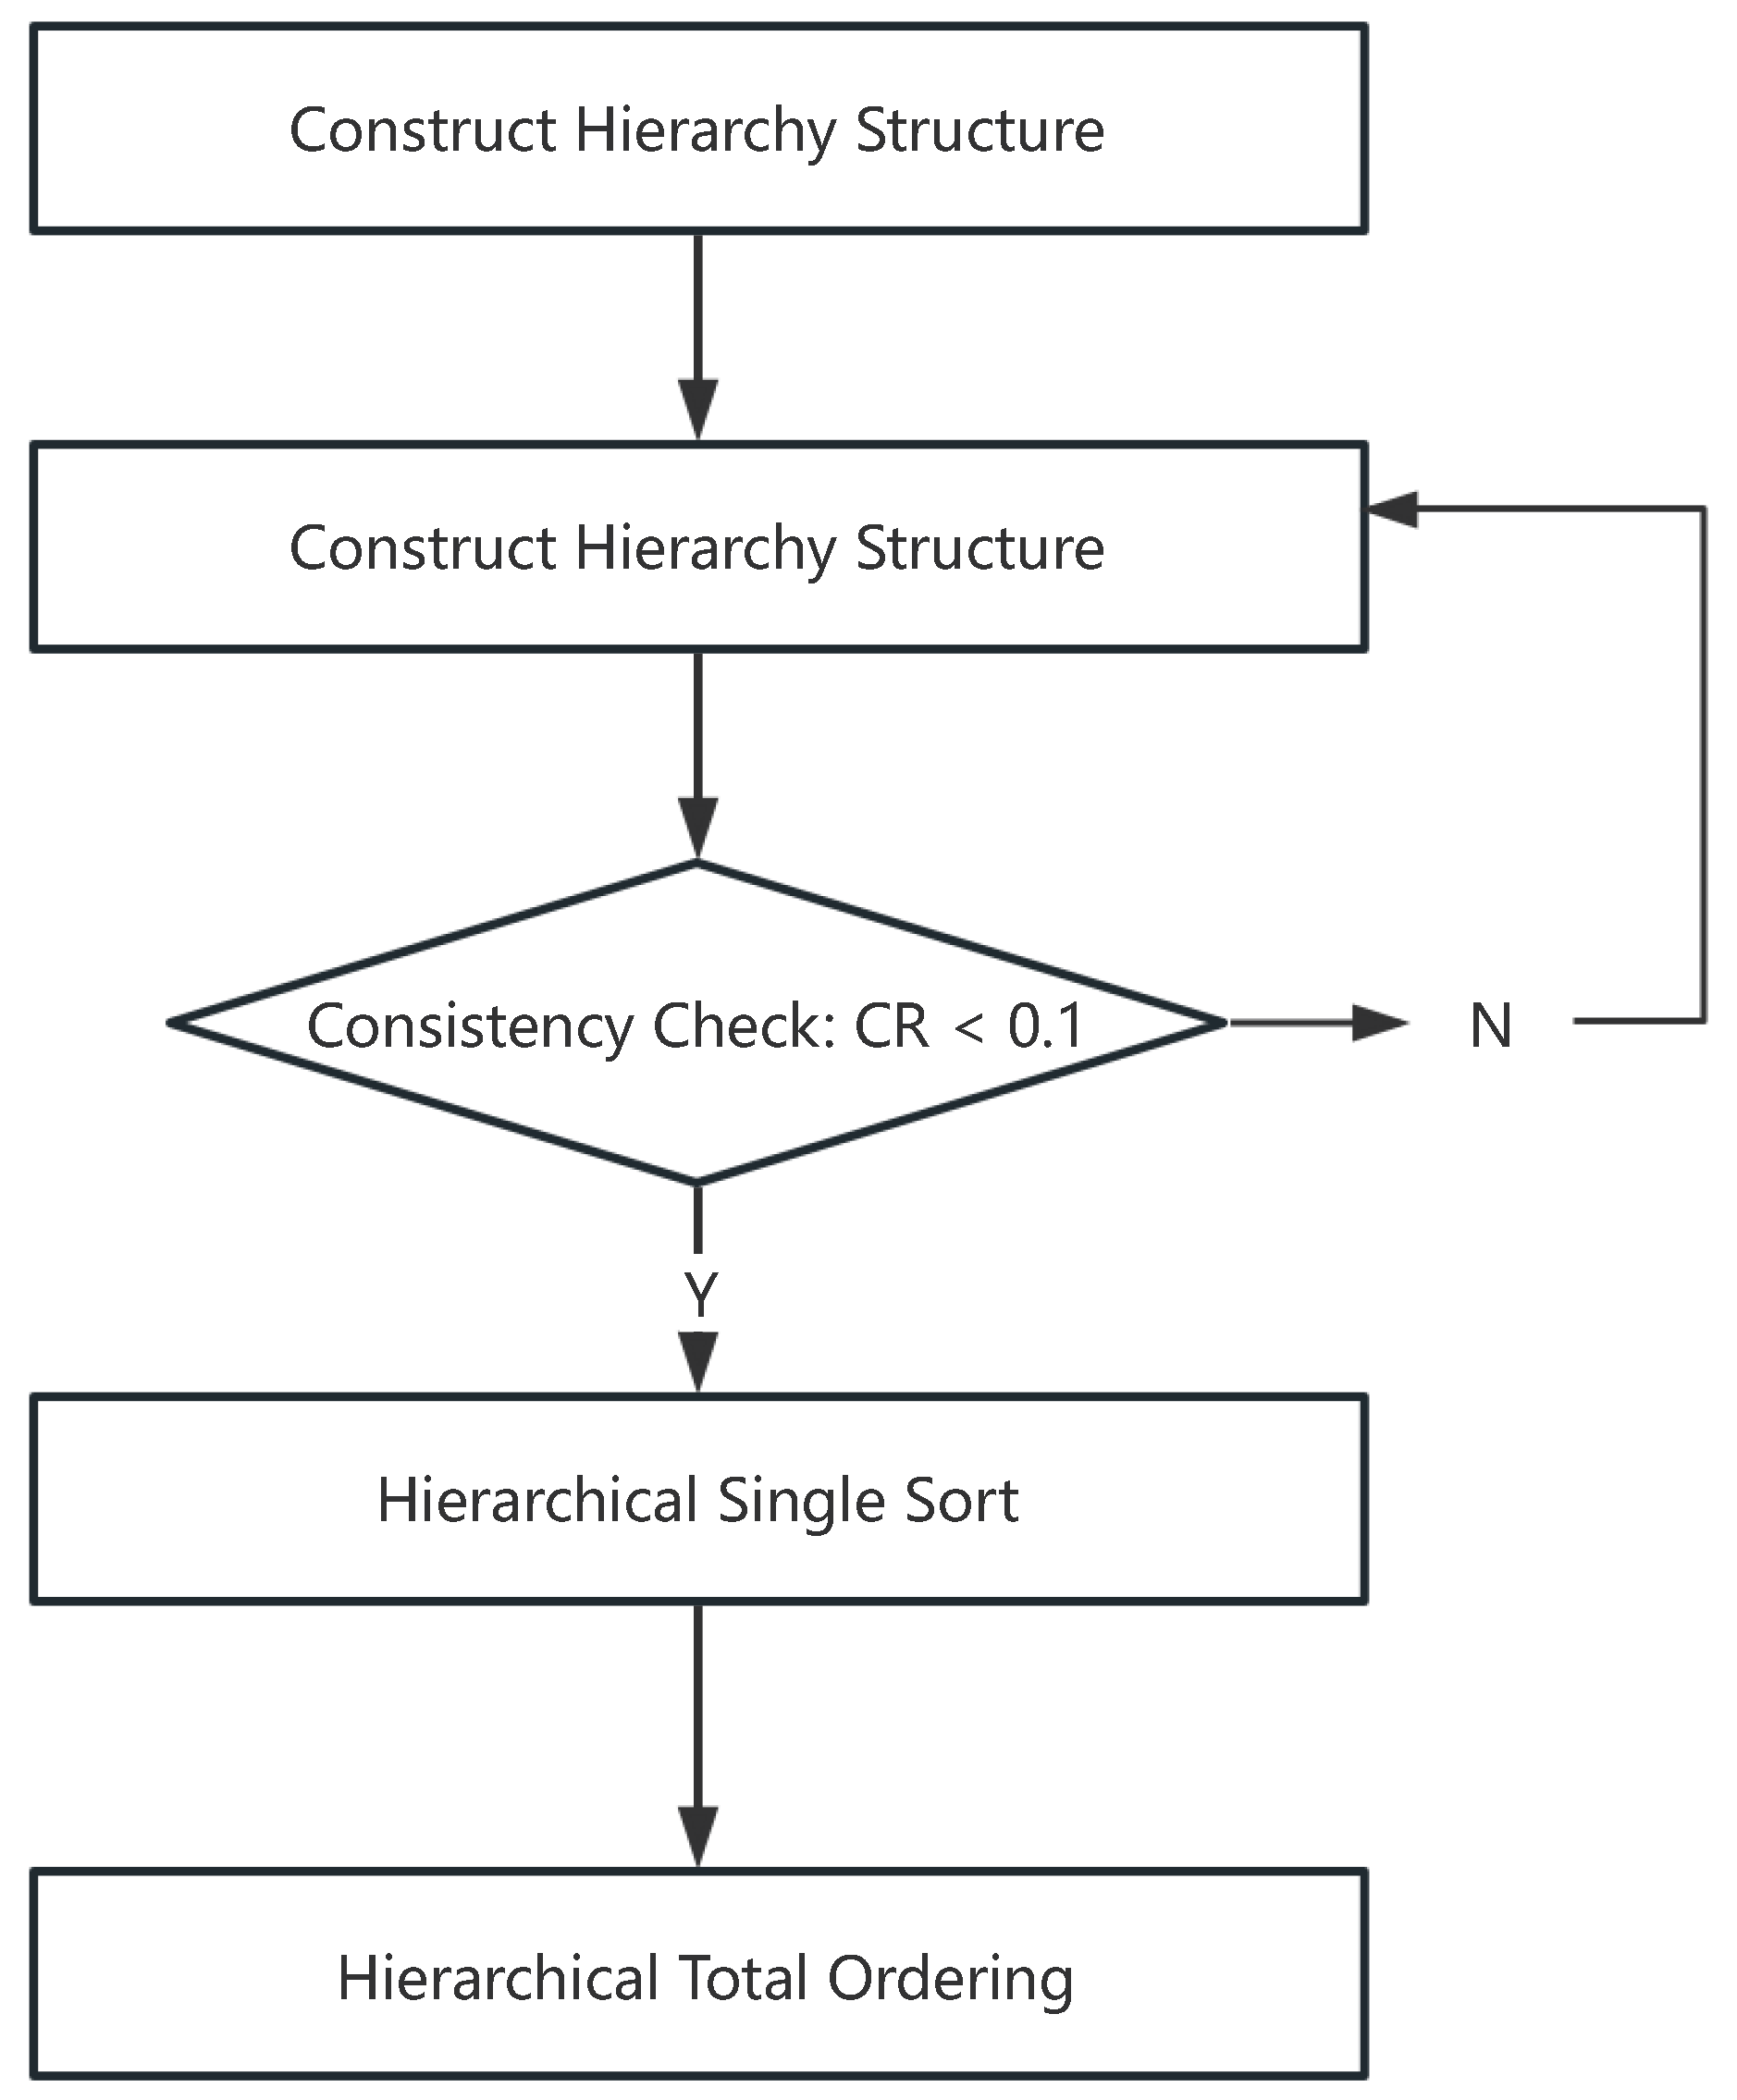
2.2. Analytic Hierarchy Process (AHP)

The analytic hierarchy process (AHP), proposed by Saaty (1977), is a multi-criteria decision-making method that combines both qualitative and quantitative analysis [49]. This method decomposes a system of target attributes into multiple levels, such as goals, criteria, and alternatives, gradually refining the factors that influence the evaluation results [50]. Its core advantage lies in structuring complex problems, providing a scientific basis for decision-making through quantitative analysis of subjective judgments [51]. Currently, AHP is being integrated with technologies such as machine learning and natural language processing, and is widely applied in technology solution selection and engineering decision-making [52]. For example, in construction engineering, it is used to analyze criteria layers such as technical feasibility and environmental impact, and to quantitatively assess the priority of different options [53], including determining the optimal technological path for the development of renewable energy [54]. The specific steps for calculating indicator weights using AHP are illustrated in Figure 1.
As shown in Figure 1, the first step is to determine the evaluation objective of the patent indicator system, clearly define the first-level and second-level indicators, and construct a hierarchical model based on the established patent indicator system (see Table 1), as illustrated in Figure 2.
The second step is to construct the judgment matrix. At the same level, the evaluation indicators are of relative importance. By comparing the relative importance of secondary indicators under the same primary indicator, the judgment matrix for each level is constructed, thus quantifying the evaluation results. This process helps reduce the difficulty of comparing factors of different natures and improves the accuracy of the evaluation. The judgment matrix uses a 1–9 scale method for evaluation, as detailed in Table 2.
The third step is to calculate the weight vector. Suppose there are on indicators, and the constructed judgment matrix A is as follows:
A = a i j n × n
In Equation (1), a i j represents the relative importance of indicator i compared to indicator j. The process for solving the characteristic weight vector corresponding to the judgment matrix W is detailed below.
First, normalize the columns by dividing each element in a column by the sum of that column.
Next, compute the average of each row in the normalized matrix to obtain the weight vector: W = w 1 , w 2 , , w n T
The formula is as follows:
w i = 1 n j = 1 n a i j k = 1 n a k j
The fourth step is to perform a consistency check. This is necessary because the judgment matrix constructed earlier may be inconsistent due to evaluator errors or lack of relevant knowledge. Therefore, a consistency check is conducted to ensure that the results are logical and scientifically valid.
First, calculate the maximum eigenvalue of the judgment matrix. λ max :
λ max = 1 n j = 1 n A W i w i
Here, A W represents the product of the judgment matrix A and the weight vector W.
Next, calculate the consistency index C I :
C I = λ m a x n n 1
Then, based on the order of the judgment matrix, refer to Table 3 to obtain the random consistency index R I .
Finally, calculate the consistency ratio CR of the judgment matrix:
C R = C I R I
After satisfying Equation (5), if the consistency ratio C R calculated is less than 0.1, it indicates that the judgment matrix passes the consistency test, and the results are acceptable. Otherwise, it is necessary to readjust the elements in the judgment matrix.
The fifth step is to synthesize the overall weights. Based on the hierarchical ranking results, the relative weight of the sub-criteria layer with respect to the goal layer is calculated using the following formula:
w i 2 = m j = 1 w j 1 w i j
Here, w i 2 represents the relative weight of the i indicator in the sub-criteria layer with respect to the goal layer, w j 1 represents the weight of the j indicator in the criteria layer with respect to the goal layer, and w i j represents the relative weight of the i indicator in the sub-criteria layer with respect to the j indicator in the criteria layer.

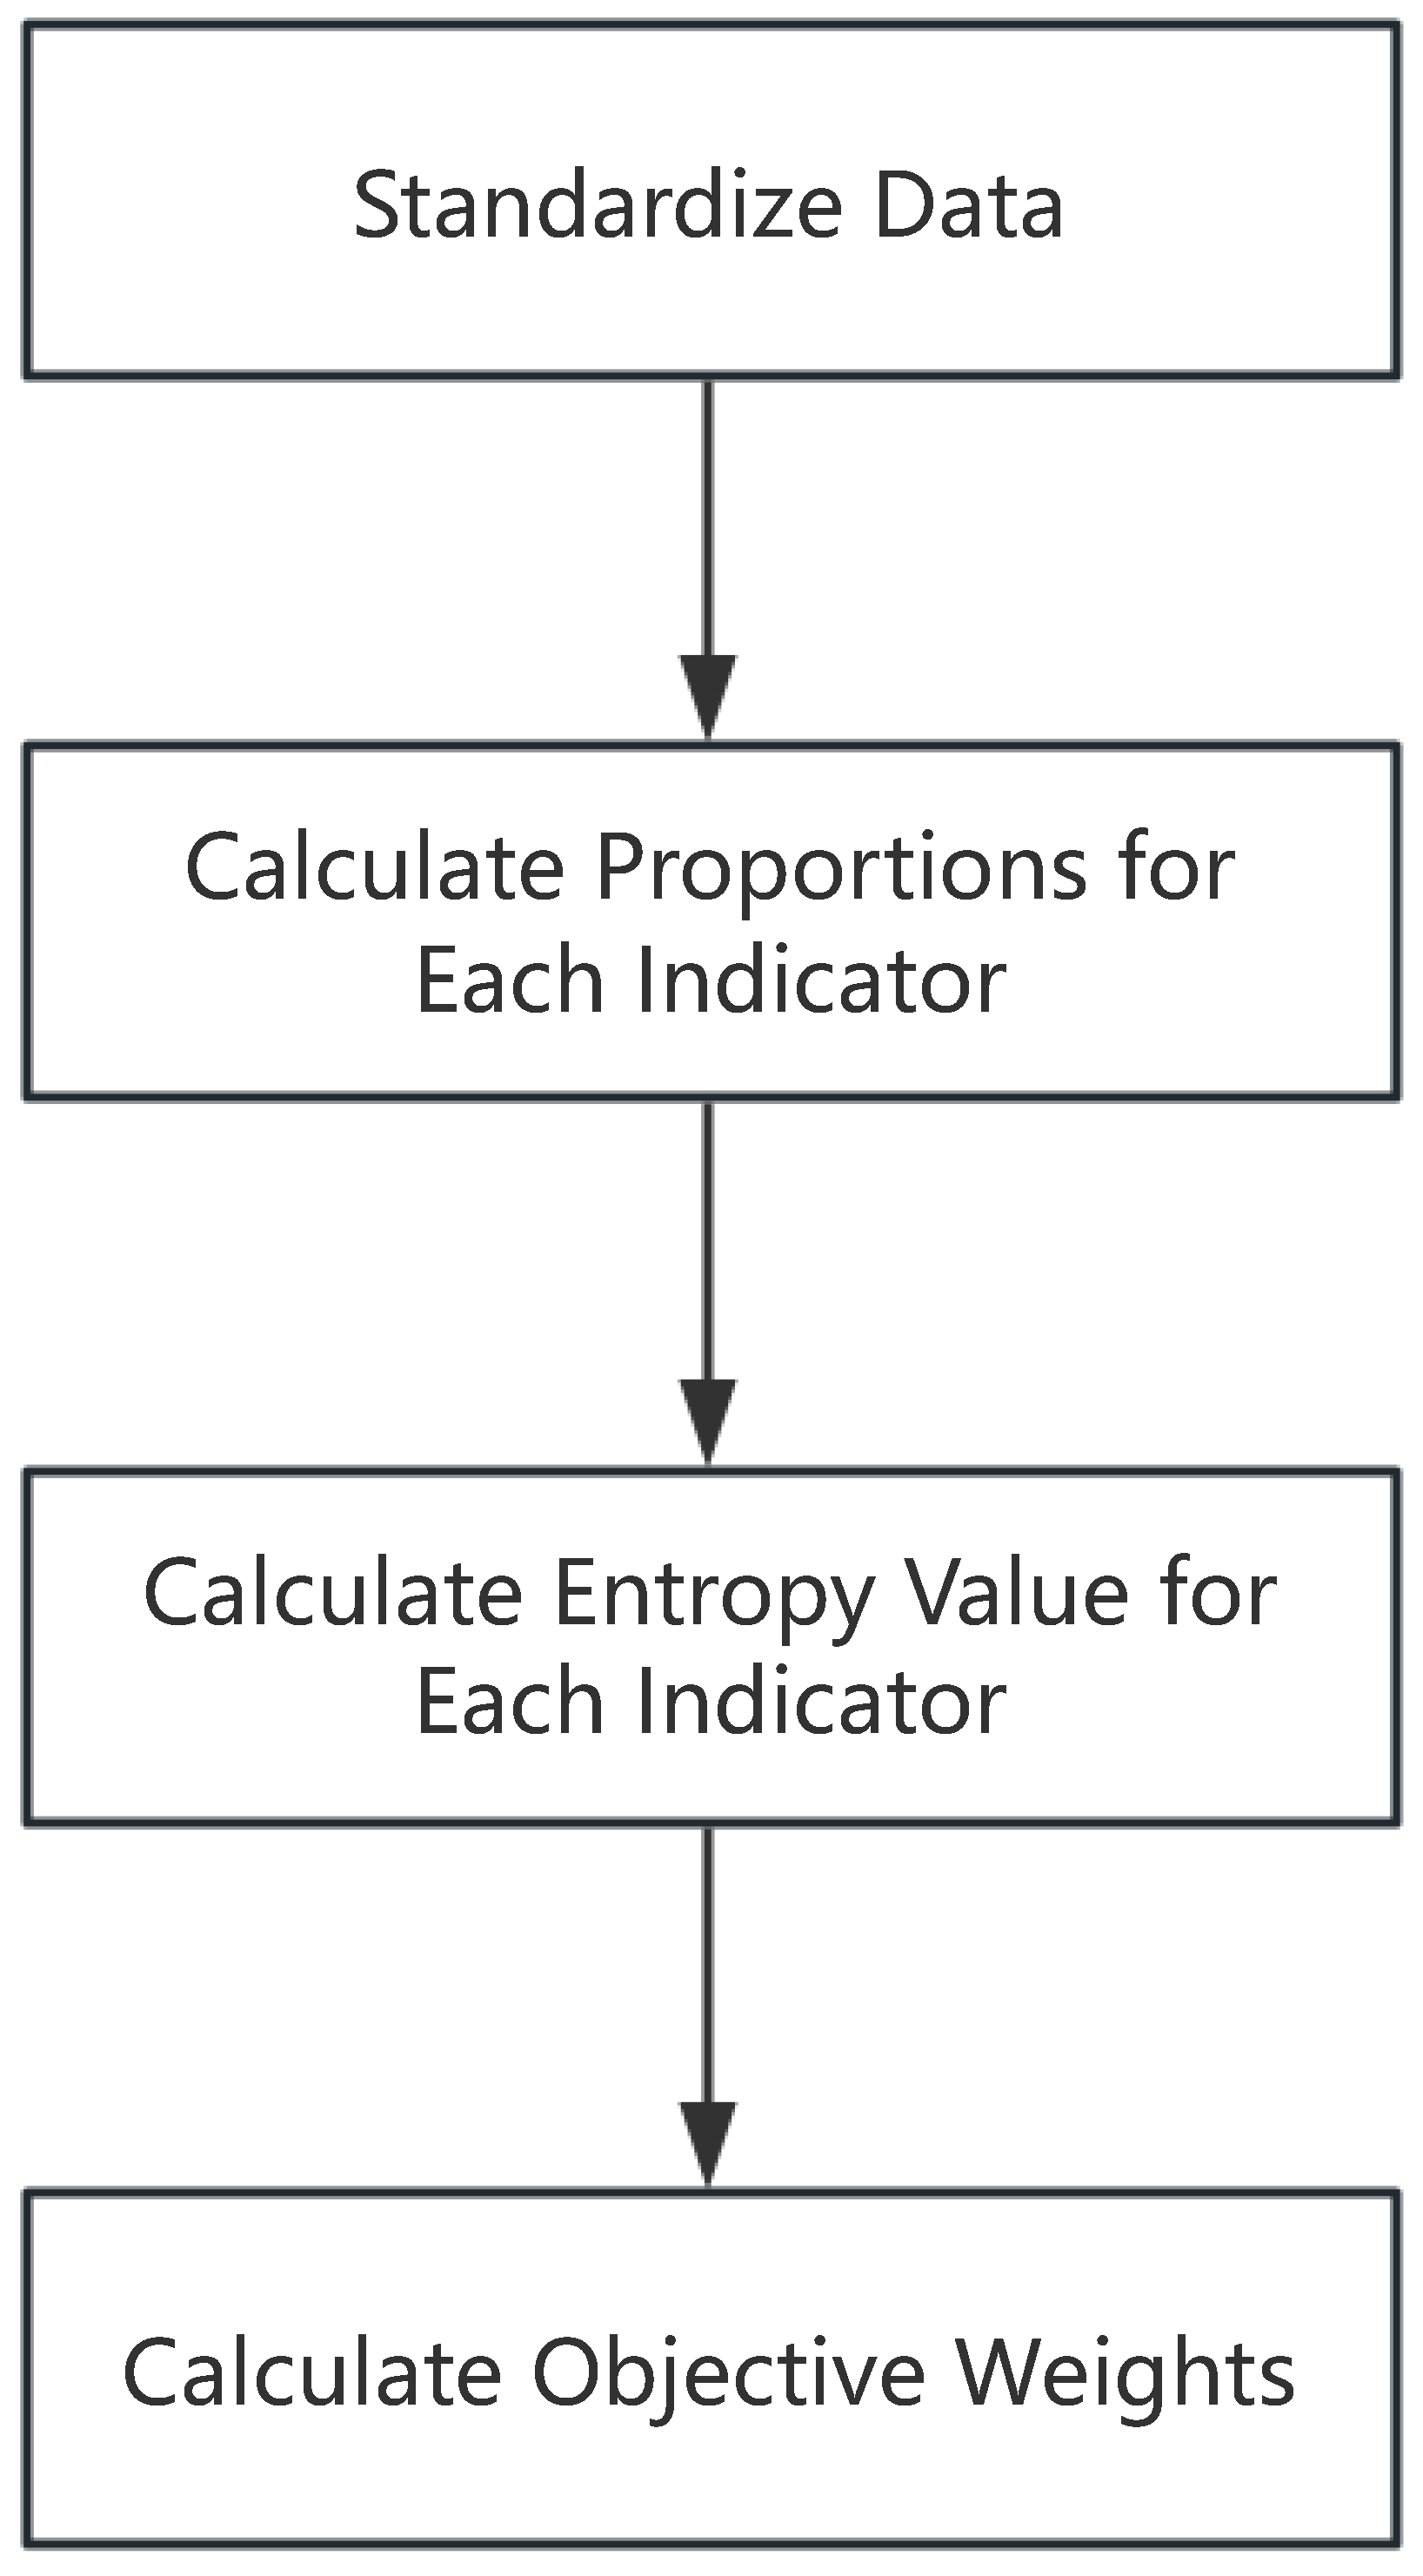
2.3. Entropy Weight Method to Determine the Objective Weight of Indicators

The entropy weight method is based on the fundamental principles of information theory, using the differences in specific data information to assign weights [55]. The degree of dispersion of an indicator is determined by its entropy value. The smaller the entropy value of an indicator, the greater the dispersion between the values of the indicator, indicating that the information content of the indicator is larger, and its weight in the evaluation will be greater [56]. Conversely, the larger the entropy value, the smaller the difference between the indicators, and the smaller the weight [56]. In recent years, the entropy weight method has shown significant application value in decision analysis across multiple fields. Scholars have used the entropy weight method to complete water quality assessments, air quality monitoring, and evaluations of ecological protection effectiveness [57]. In semiconductor photolithography technology development, the entropy weight method is used to quantify technical complexity and supply chain risks, thereby prioritizing resources for critical processes [58]. Some studies even combine the entropy weight method with the LDA topic model and time series analysis to dynamically track the technology life cycle. The process of determining indicator weights using the entropy weight method is shown in Figure 3.
As shown in Figure 3, the first step is to standardize the data. To eliminate the influence of differences between indicators on the data analysis results, this paper uses the range method to standardize the original data, ensuring that the normalized data are within the range [0, 1]. The following formula is used to standardize each indicator, obtaining the standardized values for the indicators: X = x i j m × n .
Information entropy is a dimensionless value, so the indicators should be standardized when calculating the indicator weights. The range normalization method is used. For positive indicators, the standardization formula is as follows:
x i j = x i j min x i max x i min x i
For negative indicators, the standardization formula is as follows:
x i j = max x i x i j max x i min x i
The second step is to calculate the indicator weights. Based on the standardized data, the entropy weight method is further used to determine the indicator weights. The detailed steps are provided below.
Calculate the proportion p i j of the i evaluation object under the j indicator:
p i j = x i j i = 1 m x i j
The third step is to calculate the entropy value of the j indicator based on Equation (9):
E j = ln ( m ) 1 i = 1 m p i j ln p i j
where, if p i j = 0 , then p i j ln p i j = 0 .
Finally, based on Equation (10), the objective weight of the j indicator is calculated as follows:
v j = 1 E j j = 1 n 1 E j

2.4. Determining the Combined Weight

Based on the subjective and objective indicator weights obtained from the AHP and entropy weight method, the combined weight is calculated. AHP assigns higher subjectivity, while the entropy weight method focuses more on the original information differences between indicators. By combining the indicator weights from both AHP and the entropy weight method, it is possible to overcome the limitations of qualitative analysis with high subjectivity and randomness, while objectively determining the relative weights of evaluation indicators. This ensures that the weighting results are more systematic and feasible. Therefore, in this study, AHP and the entropy weight method are combined, and the combined weight is taken as the final result to ensure the accuracy and practicality of the evaluation results.
Based on the subjective weights calculated by the analytic hierarchy process (AHP) and the objective weights calculated by the entropy weight method, the combined weight of the indicators is calculated using the following method:
ω j = w j + v j j = 1 n w j + v j

2.5. Determining Patent Quality

After obtaining the combined weights of the patent evaluation indicators, a patent research quality assessment index (C) is constructed to reflect the quality level of each patent. The formula for calculating the patent research quality is as follows:
C i = j = 1 n ω j × x i j ( j = 1 , 2 , , n )
In Equation (13), C i represents the standardized value of the j indicator for the i patent. ω i is the total research quality score for the i patent, which is the weight of the j evaluation indicator. x i j is the score of the i patent on the j normalized indicator. After obtaining the C i of each patent, all patents are classified into three types based on the maximum C i value. Patents with a C i value greater than 70% of C i (max) are considered core patents. Patents with a C i value greater than 30% but less than 70% of C i (max) are considered important patents. Patents with a C i value less than 30% of C i (max) are considered ordinary patents.

3. Empirical Analysis

3.1. Patent Data Retrieval

This study focuses on patent data related to electric vehicle battery management systems. According to the query results from the patent search tool PATENTSCOPE provided by WIPO, as of February 2025, there are 5464 patents related to “battery management systems”, of which only 275 patents are specifically related to both “battery management system” AND “electric vehicle” [59]. In the China National Intellectual Property Administration (CNIPA) database, only five patents match the same keywords [60]. Using PatSnap’s patent database, a keyword-based search strategy was applied, utilizing terms related to electric vehicle battery management systems [61]. The search covered patents filed between 2000 and 2024, using the patent application date as the time node. The final search expression was: TTL: (Electric Vehicle OR Battery Management System OR Electric Vehicle Battery Management System) AND PATSNAPFILTER = (PATENT_TYPE: (“A” OR “U” OR “B”) AND SIMPLE_LEGAL_STATUS: (“1” OR “221”)). The search was conducted on 19 February 2025, yielding 535 patents. Considering the larger sample size in PatSnap compared to PATENTSCOPE, this study selects data from PatSnap as the research sample, and the descriptive statistics of the sample indicators are presented in Table 4.

3.2. Patent Analysis

Based on the 535 patents retrieved from the PatSnap database, this section analyzes the recent trends in the technological activity of electric vehicle battery management systems (BMS). As shown in Figure 4, the number of BMS patents grew rapidly between 2015 and 2020, peaking in 2020 with 96 patents, reflecting the rapid growth of the new energy vehicle market and the critical importance of BMS technology during that period. However, since 2021, the number of patent applications has steadily declined, with a sharp decrease to just six patents in 2024. This trend may indicate that the innovation focus in the market has shifted toward other emerging fields, and changing market demands have led to a decline in the intensity of BMS technology development.
According to Figure 5, global BMS patent applications are geographically concentrated in China, the United States, and South Korea, where technological innovation capabilities are strong, and research and development activities are highly active among enterprises and research institutions. From the perspective of enterprise distribution, leading companies such as LG Energy Solution, BYD, Hyundai, and GAC Aion have applied for patents in multiple countries, indicating a trend toward global expansion. Among them, Chinese companies have the most patent applications, including vehicle manufacturers (e.g., BYD, located in Shenzhen, China; GAC Aion, located in Guangzhou, China) and battery manufacturers (e.g., Hive Energy, located in Beijing, China; CATL, located in Ningde, China), reflecting China’s advantage in having a complete industrial chain in the BMS sector. The patent distribution in the United States and South Korea is relatively balanced, including new energy vehicle manufacturers (e.g., Rivian, located in Michigan, USA) and battery and component suppliers (e.g., LG Energy Solution, located in Seoul, South Korea; Hanon Systems, located in Seoul, South Korea). Additionally, some companies have filed patents through the European Patent Office (EPO) or the World Intellectual Property Organization (WIPO), indicating a strong focus on the European market for BMS technology. However, the patent presence in the European and Indian markets remains relatively weak.
Regarding technological directions, Figure 6 shows the main IPC (international patent classification) codes with the highest number of patents and associated technological themes. The main technical areas are focused on battery management methods (H01M10/42), battery charging control (H02J7/00), battery structure optimization (H01M10/48), battery and energy storage system response control (B60L58/12), and battery status monitoring and diagnostics (G01R31/36). The H01M10/42 and H01M10/48 categories emphasize battery management and performance optimization, while B60L58/12 focuses on battery energy storage and management. Although the development of these technologies is concentrated on improving battery efficiency, lifespan, and charging management, only 107 of the 535 patents address core technologies, indicating that there is still significant room for improvement in BMS technology development. Current technological innovations focus on enhancing battery efficiency, extending life, and optimizing charging management. However, further investments are needed to optimize battery life, charging efficiency, and intelligent energy dispatch.
Overall, the competition in electric vehicle BMS technology is becoming increasingly international, particularly as companies in leading technological countries such as China, the United States, and South Korea intensify their research and development efforts. However, despite the growing global attention to BMS technology, the relatively low number of related patents indicates that the potential for technological innovation in this field has not yet been fully realized. To maintain their current advantages, companies must increase their investment in technology to drive further optimization and innovation in battery management systems, thereby improving overall performance and industry competitiveness.

4. Identification of Electric Vehicle Battery Management System Technologies and Results Analysis

First, the weight coefficients of the various indicators in the above patent identification system were calculated using the AHP-entropy method. Then, an empirical analysis of core patent identification was conducted based on the 535 patents selected from 2000 to 2024. During the AHP evaluation process, a review panel consisting of six intellectual property experts was invited to assign weights to the core patent evaluation indicators using the matrix scaling method. The entropy method was employed to calculate the weights based on the information from all the patent indicators.
Following the steps outlined above, the calculated weight results for each evaluation indicator are presented in Table 5 and Table 6.
The combination weights of the evaluation indicators derived above and the data from the 535 patents were substituted into Formula (13) to determine the value degree of each patent in the sample data. The maximum patent value degree was set to 1, and the value degrees of the other patents were proportionally converted. The resulting distribution of patent value degrees is shown in Figure 7. The 535 electric vehicle battery management system patents’ value degrees approximately follow a normal distribution. The highest number of patents is found in the (0.1, 0.2] range, with 192 patents, while patents with both lower and higher value degrees are fewer. In the (0.7, 0.8] range, there are four patents; in the (0.8, 0.9] range, there are three patents; and in the (0.9, 1] range, only seven patents. Patents with a value degree greater than 0.7 are classified as core patents. As a result, 14 high-quality patents, 71 key patents, and 450 regular patents were identified, with 10 being Chinese patents and 4 being U.S. patents. Among the fourteen core patents, only two involve extending battery life, one relates to the anti-interference of the electric vehicle battery management system, while the majority focus on the safety and volume of the electric vehicle battery management system.

5. Conclusions and Insights

This study performs a statistical analysis of patent data for electric vehicle battery management systems (BMS) from 2000 to 2024, constructs a patent value evaluation system based on four dimensions—technology, market, economy, and law—and uses a combined approach of the analytical hierarchy process (AHP) and the entropy weight method to empirically analyze global BMS patents for electric vehicles. Patent application trend shows that BMS technology peaked in 2020 but has gradually declined since then. The following are the main conclusions and insights of the study.

5.1. The Core Role of Electric Vehicle Companies and the Importance of BMS

As connectors between the battery and automotive industries, electric vehicle companies play a crucial role in achieving environmental goals by implementing BMS. BMS is not only one of the core technologies of electric vehicles, but also plays a crucial role in ensuring battery safety, extending battery life, and improving battery efficiency [62]. By utilizing BMS, electric vehicle companies can optimize battery performance, and enhance efficiency and safety during the charging and discharging process, thus better promoting the achievement of electric vehicle environmental goals.
Systematic analysis based on patent data shows that electric vehicle companies face significant dual challenges in both “quantity” and “quality” in the BMS field. In terms of quantity, the overall number of patents is relatively low, with only 535 patents related to BMS globally, indicating that technological innovation in this field is still underdeveloped. In terms of quality, the number of patents for core technologies is limited, especially those related to key technologies such as extending battery life and improving battery efficiency. Patents related to BMS technologies that help companies achieve their environmental goals—such as those focused on prolonging battery life and enhancing battery efficiency—are particularly scarce. This suggests that, although electric vehicle companies have made some progress in the BMS field, there is still significant room for innovation in core technologies.

5.2. Current R&D Companies and Future Development Trends

The research and development of electric vehicle BMS is primarily concentrated in leading battery manufacturers and automotive companies. These companies have filed numerous patents in the global automotive industry, highlighting their technological advantages in the BMS field [63]. However, as electric vehicles are set to become the mainstream mode of transportation in the future, there is vast room for development, and the innovative potential of BMS technology has yet to be fully realized. Electric vehicle companies should seize this opportunity and increase their R&D investment in core BMS technologies, especially in areas such as battery life management and charging efficiency optimization, to maintain continuous technological innovation.
From the patent application trends mentioned above, it can be observed that electric vehicle BMS technology peaked in 2020, after which patent applications gradually declined. This trend suggests that the development of BMS technology may have entered a relatively mature stage, or that the market’s focus of innovation is shifting to other emerging fields. However, similar to the emissions issues of past internal combustion engine vehicles, although individual internal combustion engine vehicles meet emission standards, the cumulative emissions from large numbers of vehicles still pose a significant environmental threat. Likewise, although there has been progress in the development of BMS technology in certain areas, sustained R&D investment remains necessary to address the large-scale adoption of electric vehicles and long-term environmental goals in the future. Therefore, R&D companies must recognize that the development of BMS technology is a long-term process, and maintaining continuous investment is crucial.
Based on the IPC classification and the distribution of patent applicants for electric vehicle BMS technologies, it can be observed that BMS patent applications are mainly concentrated in China, the United States, and South Korea, indicating the technological leadership of these countries in this field. In contrast, the patent landscape for BMS technologies in regions such as Europe and India is relatively weak. This phenomenon may be closely related to the development stage of the electric vehicle market, policy support, and the economic environment in these regions [64]. For example, Europe may face challenges such as an underdeveloped battery industry supply chain, with only a few local companies supporting it, resulting in limitations on core technological innovation [61]. Therefore, in the drive for carbon neutrality goals, optimizing patent portfolio structures and improving technology transfer efficiency will be key to helping late-comer regions catch up with the industry. Increasing R&D investment in BMS technologies and avoiding being constrained by the “technology follower” role during development will be crucial to promoting the sustainable development of the electric vehicle industry in these regions.

5.3. Application of the Technology Identification Indicator System

The technical recognition indicator system constructed in this study identifies the patent value through quantitative data and adopts a combination of subjective and objective weighting methods (AHP-Entropy method). This approach overcomes the limitations of qualitative analysis, which can be highly subjective, while also objectively determining the relative weight of evaluation indicators. The model provides a useful reference for studying technological development trends and offers a scientific method to assess patent quality. Through this model, companies may be able to more accurately evaluate the technological value, market potential, and legal protection of their patents, thereby optimizing their patent strategies and potentially enhancing their technological innovation capabilities.

6. Limitations of the Study

One limitation of this study is the constraints of patent data. Although patent data can effectively reflect the level of technological innovation, relying solely on patent information for technology identification may overlook the deeper connections between patent technologies and the development of disciplines, technological evolution, and industrial applications. While patents reveal the level of innovation activity, they are insufficient to comprehensively demonstrate how technologies perform in practical applications and how market demands are changing. Therefore, future research could consider incorporating multi-source data, such as academic papers, market reports, and corporate R&D data, and conduct more in-depth analyses in specific areas of electric vehicle battery management systems (BMS), such as battery life management and charging efficiency optimization, in order to gain a more comprehensive understanding of the development trends of BMS technologies.
Secondly, the current development of electric vehicle BMS technology may be facing bottlenecks, especially in the area of safety, which still dominates research efforts. This bottleneck may limit breakthroughs in other critical areas, such as improving battery performance and improving charging efficiency. Therefore, future research and technological development should focus on a broader range of technical dimensions to promote technological diversification and comprehensive development.

Author Contributions

Conceptualization, D.W.; methodology, L.P.; validation, D.W.; writing—original draft preparation, L.P.; writing—review and editing, L.P. and H.Z.; supervision, H.Z.; project administration, D.W.; funding acquisition, D.W. All authors have read and agreed to the published version of the manuscript.

Funding

This research was funded by Hunan Normal University, RESEARCH ON THE INTERPRETABILITY OF AI, grant number P2021001.

Institutional Review Board Statement

Not applicable.

Informed Consent Statement

Not applicable.

Data Availability Statement

PatSnap, https://www.zhihuiya.com, accessed on 2 April 2025.

Conflicts of Interest

The authors declare no conflicts of interest.

References

  1. Mahmud, M.P.; Farjana, S.H. Comparative Life Cycle Environmental Impact Assessment of Renewable Electricity Generation Systems: A Practical Approach towards Europe, North America and Oceania. Renew. Energy 2022, 193, 1106–1120. [Google Scholar] [CrossRef]
  2. Taylor, A.M.K.P. Science review of internal combustion engines. Energy Policy 2008, 36, 4657–4667. [Google Scholar] [CrossRef]
  3. US EPA, OA. EPA History: The Clean Air Act of 1970. 2016. Available online: www.epa.gov (accessed on 12 February 2025).
  4. Government of Canada. The Paris Agreement, Canada.ca. 2015. Available online: www.canada.ca/en/environment-climate-change/services/climate-change/paris-agreement.html (accessed on 10 February 2025).
  5. Pilkington, A.; Dyerson, R. Innovation in Disruptive Regulatory Environments. Eur. J. Innov. Manag. 2006, 9, 79–91. [Google Scholar] [CrossRef]
  6. García-Olivares, A.; Solé, J.; Osychenko, O. Transportation in a 100% Renewable Energy System. Energy Convers. Manag. 2018, 158, 266–285. [Google Scholar] [CrossRef]
  7. Kurucan, M.; Özbaltan, M.; Yetgin, Z.; Alkaya, A. Applications of Artificial Neural Network Based Battery Management Systems: A Literature Review. Renew. Sustain. Energy Rev. 2024, 192, 114262. [Google Scholar] [CrossRef]
  8. Zhao, J.; Feng, X.; Wang, J.; Lian, Y.; Ouyang, M.; Burke, A.F. Battery Fault Diagnosis and Failure Prognosis for Electric Vehicles Using Spatio-Temporal Transformer Networks. Appl. Energy 2023, 352, 121949. [Google Scholar] [CrossRef]
  9. Pandise, E.; Kolodny, L. EV Drivers Wrestle with Cold Weather Sapping Their Battery Range. NBCUniversal Media, LLC. 2024. Available online: www.nbcnews.com/business/autos/ev-battery-range-cold-weather-charging-rcna134355 (accessed on 15 February 2025).
  10. Liu, K.; Peng, Q.; Che, Y.; Zheng, Y.; Li, K.; Teodorescu, R.; Barai, A. Transfer Learning for Battery Smarter State Estimation and Ageing Prognostics: Recent Progress, Challenges, and Prospects. Adv. Appl. Energy 2023, 9, 100117. [Google Scholar] [CrossRef]
  11. Gabbar, H.A.; Othman, A.M.; Abdussami, M.R. Review of Battery Management Systems (BMS) Development and Industrial Standards. Technologies 2021, 9, 28. [Google Scholar] [CrossRef]
  12. Barman, P.; Dutta, L.; Azzopardi, B. Electric Vehicle Battery Supply Chain and Critical Materials: A Brief Survey of State of the Art. Energies 2023, 16, 3369. [Google Scholar] [CrossRef]
  13. Turgut, M.; Bayir, R.; Duran, F. CAN Communication Based Modular Type Battery Management System for Electric Vehicles. Elektron. Elektrotechnika 2018, 24, 53–60. [Google Scholar] [CrossRef]
  14. Liu, K.; Li, K.; Peng, Q.; Zhang, C. A Brief Review on Key Technologies in the Battery Management System of Electric Vehicles. Front. Mech. Eng. 2018, 14, 47–64. [Google Scholar] [CrossRef]
  15. Monolithic Power Systems, Inc. EV Battery Management Systems (BMS). Monolithicpower.com. Available online: https://www.monolithicpower.com/jp/learning/mpscholar/automotive-electronics/electric-vehicles-and-hybrid-power-systems/ev-battery-management-systems?srsltid=AfmBOooPUZLlbYFgcYaP9als2-iV1envf7UN3fX51e7SVWzsX4O_8ZBe (accessed on 23 February 2025).
  16. Uma, S.; Eswari, R. Enhancing Electric Vehicle Battery Performance and Safety Through IoT and Machine Learning: A Fire Prevention Approach. Trans. Emerg. Telecommun. Technol. 2025, 36, 4. [Google Scholar] [CrossRef]
  17. Xing, Y.; Ma, E.W.M.; Tsui, K.L.; Pecht, M. Battery Management Systems in Electric and Hybrid Vehicles. Energies 2011, 4, 1840–1857. [Google Scholar] [CrossRef]
  18. Conte, F.V. Battery and Battery Management for Hybrid Electric Vehicles: A Review. e i Elektrotechnik Informationstechnik 2006, 123, 424–431. [Google Scholar] [CrossRef]
  19. Waseem, M.; Ahmad, M.; Parveen, A.; Suhaib, M. Battery Technologies and Functionality of Battery Management System for EVs: Current Status, Key Challenges, and Future Prospects. J. Power Sources 2023, 580, 233349. [Google Scholar] [CrossRef]
  20. Rahmani, P.; Chakraborty, S.; Mele, I.; Katrašnik, T.; Bernhard, S.; Pruefling, S.; Hegazy, O. Driving the Future: A Comprehensive Review of Automotive Battery Management System Technologies, and Future Trend. J. Power Source 2024, 629, 235827. [Google Scholar] [CrossRef]
  21. Liu, J. Centralized BMS vs Distributed BMS vs Modular BMS, Which is the Main Trend? MokoEnergy—Your New Energy Solution Provider. 2023. Available online: https://www.mokoenergy.com/centralized-bms-vs-distributed-bms-vs-modular-bms/ (accessed on 16 January 2025).
  22. Etengoff, A. What EV Battery Management System (BMS) Architectures Are Used Today? EV Engineering. 2023. Available online: https://www.evengineeringonline.com/what-ev-battery-management-system-bms-architectures-are-used-today/ (accessed on 20 February 2025).
  23. Schärtel, L.; Reick, B.; Pfeil, M.; Stetter, R. Analysis and Synthesis of Architectures for Automotive Battery Management Systems. Appl. Sci. 2022, 12, 10756. [Google Scholar] [CrossRef]
  24. Ansari, S.; Ayob, A.; Hossain Lipu, M.S.; Hussain, A.; Saad, M.H.M. Data-Driven Remaining Useful Life Prediction for Lithium-Ion Batteries Using Multi-Charging Profile Framework: A Recurrent Neural Network Approach. Sustainability 2021, 13, 13333. [Google Scholar] [CrossRef]
  25. Hannan, M.A.; Lipu, M.S.H.; Hussain, A.; Saad, M.H.; Ayob, A. Neural Network Approach for Estimating State of Charge of Lithium-Ion Battery Using Backtracking Search Algorithm. IEEE Access 2018, 6, 10069–10079. [Google Scholar] [CrossRef]
  26. Ghazali, A.K.; Nor Hassan, M.K. Advanced Algorithms in Battery Management Systems for Electric Vehicles: A Comprehensive Review. Symmetry 2025, 17, 321. [Google Scholar] [CrossRef]
  27. Yuan, X.; Wu, J. Research on the Development of pure electric vehicle power battery Technology based on patent analysis. IOP Conf. Ser. Earth Environ. Sci. 2020, 615, 20–41. [Google Scholar] [CrossRef]
  28. Liu, Z.; Xiang, X.; Feng, J. Tracing evolutionary trajectory of charging technologies in electric vehicles: Patent citation network analysis. Environ. Dev. Sustain. 2023, 26, 12789–12813. [Google Scholar] [CrossRef]
  29. Basberg, B.L. Patents and the measurement of technological change: A survey of the literature. Res. Policy 1987, 16, 131–141. [Google Scholar] [CrossRef]
  30. Organisation for Economic Co-operation and Development. OECD Patent Statistics Manual. 2025. Available online: https://www.oecd.org/en/publications/oecd-patent-statistics-manual_9789264056442-en.html (accessed on 16 February 2025).
  31. Fung, M.K.; Chow, W.W. Measuring the intensity of knowledge flow with patent statistics. Econ. Lett. 2002, 74, 353–358. [Google Scholar] [CrossRef]
  32. World Intellectual Property Organization. International Patent Classification (IPC). classification-ipc. 2024. Available online: https://www.wipo.int/en/web/classification-ipc (accessed on 20 February 2025).
  33. Vijvers, W.G. The international patent classification as a search tool. World Pat. Inf. 1990, 12, 26–30. [Google Scholar] [CrossRef]
  34. Liu, D.-R.; Shih, M.-J. Hybrid-patent classification based on patent-network analysis. J. Am. Soc. Inf. Sci. Technol. 2010, 62, 246–256. [Google Scholar] [CrossRef]
  35. Yamada, H. Identification methods and indicators of important patents. Libr. Hi Tech 2021, 40, 29–80. [Google Scholar] [CrossRef]
  36. Yang, G.-C.; Li, G.; Li, C.-Y.; Zhao, Y.-H.; Zhang, J.; Liu, T.; Chen, D.-Z.; Huang, M.-H. Using the comprehensive patent citation network (CPC) to evaluate patent value. Scientometrics 2015, 105, 1319–1346. [Google Scholar] [CrossRef]
  37. Liu, J.; Zheng, J. Identifying important nodes in complex networks based on extended degree and E-shell hierarchy decomposition. Sci. Rep. 2023, 13, 6. [Google Scholar] [CrossRef]
  38. Lee, C.; Kwon, O.; Kim, M.; Kwon, D. Early identification of emerging technologies: A machine learning approach using multiple patent indicators. Technol. Forecast. Soc. Change 2018, 105, 597–605. [Google Scholar] [CrossRef]
  39. Hofmann, S.G.; Curtiss, J.; McNally, R.J. A Complex Network. Perspect. Psychol. Sci. 2016, 11, 597–605. [Google Scholar] [CrossRef] [PubMed]
  40. Feng, B.; Sun, K.; Chen, M.; Gao, T. The Impact of Core Technological Capabilities of High-Tech Industry on Sustainable Competitive Advantage. Sustainability 2020, 12, 2980. [Google Scholar] [CrossRef]
  41. Ernst, H. Patent information for strategic technology management. World Pat. Inf. 2003, 25, 233–242. [Google Scholar] [CrossRef]
  42. Monolithic Power Systems, Inc. Understanding the Role of a Battery Management System (BMS) in Electric Vehicles. Monolithicpower.com. 2024. Available online: https://www.monolithicpower.com/en/learning/resources/understanding-the-role-of-a-battery-management-systems-in-electric-vehicles?srsltid=AfmBOooshbDRXgY1d4W4uH18QFbXW3ECjBJ8eC_V8IyEOD8ShGJAQUXl (accessed on 20 January 2025).
  43. Park, E.; Yoo, K.; Kwon, S.J.; Ohm, J.Y.; Chang, H.J. Effects of innovation cluster and type of core technology on firms’ economic performance. J. Eng. Res. 2016, 14, 12789–12813. [Google Scholar] [CrossRef]
  44. Torkkeli, M.; Tuominen, M. The contribution of technology selection to core competencies. Int. J. Prod. Econ. 2002, 77, 271–284. [Google Scholar] [CrossRef]
  45. Hsieh, C.-H. Patent value assessment and commercialization strategy. Technol. Forecast. Soc. Change 2013, 80, 307–319. [Google Scholar] [CrossRef]
  46. Organisation for Economic Co-operation and Development. Measuring Patent Quality. Measuring Patent Quality. 2025. Available online: https://www.oecd.org/en/publications/measuring-patent-quality_5k4522wkw1r8-en (accessed on 28 January 2025).
  47. van Zeebroeck, N.; van Pottelsberghe de la Potterie, B. The vulnerability of patent value determinants. Sustainability 2011, 20, 283–308. [Google Scholar] [CrossRef]
  48. Saaty, T.L. Decision-making with the AHP: Why is the principal eigenvector necessary. Eur. J. Oper. Res. 2020, 145, 85–91. [Google Scholar] [CrossRef]
  49. Vargas, L.G. An overview of the analytic hierarchy process and its applications. Eur. J. Oper. Res. 1990, 48, 2–8. [Google Scholar] [CrossRef]
  50. Munier, N. USES AND LIMITATIONS OF THE AHP METHOD: A Non-Mathematical and Rational Analysis; Springer: Berlin/Heidelberg, Germany, 2022. [Google Scholar]
  51. Russo, R.d.F.S.M.; Camanho, R. Criteria in AHP: A Systematic Review of Literature. Procedia Comput. Sci. 2015, 55, 1123–1132. [Google Scholar] [CrossRef]
  52. Darko, A.; Chan, A.P.C.; Ameyaw, E.E.; Owusu, E.K.; Pärn, E.; Edwards, D.J. Review of application of analytic hierarchy process (AHP) in construction. Int. J. Constr. Manag. 2018, 19, 436–452. [Google Scholar] [CrossRef]
  53. Pathak, S.K.; Sharma, V.; Chougule, S.S.; Goel, V. Prioritization of barriers to the development of renewable energy technologies in India using integrated Modified Delphi and AHP method. Sustain. Energy Technol. Assess. 2022, 50, 101818. [Google Scholar] [CrossRef]
  54. Mon, D.-L.; Cheng, C.-H.; Lin, J.-C. Evaluating weapon system using fuzzy analytic hierarchy process based on entropy weight. Fuzzy Sets Syst. 1994, 62, 127–134. [Google Scholar] [CrossRef]
  55. Rioul, O. This is IT: A Primer on Shannon’s Entropy and Information. Inf. Theory 2011, 78, 49–86. [Google Scholar] [CrossRef]
  56. Nisar, U.B.; ur Rehman, W.; Saleem, S.; Taufail, K.; ur Rehman, F.; Farooq, M.; Ehsan, S.A. Assessment of water quality using entropy-weighted quality index, statistical methods and electrical resistivity tomography, Moti village, northern Pakistan. J. Contam. Hydrol. 2024, 264, 104368. [Google Scholar] [CrossRef] [PubMed]
  57. Hobbs, R.G.; Petkov, N.; Holmes, J.D. Semiconductor Nanowire Fabrication by Bottom-Up and Top-Down Paradigms. Chem. Mater. 2012, 24, 1975–1991. [Google Scholar] [CrossRef]
  58. The World Intellectual Property Organization. “PATENTSCOPE.” Patentscope. 2023. Available online: www.wipo.int/zh/web/patentscope (accessed on 12 February 2025).
  59. China Organizational Name Administration Center. China National Intellectual Property Administration. 2025. Available online: https://english.cnipa.gov.cn (accessed on 9 February 2025).
  60. PatSnap. Trusted by Top Innovators and IP Experts Worldwide. PatSnap. 2025. Available online: https://www.patsnap.com/ (accessed on 1 March 2025).
  61. Suganya, R.; Joseph, L.L.; Kollem, S. Understanding Lithium-Ion Battery Management Systems in Electric Vehicles: Environmental and Health Impacts, Comparative Study, and Future Trends: A Review. Results Eng. 2024, 24, 103047. [Google Scholar] [CrossRef]
  62. Dataintelo; Sharma, R. Electric Vehicle Battery Management System Market Research Report 2032. [Online] Dataintelo.com. 2019. Available online: https://dataintelo.com/report/electric-vehicle-battery-management-system-market?gad_source=1&gclid=EAIaIQobChMIp-i0w8ezjAMVu6RmAh2EnxRXEAAYAiAAEgIK7fD_BwE (accessed on 1 March 2025).
  63. Jacobsson, S.; Lindholm-Dahlstr, A.; Elg, L. Is the commercialization of European academic R&D weak?—A critical assessment of a dominant belief and associated policy responses. Res. Policy 2013, 42, 874–885. [Google Scholar] [CrossRef]
  64. Perry, C.; Shaw, S.; Thomson, E.; the Fastmarkets Team. Europe’s Battery Supply Chain at a Crossroads in Terms of Challenges, Opportunities. Fastmarkets. 2024. Available online: https://www.fastmarkets.com/insights/europe-battery-supply-chain-challenges-opportunities (accessed on 5 March 2025).
Figure 1. Hierarchical analysis process structure.
Wevj 16 00218 g001
Figure 2. Hierarchical model based on electric vehicle battery management system.
Wevj 16 00218 g002
Figure 3. Steps of the entropy weight method.
Wevj 16 00218 g003
Figure 4. Patent application trends for electric vehicle battery management systems.
Wevj 16 00218 g004
Figure 5. IPC (International Patent Classification) classification and applicant distribution of electric vehicle battery management system patents.
Wevj 16 00218 g005
Figure 6. Patent technology distribution and main research directions for electric vehicle battery management systems.
Wevj 16 00218 g006
Figure 7. Patent value distribution interval chart of electric vehicle battery management systems.
Wevj 16 00218 g007
Table 1. Electric vehicle battery management system indicator system.
Primary IndicatorSecondary Indicator
Technical ValuePatent citation frequency, patent citation count, number of IPC classifications, citation frequency within three years
Market ValuePatent family size, number of citations in patent families, patent license and transfer count
Economic ValuePatent valuation patent, growth rate of similar technologies in the past three years
Legal ValueNumber of pages in the specification, number of Claims
Table 2. Judgment matrix scaling method.
Importance ScaleMeaning
1:1Both elements are equally important
3:1The former is slightly more important than the latter
5:1The former is more important than the latter
7:1The former is much more important than the latter
9:1The former is extremely more important than the latter
2, 4, 6, 8Intermediate values of the above judgments
Reciprocal of the valueThe comparison of the latter to the former
Table 3. Average random consistency index table.
rank of a matrix12345678
RI000.580.891.121.241.361.41
Table 4. Descriptive statistics of the sample indicators.
IndicatorMaximumMinimumArithmetic MeanStandard Deviation
Patent Citation Frequency11804.94766355111.08669738
Patent citation count19105.45794392512.06123606
Number of IPC Classifications1504.3476635512.872227398
Citation Frequency within 3 Years5002.9943925235.88513381
Patent Family Size2012.7121495333.087267263
Number of Citations in Patent Families136010.0299065419.67581461
Patent License and Transfer Count100.0149532710.12147944
Patent Valuation and Pricing2,780,0003300275,092.714520,096.1766
Patent Growth Rate of Similar Technologies in the Past Three Years401231.613084114.110120061
Number of Pages in the Specification102416.7401869213.4998187
Number of Claims55110.89532715.786484692
Table 5. Calculation results of subjective indicator weights.
Primary IndicatorsWeightSecondary IndicatorsWeightCombined Weight
Technical Value0.4117Patent citation frequency0.47680.1963
Patent citation count0.1740.0716
Number of IPC classifications0.07950.0327
Citation frequency within three years0.26960.1110
Market Value0.3098Patent Family Size0.24930.0772
Number of citations in patent families0.15710.0487
Patent license and transfer count0.59390.1839
Economic Value0.1800Patent Valuation and Pricing0.66670.1200
Patent growth rate of similar technologies in the past three years0.33330.0600
Legal Value0.0984Number of pages in the specification0.66670.0656
Number of claims0.33330.0328
Table 6. Combined weights of indicators.
Secondary IndicatorsAHPEntropy Weighting MethodCombined Weight
Patent Citation Frequency0.19630.10930.1528
Patent Citation Count0.07160.07460.0731
Number of IPC Classifications0.03270.01750.0251
Citation Frequency within 3 Years0.1110.10290.1070
Patent Family Size0.07720.10900.0931
Number of Citations in Patent Families0.04870.09040.0695
Patent License and Transfer Count0.18390.35460.2693
Patent Valuation and Pricing0.120.09650.1082
Patent Growth Rate of Similar Technologies in the Past Three Years0.060.00200.0310
Number of Pages in the Specification0.06560.03050.0481
Number of Claims0.03280.01280.0228
Disclaimer/Publisher’s Note: The statements, opinions and data contained in all publications are solely those of the individual author(s) and contributor(s) and not of MDPI and/or the editor(s). MDPI and/or the editor(s) disclaim responsibility for any injury to people or property resulting from any ideas, methods, instructions or products referred to in the content.

