
A Multi-Scheme Comparison Framework for Ultra-Fast Charging Stations with Active Load Management and Energy Storage Under Grid Capacity Constraints

Abstract
1. Introduction
2. ALM-BESS Four-Quadrant Classification Framework and Generalized Comparison Framework
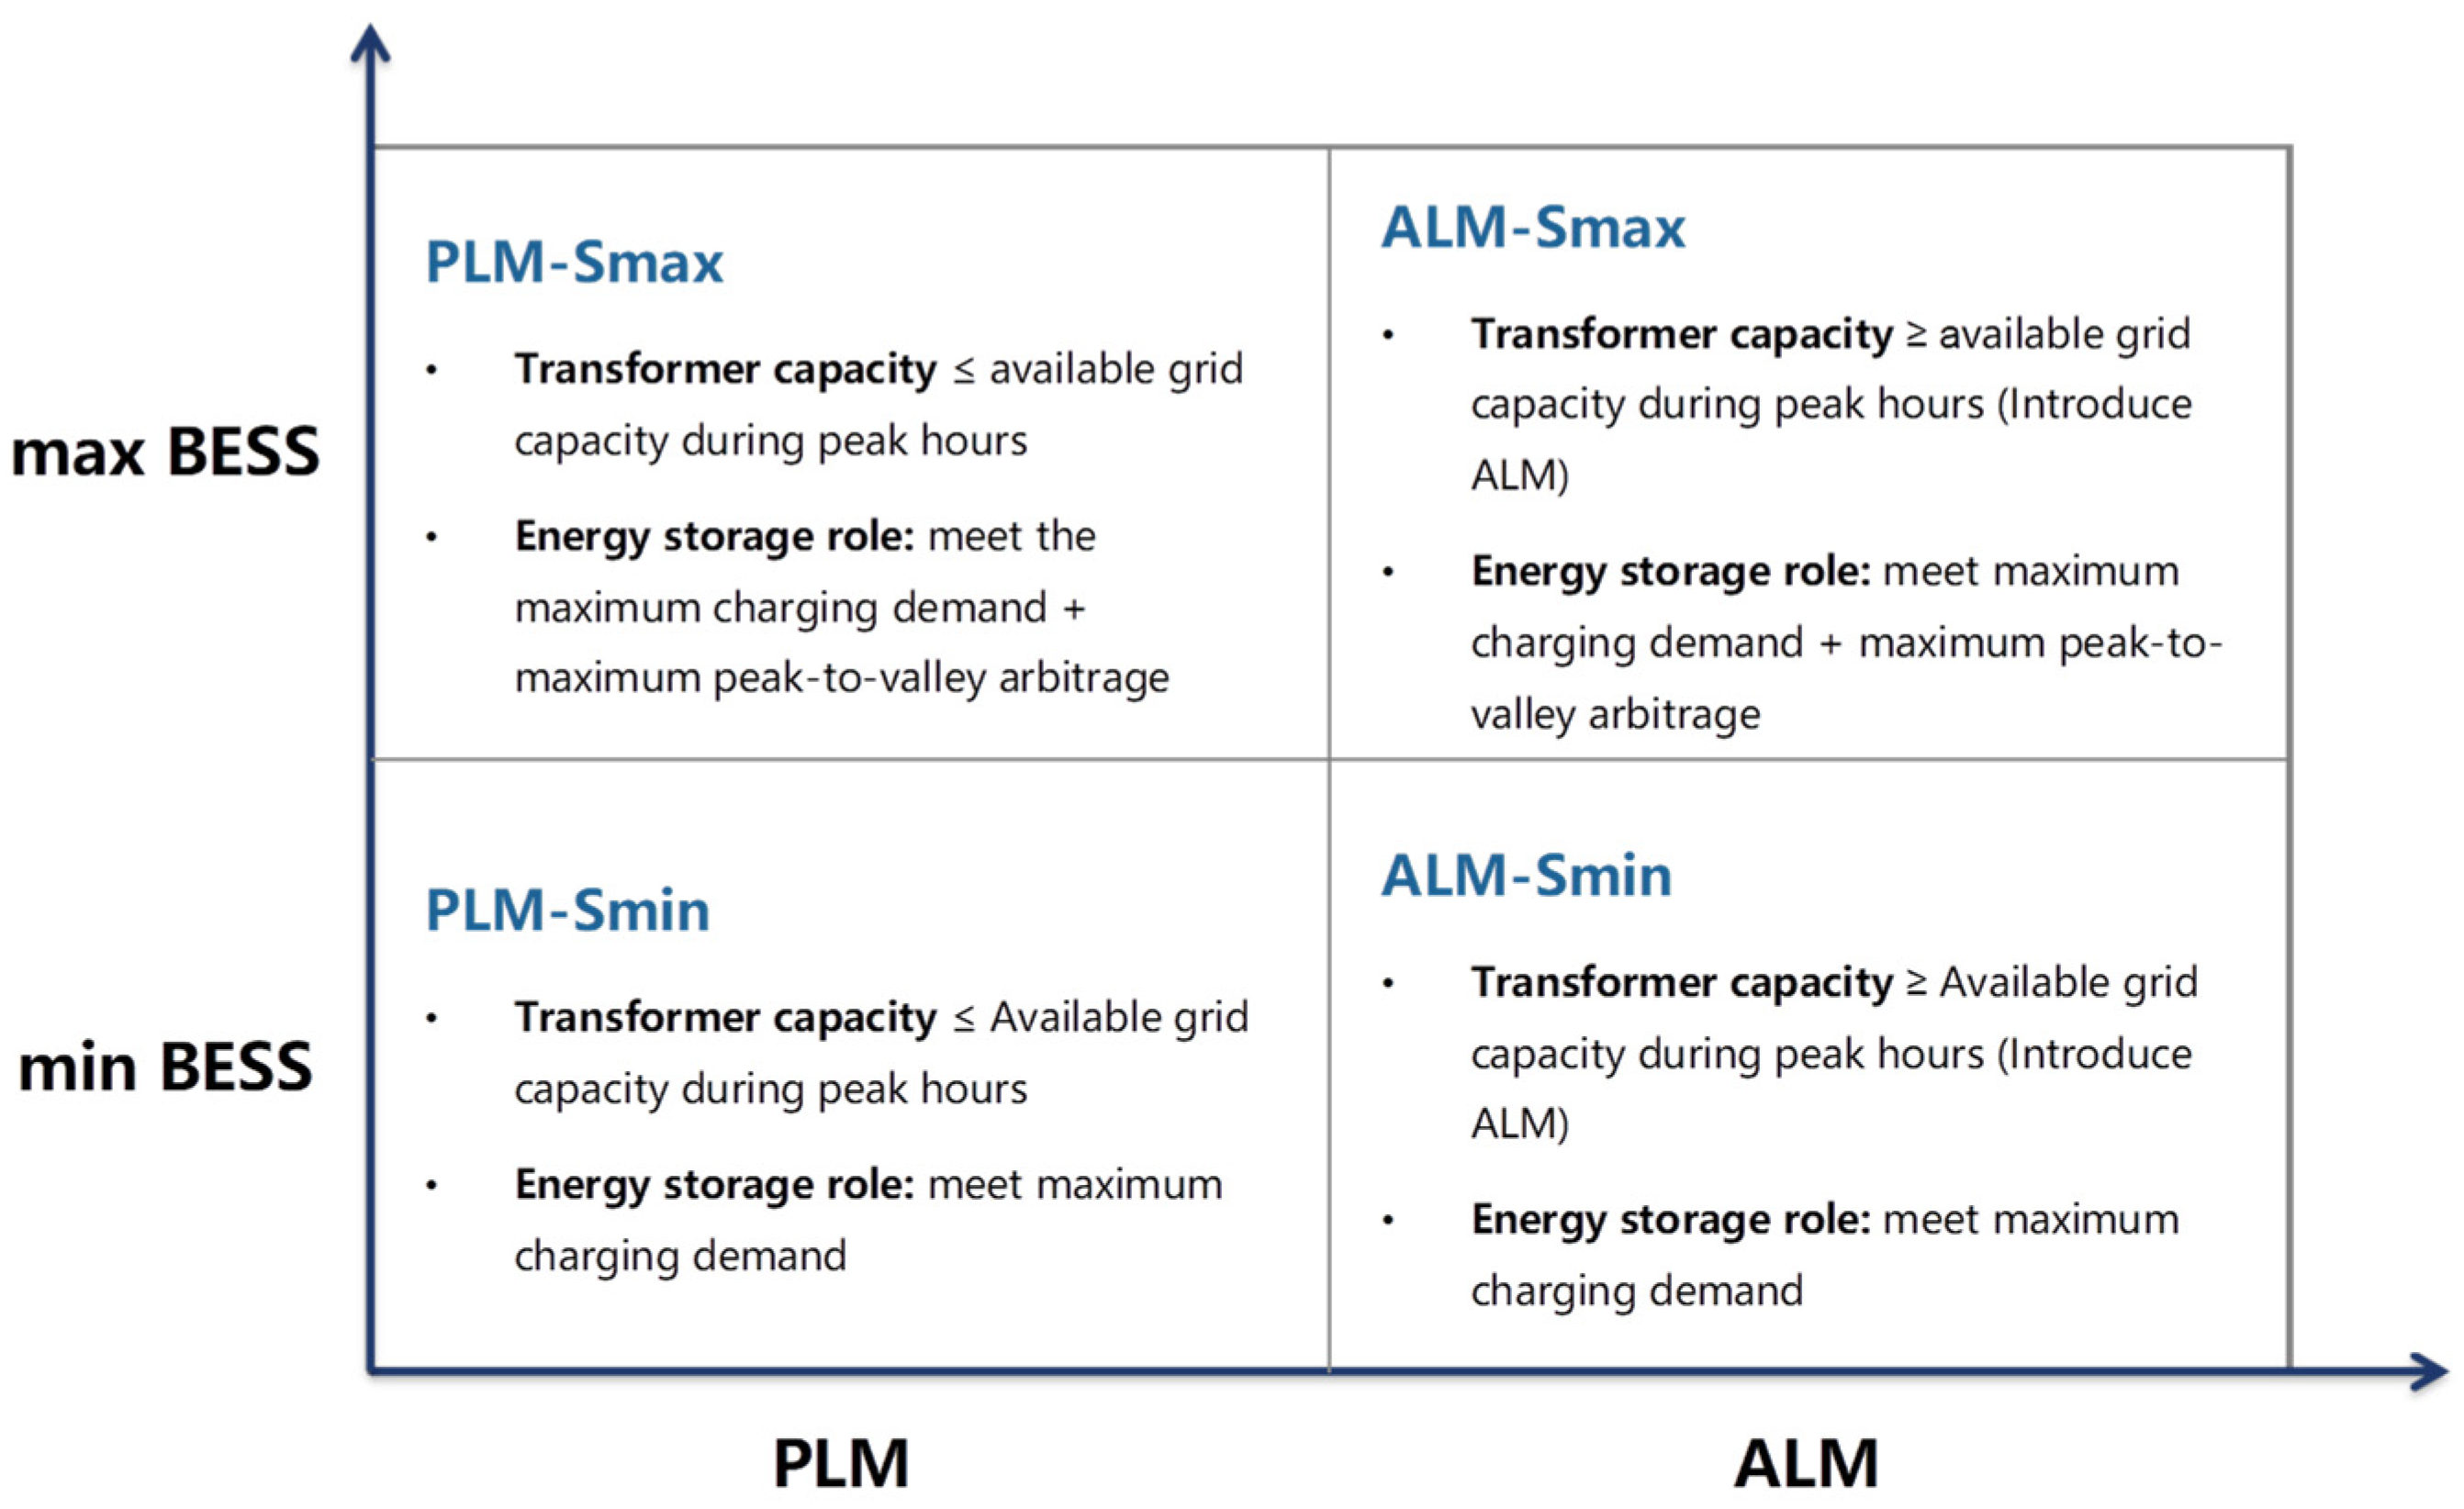
2.1. ALM-BESS Four-Quadrant Classification Framework with Definitions of the Four Schemes
2.1.1. PLM-Smin Scheme
2.1.2. PLM-Smax Scheme
2.1.3. ALM-Smin Scheme
2.1.4. ALM-Smax Scheme
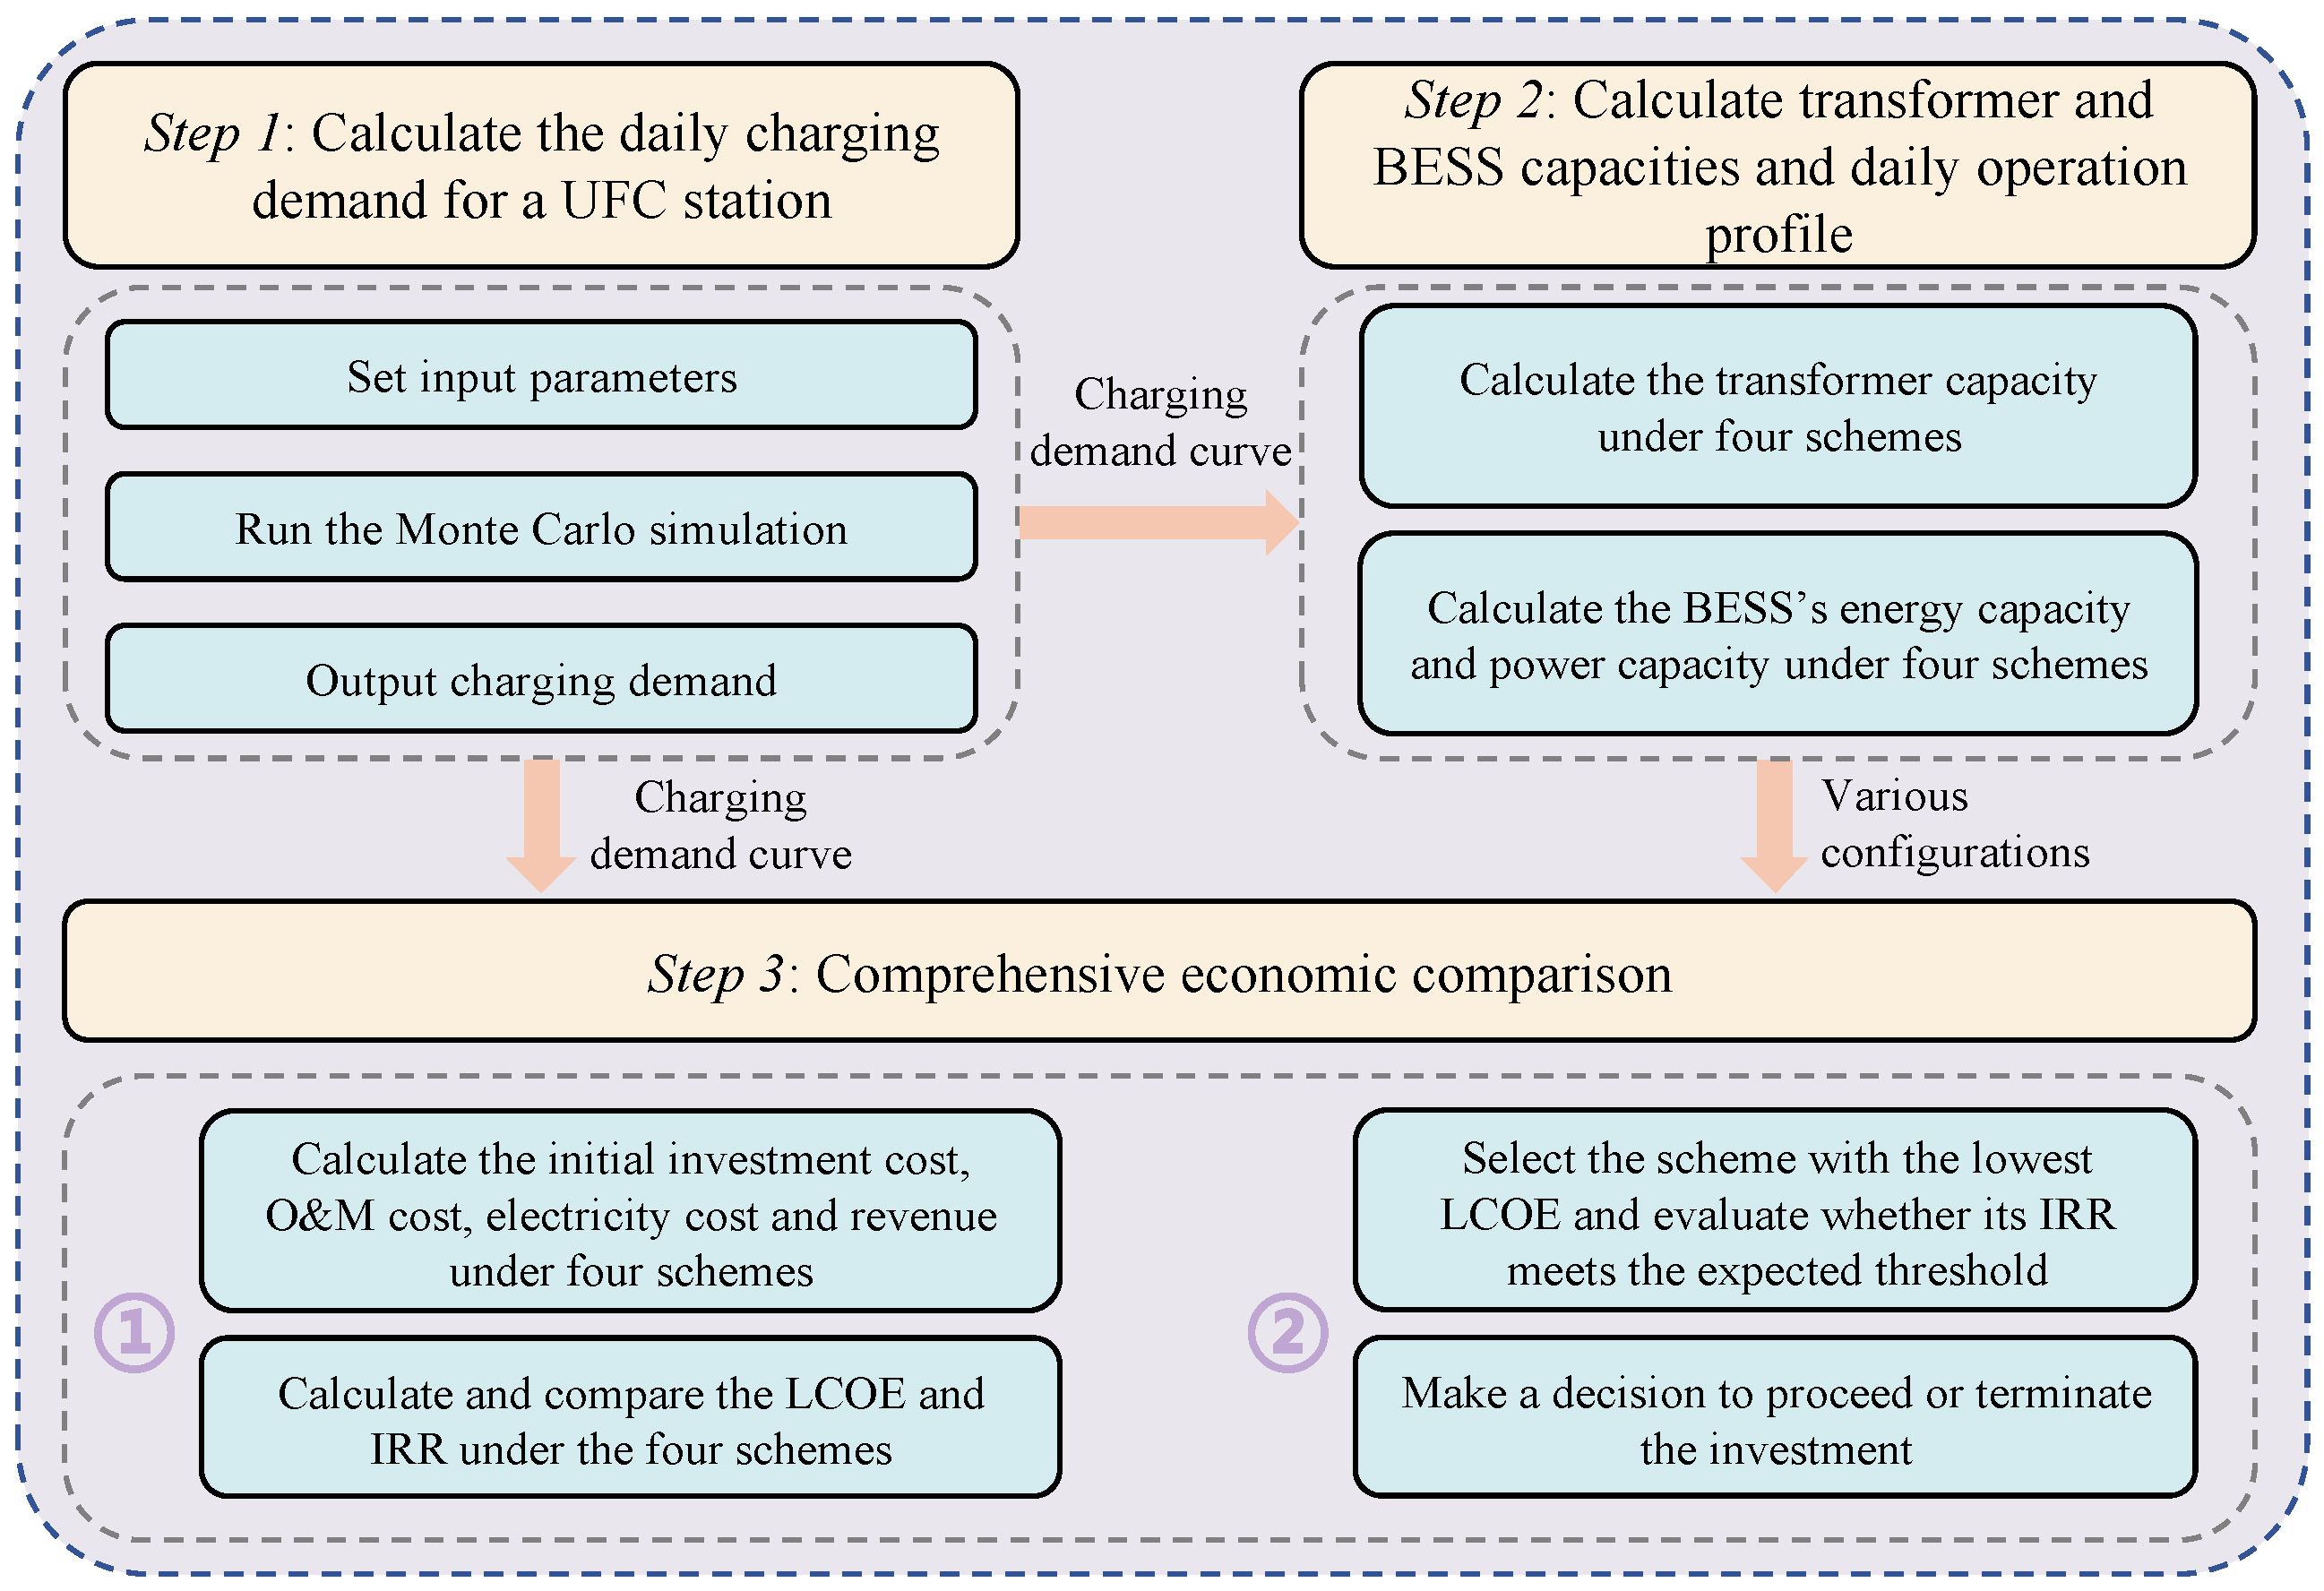
2.2. Generalized Comparison Framework for the Four Schemes
3. Configurations of the Transformer and BESS and Comprehensive Economic Evaluation
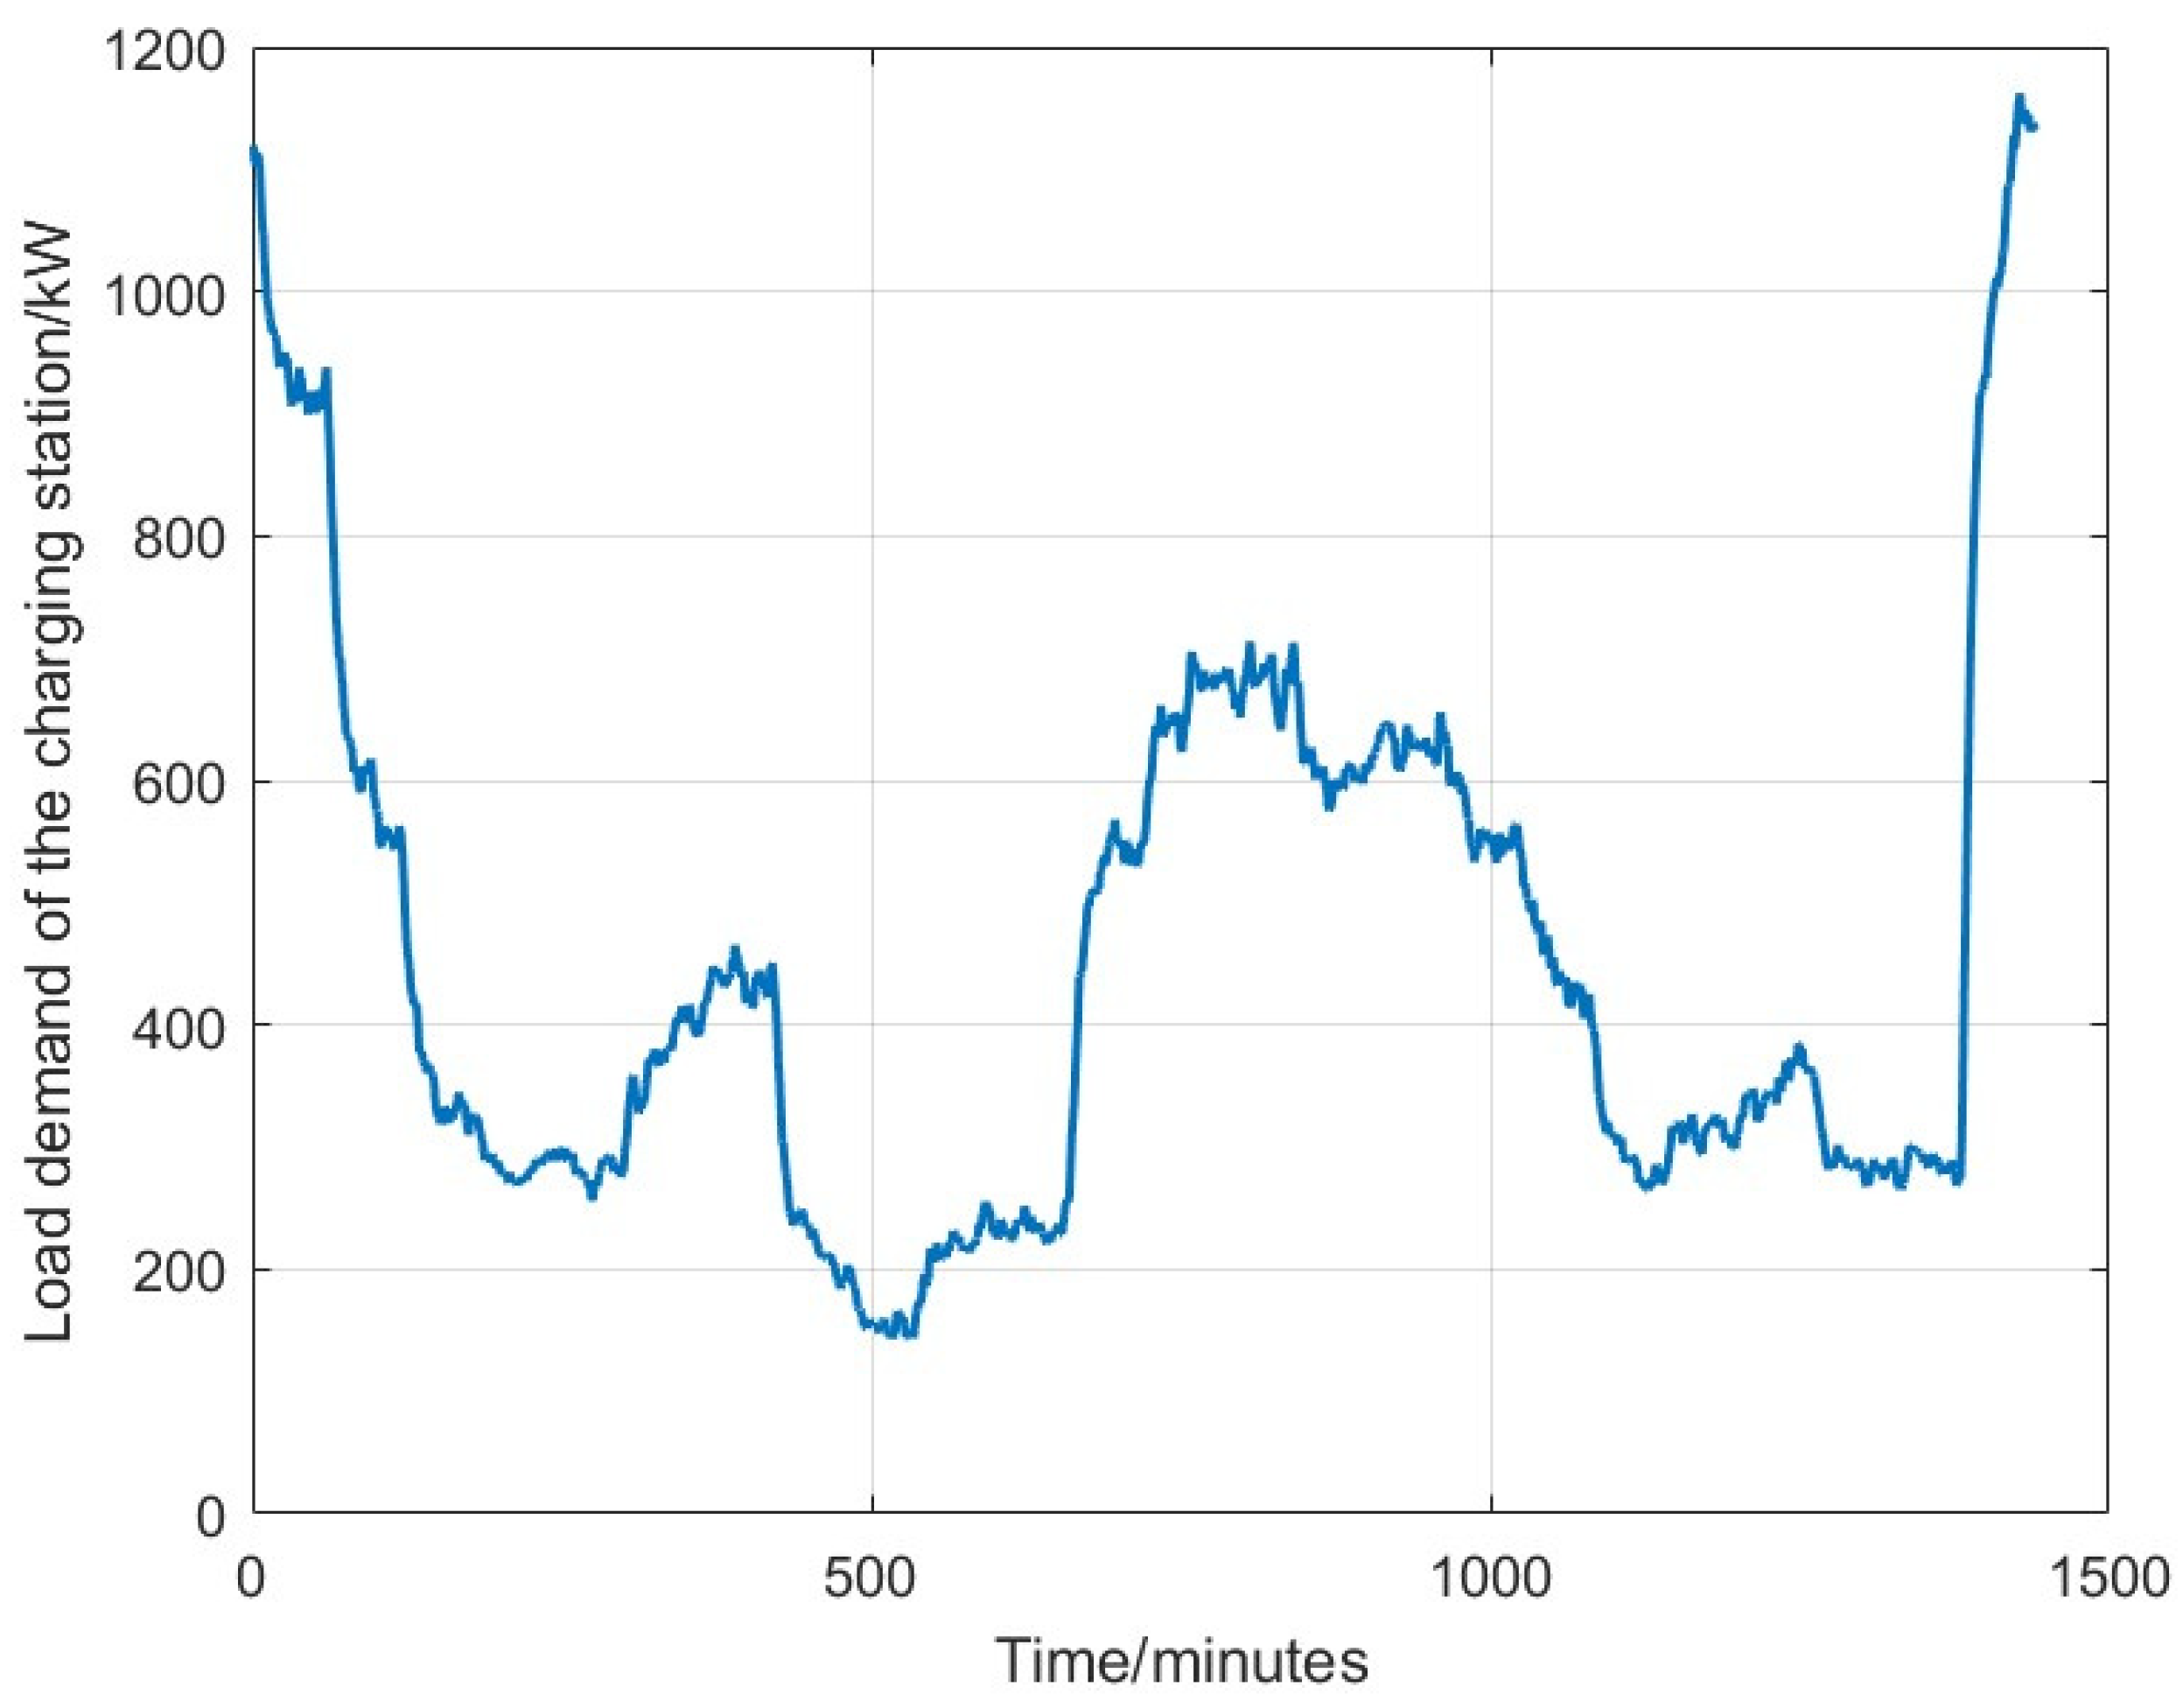
3.1. Typical Daily Charging Load Simulation of UFC Stations
3.2. Transformer and BESS Capacity Configurations and Typical Daily Operating Profile
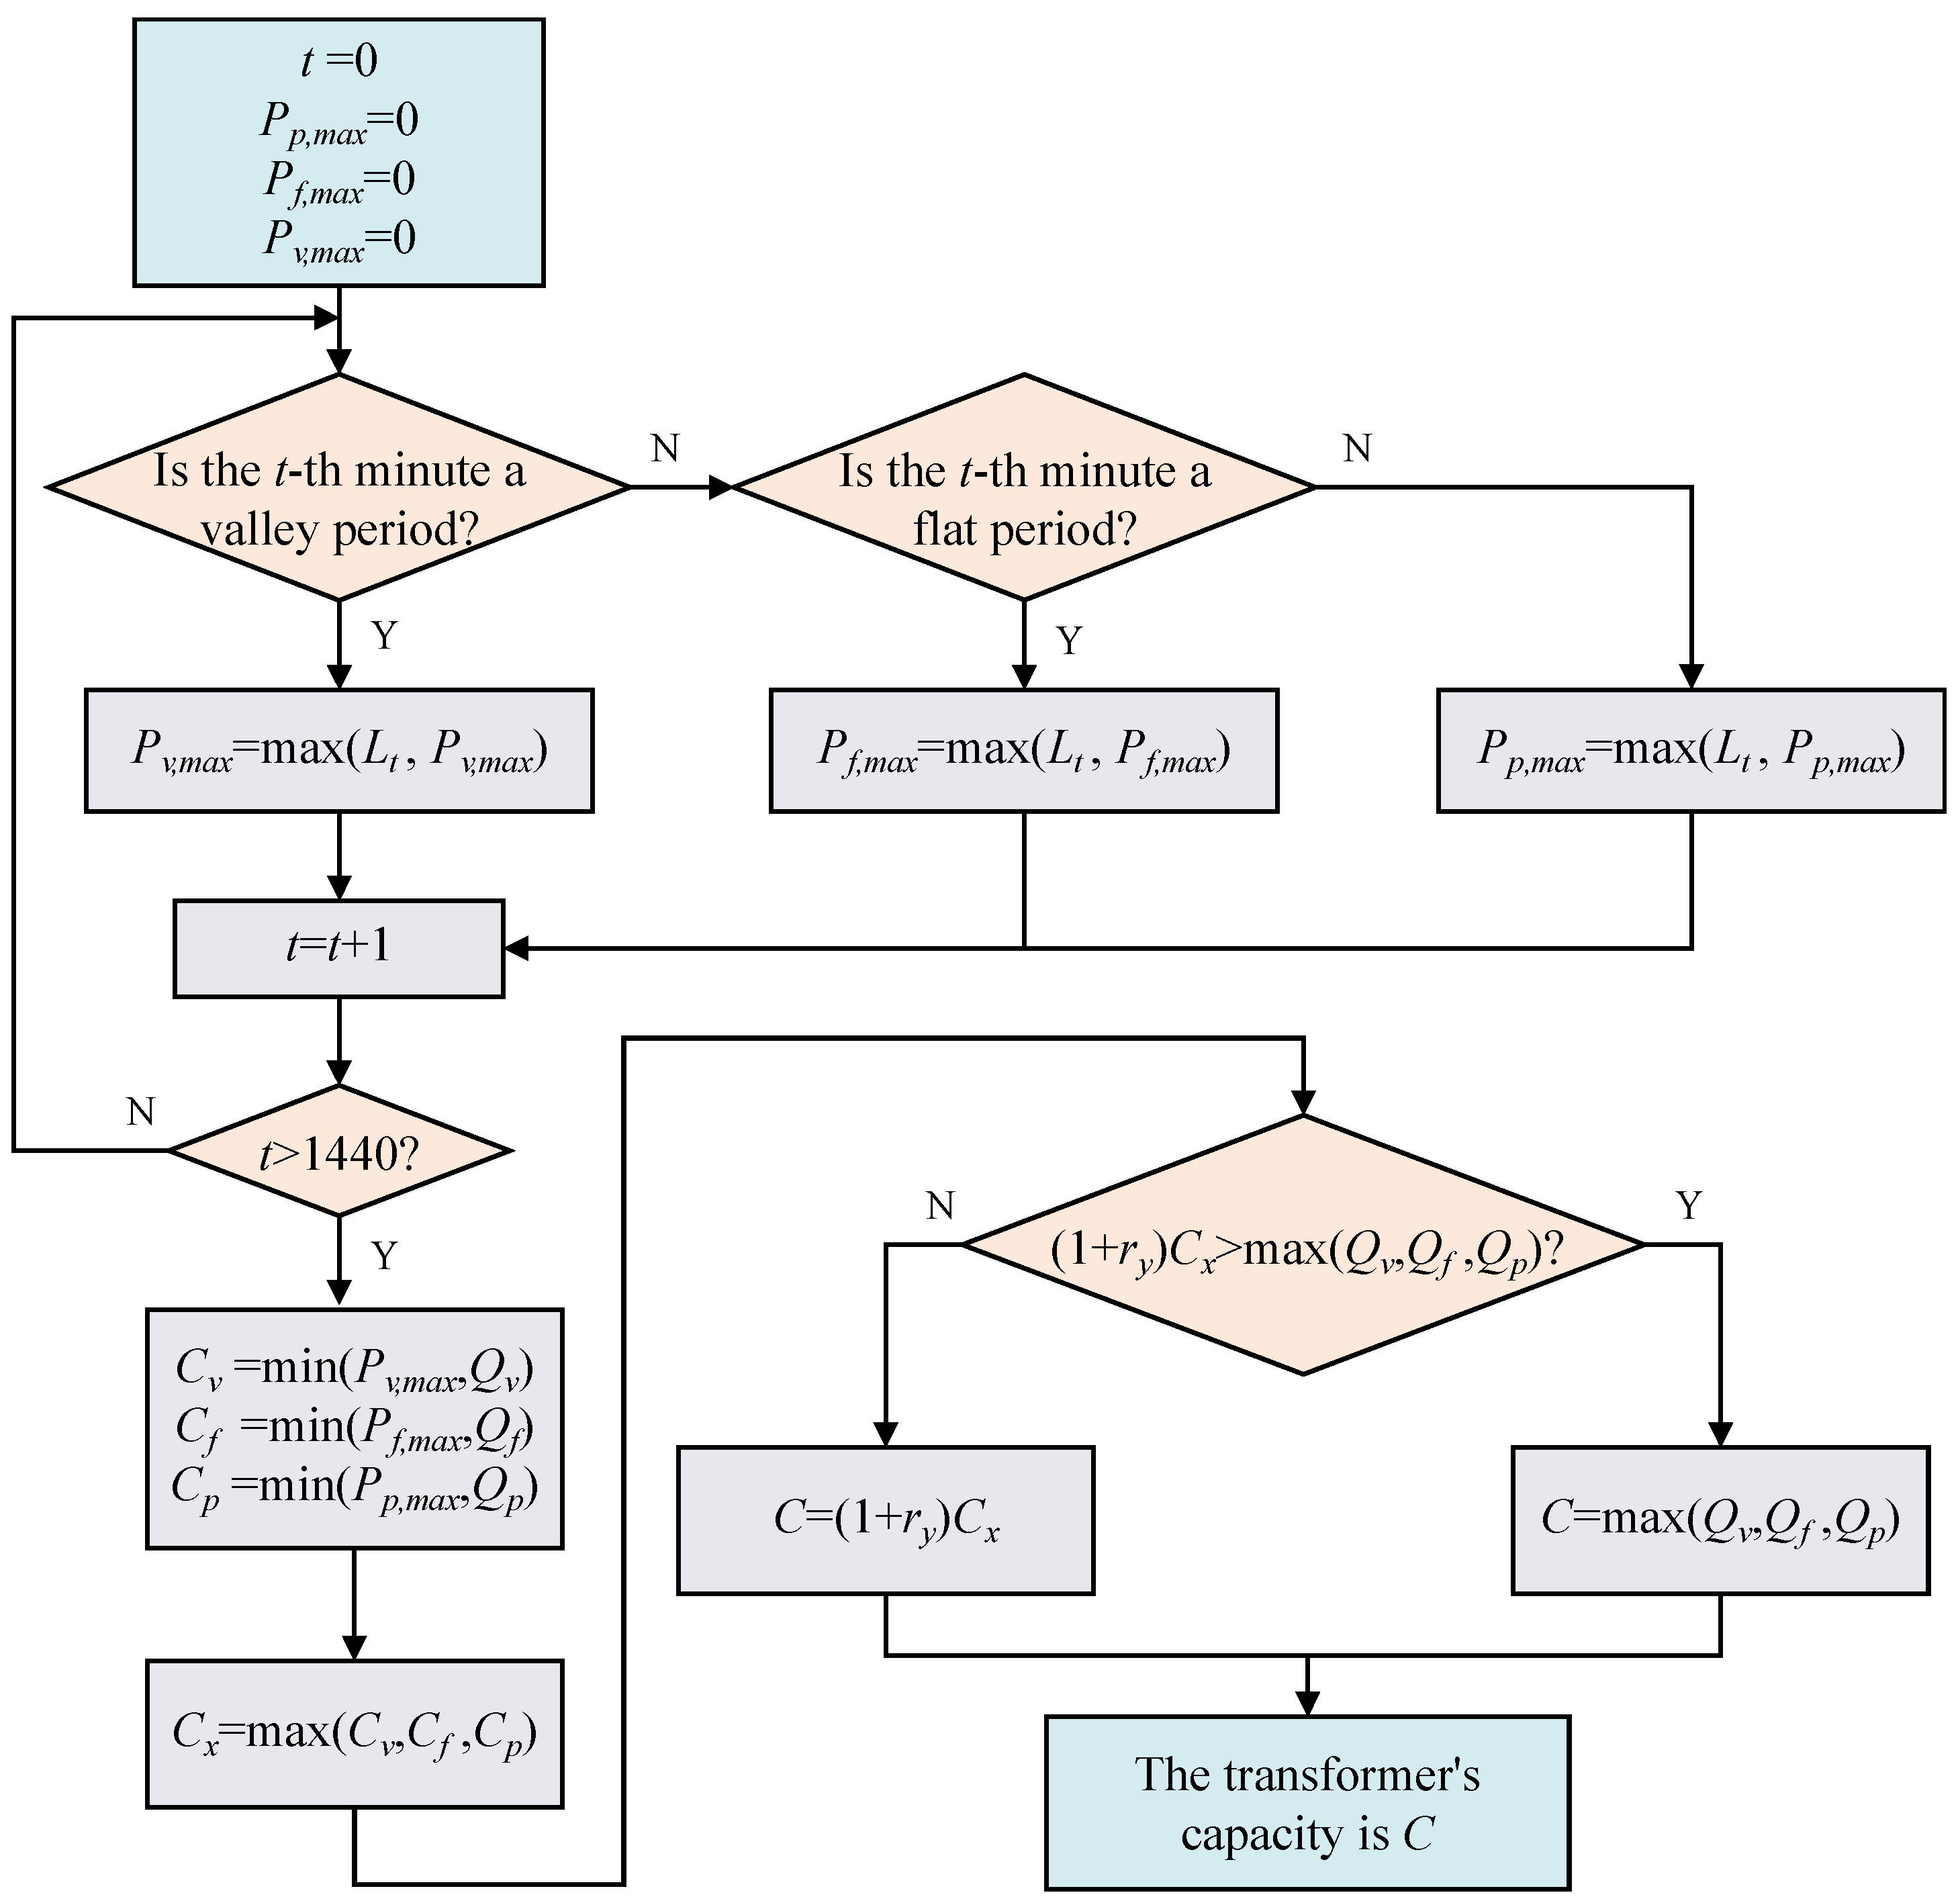
3.2.1. Transformer Capacity Configuration and Typical Daily Operating Profile
- PLM-Smin scheme and PLM-Smax scheme
- 2.
- ALM-Smin scheme and ALM-Smax scheme
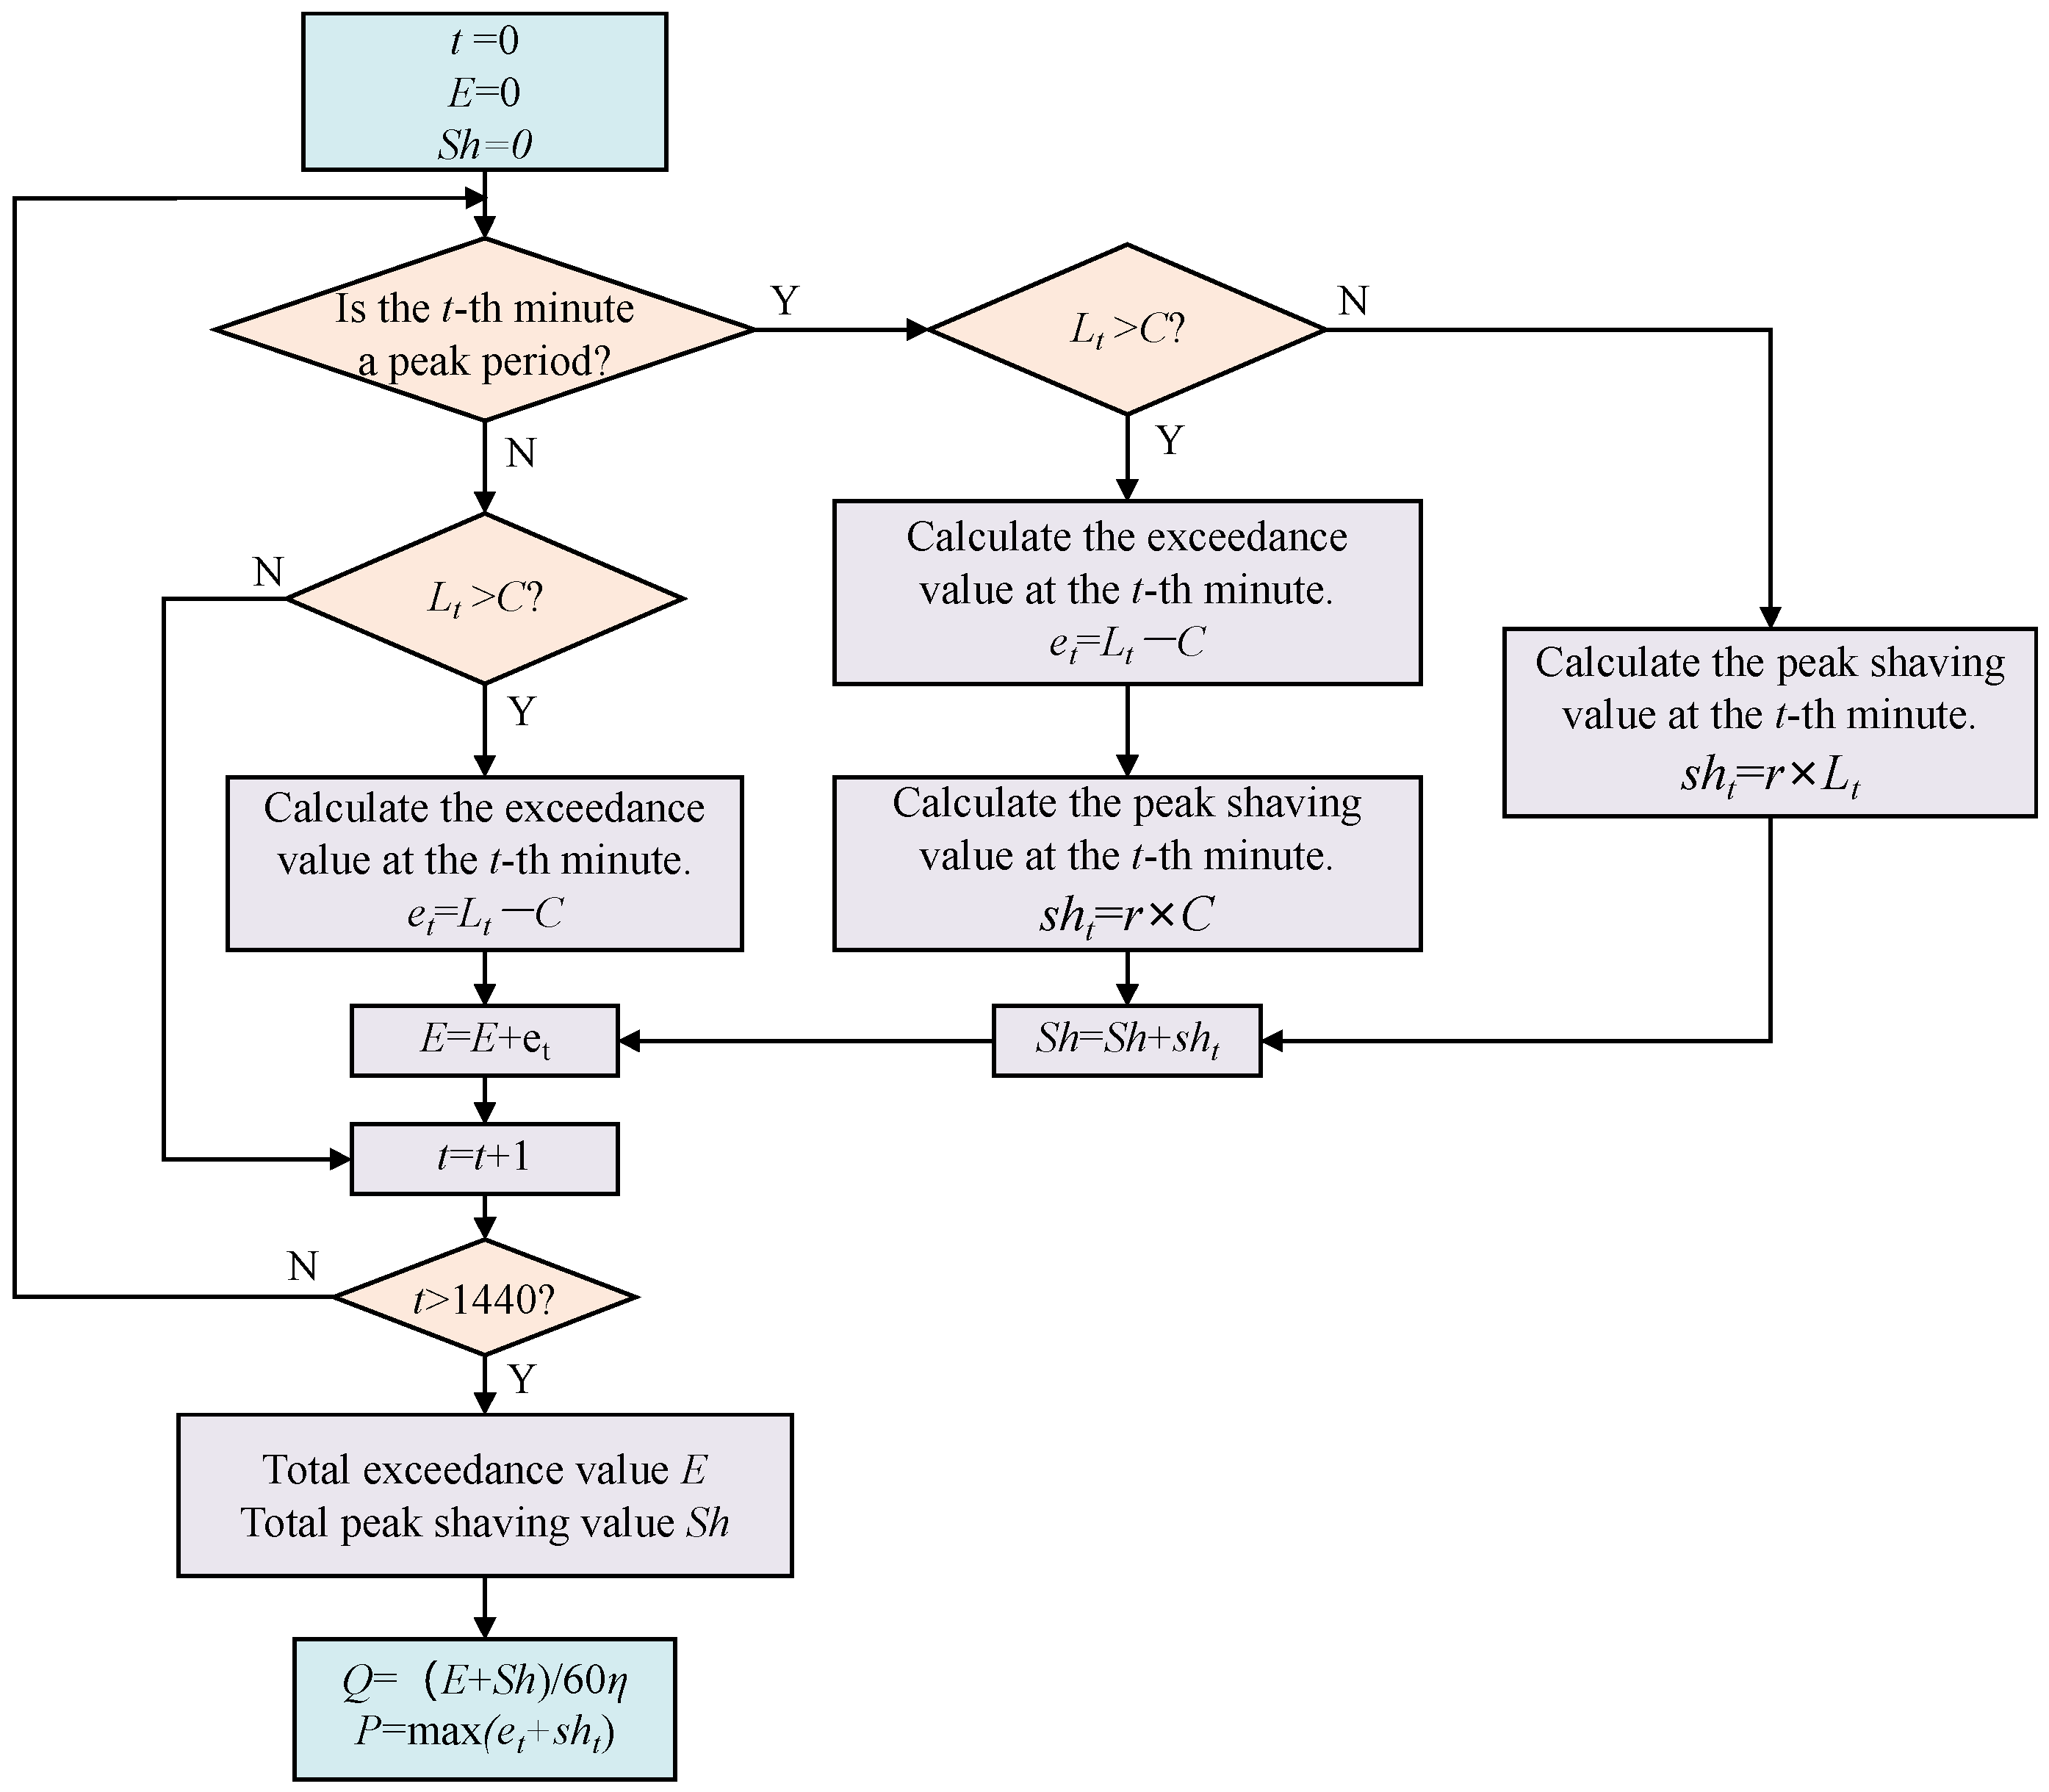
3.2.2. BESS Capacity Configuration and Typical Daily Operating Profile
- PLM-Smin scheme and PLM-Smax scheme
- In the PLM-Smin scheme, r = 0;
- In the PLM-Smax scheme, the peak-shaving ratio r is determined by back-calculating the reducible peak load proportion based on the maximum available energy storage charging capacity during valley periods, which defines the corresponding peak-shaving ratio.
- 2.
- ALM-Smin scheme and ALM-Smax scheme
- In the ALM-Smin scheme, r = 0;
- In the ALM-Smax scheme, r = 1.
3.3. Comprehensive Economic Selection Methodology
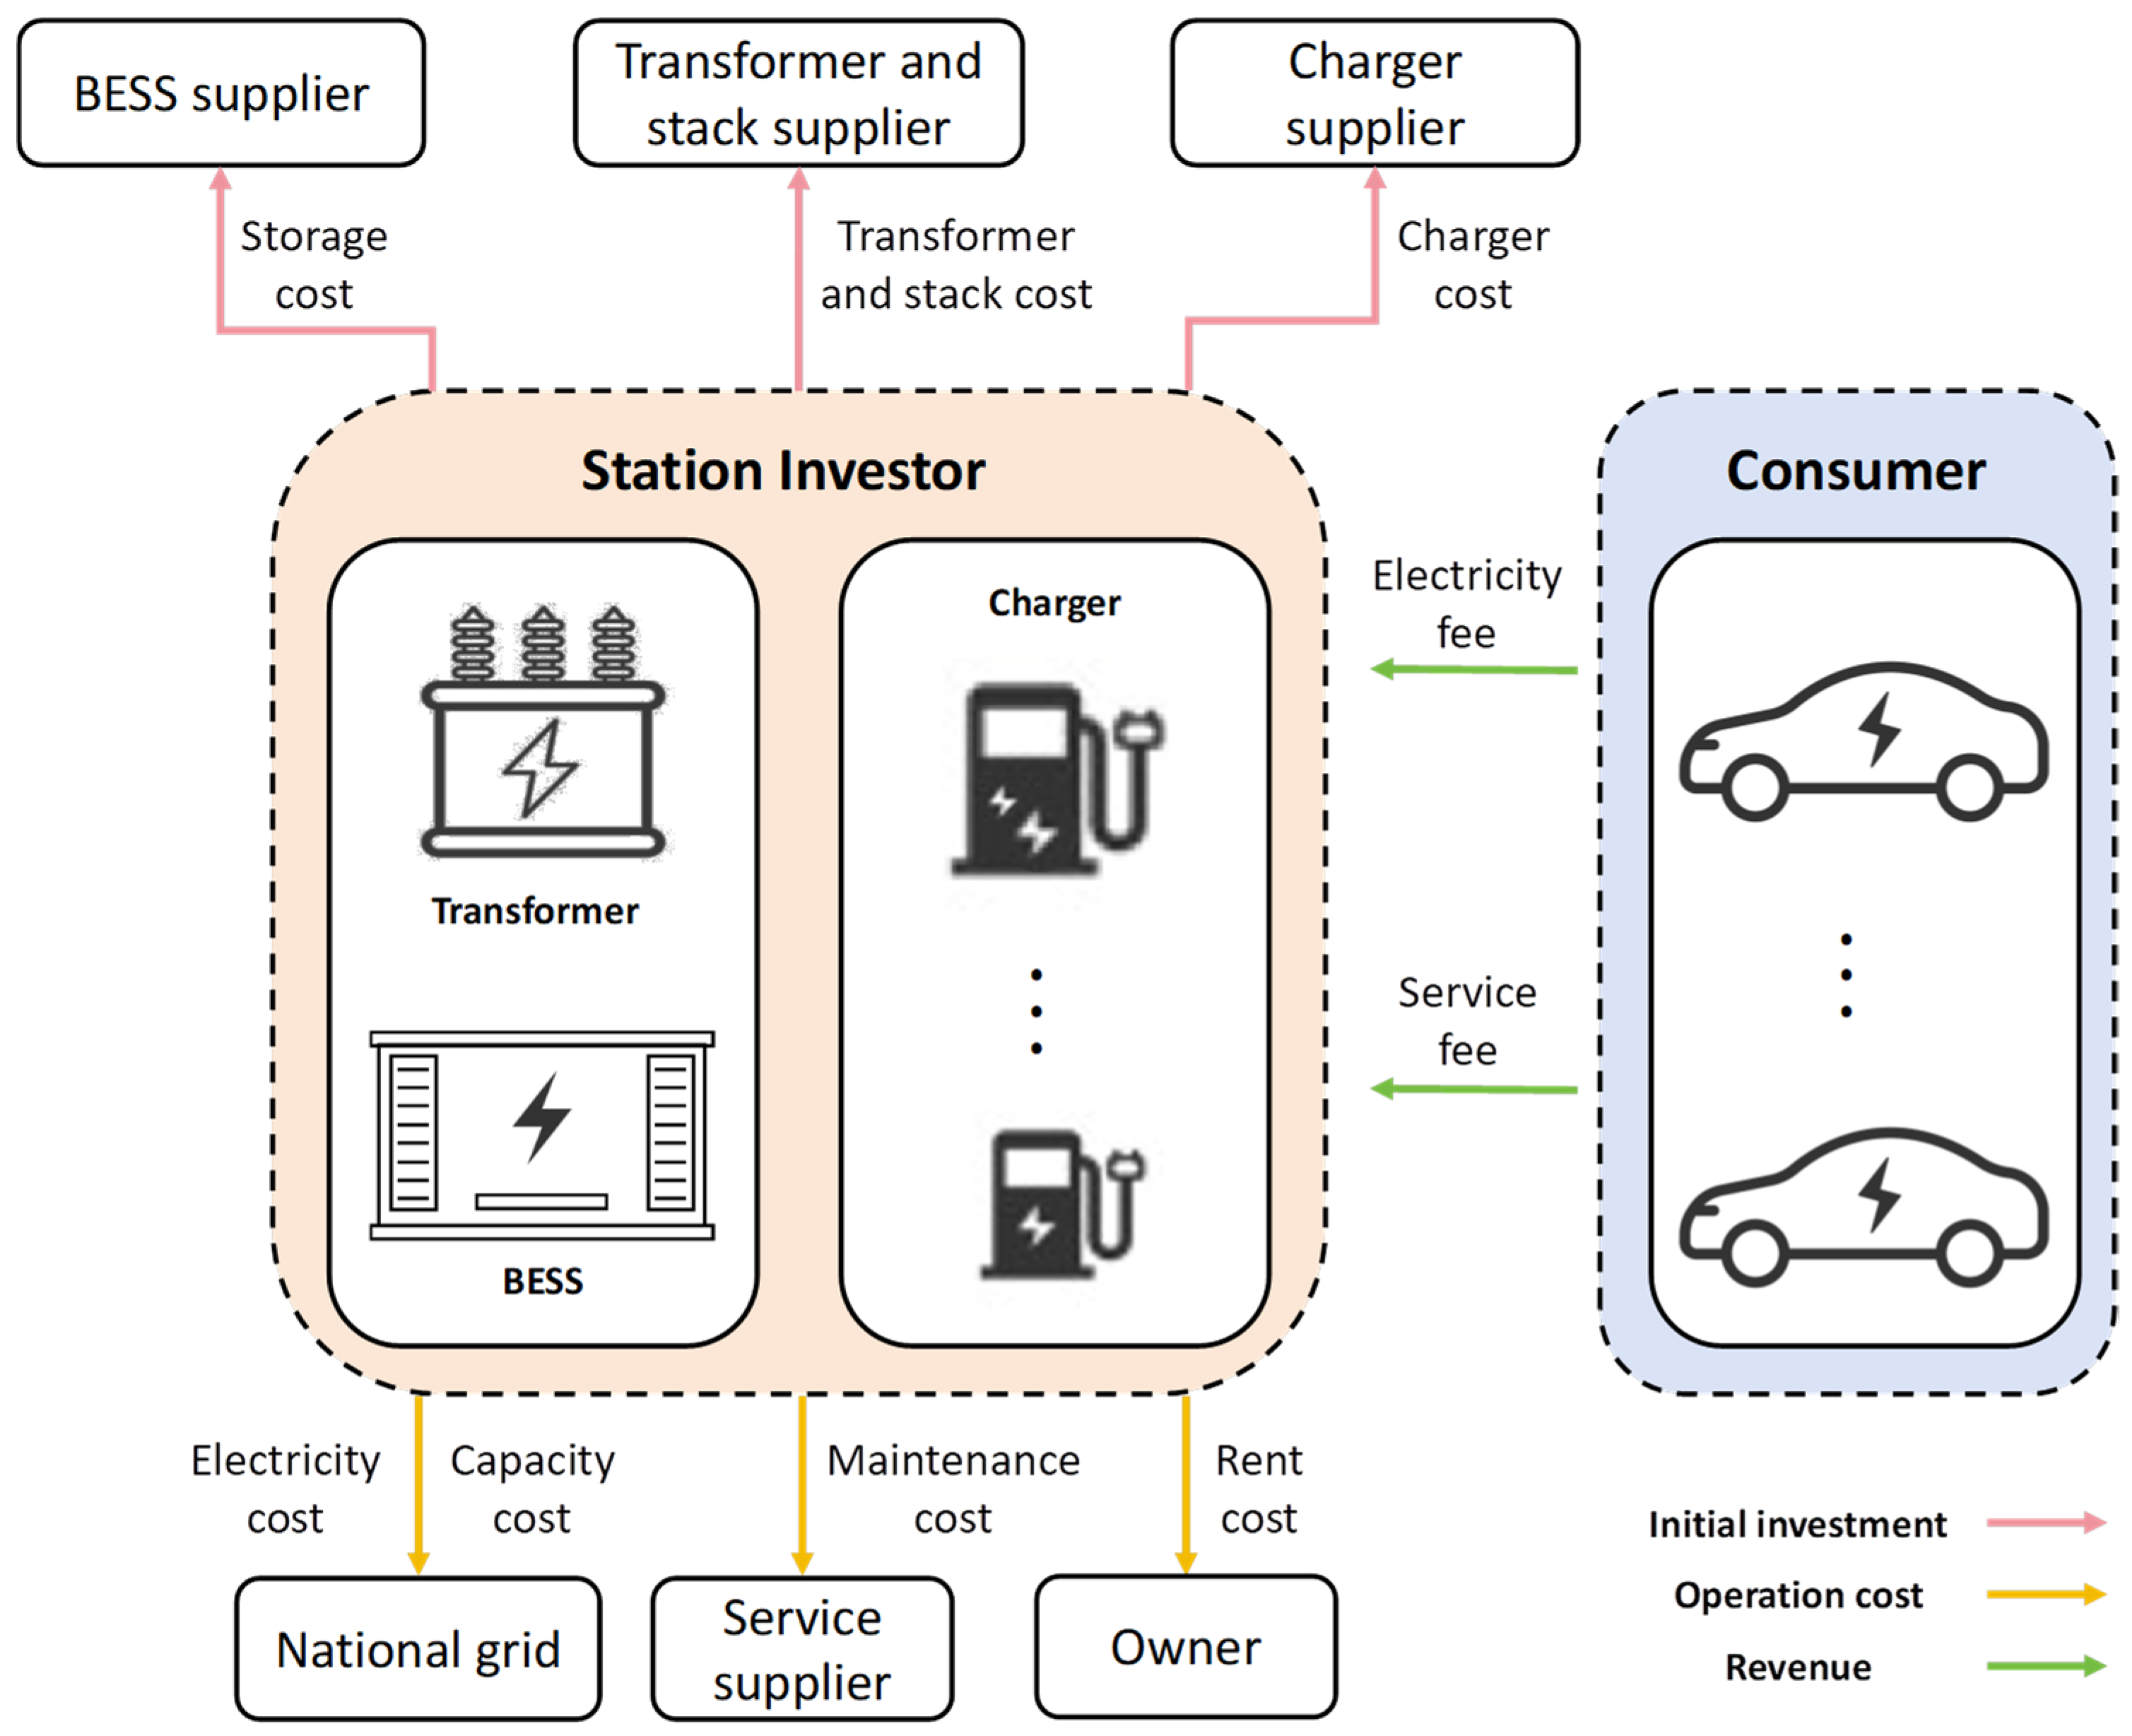
3.3.1. Cost–Benefit Components of the Four Schemes
- Initial Investment Cost
- 2.
- Annual O&M costs and rental expenses
- 3.
- Electricity costs
- Station revenue
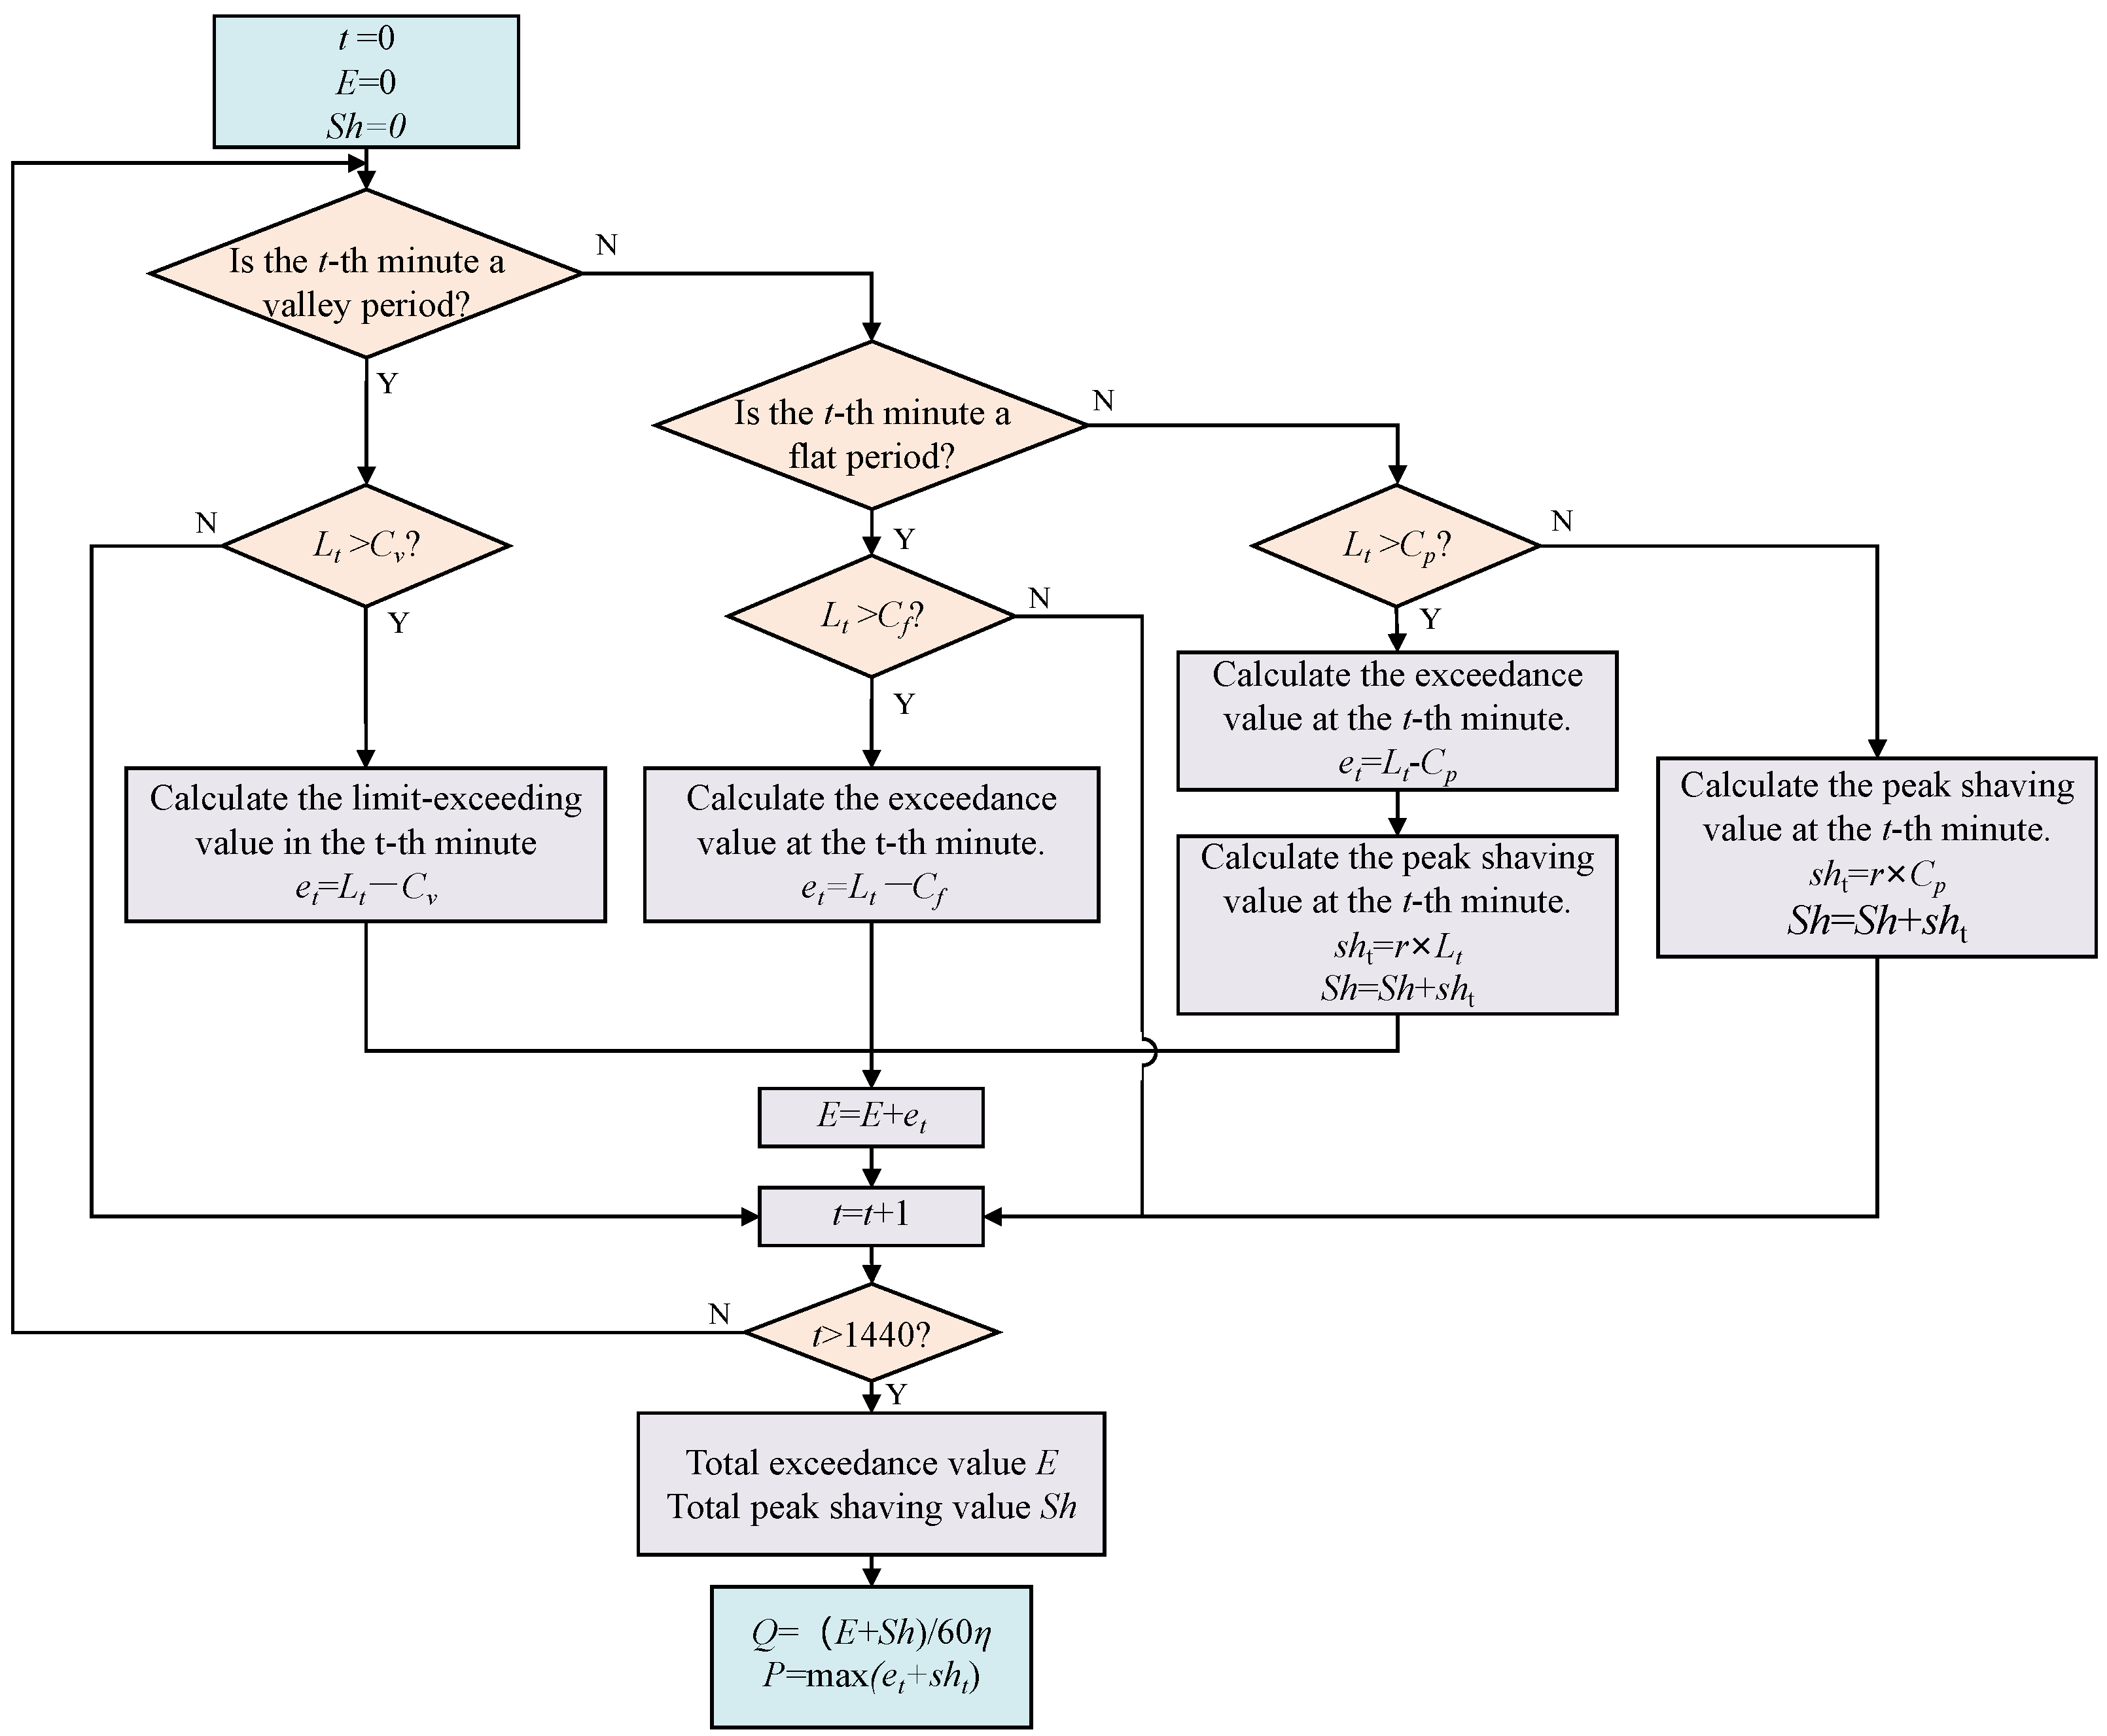
3.3.2. Economic Evaluation Process Based on LCOE and IRR
LCOE Calculation Model
IRR Calculation Model
Comprehensive Comparison and Selection Process
4. Case Study Analysis
4.1. Case Design and Key Parameters
4.1.1. Vehicle Charging Load Parameters
4.1.2. Chargers’ Configuration Parameters
4.1.3. Grid-Connection Capacity and Time-of-Use Electricity Price Parameters
4.1.4. UFC Station Investment, O&M Costs, and Revenue Parameters
4.2. Configuration and Operation Simulation
4.2.1. Typical Daily Charging Load Demand Modeling
4.2.2. Configurations of the Four Schemes
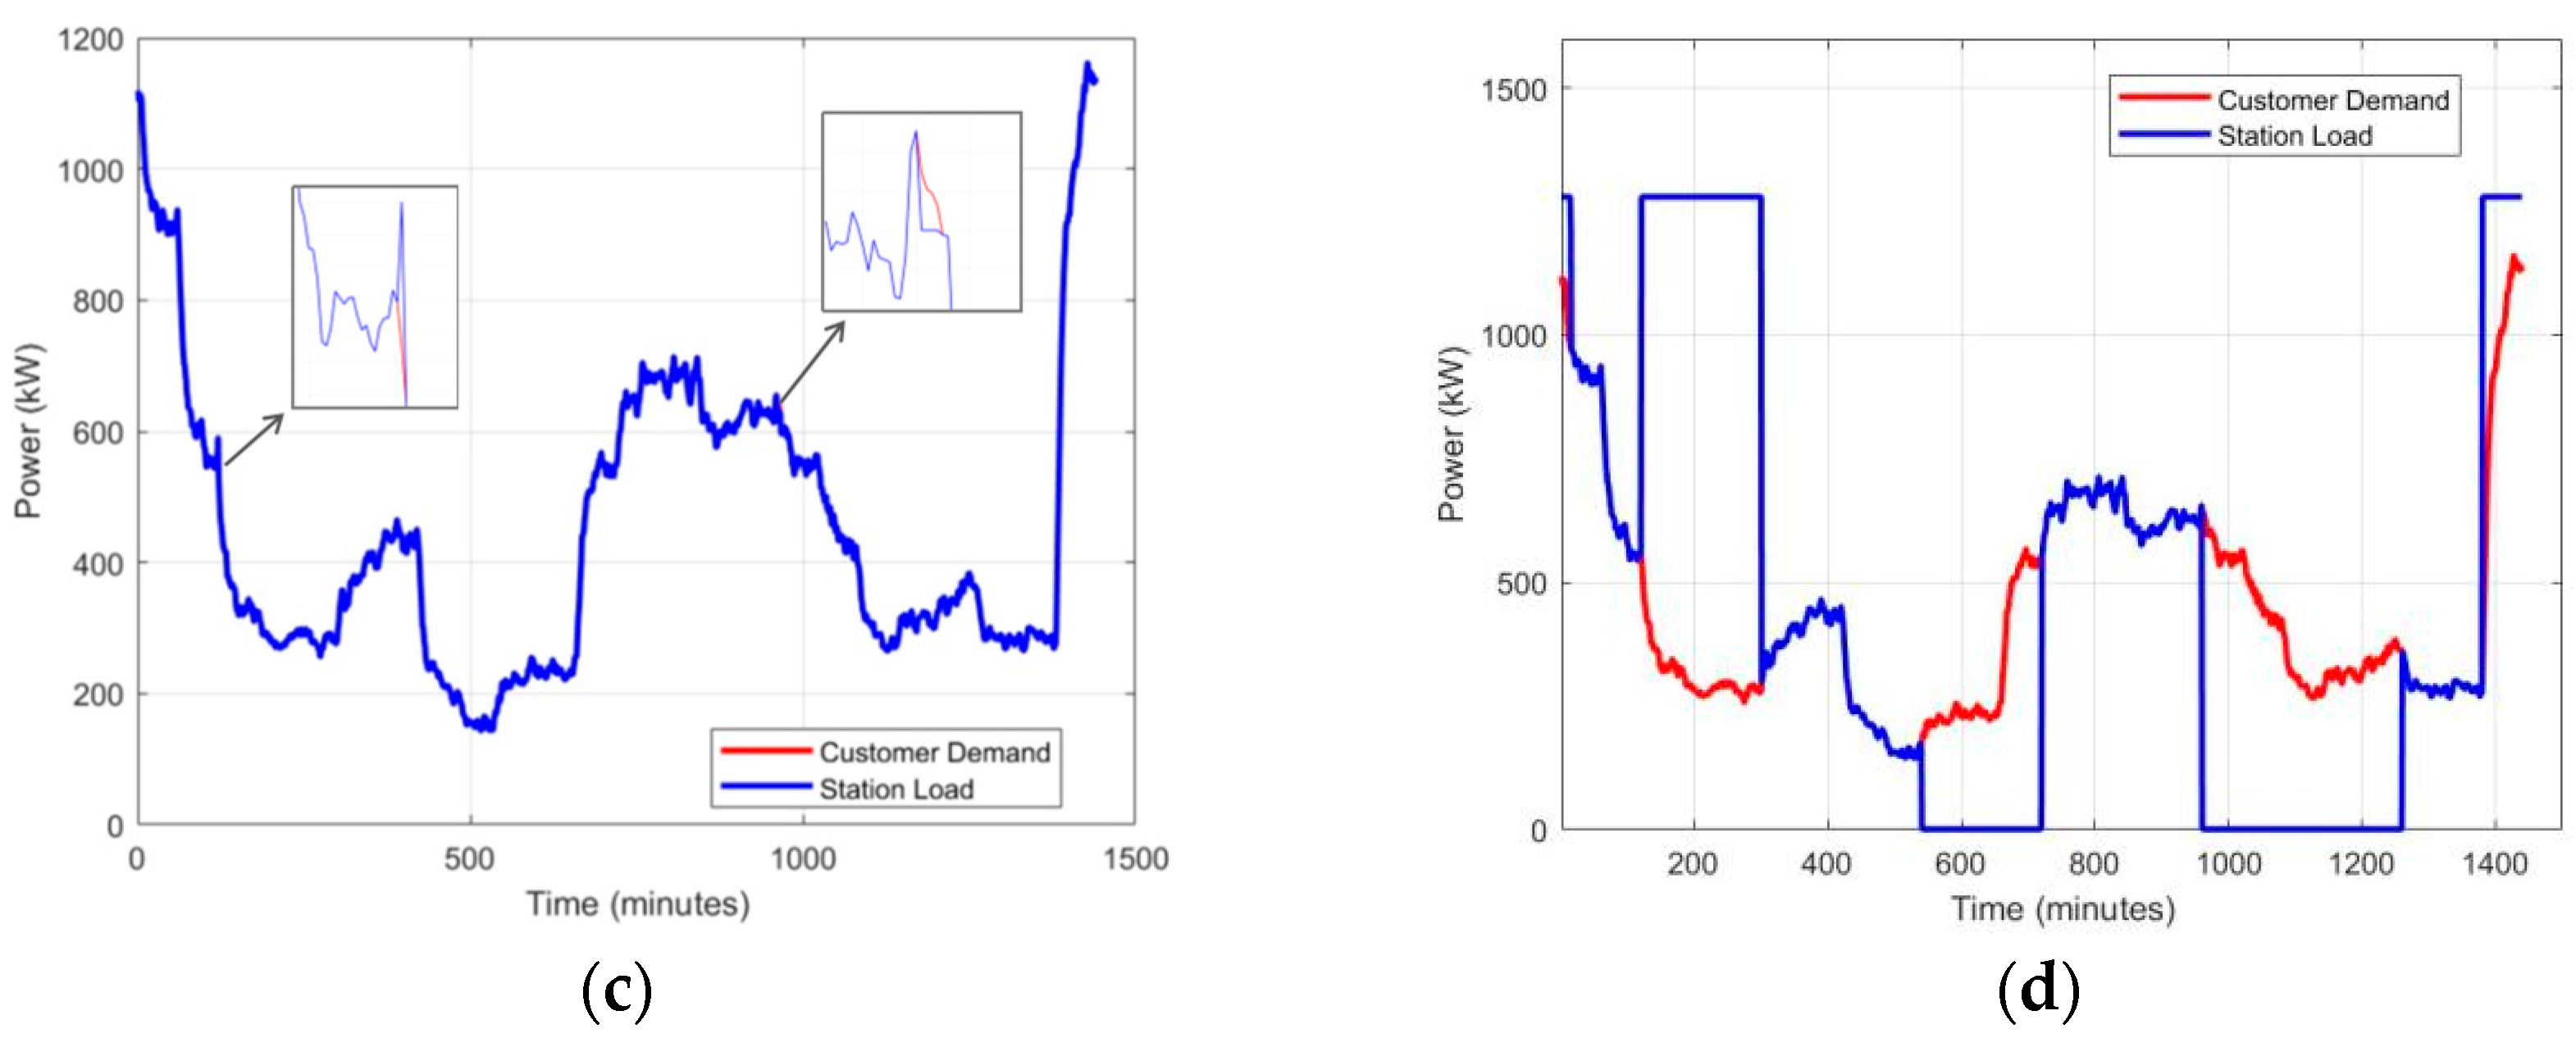
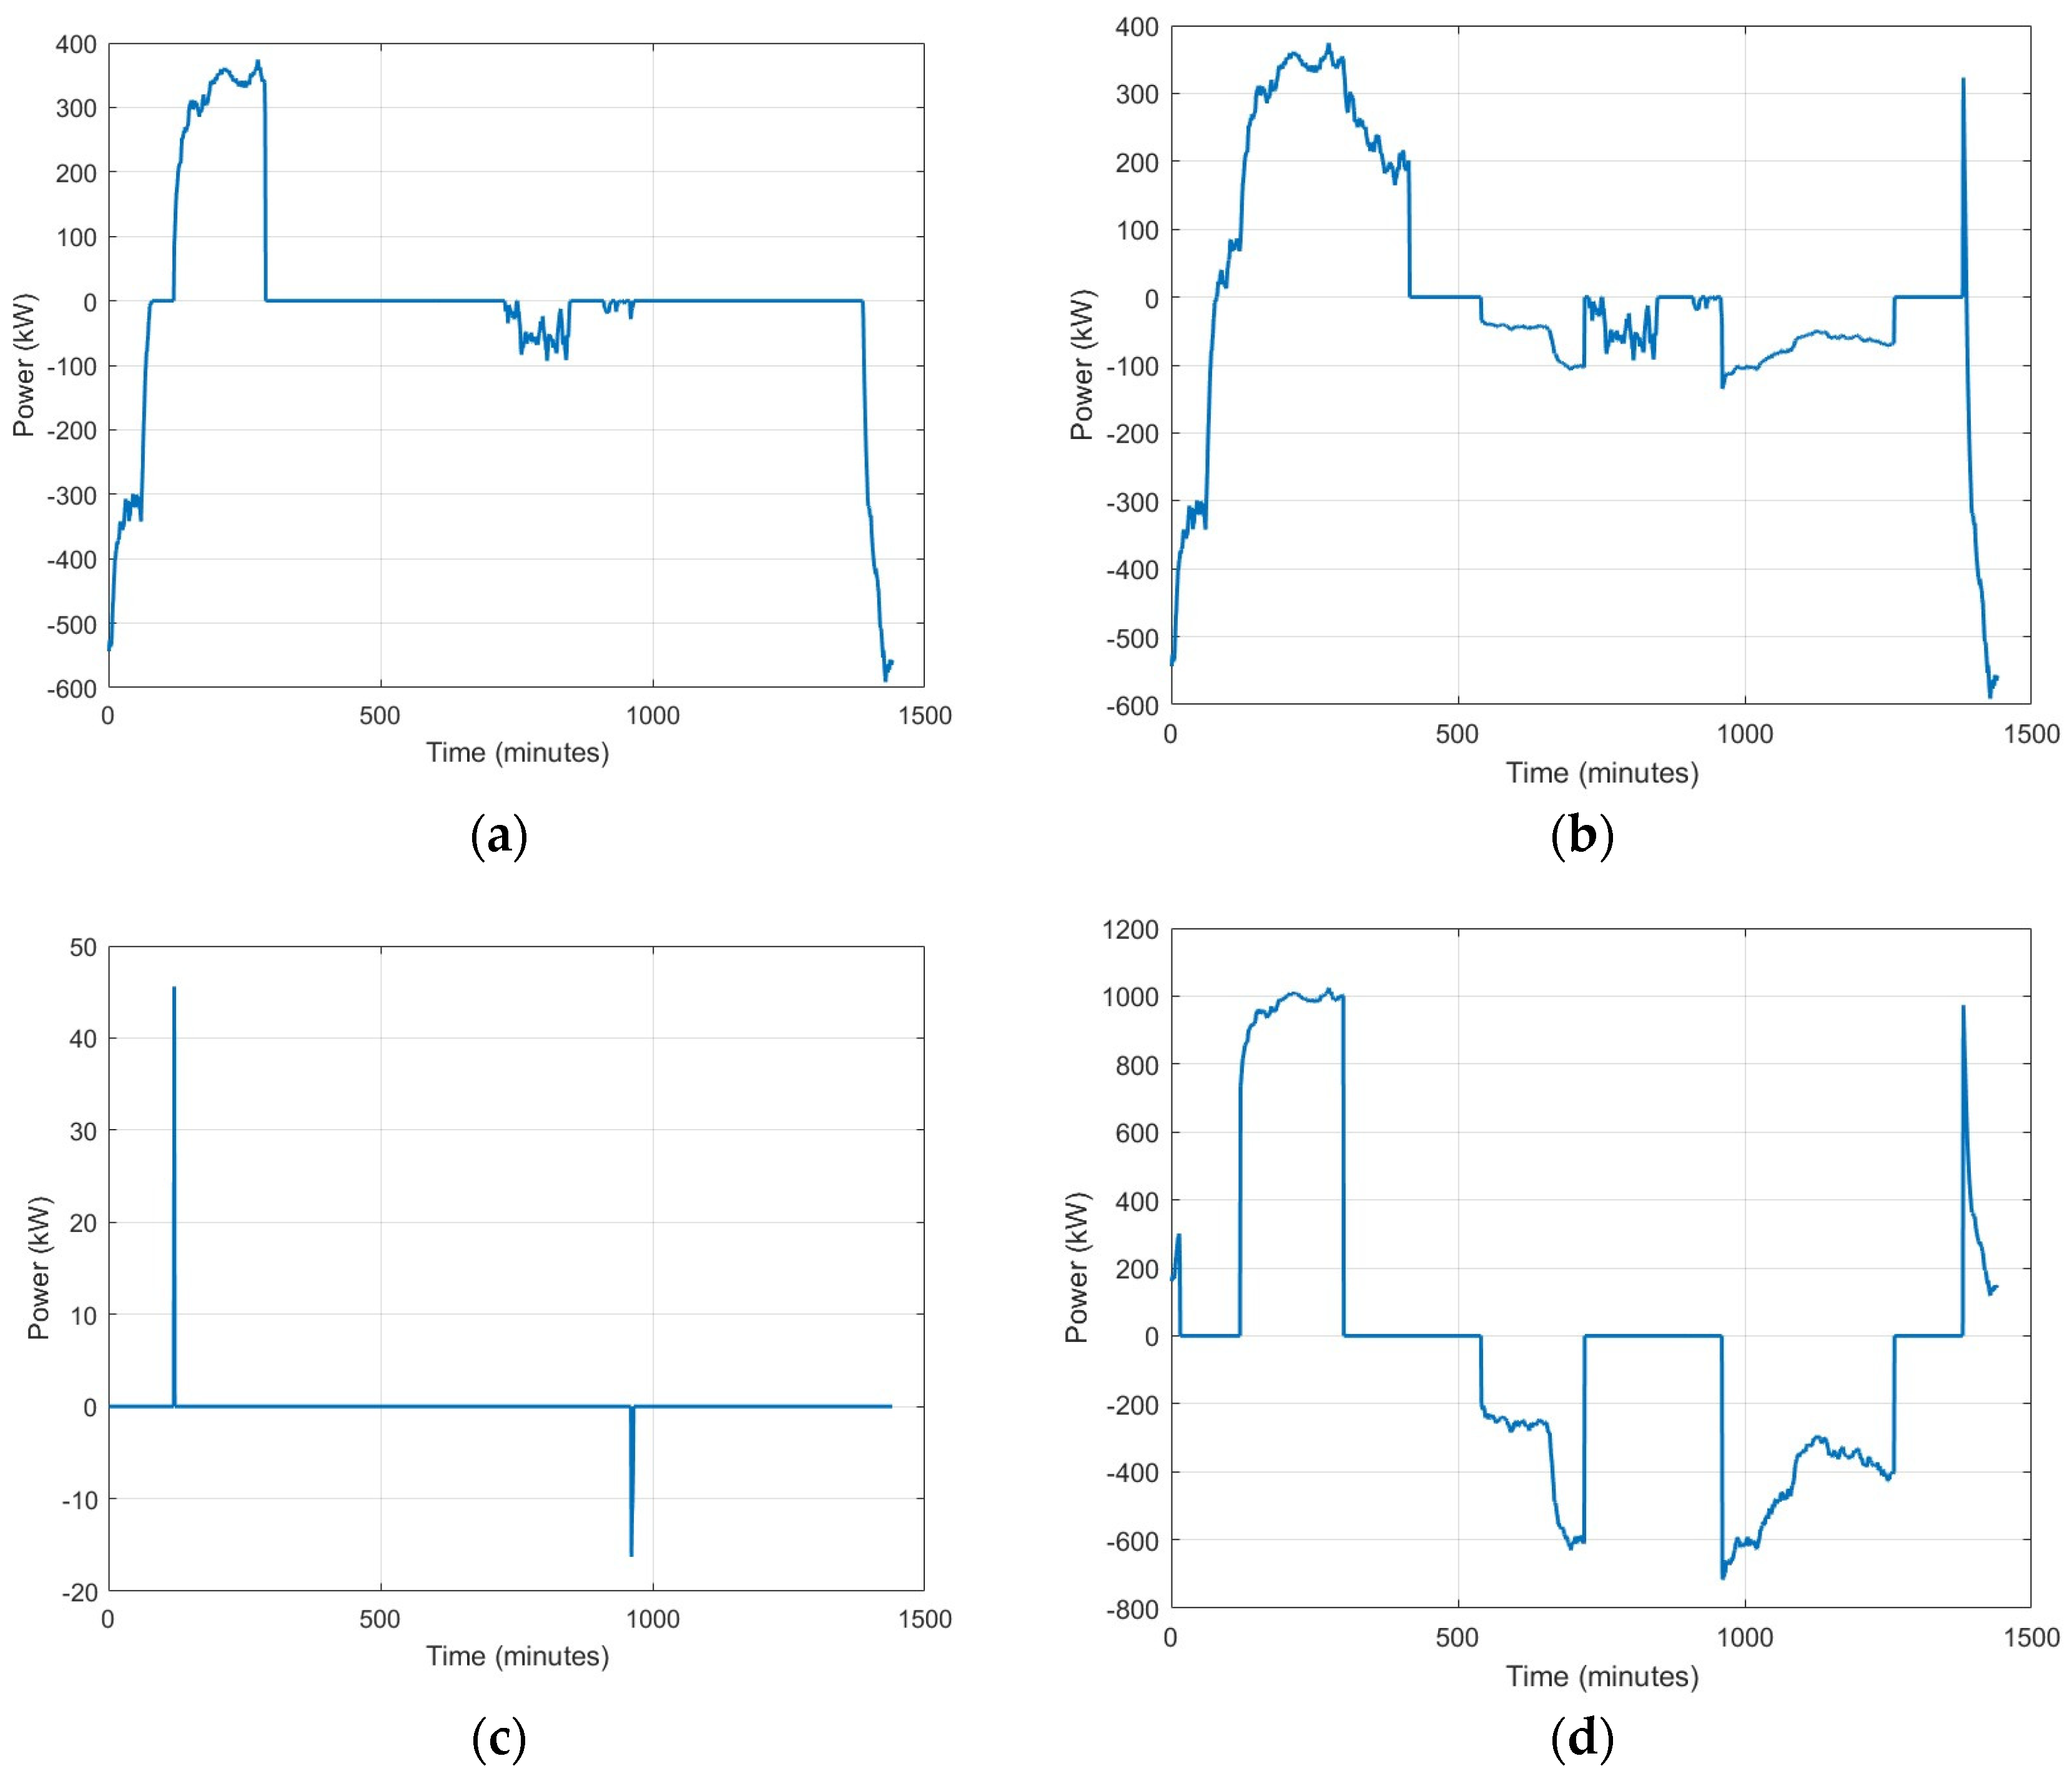
4.2.3. Simulation of Typical Daily Operating Profiles for Transformers and BESSs
4.3. Comprehensive Economic Comparison
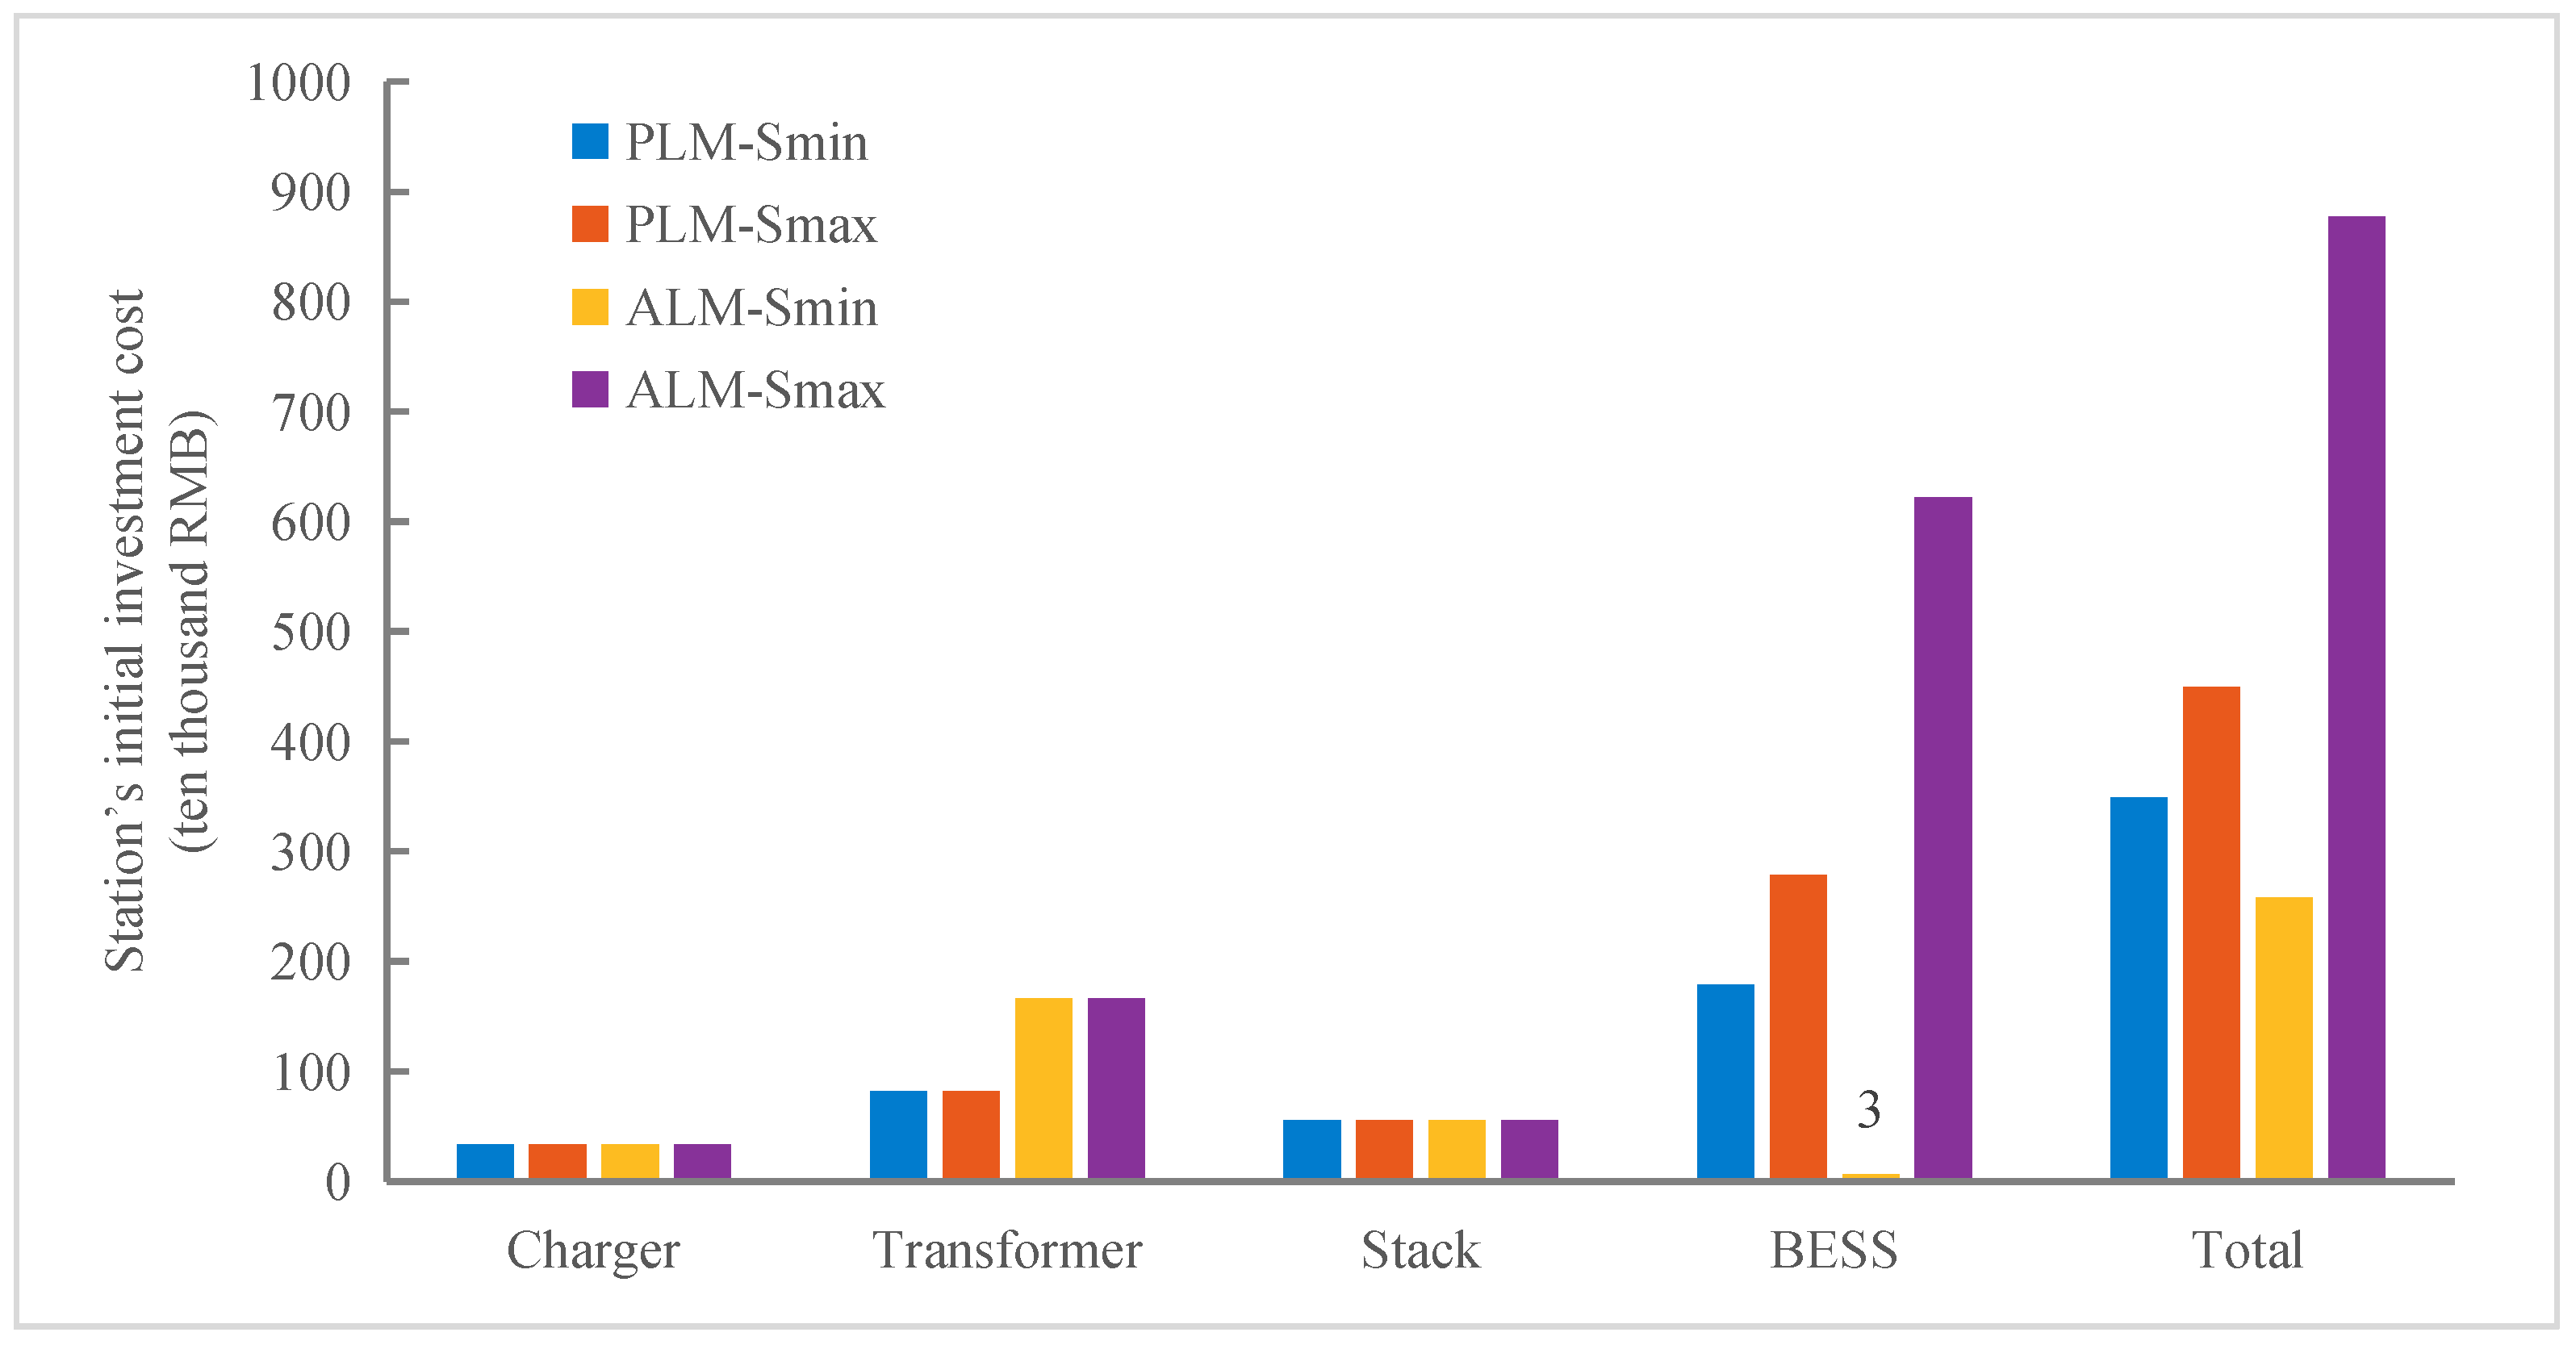
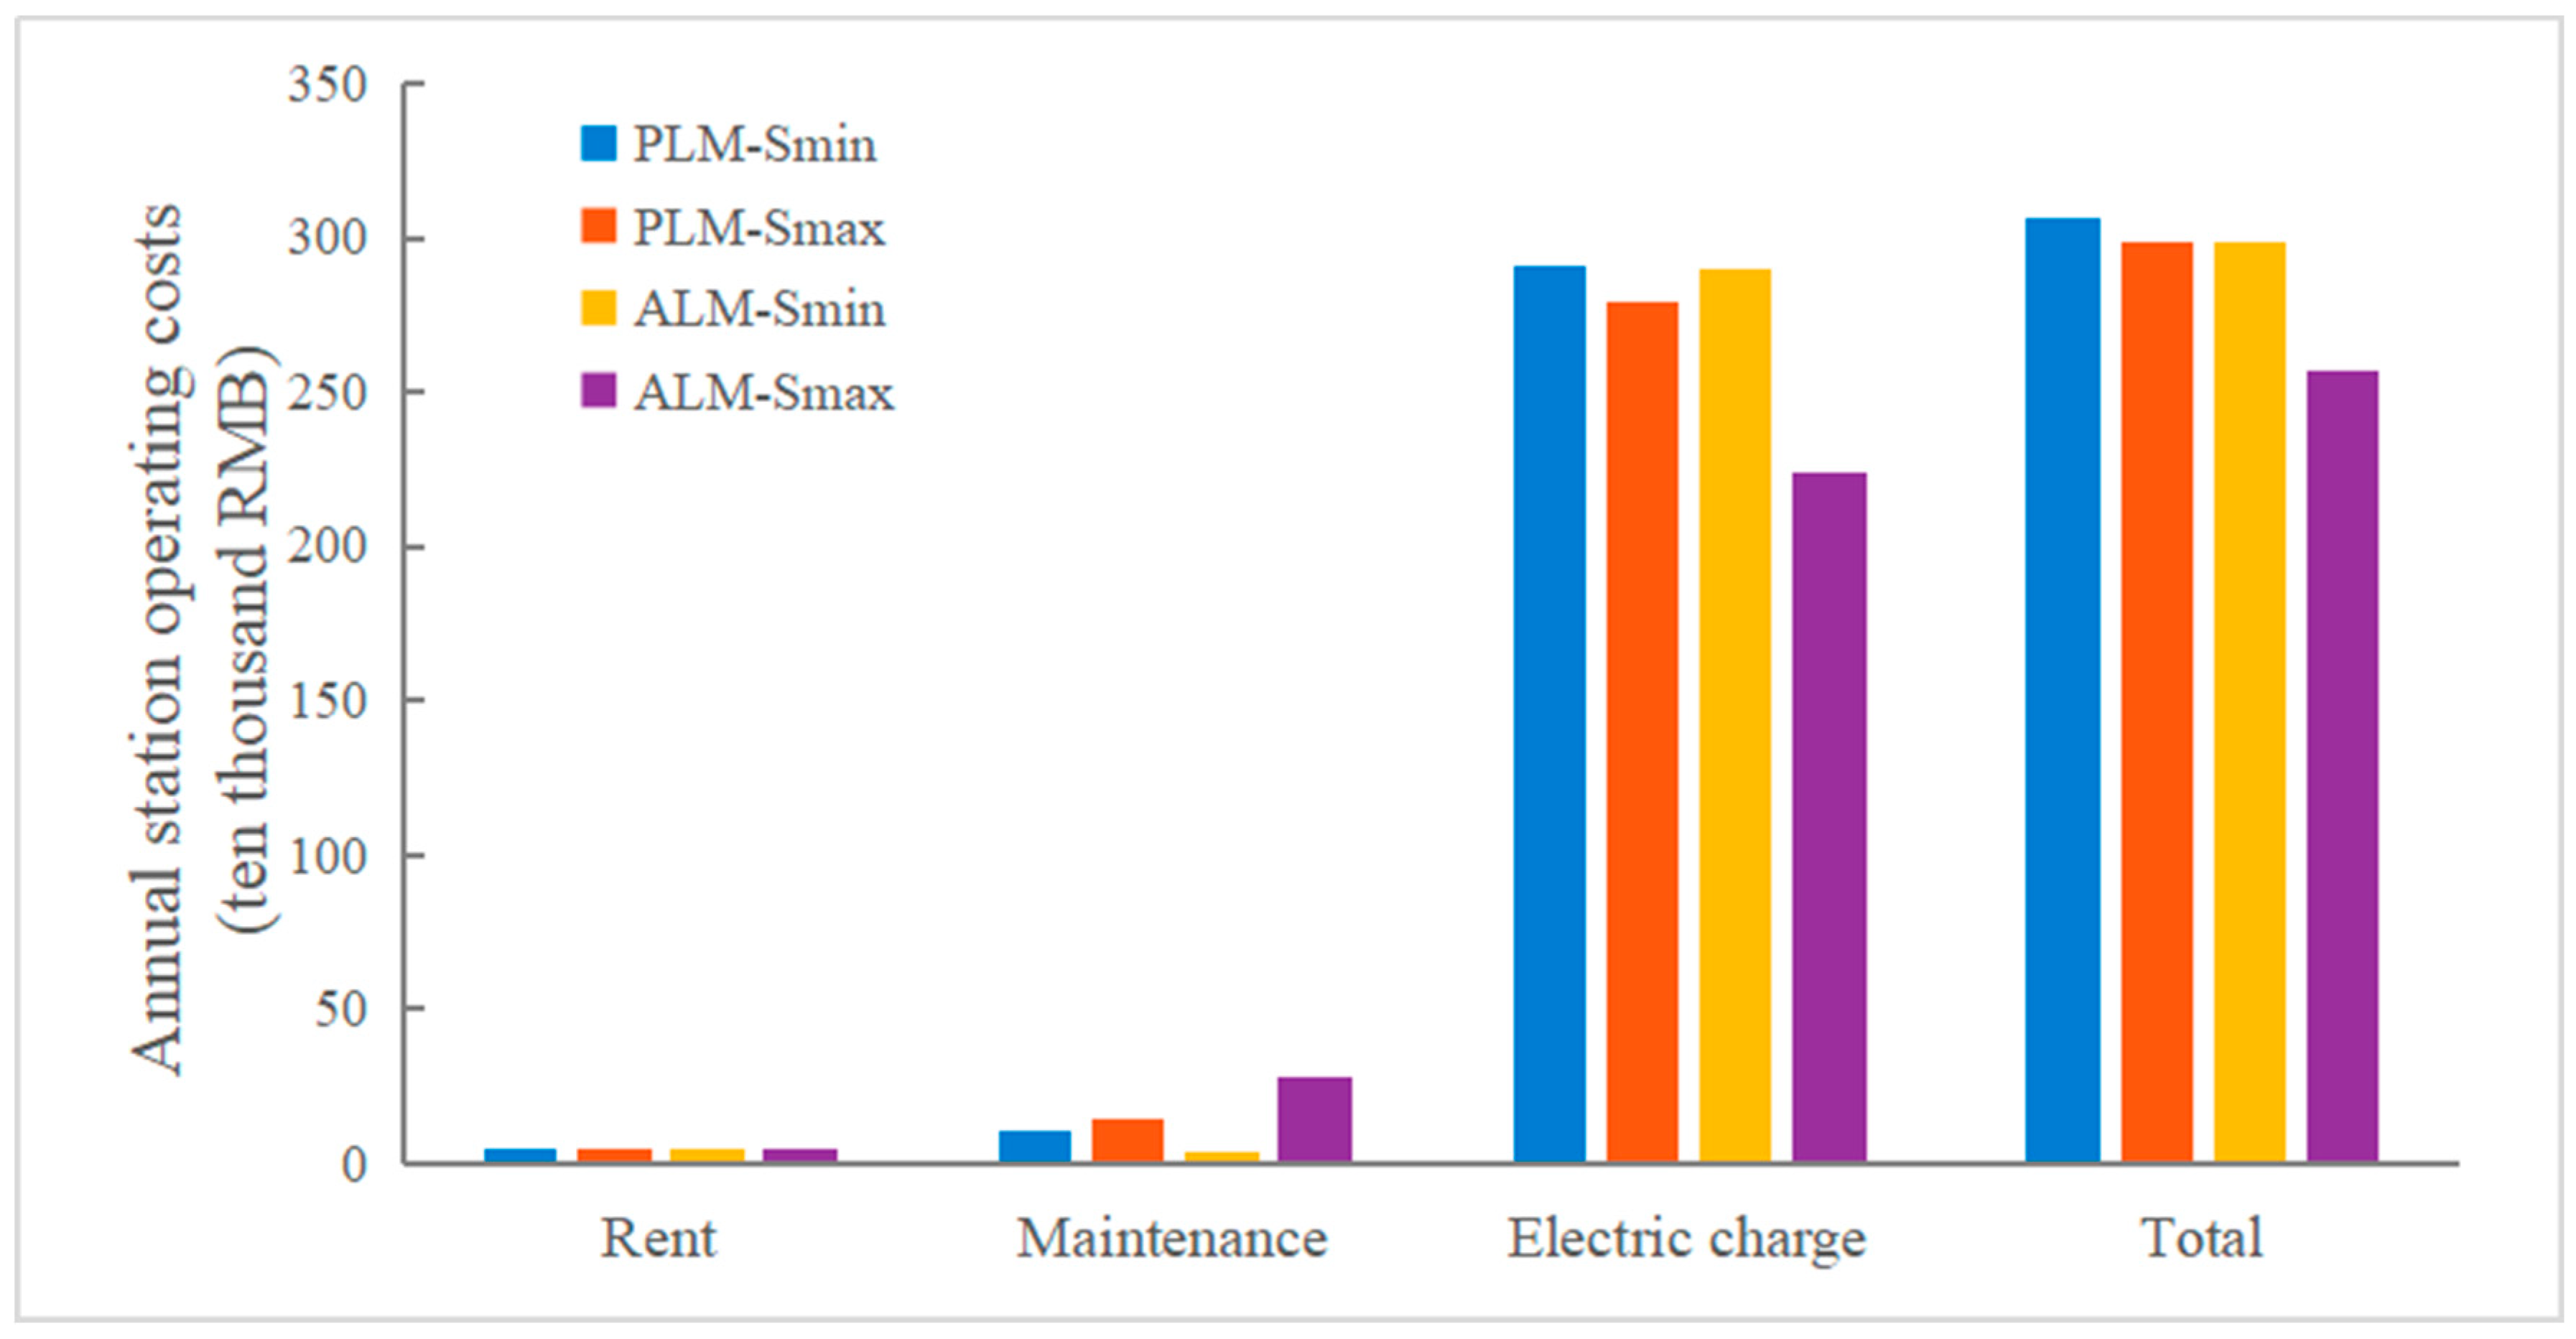
4.3.1. Revenue and Cost Results for the Four Schemes
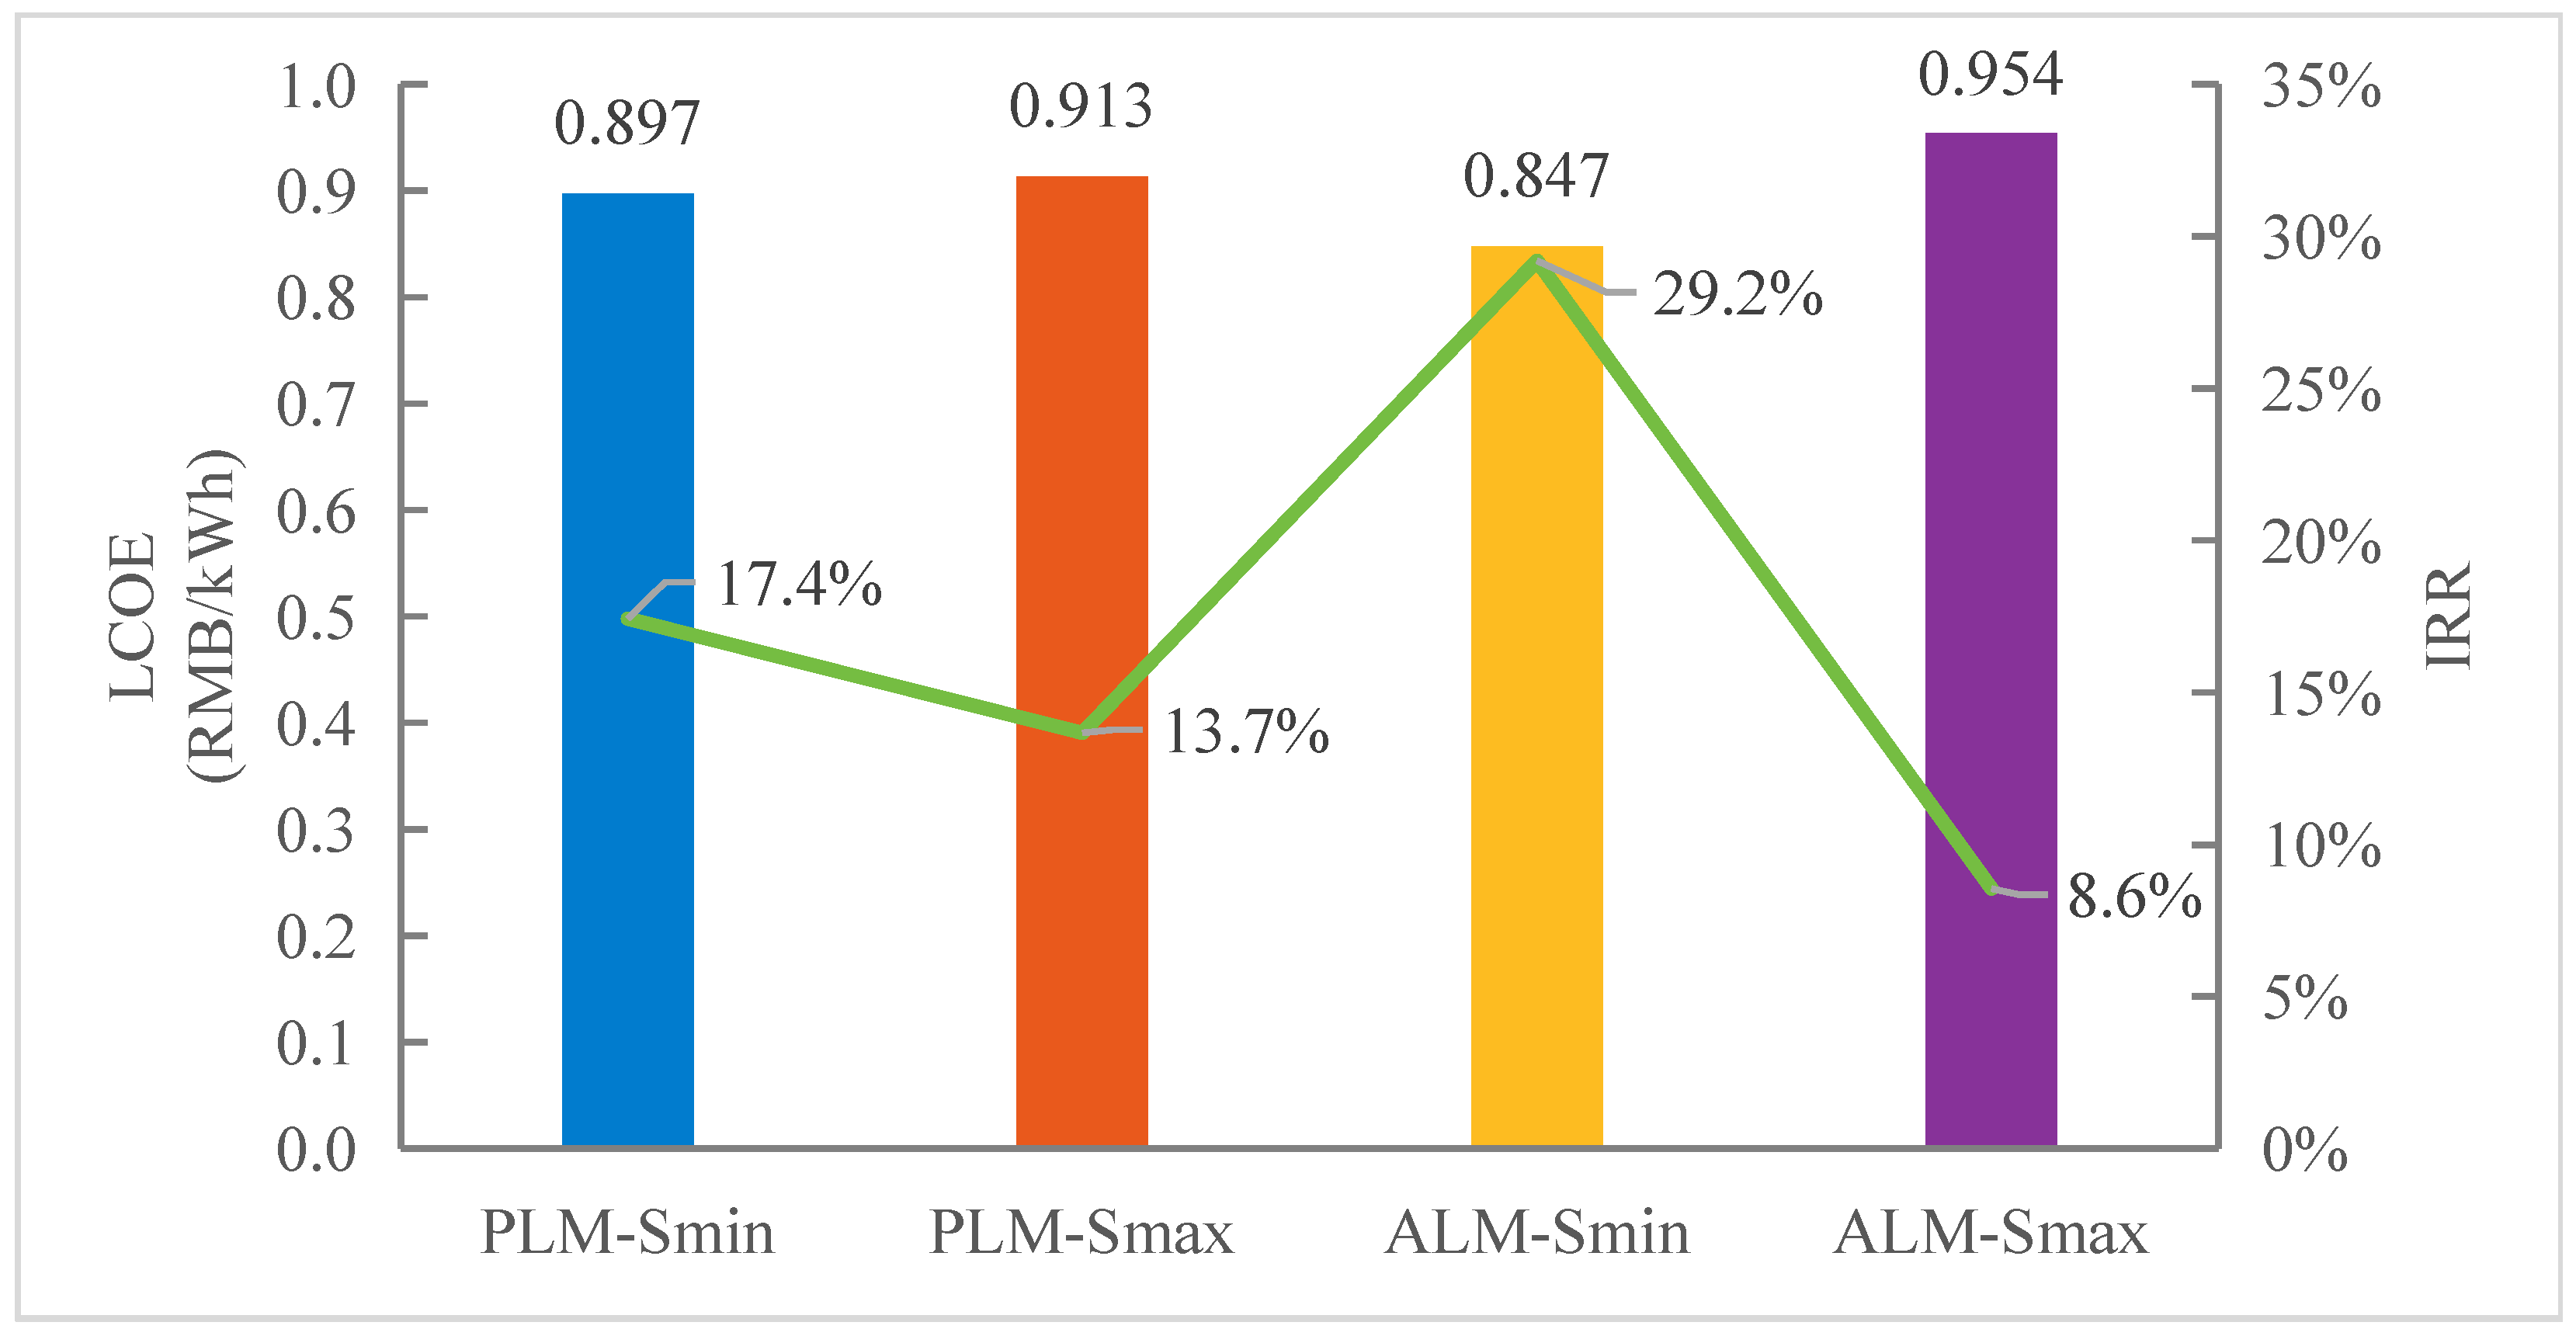
4.3.2. Comprehensive Economic Comparison of the Four Schemes
- (1)
- Step 1: Scheme Selection Based on the LCOE
- (2)
- Step 2: IRR Evaluation of the Selected Scheme
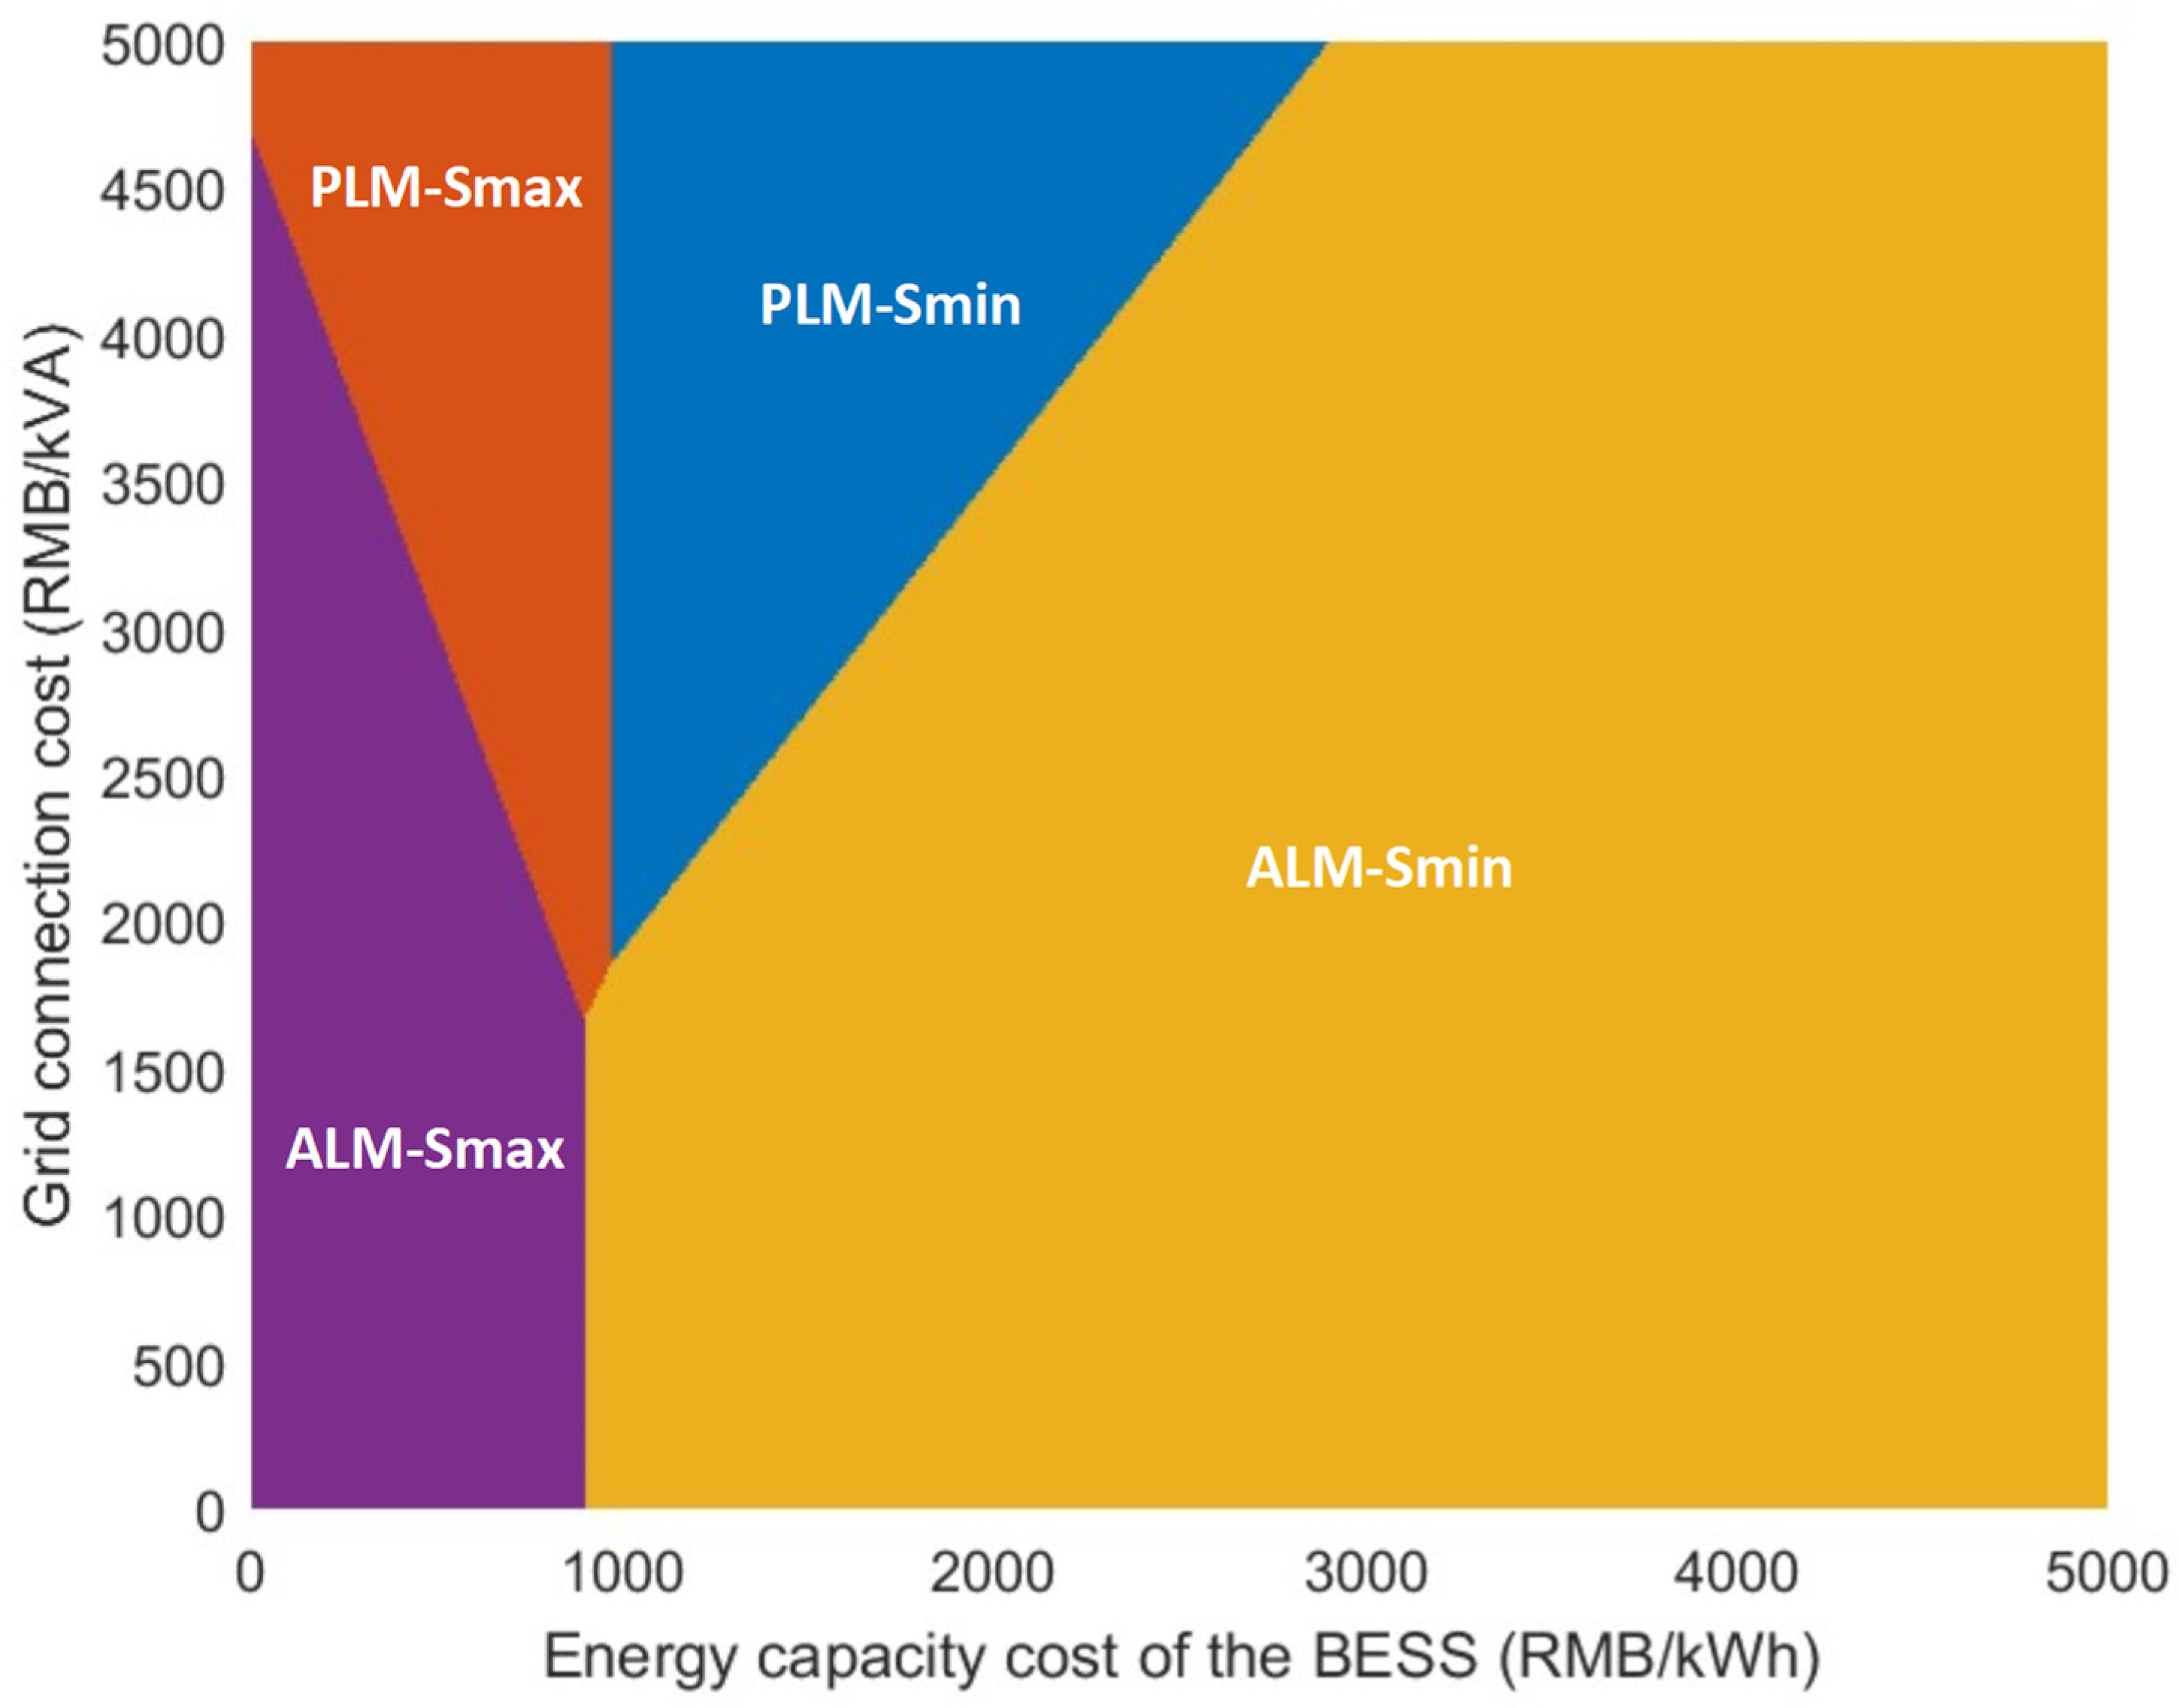
4.4. Sensitivity Analysis of the Grid Connection Cost and BESS Cost
4.4.1. LCOE
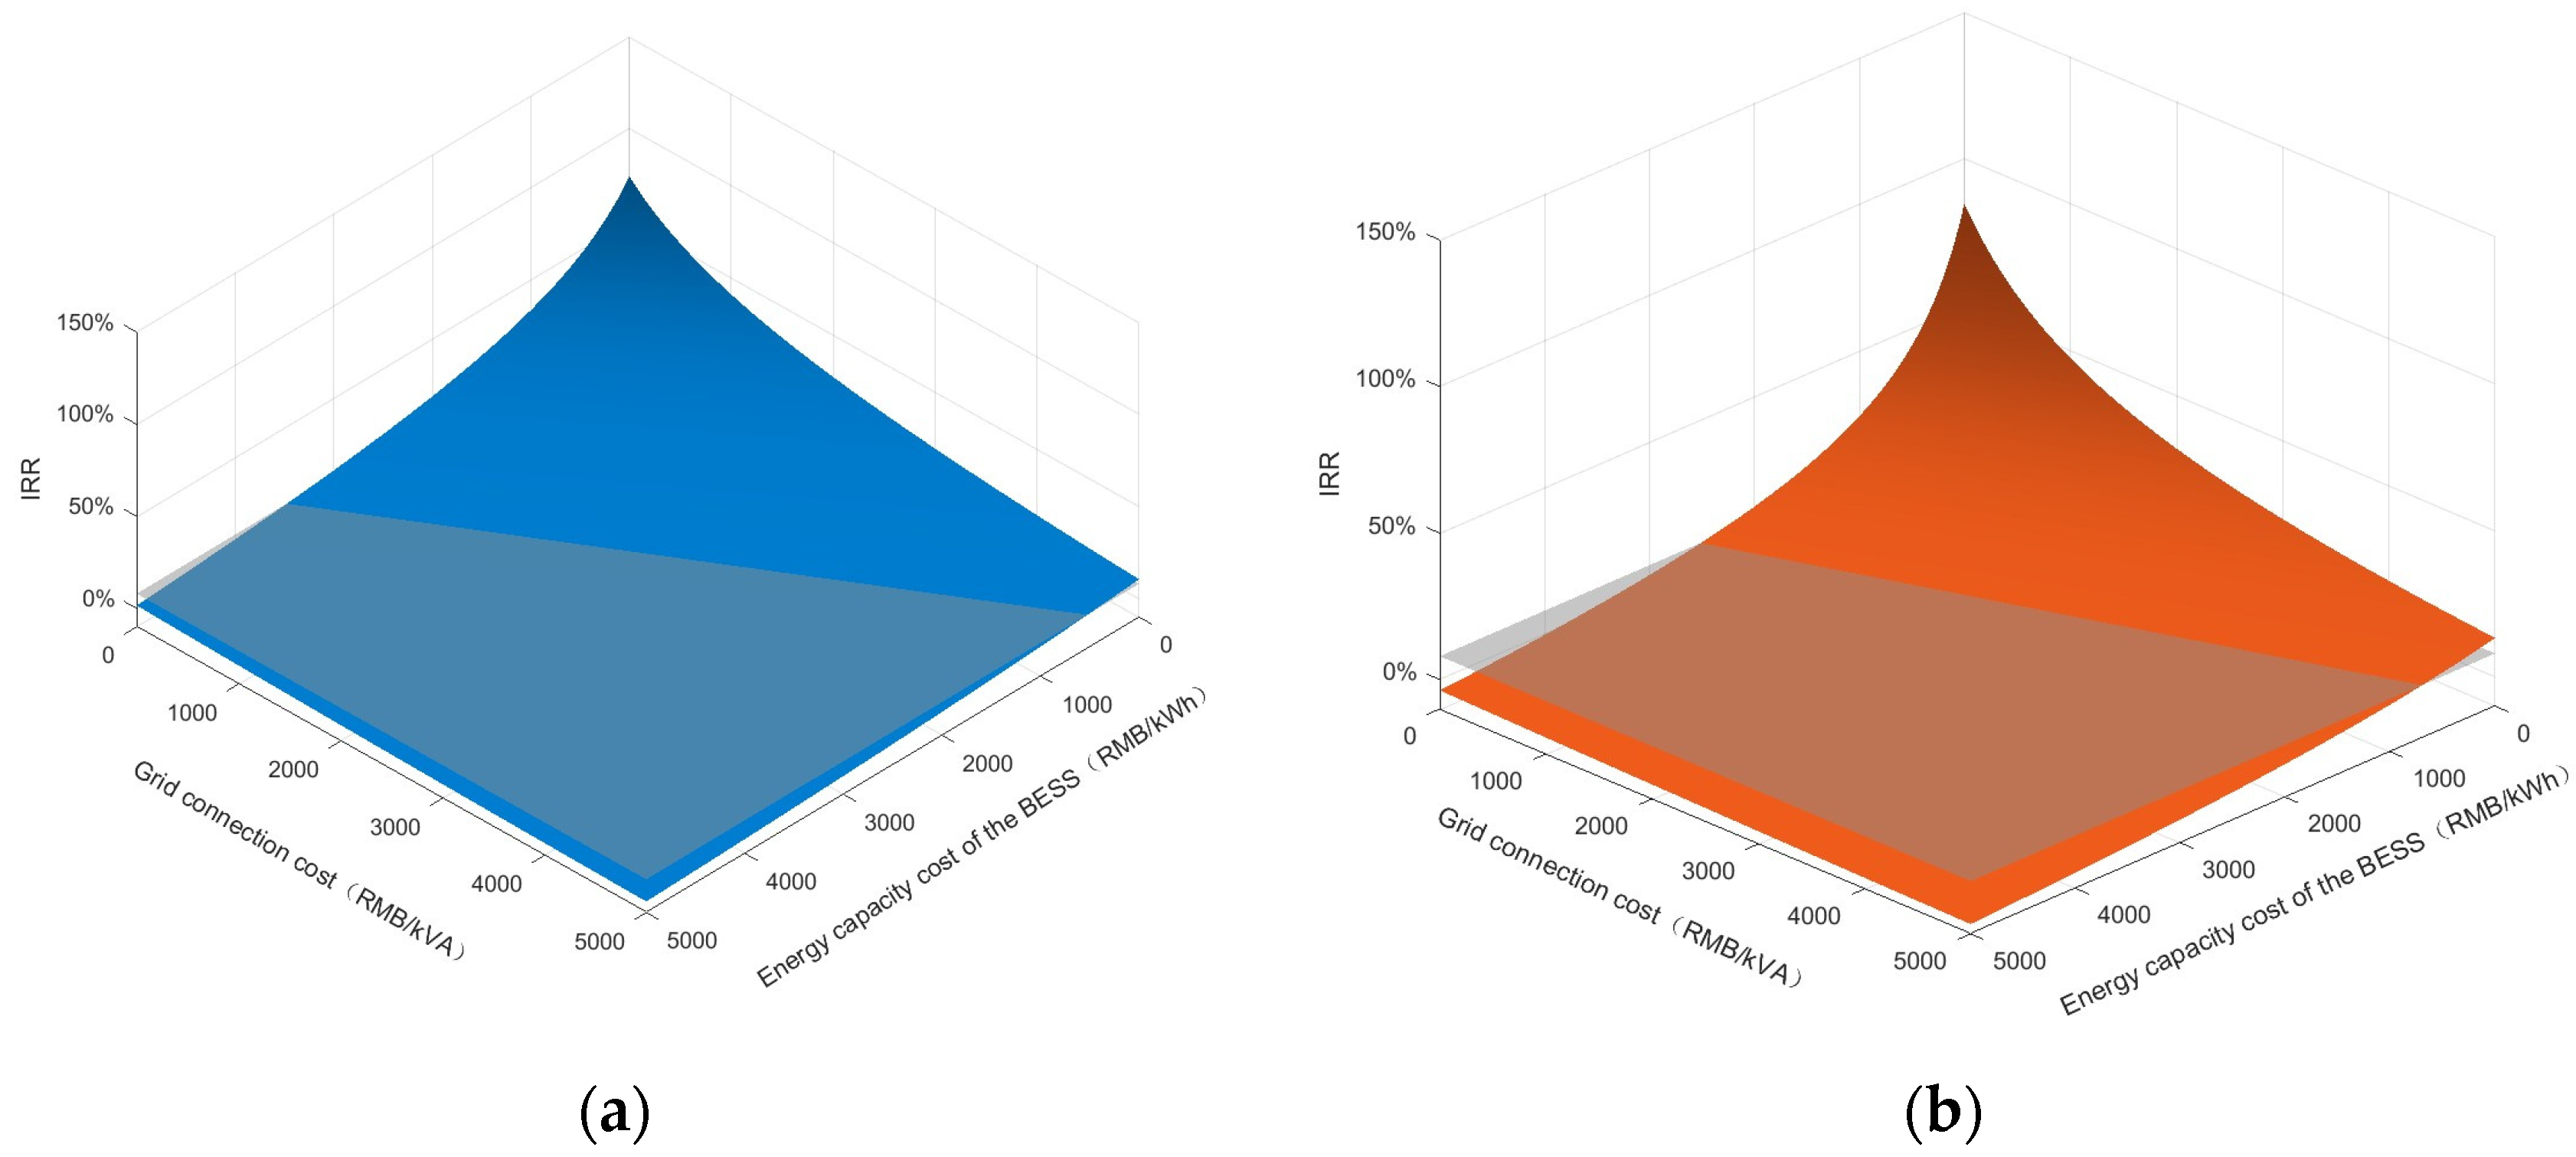
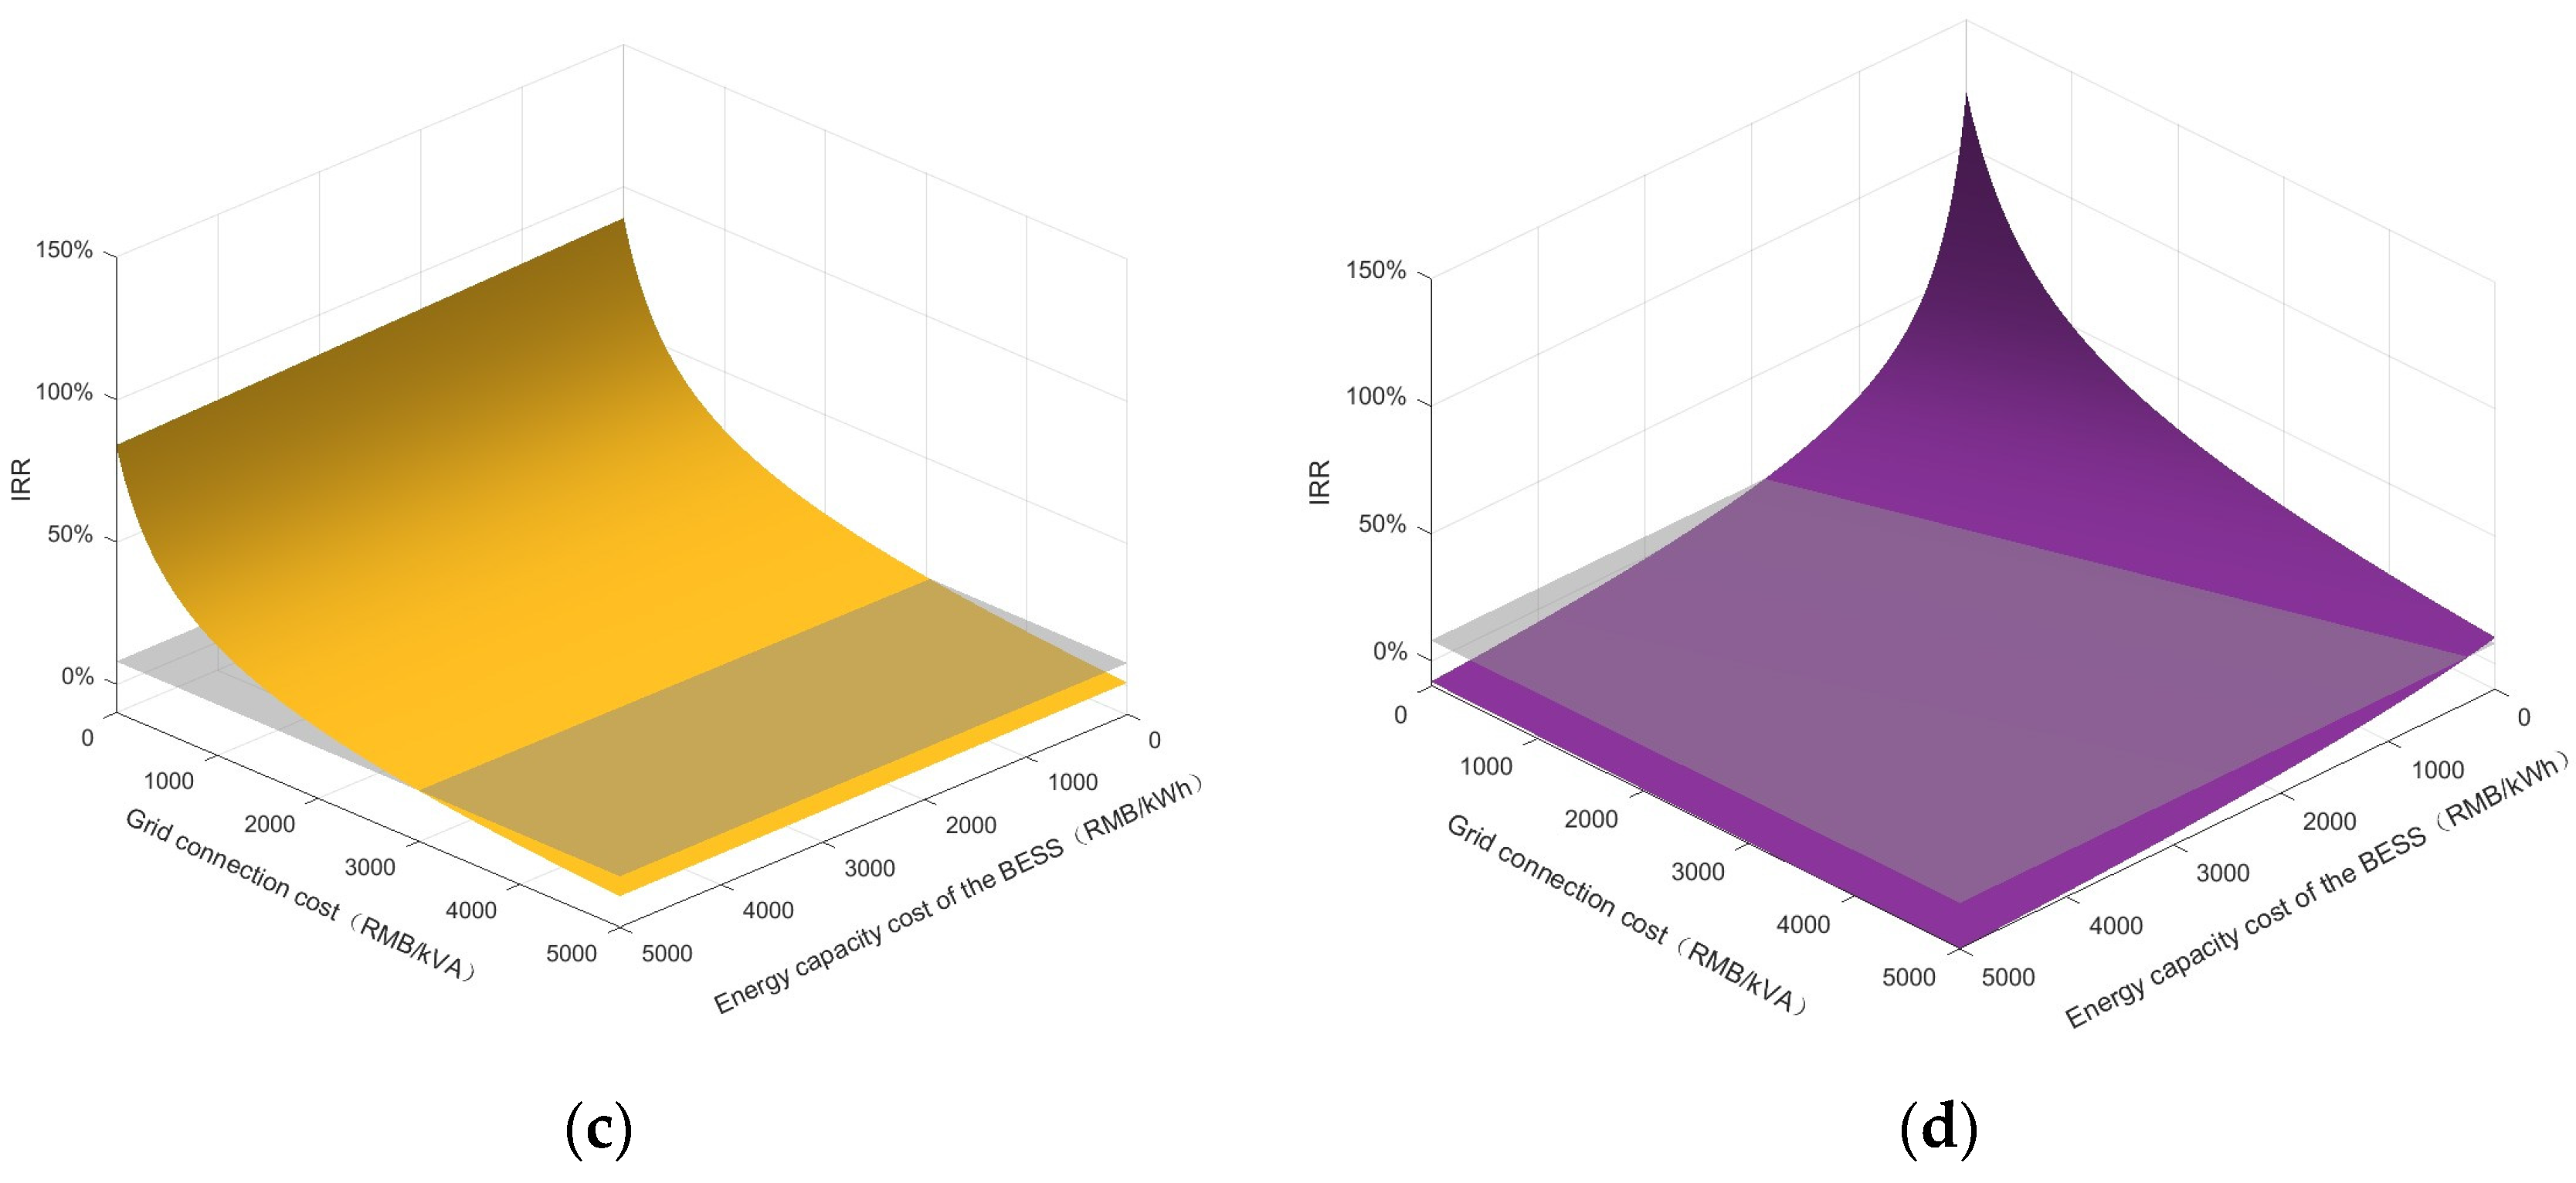
4.4.2. IRR
5. Conclusions
- The ALM-BESS four-quadrant classification method is proposed and four types of schemes are defined. It points out the significant differences in the transformer capacity configuration, BESS capacity configuration, and operating conditions between ALM and PLM modes when facing grid-connected capacity constraints, and finally forms four types of schemes, such as ALM-Smax, ALM-Smin, PLM-Smax, and PLM-Smin, are proposed based on the maximum and minimum configurations of the BESS. It provides a systematic and comprehensive basic scheme for supporting ultra-fast charging stations to solve the grid-connected capacity constraints.
- A generalized multi-scenario comparison process and a comprehensive economic decision-making method are proposed. Based on the given service vehicle size, charging pile configuration requirements, and grid-connected capacity constraints, a generalized selection framework is established around the four types of schemes, covering the typical daily charging load simulation, transformer and BESS capacity configurations, and typical daily working condition simulation, and a comprehensive economic evaluation based on LCOE and IRR is used to solve the problem of multi-scenario decision-making.
- The effectiveness of the proposed four-quadrant classification method and comparison framework is verified through a typical case. The effectiveness of the proposed four scenarios and the accompanying comparison framework for finding the best solution to address the capacity constraints of the distribution network is verified through a typical case of a ultra-fast charging station in Tianjin, China. The proposed multi-option comparison framework is further demonstrated to guide charging companies to make the optimal choices among the four options under different cost conditions by conducting a sensitivity analysis and solving the decision boundaries for the two key elements: the grid connection cost and the BESS cost.
- Improvement of the dynamic adaptability of the analysis: on the basis of the typical daily analysis method, the dynamic production simulation for 365 days or even years of the year will be further extended to better reflect the dynamic impacts of factors such as working days, holidays, different weather, and different seasons.
- In-depth analysis of the impact of potential risks and uncertainties: On the basis of the existing deterministic assumptions of the available capacity of the distribution network and the charging demand at different times of the day, further risk and uncertainty analysis methods are introduced, especially focusing on the impacts of uncertainties for the four schemes, such as the prediction of the available capacity of the distribution network during the valley hours, the prediction of the peak and valley arbitrage space of the energy storage, the prediction of the demand of the ultra-fast charging, the charging behaviors of users, and so on for the ALM mode. We propose the corresponding optimal configuration and selection methods.
Author Contributions
Funding
Data Availability Statement
Conflicts of Interest
Abbreviations
| Symbol | Description | Unit |
| Pt | Total charging power of the station at time t | kW |
| Pi,t | Power of the i-th charger at time t | kW |
| C | The configuration capacity of the transformer | kVA |
| Qp | Available grid capacity during peak periods | kW |
| Qf | Available grid capacity during flat periods | kW |
| Qv | Available grid capacity during valley periods | kW |
| ry | Margin coefficient for transformer capacity | - |
| Q1 | BESS energy capacity (PLM-Smin) | kWh |
| Q2 | BESS energy capacity (PLM-Smax) | kWh |
| P1 | BESS power capacity (PLM-Smin) | kW |
| P2 | BESS power capacity (PLM-Smax) | kW |
| η | BESS discharge efficiency | - |
| LCOE | Levelized cost of electricity | RMB/kWh |
| C0 | Initial investment cost | RMB |
| COM | Annual operation and maintenance cost | RMB/year |
| Pca | Capacity charge cost | RMB |
| pca | Unit capacity charge cost | RMB/kVA |
| Yyear | Annual revenue of the UFC station | RMB/year |
| ps | Service fee per kWh | RMB/kWh |
| Et | Annual electricity sales | kWh/year |
| δE | BESS energy capacity cost | RMB/kWh |
| δP | BESS power capacity cost | RMB/kW |
| PLM | Passive Load Management | |
| ALM | Active Load Management | |
| LCOE | Levelized Cost of Electricity | |
| IRR | Internal Rate of Return | |
| UFC | Ultra-Fast Charging | |
| BESS | Battery Energy Storage System | |
| Exchange Rate | 1 RMB (Renminbi) = 0.14 USD (U.S. dollar) | |
Appendix A
Appendix B

References
- Ahmad, A.; Qin, Z.; Wijekoon, T.; Bauer, P. An Overview on Medium Voltage Grid Integration of Ultra-Fast Charging Stations: Current Status and Future Trends. IEEE Open J. Ind. Electron. Soc. 2022, 3, 420–447. [Google Scholar] [CrossRef]
- Shafiei, M.; Ghasemi-Marzbali, A. Fast-Charging Station for Electric Vehicles, Challenges and Issues: A Comprehensive Review. J. Energy Storage 2022, 49, 104136. [Google Scholar] [CrossRef]
- Danese, A.; Torsæter, B.N.; Sumper, A.; Garau, M. Planning of High-Power Charging Stations for Electric Vehicles: A Review. Appl. Sci. 2022, 12, 3214. [Google Scholar] [CrossRef]
- Black, D.; Panossian, N.; Liu, J.; Nordman, B.; Farrell, J.; Hodge, C.; Meintz, A.; Abdullah, M.; Kisacikoglu, M.J.; Bennett, J. Survey and Gap Prioritization of U.S. Electric Vehicle Charge Management Deployments; Lawrence Berkeley National Laboratory (LBNL): Berkeley, CA, USA, 2024. [Google Scholar]
- The Mobility House Why Does Automated Load Management (ALM) Need Local Control? Available online: https://www.mobilityhouse.com/usa_en/knowledge-center/article/alm-local-control-ev-fleets (accessed on 15 April 2025).
- Weisbach, M.; Fechtner, H.; Spaeth, U.; Popp, A.; Schmuelling, B. Intelligent Multi-Vehicle DC/DC Charging Using an Active Response Management (ARM). In Proceedings of the 2023 IEEE Transportation Electrification Conference & Expo (ITEC), Detroit, MI, USA, 21–23 June 2023; pp. 1–4. [Google Scholar]
- Ramaschi, R.; Polimeni, S.; Cabrera-Tobar, A.; Leva, S. Dynamic Switching Enhancement for Electric Vehicle Charging Station Real-Time Operation. In Proceedings of the 2024 IEEE International Conference on Artificial Intelligence & Green Energy (ICAIGE), Yasmine Hammamet, Tunisia, 10–12 October 2024; pp. 1–6. [Google Scholar]
- Joachim, L. IEEE 2030.5: The Key to Smart EV Charging and Grid Integration. Available online: https://www.ampcontrol.io/post/ieee-2030-5-the-key-to-smart-ev-charging-and-grid-integration (accessed on 15 April 2025).
- Rogge, K.S.; Goedeking, N. Challenges in Accelerating Net-Zero Transitions: Insights from Transport Electrification in Germany and California. Environ. Res. Lett. 2024, 19, 044007. [Google Scholar] [CrossRef]
- Anand, D.; Salcedo, F.; Shah, S.; Tuffner, F.K. EV Charging Infrastructure Energization an Overview of Approaches for Simplifying and Accelerating Timelines to Processing EV Charging Load Service Requests; Idaho National Laboratory (INL): Idaho Falls, ID, USA, 2025. [Google Scholar]
- Frank, T. Electric Vehicle Standards—Grid Service Capabilities; Pacific Northwest National Laboratory (PNNL): Richland, WA, USA, 2024. [Google Scholar]
- IEEE Std 2030.13-2024; IEEE Guide for Electric Transportation Fast Charging Station Management System Functional Specification. IEEE: Washington, DC, USA, 2024; pp. 1–63. [CrossRef]
- New York Electric Vehicle Load Management Technology Incentive Program; National Grid: London, UK, 2024.
- California Public Utilities Commission (CPUC) Decision Concerning Implementation of Senate Bill 676 And Vehicle-Grid Integration Strategies; California Public Utilities Commission: San Francisco, CA, USA, 2021.
- Gainulenko, A. Load Management Solutions for Electric Vehicle Chargers in a Software as a Service Platform. Bachelor’s Thesis, Metropolia University of Applied Sciences, Helsinki, Finland, 18 May 2021. [Google Scholar]
- Lucy, M.; James, F.; Ben, S. Supporting the EV Charging Network of the Future. Available online: https://atlaspolicy.com/wp-content/uploads/2024/09/Supporting-the-EV-Charging-Network-of-the-Future.pdf (accessed on 15 April 2025).
- Zhao, D.; Thakur, N.; Chen, J. Optimal Design of Energy Storage System to Buffer Charging Infrastructure in Smart Cities. J. Manag. Eng. 2020, 36, 04019048. [Google Scholar] [CrossRef]
- Bai, S.; Yu, D.; Lukic, S. Optimum Design of an EV/PHEV Charging Station with DC Bus and Storage System. In Proceedings of the 2010 IEEE Energy Conversion Congress and Exposition, Atlanta, GA, USA, 12–16 September 2010; pp. 1178–1184. [Google Scholar]
- Domínguez-Navarro, J.A.; Dufo-López, R.; Yusta-Loyo, J.M.; Artal-Sevil, J.S.; Bernal-Agustín, J.L. Design of an Electric Vehicle Fast-Charging Station with Integration of Renewable Energy and Storage Systems. Int. J. Electr. Power Energy Syst. 2019, 105, 46–58. [Google Scholar] [CrossRef]
- Rehman, W.U.; Bo, R.; Mehdipourpicha, H.; Kimball, J.W. Sizing Battery Energy Storage and PV System in an Extreme Fast Charging Station Considering Uncertainties and Battery Degradation. Appl. Energy 2022, 313, 118745. [Google Scholar] [CrossRef]
- Ali, A.; Shakoor, R.; Raheem, A.; Muqeet, H.A.U.; Awais, Q.; Khan, A.A.; Jamil, M. Latest Energy Storage Trends in Multi-Energy Standalone Electric Vehicle Charging Stations: A Comprehensive Study. Energies 2022, 15, 4727. [Google Scholar] [CrossRef]
- Bayram, I.S.; Hunter, L.; Senol, M.; Sevdari, K. Analyzing Phase Imbalance in Smart Charging of Multiple EVs: An Experimental Approach. IET Conf. Proc. 2025, 2024, 247–251. [Google Scholar] [CrossRef]
- Nayak, S.; Mohanty, S. Grid Connected Electric Vehicle Charging and Discharging Rate Management with Balance Grid Load. Electr. Eng. 2023, 105, 575–592. [Google Scholar] [CrossRef]
- Zhang, Y.; Hao, S. Optimized Configuration of Transformer Capacity and Energy Storage for Electric Vehicle Charging Stations. Electr. Meas. Instrum. 2023, 60, 19–25. [Google Scholar]
- He, J.; Yan, N.; Zhang, J.; Chen, L.; Tang, T. Capacity Configuration Optimization for Battery Electric Bus Charging Station’s Photovoltaic Energy Storage System. J. Cent. South Univ. 2023, 30, 4268–4284. [Google Scholar] [CrossRef]
- Ma, Y.; Han, Z.; Yan, Q.; Wan, J.; Dan, W. Optimization of Storage Capacity Allocation at Charging Stations Considering EV Charging Load and Storage Lifetime. Power Syst. Clean Energy 2024, 40, 92–101. [Google Scholar]
- Chen, H.; Hu, Z.; Zhang, H. Coordinated Charging and Discharging Strategies for Plug-in Electric Bus Fast Charging Station with Energy Storage System. IET Gener. Transm. Distrib. 2021, 12, 2019–2028. [Google Scholar] [CrossRef]
- Gui, Q.; Shi, Y.; Zhou, Y.; Feng, D. Optimal Configuration Model of Photovoltaic and Energy Storage Capacity of Charging Station Considering Battery Dynamic Characteristics. Electr. Power Constr. 2021, 42, 90–99. [Google Scholar]
- Li, X.; Zhang, L.; Zheng, X.; Li, J.; Deng, J.; Liang, Y. KL Divergence-Based Distributionally Robust Planning Method for Energy Storage Plants. Acta Energiae Solaris Sin. 2022, 43, 46–55. [Google Scholar]
- Bilal, M.; Ahmad, F.; Rizwan, M. Techno-Economic Assessment of Grid and Renewable Powered Electric Vehicle Charging Stations in India Using a Modified Metaheuristic Technique. Energy Convers. Manag. 2023, 284, 116995. [Google Scholar] [CrossRef]
- Mas’ud, A.A. A Hybrid Combination of EV Charging Stations with Renewable Energy Sources for Powering a Residential Community. A Techno-Economic Perspective. Energy Storage 2023, 5, e483. [Google Scholar] [CrossRef]
- Lanz, L.; Noll, B.; Schmidt, T.S.; Steffen, B. Comparing the Levelized Cost of Electric Vehicle Charging Options in Europe. Nat. Commun. 2022, 13, 5277. [Google Scholar] [CrossRef]
- Deng, C.; Mozafari, H.; Ghamami, M.; Anctil, A. Economic Benefit and Peak Demand Reduction of Photovoltaic and Second-Life Battery Storage on Fast Charging System. In Proceedings of the 2024 IEEE 52nd Photovoltaic Specialist Conference (PVSC), Seattle, WA, USA, 9–14 June 2024; pp. 1185–1187. [Google Scholar]
- Chiradeja, P.; Sottiyaphai, C.; Ananwattanaporn, S. Atthapol Ngaopitakkul, and Evaluating the Financial Dynamics of Electric Vehicle Charging Stations in Thailand: Implications of Energy Cost Variability. IEEE Access 2025, 13, 33985–33994. [Google Scholar] [CrossRef]
- Ghosh, N.; Mothilal Bhagavathy, S.; Thakur, J. Accelerating Electric Vehicle Adoption: Techno-Economic Assessment to Modify Existing Fuel Stations with Fast Charging Infrastructure. Clean Technol. Environ. Policy 2022, 24, 3033–3046. [Google Scholar] [CrossRef]
- Sun, B.; Jiang, J.; Niu, J. Pricing Calculation and Comparative Analysis of Power Battery Operations Under Two Business Models. High Technol. Lett. 2013, 23, 302–307. [Google Scholar]
- Sun, B.; Jiang, J.; Zhang, W. Pricing Calculation for Power Battery Leasing Based on Internal Rate of Return Method. Autom. Electr. Power Syst. 2011, 35, 27–30. [Google Scholar]
- State Grid Tianjin Electric Power Company Announcement on the Proxy Power Purchase Price for April 2025. Available online: http://www.tj.sgcc.com.cn/html/main/col2774/2025-03/28/20250328204821804774812_1.html (accessed on 14 April 2025).
- General Office of the State Council Guidelines on Further Building a High-Quality Charging Infrastructure System. Available online: https://www.gov.cn/zhengce/zhengceku/202306/content_6887168.htm (accessed on 14 April 2025).
- Zhu, F.; Li, L.; Li, Y.; Li, K.; Lu, L.; Han, X.; Du, J.; Ouyang, M. Does the Battery Swapping Energy Supply Mode Have Better Economic Potential for Electric Heavy-Duty Trucks? eTransportation 2023, 15, 100215. [Google Scholar] [CrossRef]
- Wu, Z.; Wang, Z.; Han, X. Analysis of Levelized Cost and Profit Models for Electrochemical Energy Storage in Power Systems. Electr. Power Constr. 2025, 46, 177–186. [Google Scholar]


| Category | PLM-Smin | PLM-Smax | ALM-Smin | ALM-Smax | |
|---|---|---|---|---|---|
| Initial Investment | Grid connection | Low | High | ||
| BESS | Lower | Higher | Lowest | Highest | |
| chargers | Same | ||||
| Stacks | Same | ||||
| Annual O&M Costs | Transformer | Low | High | ||
| BESS | Lower | Higher | Lowest | Highest | |
| Power stack and chargers | Same | ||||
| Rent | Parking Space Rent | Same | |||
| Electricity Costs | Electricity Cost | Highest | Lower | Higher | Lowest |
| Capacity Cost | Lower | Higher/Equal | |||
| Revenue | Electricity Fee | Same | |||
| Service Fee | Same | ||||
| Parameters | Notations | Values |
|---|---|---|
| Average Daily Number of Vehicles Served | 369 | |
| Proportion of Fast-Charging Vehicles (%) | 70% | |
| Proportion of Ultra-Fast-Charging Vehicles (%) | 30% | |
| Max Charging Power of Slow-Charging Vehicles (kW) | 60 | |
| Max Charging Power of Fast-Charging Vehicles (kW) | 180 | |
| Max Charging Power of Ultra-Fast-Charging Vehicles (kW) | 360 | |
| SOC Range (%) | ||
| Battery Capacity (kWh) | 67 |
| Parameters | Notations | Values |
|---|---|---|
| Number of Chargers | 10 | |
| Fast Charger Power (kW) | 120 | |
| Fast Charger Power (kW) | 200 | |
| Ultra-Fast Charger Power (kW) | 360 | |
| Number of 120 kW Fast Chargers | 4 | |
| Number of 200 kW Fast Chargers | 3 | |
| Number of 360 kW Ultra-Fast Chargers | 3 |
| Parameters | Notations | Values |
|---|---|---|
| Peak Period Capacity Limit (kW) | 630 | |
| Flat Period Capacity Limit (kW) | 900 | |
| Valley Period Capacity Limit (kW) | 1380 |
| Parameters | Notations | Values |
|---|---|---|
| Peak period energy price (RMB/kWh) | 1.0 | |
| Flat period energy price (RMB/kWh) | 0.7 | |
| Valley period energy price (RMB/kWh) | 0.4 | |
| Peak period | 9:00–12:00, 16:00–21:00 | |
| Flat period | 7:00–9:00, 12:00–16:00, 21:00–23:00 | |
| Valley period | 23:00–7:00 |
| Parameters | Notations | Values |
|---|---|---|
| 120 kW Charger Equipment Cost (10,000 RMB/unit) | 1.2 | |
| 200 kW Charger Equipment Cost (10,000 RMB/unit) | 1.5 | |
| 360 kW Supercharger Equipment Cost (10,000 RMB/unit) | 3 | |
| Charger Construction Cost (RMB/unit) | 14,000 | |
| Supercharger Gun Construction Cost (RMB/unit) | 19,000 | |
| Standard Gun Maintenance Cost (RMB/Charger/year) | 400 | |
| Supercharger Gun Maintenance Cost (RMB/Charger/year) | 1500 | |
| Power Stack Equipment Cost (RMB/kW) | 400 | |
| Power Stack Construction Cost (RMB/unit) | 40,000 | |
| Transformer Construction Cost Coefficient | 0.3 | |
| Grid Connection Cost (RMB/kVA) | 1000 | |
| Power Stack and Transformer Maintenance Cost (RMB/unit/year) | 20,000 | |
| Parking Space Rent (10,000 RMB/unit/year) | 1.2 | |
| Residual Value Rate of Chargers and Power Equipment | 0.2 | |
| Station Service Life | 10 | |
| BESS Energy Capacity Cost (RMB/kWh) | 1500 | |
| BESS Power Capacity Cost (RMB/kW) | 300 | |
| BESS Annual O&M Cost Ratio Coefficient | 4% | |
| BESS Cycle Life (cycles) | 5000 | |
| BESS Average Annual Capacity Degradation Rate | 2% | |
| BESS Battery Residual Value Rate | 0.2 | |
| Service Fee Unit Price (RMB/kWh) | 0.3 |
| Peak Period | Peak Period | Valley Period | |
|---|---|---|---|
| Maximum Load (kW) | 655 | 714 | 1162 |
| Scheme | Transformer Capacity (kVA) | BESS Energy Capacity (kWh) | BESS Power Capacity (kW) |
|---|---|---|---|
| PLM-Smin | 630 | 1070 | 600 |
| PLM-Smax | 630 | 1740 | 600 |
| ALM-Smin | 1280 | 10 | 50 |
| ALM-Smax | 1280 | 3940 | 1030 |
Disclaimer/Publisher’s Note: The statements, opinions and data contained in all publications are solely those of the individual author(s) and contributor(s) and not of MDPI and/or the editor(s). MDPI and/or the editor(s) disclaim responsibility for any injury to people or property resulting from any ideas, methods, instructions or products referred to in the content. |
© 2025 by the authors. Published by MDPI on behalf of the World Electric Vehicle Association. Licensee MDPI, Basel, Switzerland. This article is an open access article distributed under the terms and conditions of the Creative Commons Attribution (CC BY) license (https://creativecommons.org/licenses/by/4.0/).
Share and Cite
Yin, Q.; Li, L.; Zhang, J.; Liu, X.; Ren, B. A Multi-Scheme Comparison Framework for Ultra-Fast Charging Stations with Active Load Management and Energy Storage Under Grid Capacity Constraints. World Electr. Veh. J. 2025, 16, 250. https://doi.org/10.3390/wevj16050250
Yin Q, Li L, Zhang J, Liu X, Ren B. A Multi-Scheme Comparison Framework for Ultra-Fast Charging Stations with Active Load Management and Energy Storage Under Grid Capacity Constraints. World Electric Vehicle Journal. 2025; 16(5):250. https://doi.org/10.3390/wevj16050250
Chicago/Turabian StyleYin, Qingyu, Lili Li, Jian Zhang, Xiaonan Liu, and Boqiang Ren. 2025. "A Multi-Scheme Comparison Framework for Ultra-Fast Charging Stations with Active Load Management and Energy Storage Under Grid Capacity Constraints" World Electric Vehicle Journal 16, no. 5: 250. https://doi.org/10.3390/wevj16050250
APA StyleYin, Q., Li, L., Zhang, J., Liu, X., & Ren, B. (2025). A Multi-Scheme Comparison Framework for Ultra-Fast Charging Stations with Active Load Management and Energy Storage Under Grid Capacity Constraints. World Electric Vehicle Journal, 16(5), 250. https://doi.org/10.3390/wevj16050250