Article

Research on Energy-Saving Control Strategy of Nonlinear Thermal Management System for Electric Tractor Power Battery Under Plowing Conditions

1
Vehicle and Traffic Engineering, Henan University of Science and Technology, Luoyang 471003, China
2
State Key Laboratory of Intelligent Agricultural Power Equipment, Luoyang 471039, China
3
YTO Group Corporation, Luoyang 471004, China
*
Author to whom correspondence should be addressed.
World Electr. Veh. J. 2025, 16(5), 249; https://doi.org/10.3390/wevj16050249
Submission received: 20 February 2025 / Revised: 19 March 2025 / Accepted: 14 April 2025 / Published: 25 April 2025

Abstract

:
To address the issue of over-regulation of the temperature of a liquid-cooled power battery thermal management system under the plowing condition of electric tractors, which leads to high energy consumption, a nonlinear model prediction control (NMPC) algorithm for the thermal management system of the power battery of electric tractors applicable to the plowing condition is proposed. Firstly, a control-oriented electric tractor power battery heat production model and a heat transfer model were established based on the tractor operating conditions and Bernardi’s theory of battery heat production. Secondly, in order to improve the accuracy of temperature prediction, a prediction method of future working condition information based on the moving average theory is proposed. Finally, a nonlinear model predictive control cooling optimization strategy is proposed, with the optimization objectives of quickly achieving battery temperature regulation and reducing compressor energy consumption. The proposed control strategy is validated by simulation and a hardware-in-the-loop (HIL) testbed. The results show that the proposed NMPC strategy can control the battery temperature better, that in the holding phase the proposed control strategy reduces the compressor speed variation range by 24.6% compared with PID, and that it reduces the compressor energy consumption by 23.1% in the whole temperature control phase.

1. Introduction

In recent years, due to increasing environmental pollution and the shortage of fossil fuels, intelligent agricultural equipment based on new energy sources has become an important direction for the development of future agricultural production machinery [1]. Batteries, as an important part of the energy system of electric tractors, are responsible for providing electric power for the work of electric tractors, and their performance directly affects the quality of tractor operation [2]. Lithium-ion batteries have the advantages of high power density, high efficiency, environmental protection, a small size, and a light weight, which can be better adapted to the needs of electric tractor operation [3]. Battery performance parameters such as state of charge (SOC), remaining life (RUL), and state of health (SOH) are easily affected by temperature changes [4,5], and studies have shown that the optimal operating temperature of lithium-ion batteries is at 30 °C [6,7], which is lower than the actual operating temperatures of tractor operation of −20 °C–40 °C. Keeping the battery in the applicable operating temperature range is essential for obtaining good battery performance, so a good battery thermal management system (BTMS) is an important way to realize the above requirements.
Battery thermal management systems can be categorized into air-mediated battery thermal management systems, liquid-mediated battery thermal management systems, phase-change-material battery thermal management systems, and heat-pipe battery thermal management systems depending on the heat transfer medium [8]. An air battery thermal management system is simple and inexpensive, but the cooling efficiency is low. Phase-change materials can absorb or release a large amount of heat during the phase-change process, and they can make the target have good temperature uniformity, but the thermal conductivity is very small [9], which is not conducive to heat diffusion and limits the continuous work of the PCM system. A heat pipe has good thermal conductivity and is one of the most effective passive heat transfer technologies [10], but the research on heat pipe technology application still needs to be improved. Liquids have higher heat transfer coefficients, much better heat transfer capacity than air, better adaptability to the environment and working conditions [11,12], and are able to achieve a lower temperature control and better temperature uniformity under the same power consumption conditions [13]. Commercially, liquid-based cooling systems are used by many electric vehicle manufacturers [14], including Tesla, General Motors, and BMW, and have considerable application prospects.
To meet the operating environment and operating time requirements of agricultural production, electric tractors often need to have superior adaptability, reliability, and range [15,16]. Drawing on other vehicle fields, liquid-based battery thermal management systems are more suitable temperature control systems for electric tractors. However, liquid-based battery thermal management systems suffer from high energy consumption due to driving coolant and high compressor loads, which may diminish the range of electric tractors [17,18]. In the liquid thermal management system, the structural design and parameter optimization of the flow channels are one of the effective ways to reduce the energy consumption [19,20]. Dai et al. [21] numerically investigated the performance of cooling plates with different channel shapes of a square battery module under high rate discharge, and analyzed the mechanism of the enhanced heat transfer of the different runner layout schemes in the cooling plates, and the results showed that the acquired layout scheme enhanced the heat transfer capability. Ma et al. [22] introduced an annular channel cold plate for the flow and heat transfer limitation of the traditional straight channel cold plate, and through comparative analysis it was found that the annular channel cold plate has lower pressure drop and better comprehensive performance, and further research found that the annular channel cold plate with a narrow inside and wide outside has better comprehensive thermal performance, which is more suitable for the thermal management of a battery. Wang et al. [23] proposed a BTM (battery temperature management) liquid cooling structure with the arrangement of the flow channel on the battery cells. The performance of four different battery temperature management system structures in terms of cooling efficiency, energy consumption, and other aspects were compared, simulated, and analyzed, and the simulation results showed that the spiral channel structure had the best overall performance compared to other channel structures.
After the system scheme is determined, a good battery thermal management control strategy is another important way to reduce energy consumption. Under the plowing condition, the output power of the electric tractor’s motor is dynamic so it can meet agronomic requirements, resulting in continuous changes in the battery’s discharge current, which in turn causes the heat generated by the battery to vary [24]. Dynamic thermal management control algorithms can prevent over-regulation of the battery temperature and precisely control the compressor speed, thus saving energy. Dynamic control algorithms for battery thermal management systems include proportional integral differential (PID) control [25,26,27], dynamic programming (DP), and model predictive control (MPC) [28,29,30]. Liu et al. [31] introduced a thermal management system integrated with liquid cooling and phase-change material (PCM), and used a hierarchical fuzzy PID control strategy to regulate the coolant flow rate and inlet temperature, which reduced the energy consumption by more than 70% compared with the constant flow rate. Huang et al. [32] utilized a self-tuning PID to accurately control the temperature of the heating film to regulate the heating process of the battery and reduce energy consumption. However, the existing thermal management system using PID algorithm control is usually not divided into temperature control phases, resulting in the same control strategy for different temperature control phases which is unable to adjust the control strategy according to the changes in thermal characteristics of the battery under different operating conditions, and consequently it is difficult to minimize the energy consumption of the thermal management system. Ma et al. [33] propose an iterative dynamic programming (IDP) method for the highly nonlinear and time-varying nature of the battery thermal management system, which iteratively determines the optimal value in a multidimensional search space. Simulation results show that the proposed strategy has high cooling efficiency and can save a lot of energy for the cooling system. Lian et al. [34] proposed a vehicle thermal management control strategy based on a forward dynamic programming algorithm. The economy is improved by optimizing the control trajectory of compressor speed, PTC (positive temperature coefficient) power, and residual heat mode. Fan et al. [35] used battery state of health (SOH), battery SOH difference, and system energy consumption as optimization targets, and air volume and cooling power as control variables. They proposed weight coefficients to couple multiple targets. In order to obtain the optimal set of weight coefficients and calculate the optimal path of the ABTMS that minimizes the total cost of multiple targets, they developed a combined control strategy consisting of dynamic programming and a genetic algorithm, which saved 22.4% of system energy consumption compared with the comparison strategy. Song et al. [36] used a dynamic programming algorithm to optimize the energy management of a hybrid electric vehicle to adjust the battery temperature with the optimization objectives of battery energy consumption and the difference between the battery temperature and the target temperature to achieve energy saving. However, there are more state quantities in the BTMS model, and the computation of DP under global operating conditions in the long time domain is too large, which makes it difficult to be put into practical application. Wang et al. [37] proposed a battery thermal management strategy with model predictive control (MPC) based on the electric vehicle battery thermal management system with thermoelectric cooling. The results illustrate that the MPC strategy is superior to the proportional integral derivative (PID) strategy in terms of both response time and energy consumption. To address the problems that excessively high temperatures may lead to the degradation of fuel cells and an increased auxiliary energy consumption, Varlese et al. [38] introduced a nonlinear predictive control method for thermal management. The results demonstrate that a predictive thermal management strategy can significantly diminish auxiliary consumption by up to 30% compared to classical control strategies across various ambient temperatures without compromising temperature reference control. Ma et al. [39] used nonlinear MPC to regulate the battery temperature based on smart grid-connected electric vehicles, and used vehicle to cloud (V2C) communication to obtain the future vehicle speed information to enhance the regulation effect of the optimization strategy. However, V2C communication can only guarantee the speed prediction accuracy in the short time domain, and it is difficult to fully consider the hysteresis in the heat transfer process in BTMS in the long time domain.
In summary, the air battery thermal management system is characterized by its simplicity and low cost; however, it suffers from low cooling efficiency. In contrast, heat pipes can offer higher cooling efficiency in certain scenarios, while phase-change materials present potential advantages in thermal energy storage. Nonetheless, the incorporation of heat pipes and phase-change materials may introduce challenges related to implementation complexity and overall system cost. The battery thermal management system utilizing a liquid medium offers several advantages, including high heat transfer efficiency and a compact structure. Therefore, this paper focuses on investigating the thermal management system based on a liquid medium. The existing thermal management system uses a PID algorithm, which makes it difficult to adjust the control strategy in time according to the changes in the thermal characteristics of the battery under different operating conditions, and it is difficult to minimize the energy consumption of the thermal management system. Although DP can find the optimal solution in theory, it is computationally expensive in practical applications, especially when the state space is complex. MPC can find the best control strategy by solving the online optimization problem, thereby achieving higher energy efficiency and better dynamic performance. Current research on the thermal management of road vehicle batteries based on MPC strategies mainly obtains future vehicle speed information through V2C communication to improve the adjustment effect of the optimization strategy. However, V2C communication can only guarantee the speed prediction accuracy in the short time domain, and it is difficult to fully consider the lag in the heat transfer process in BTMS in the long time domain, and it is difficult to directly apply it to the application scenarios of the actual operating conditions of electric tractors. At present, there are relatively few research results on power battery thermal management control strategies for actual tractor operating conditions, and a complete theoretical and practical system has not yet been formed. In tractor operation, plowing conditions are a typical common condition which have heavy loads and long duration, which places high demands on the tractor’s battery thermal management system. Therefore, this study chooses to conduct an in-depth discussion on the power battery thermal management system of electric tractors under plowing conditions.
The thermal management system of electric tractors is investigated in this paper, and a nonlinear model predictive control (NMPC) algorithm suitable for the thermal management system of power batteries under plowing conditions is proposed. By predicting the heat generation of the battery, the speed of the compressor is optimized to ensure the rapid attainment of the temperature control objectives for the battery while simultaneously reducing the energy consumption of the compressor. Firstly, a battery electro–thermal coupling model suitable for plowing conditions was constructed, and then the battery thermal management system was analyzed and modeled. Aiming at the difficulty of estimating future plowing resistance information when predicting battery heat generation under plowing conditions of electric tractors, a method based on sliding average theory to predict future working condition information was proposed. A nonlinear model predictive control strategy for cooling optimization is proposed, with the goals of rapidly achieving battery temperature regulation and minimizing compressor energy consumption. The simulation and experimental results are analyzed, and the control strategies are compared. Finally, the conclusion of this study is given.

2. Materials and Methods

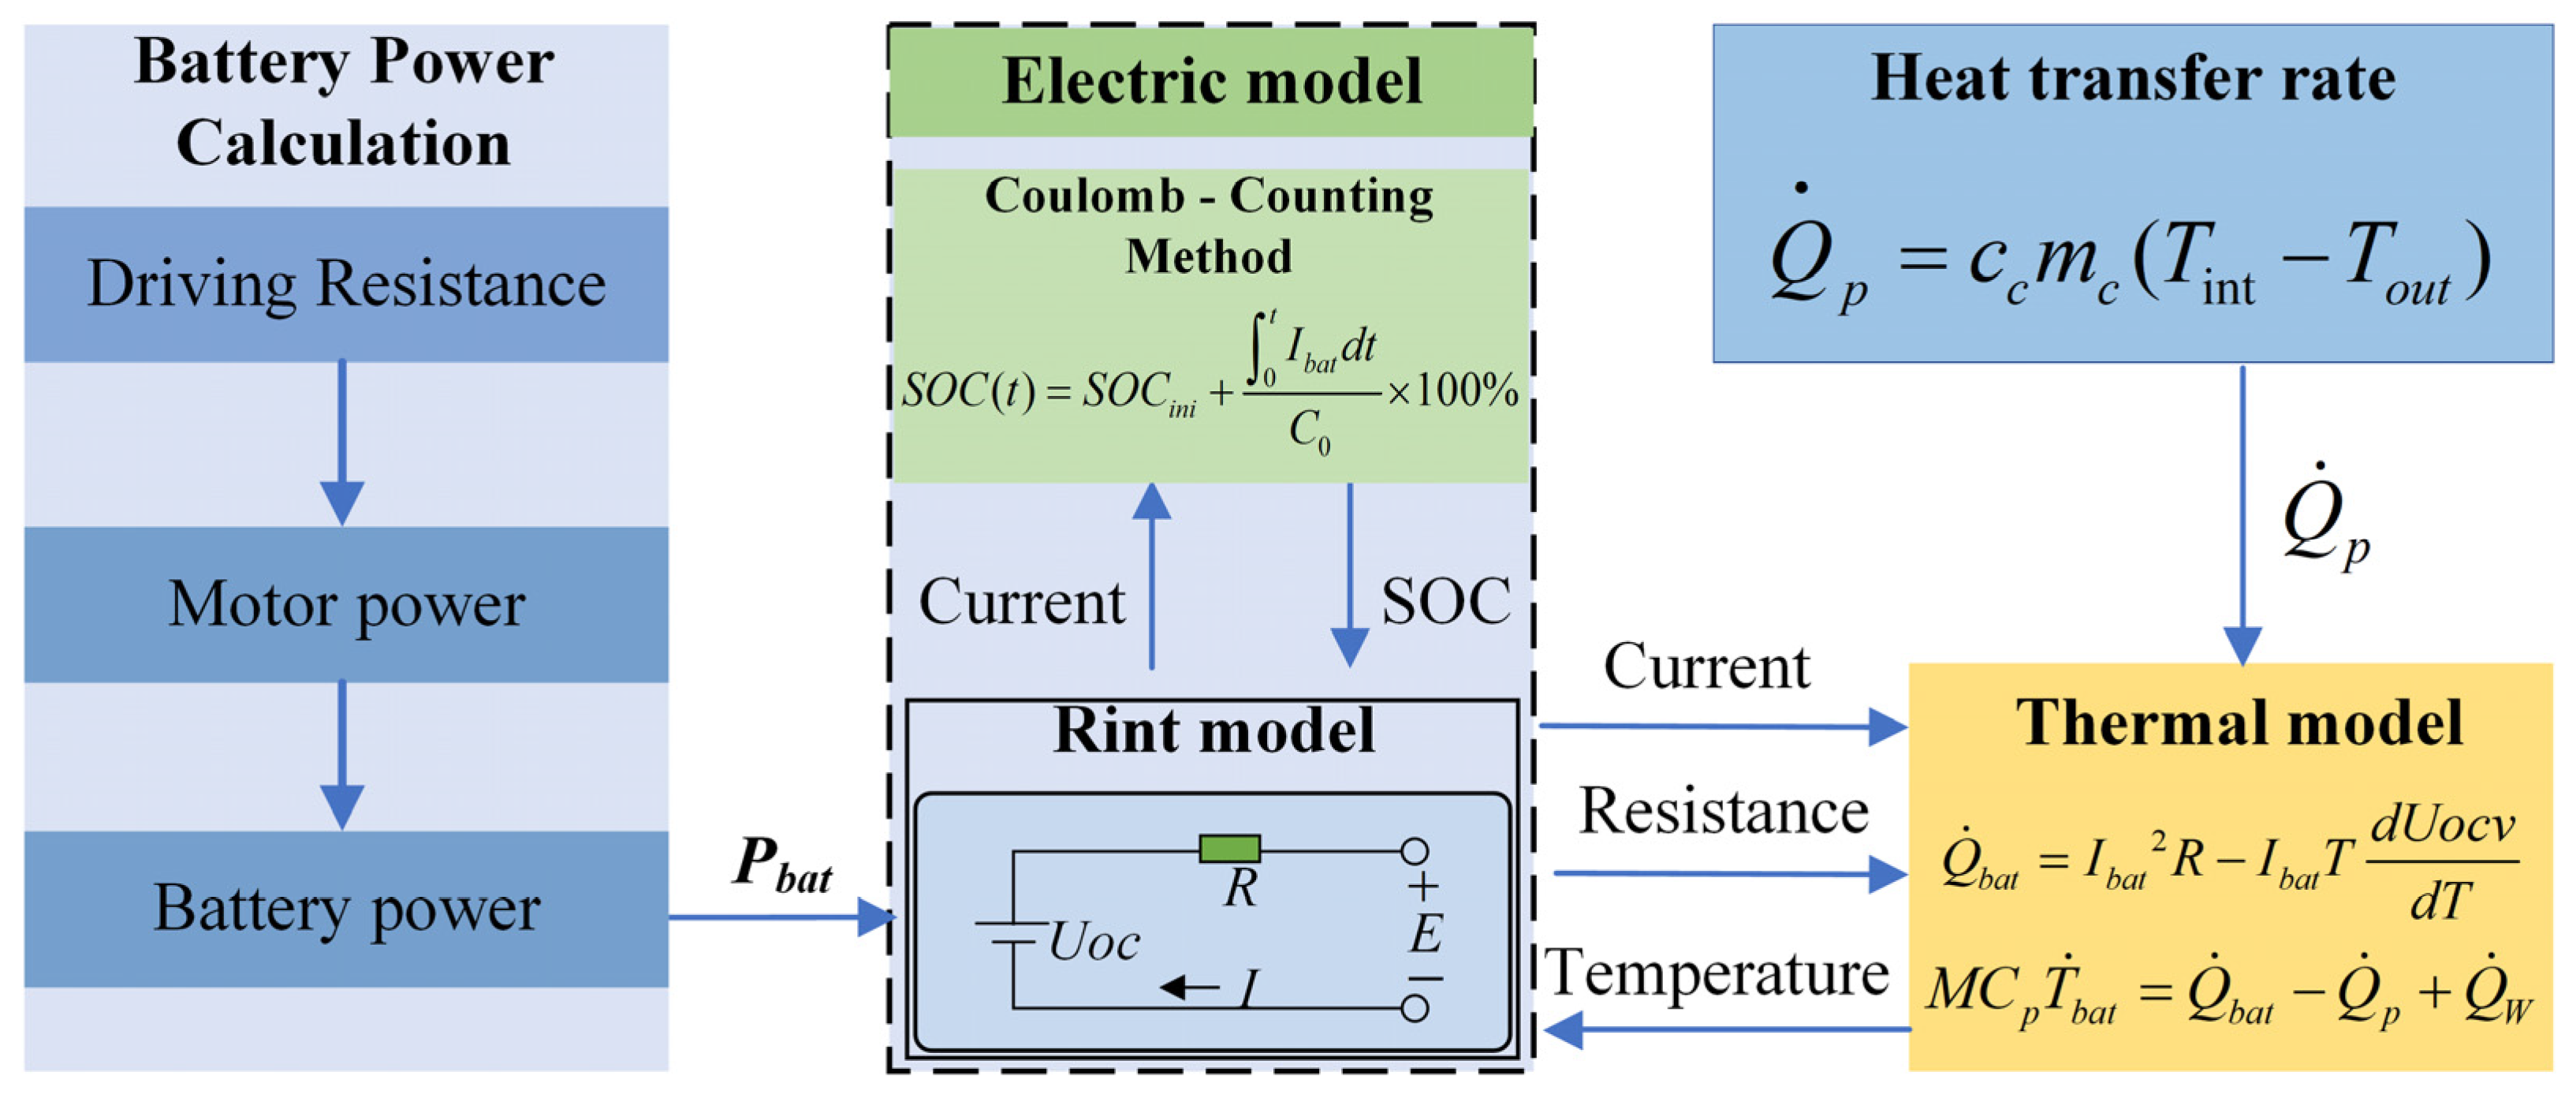
2.1. Battery Electro–Thermal Coupling Model

The battery electro–thermal coupling model studied in this paper is shown in Figure 1, which mainly includes the battery power calculation model, the electric characteristic model, and the thermal characteristic model. The battery current depends on the temperature, state of charge (SOC), and required power. The heating rate of the battery is related to the temperature, SOC, and current.

2.1.1. Battery Power Calculation Model

The power battery provides energy for tractor field operation, and the output power of the power battery is determined by the driving power of the motor. The driving power of the motor is related to the operating conditions of the tractor, and this paper focuses on the tractor plowing operating conditions. In the tractor driving force and driving resistance balance equation it can be seen that the tractor running driving force is equal to the sum of the driving resistance. Tractor plowing conditions driving equation is as follows:
F t = F f + F j + F w + F T N
where Ft denotes the whole machine driving force, N; Ff denotes rolling resistance, N; Fj denotes acceleration resistance, N; Fw denotes air resistance, N; and FTN denotes plowing resistance, N.
The power demand at the input of the tractor motor under plowing conditions is as follows:
P r e q = F t v / η r
The output power of the battery is determined by the power of the tractor drive motor, which is as follows:
P b a t = P r e p

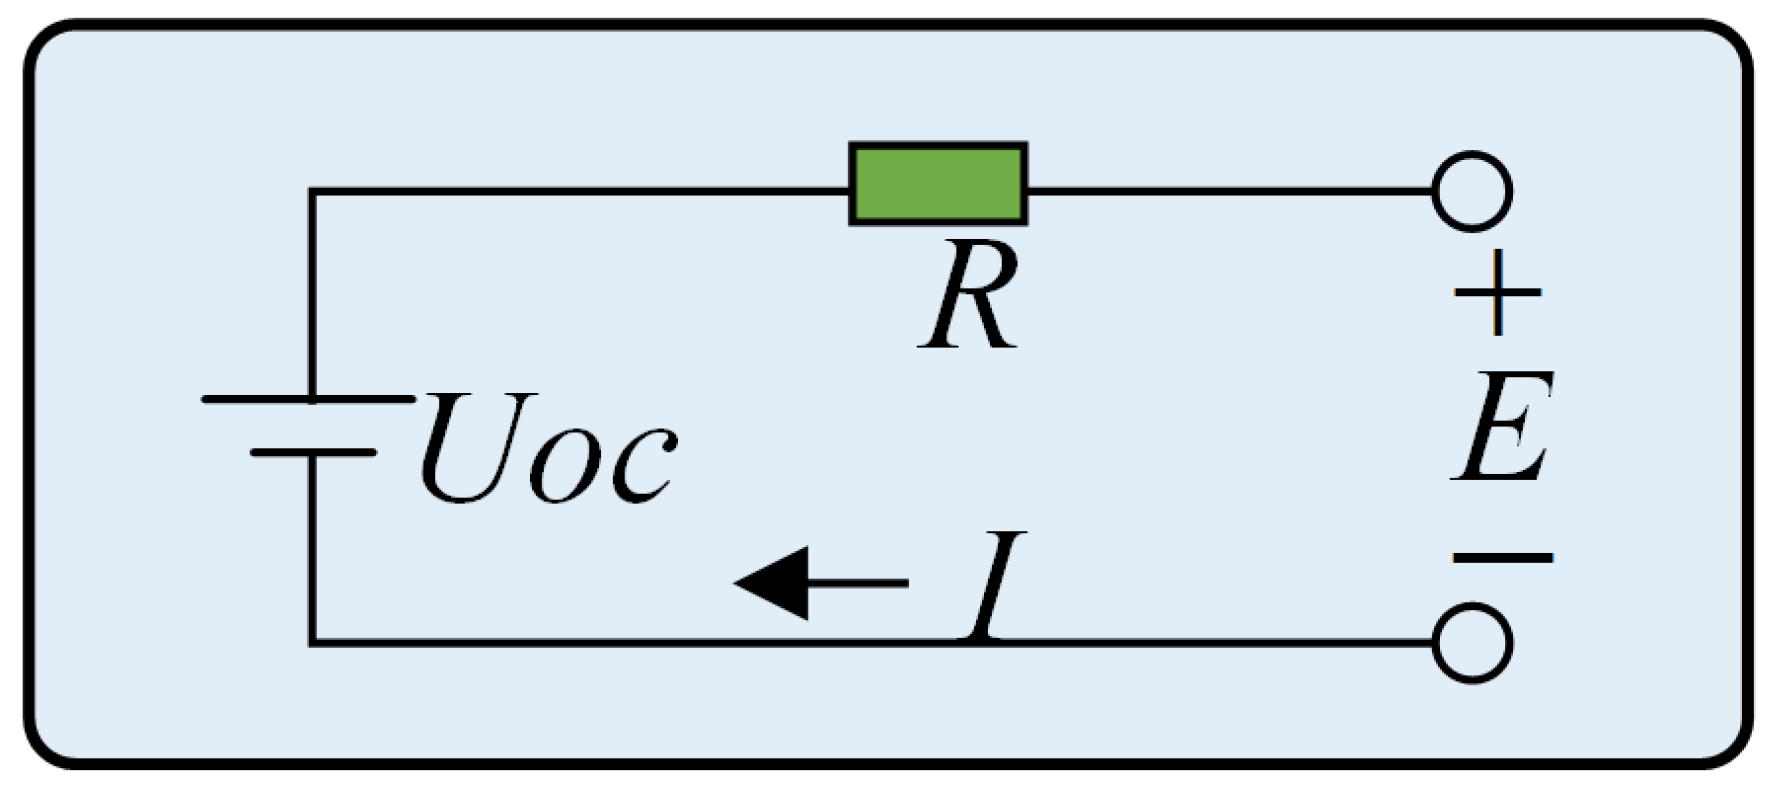
2.1.2. Electrical Model

The equivalent internal resistance model (Rint model) used in this study consists of an ideal voltage source representing the open-circuit voltage of the battery, UOCV, and an equivalent resistance representing the total internal resistance of the battery, R. The specific circuit structure of the model is shown in Figure 2.
The voltage characteristic equation of the battery is as follows:
U b a t = U o c v I b a t R
where Ubat denotes the battery voltage, V; Uocv denotes the open-circuit voltage of the battery, V; Ibat denotes the battery current, A; R denotes the internal resistance of the battery, Ω.
The entire loop current is as follows:
I b a t = U o c v U o c v 2 4 R b a t P b a t 2 R b a t
The real-time SOC of the Li-ion battery is calculated using Equation (6), which is as follows:
S O C ( t ) = S O C i n i + 0 t I b a t d t C 0 × 100 %
where SOCini represents the initial SOC value of the battery; C0 is the actual capacity of the battery, Ah.

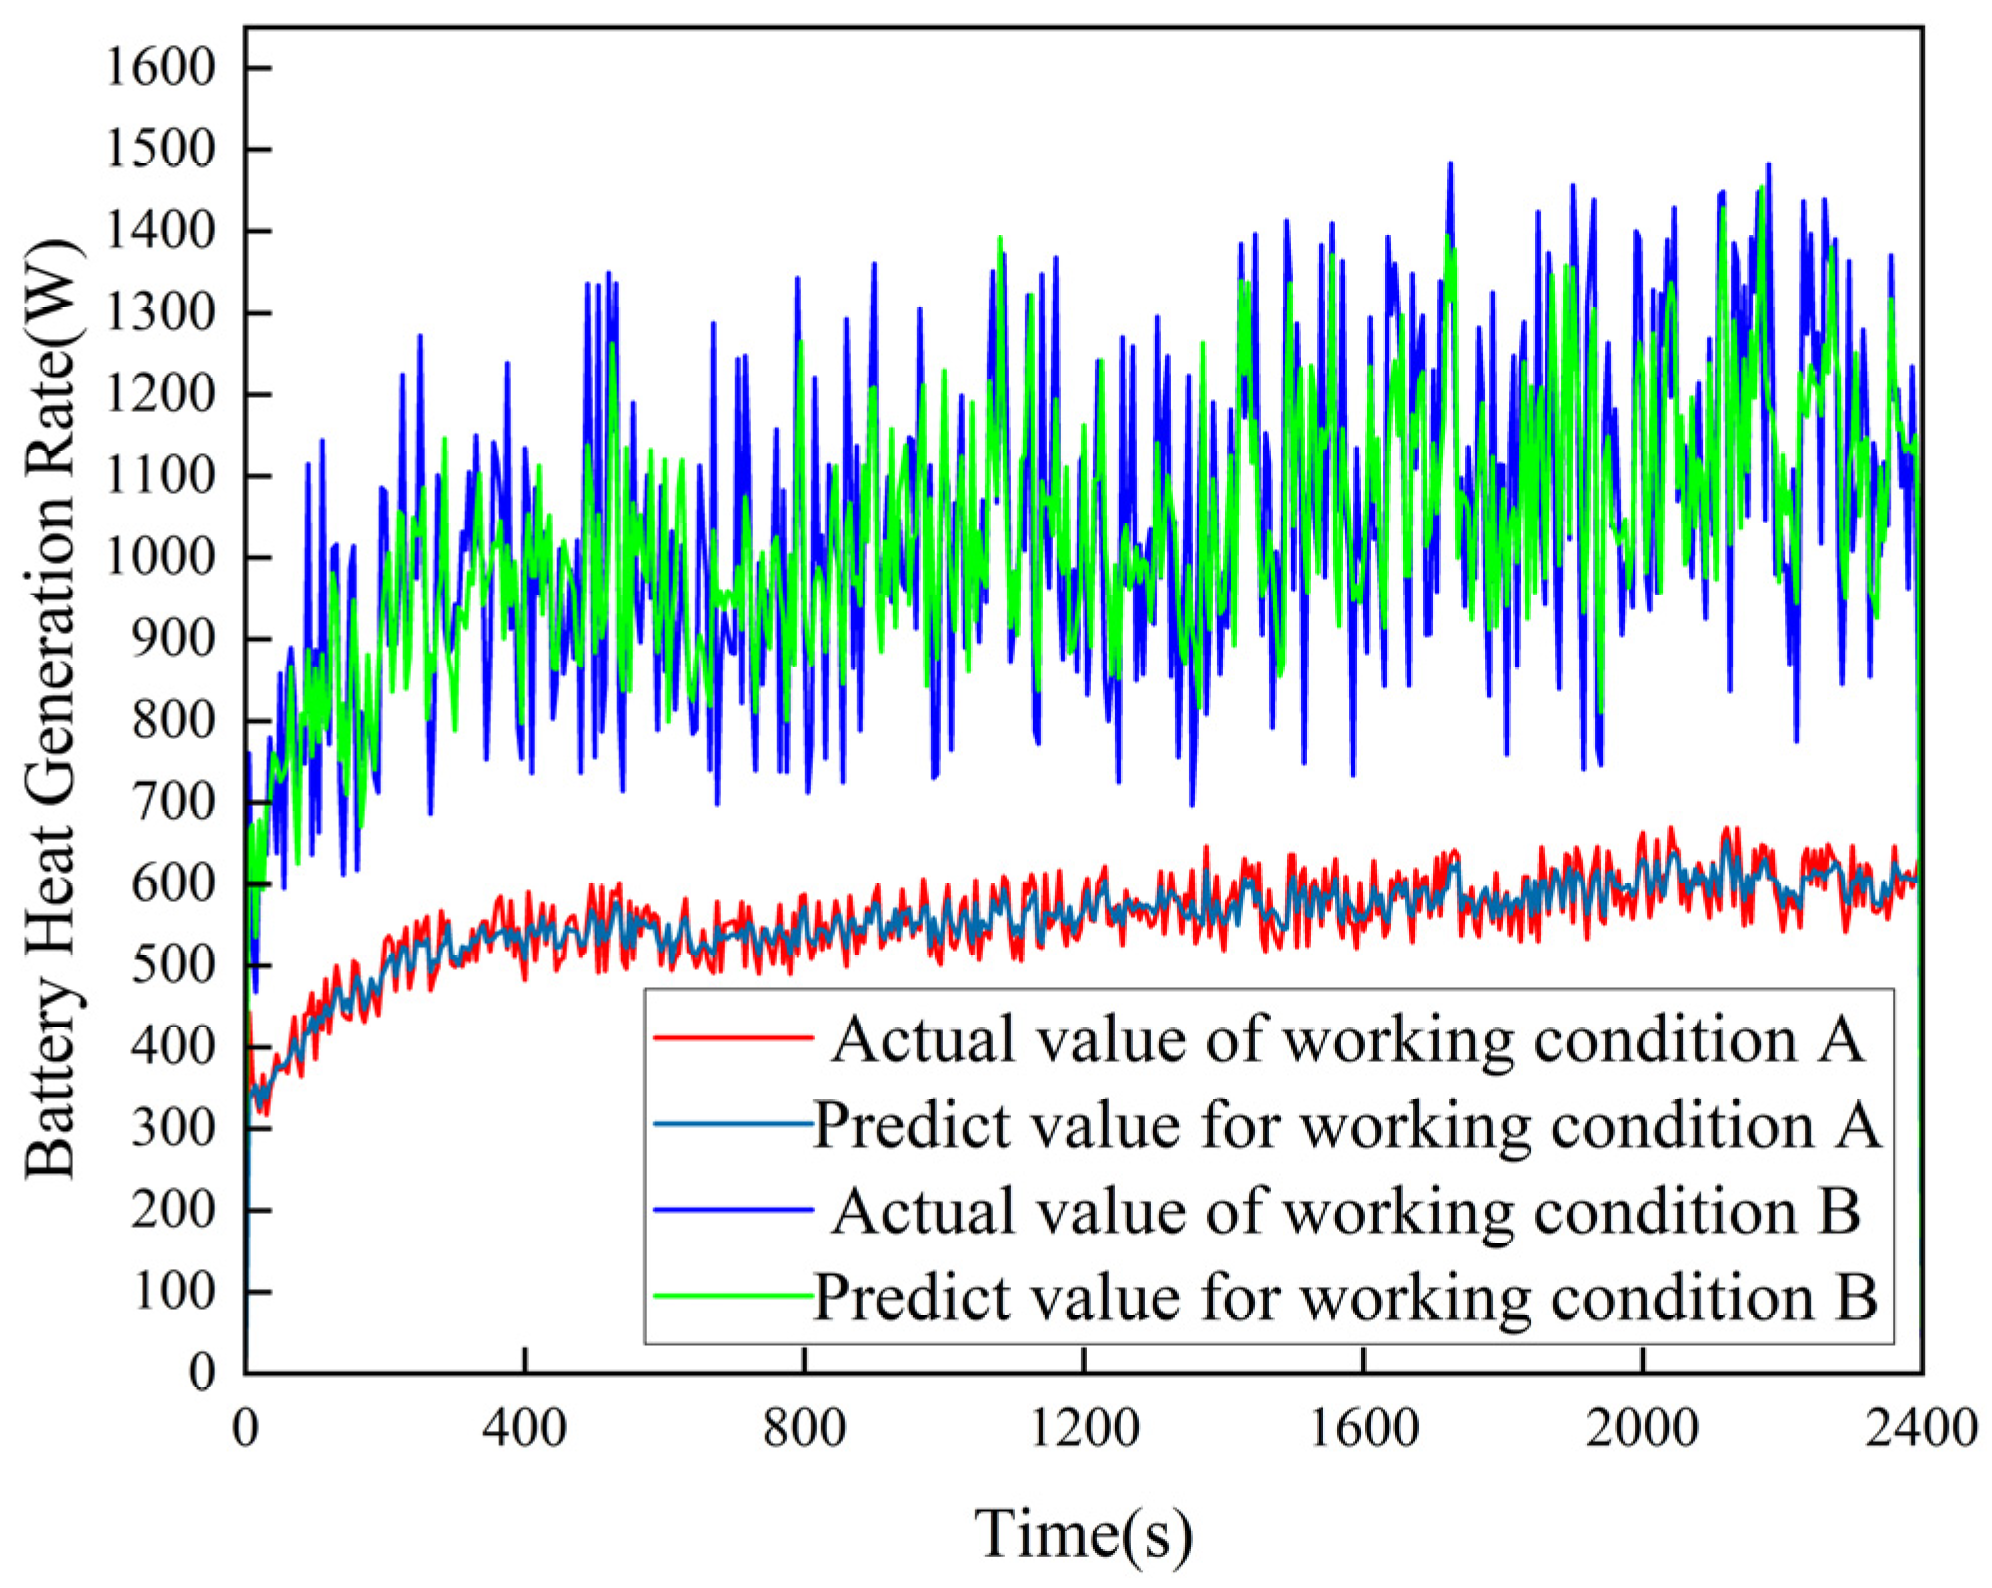
2.1.3. Battery Heat Production Rate Modeling

The battery heat production model is very important for estimating the temperature variation in the battery, and from the Bernadi’s model [40] the heat production power of the battery pack can be expressed as follows:
Q ˙ b a t = I b a t 2 R I b a t T b a t d U o c v d T b a t

2.2. Battery Thermal Management System Modeling

The battery thermal management system (BTMS) studied in this paper includes a coolant circuit module, a refrigerant circuit module, and a control module. Among them, the coolant circuit includes the following: a water pump, water-cooled plate, plate heat exchanger coolant circuit flow path. The water pump serves as the power source for coolant circulation in the coolant circuit, driving the coolant to flow in the circuit. The high-temperature coolant in the loop passes through the plate heat exchanger and exchanges heat with the refrigerant to become low-temperature coolant, and the low-temperature coolant flows through the power battery cooling plate to exchange heat with the battery. In the refrigerant circuit, the refrigerant completes the vapor compression refrigeration cycle and exchanges heat with the coolant through the plate heat exchanger to reduce the temperature of the coolant. The battery thermal management system is shown in Figure 3, The arrow indicates the direction of the cooling medium flow.

2.2.1. The Coolant Circuit Model

The coolant circuit in this study consists of a coolant channel inside the battery cold plate, a pump, and a coolant flow channel inside the heat exchanger with the plate. The main function of the coolant circuit is for the coolant, driven by the pump, to flow through the coolant flow channels inside the power cell, take away the heat from the power cell, and exchange heat with the refrigerant in the refrigeration cycle circuit through the heat exchanger.
The battery pack is modeled as a lumped model. In this paper, it is assumed that the temperature distribution of the battery pack is homogeneous, and the battery temperature variation can be calculated by the following equation [41]:
M b a t C p T ˙ b a t = Q ˙ b a t + Q ˙ p + Q ˙ W
where Mbat denotes the mass of the battery, kg; Cp denotes the specific heat capacity of the battery module, J/K; Q ˙ p is the heat transfer rate between the cooling plate and the battery, W; Q ˙ w denotes the heat transfer rate between the battery and the external environment, W.
According to the law of heat balance, in the heat exchange process the heat released by the high-temperature substance is equal to the heat absorbed by the low-temperature substance. Therefore, the heat balance of the coolant in the battery pack is expressed as follows:
c c m c ( T i n T o u t ) = K g S g ( T o u t T i n ) ln ( T b a t T i n ) ln ( T b a t T o u t )
where cc is the specific heat capacity of the coolant, J/(kg °C); mc is the mass flow rate of the coolant, kg/s; Kg denotes the heat transfer coefficient between the battery pack and the coolant, W/(m2 k); Sg denotes the contact area between the battery pack and the coolant, m2; and Tin and Tout denote the temperature of the coolant at the inlet and outlet of the cold plate of the battery pack, respectively, in °C.
The coolant mass flow rate is related to the pump speed and can be expressed by the formula:
m c = η p V p N p u m p ρ c
where ηp is the volumetric efficiency of the pump; Vp denotes the displacement of the pump, m3·r−1; Npump denotes the rotational speed of the pump, r·min−1; and ρc denotes the inlet suction density of the pump, kg·m−3.
The heat transfer rate Q ˙ p is expressed as follows:
Q ˙ p = c c m c ( T i n T o u t ) = c c m c T i n ( T i n T b a t ) e k g S g c c m c + T b a t
According to Equations (8)–(11), the temperature change in the battery is expressed as follows:
T · b a t = I b a t 2 R I b a t T b a t d U o c v d T b a t M b a t C b a t + c c m c T i n ( T i n T b a t ) e k g S g c c m c + T b a t + Q ˙ w M b a t C b a t

2.2.2. Heat Exchanger Model

It is assumed that when the coolant circuit exchanges heat with the refrigerant circuit, the excess heat is used to change the temperature of the heat exchanger and there is no other heat loss. According to the law of conservation of energy, the heat exchange in the heat exchanger during the entire heat transfer process is expressed by the following equation [41]:
C p T ˙ p = Q ˙ c p + Q ˙ r e f
where Cp denotes the heat exchanger heat capacity; Q ˙ c p is the heat transfer rate from the coolant circuit to the heat exchanger, in W; Q ˙ r e f is the heat transfer rate from the refrigerant circuit to the plate heat exchanger, in W.
The heat transfer from the circuit coolant to the heat exchanger in the heat exchanger is written as follows:
Q ˙ c p = c c m c ( T o u t T p , o u t ) = K p S p ( T o u t + T p , o u t 2 T p )
where Kp is the heat transfer coefficient between the coolant and refrigerant in the heat exchanger; Sp is the contact area between the coolant and refrigerant in the heat exchanger.
Heat exchanger temperature variations can be written as follows:
T · p = c c m c C p K p S p ( T o u t T p ) c c m c + 0.5 K p S p + Q ˙ r e f C p

2.2.3. Refrigerant Circuit Model

In high-temperature working conditions, the temperature of the power battery in the operation process will be due to its own high rate of heat production, resulting in the heating of the coolant if the process of heat exchange with the battery in the temperature increase rate is too fast. In the next cycle of the heat transfer stage, when the cooling efficiency of the attenuation, the refrigerant of the heat exchanger refrigerant channel can effectively absorb the heat carried by the high-temperature coolant, prompting the high-temperature coolant temperature to be reduced, ensuring that the cooling effect of the coolant circuit can be maintained.
The refrigerant circuit is connected to the cooling fluid circuit through a heat exchanger model, thereby forming an integrated system that adheres to the law of energy conservation. In this system, the refrigerant exchanges heat with the cooling fluid in the heat exchanger, facilitating the transfer and conversion of thermal energy, resulting in a decrease in the temperature of the cooling fluid while the temperature of the refrigerant correspondingly increases. This entire process is consistent with the first law of thermodynamics [42]. The performance of the refrigerant circuit is calculated using thermal analysis. To simplify the calculation, the following assumptions are made:
Compressor volumetric efficiency is taken as 0.6; isentropic efficiency is taken as 0.75; mechanical efficiency is taken as 0.9; and the system suction superheat is 5 °C and subcooling is 3 °C.
The methods [42] for calculating the refrigerant mass flow rate, the enthalpy at the compressor outlet, and the mechanical power of the compressor in the compressor model are shown in Equations (16)–(18), which are as follows:
m ˙ c o m p = η v N V d i s ρ 1
h 2 = h 1 + h 2 , s h 1 η s
W c o m p = m ˙ c o m p ( h 2 h 1 ) η m
where m ˙ c o m p is the refrigerant mass flow rate; ηv indicates the volumetric efficiency of the compressor; ηs indicates the isentropic efficiency of the compressor; N indicates the rotational speed of the compressor, r·min−1; V d i s indicates the displacement of the compressor, m3·r−1; ρ 1 indicates the suction density of the compressor inlet, kg·m−3; h 1 indicates the inlet enthalpy of the compressor, J·kg−1; h 2 indicates the outlet enthalpy of the compressor, J·kg−1; h 2 , s indicates the isentropic compression enthalpy of the compressor, J·kg−1.
The cooling capacity Q ˙ r e f of the refrigeration system is calculated as shown in the following equation:
Q ˙ r e f = m ˙ c o m p ( h 3 h 2 )
The refrigerant selected was R134a [37], and its physical parameters were queried and controlled by the AMESim 2310 software.

2.3. Battery Thermal Management System Model

Analyzing the mathematical model formula of the battery thermal management system, it can be seen that the battery thermal management system has the characteristics of nonlinearity, hysteresis, and time-varying parameters, which brings difficulties to the design of the control system. In order to make the thermal management system operate efficiently and stably, the corresponding battery temperature controller is designed for the battery thermal management system based on the constructed battery thermal management system model.

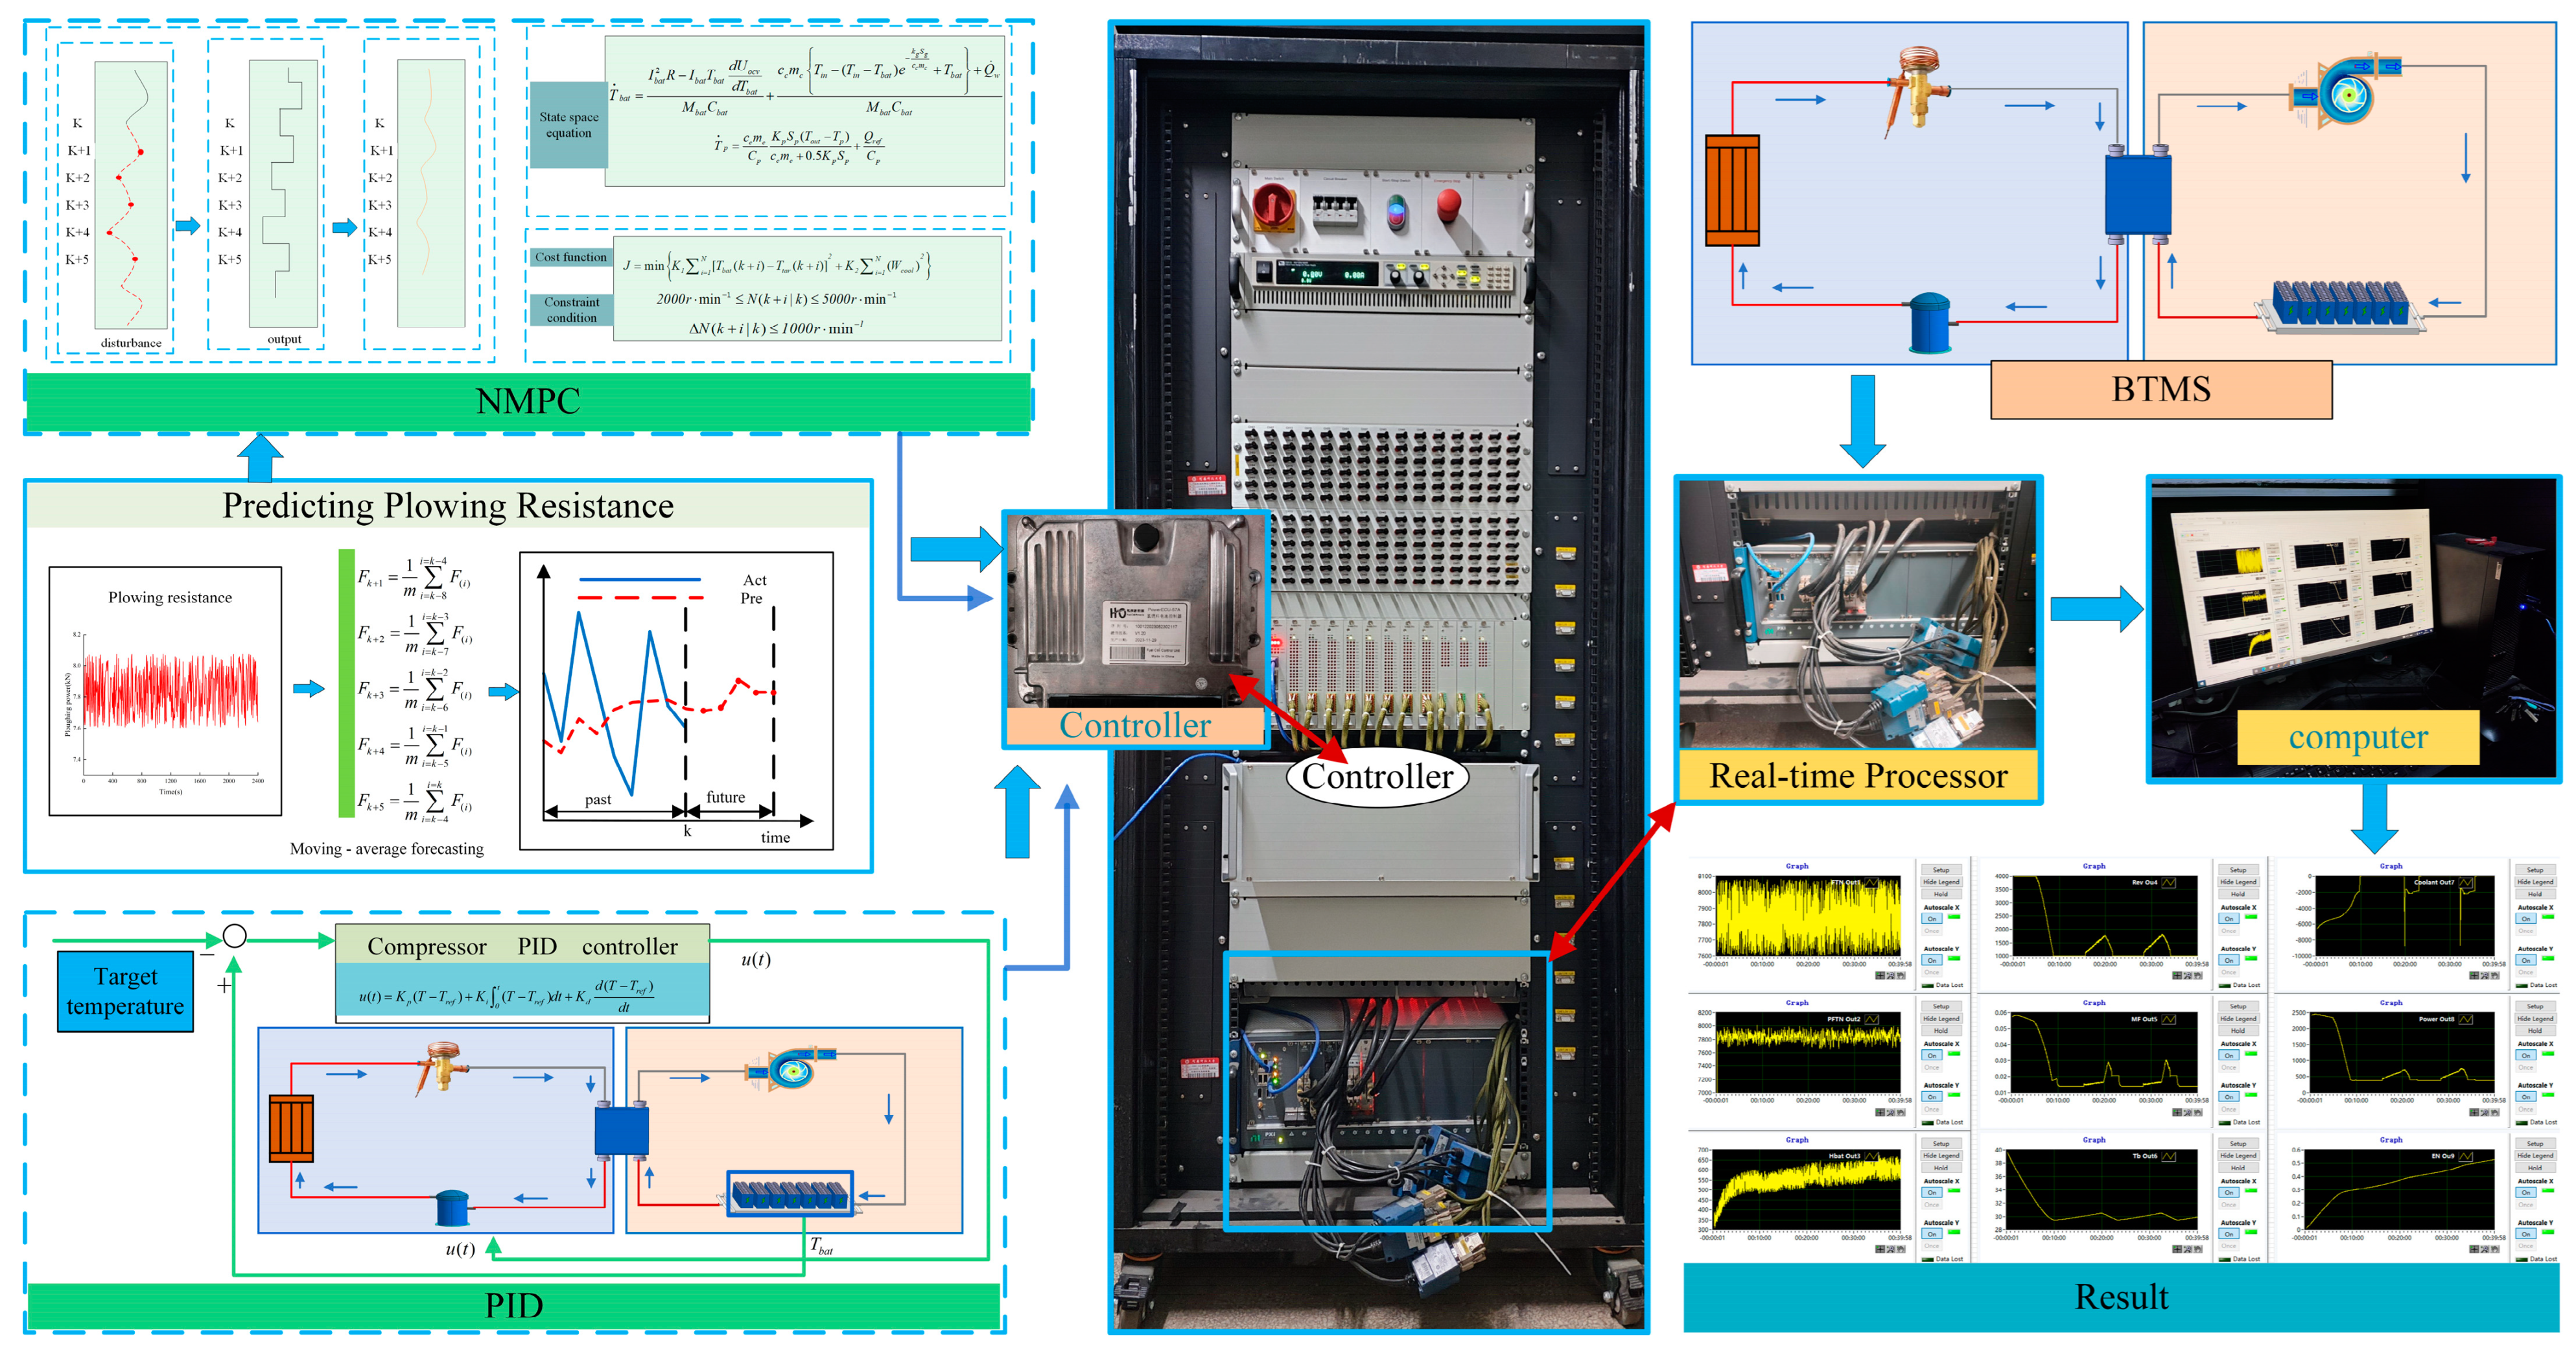
2.3.1. Temperature Control Strategy of Battery Thermal Management System Based on NMPC

Aiming at the nonlinear, time-varying, and strongly coupled characteristics of the battery thermal management system, this study proposes an optimization method to change the battery temperature by adjusting the compressor speed based on the NMPC strategy. The future plowing resistance information obtained based on the moving average window theory is introduced into the battery temperature prediction as well as the regulation process. The battery temperature regulation process is shown in Figure 4. When the electric tractor performs plowing operation, the future plowing resistance of the tractor is predicted based on the moving average window theory in the plowing resistance prediction layer. Then, in the NMPC optimization process, the effect of plowing resistance on battery heat production is determined based on the future plowing resistance. Taking the difference between the target temperature and the actual temperature of the battery in the battery thermal management system and the minimization of thermal management energy consumption as the optimization objectives, the optimal control variables are solved by using NMPC to realize the battery temperature control.
The battery temperature and heat exchanger temperature Equations (12) and (15) can be written as following nonlinear models:
x ˙ = f ( x , u , d ) y = C x
where x denotes the state variable x = [ T b a t , T p ] T , corresponding to the battery temperature and heat exchanger temperature of the battery thermal management system; u denotes the control variable u = [ N ] T , corresponding to the compressor rotational speed; d denotes the perturbation, d = F T N T , corresponding to the plowing resistance; y denotes the output variable y = [ W c o m p ] T , corresponding to the compressor mechanical power.
Due to the highly nonlinear nature of the performance calculation of the refrigerant circuit and the need to repeatedly use external software for physical property queries, online optimization can be unable to perform the task, which is not conducive with the subsequent controller design. Therefore, in this study, a quadratic fitting is used to obtain the relationship between the refrigerant circuit’s unit time cooling capacity, compressor speed, compressor mechanical power, and heat exchanger temperature. The expressions are shown in Equations (21) and (22), which are as follows:
Q r e f = α + α 1 N + α 2 * T P + α 3 N 2 + α 4 N T P + α 5 T P 2
W r e f = β + β 1 N + β 2 * T P + β 3 N 2 + β 4 N T P + β 5 T P 2
where N denotes the compressor speed; Tp denotes the heat exchanger temperature; α , α 1 , α 2 , α 3 , α 4 , and α 5 denote the coefficients of the fitted expression (21); and β , β 1 , β 2 , β 3 , β 4 , and β 5 denote the coefficients of the fitted expression (22).
In the NMPC design process, the state variables are battery temperature and heat exchanger temperature, the control variable is the compressor speed, the output variable is the compressor mechanical power, and the perturbation variable is the plow resistance. The continuous state–space expression is discretized to lay the foundation for the subsequent state prediction. In the actual control process, the controller collects the state, action, and perturbation quantities of the system at a fixed sampling time, solves the optimization problem, and outputs the control signal. The rate of change in discrete state variables are as shown in Equations (23) and (24):
x ˙ ( k + 1 ) = f ( x ( k ) , u ( k ) Δ t + x ( k ) )
y ( k ) = C x ( k )
where k denotes a certain moment, k + 1 denotes the next moment, Δ t denotes the discrete time step, and the discrete time step is chosen to be 1 s. Using the discrete state–space expression equations, an online prediction can be made for the future N steps of the system state variable x and output variable y based on the collection of (x,u,d) values at the current moment, where N is called the prediction time domain and 5 steps of prediction are chosen in this study.
In this study, the battery thermal management system is taken as the optimization object, and the primary objective is to ensure that the temperature regulation objective is achieved, whilst at the same time the energy consumption of the thermal management system is reduced as much as possible. The cost function and constraint expressions are shown in the following equations:
J = min K 1 i = 1 N [ T b a t ( k + i ) T t a r ( k + i ) ] 2 + K 2 i = 1 N ( W cool ) 2
2000 r min 1 N ( k + i   |   k ) 4000 r min 1
Δ N ( k + i   |   k ) 1000 r min 1
where T t a r is the battery target temperature; K 1 , K 2 is the weighting factor. In Equation (25), the first term on the right side of the objective function indicates the deviation of the battery temperature from the target temperature, which is used to regulate the battery temperature. The second term indicates the energy consumption of the battery thermal management system, and the smaller value indicates the lower energy consumption in the battery temperature regulation process. In Equations (26) and (27), it denotes the upper and lower compressor speed constraints and the compressor speed variation constraint.

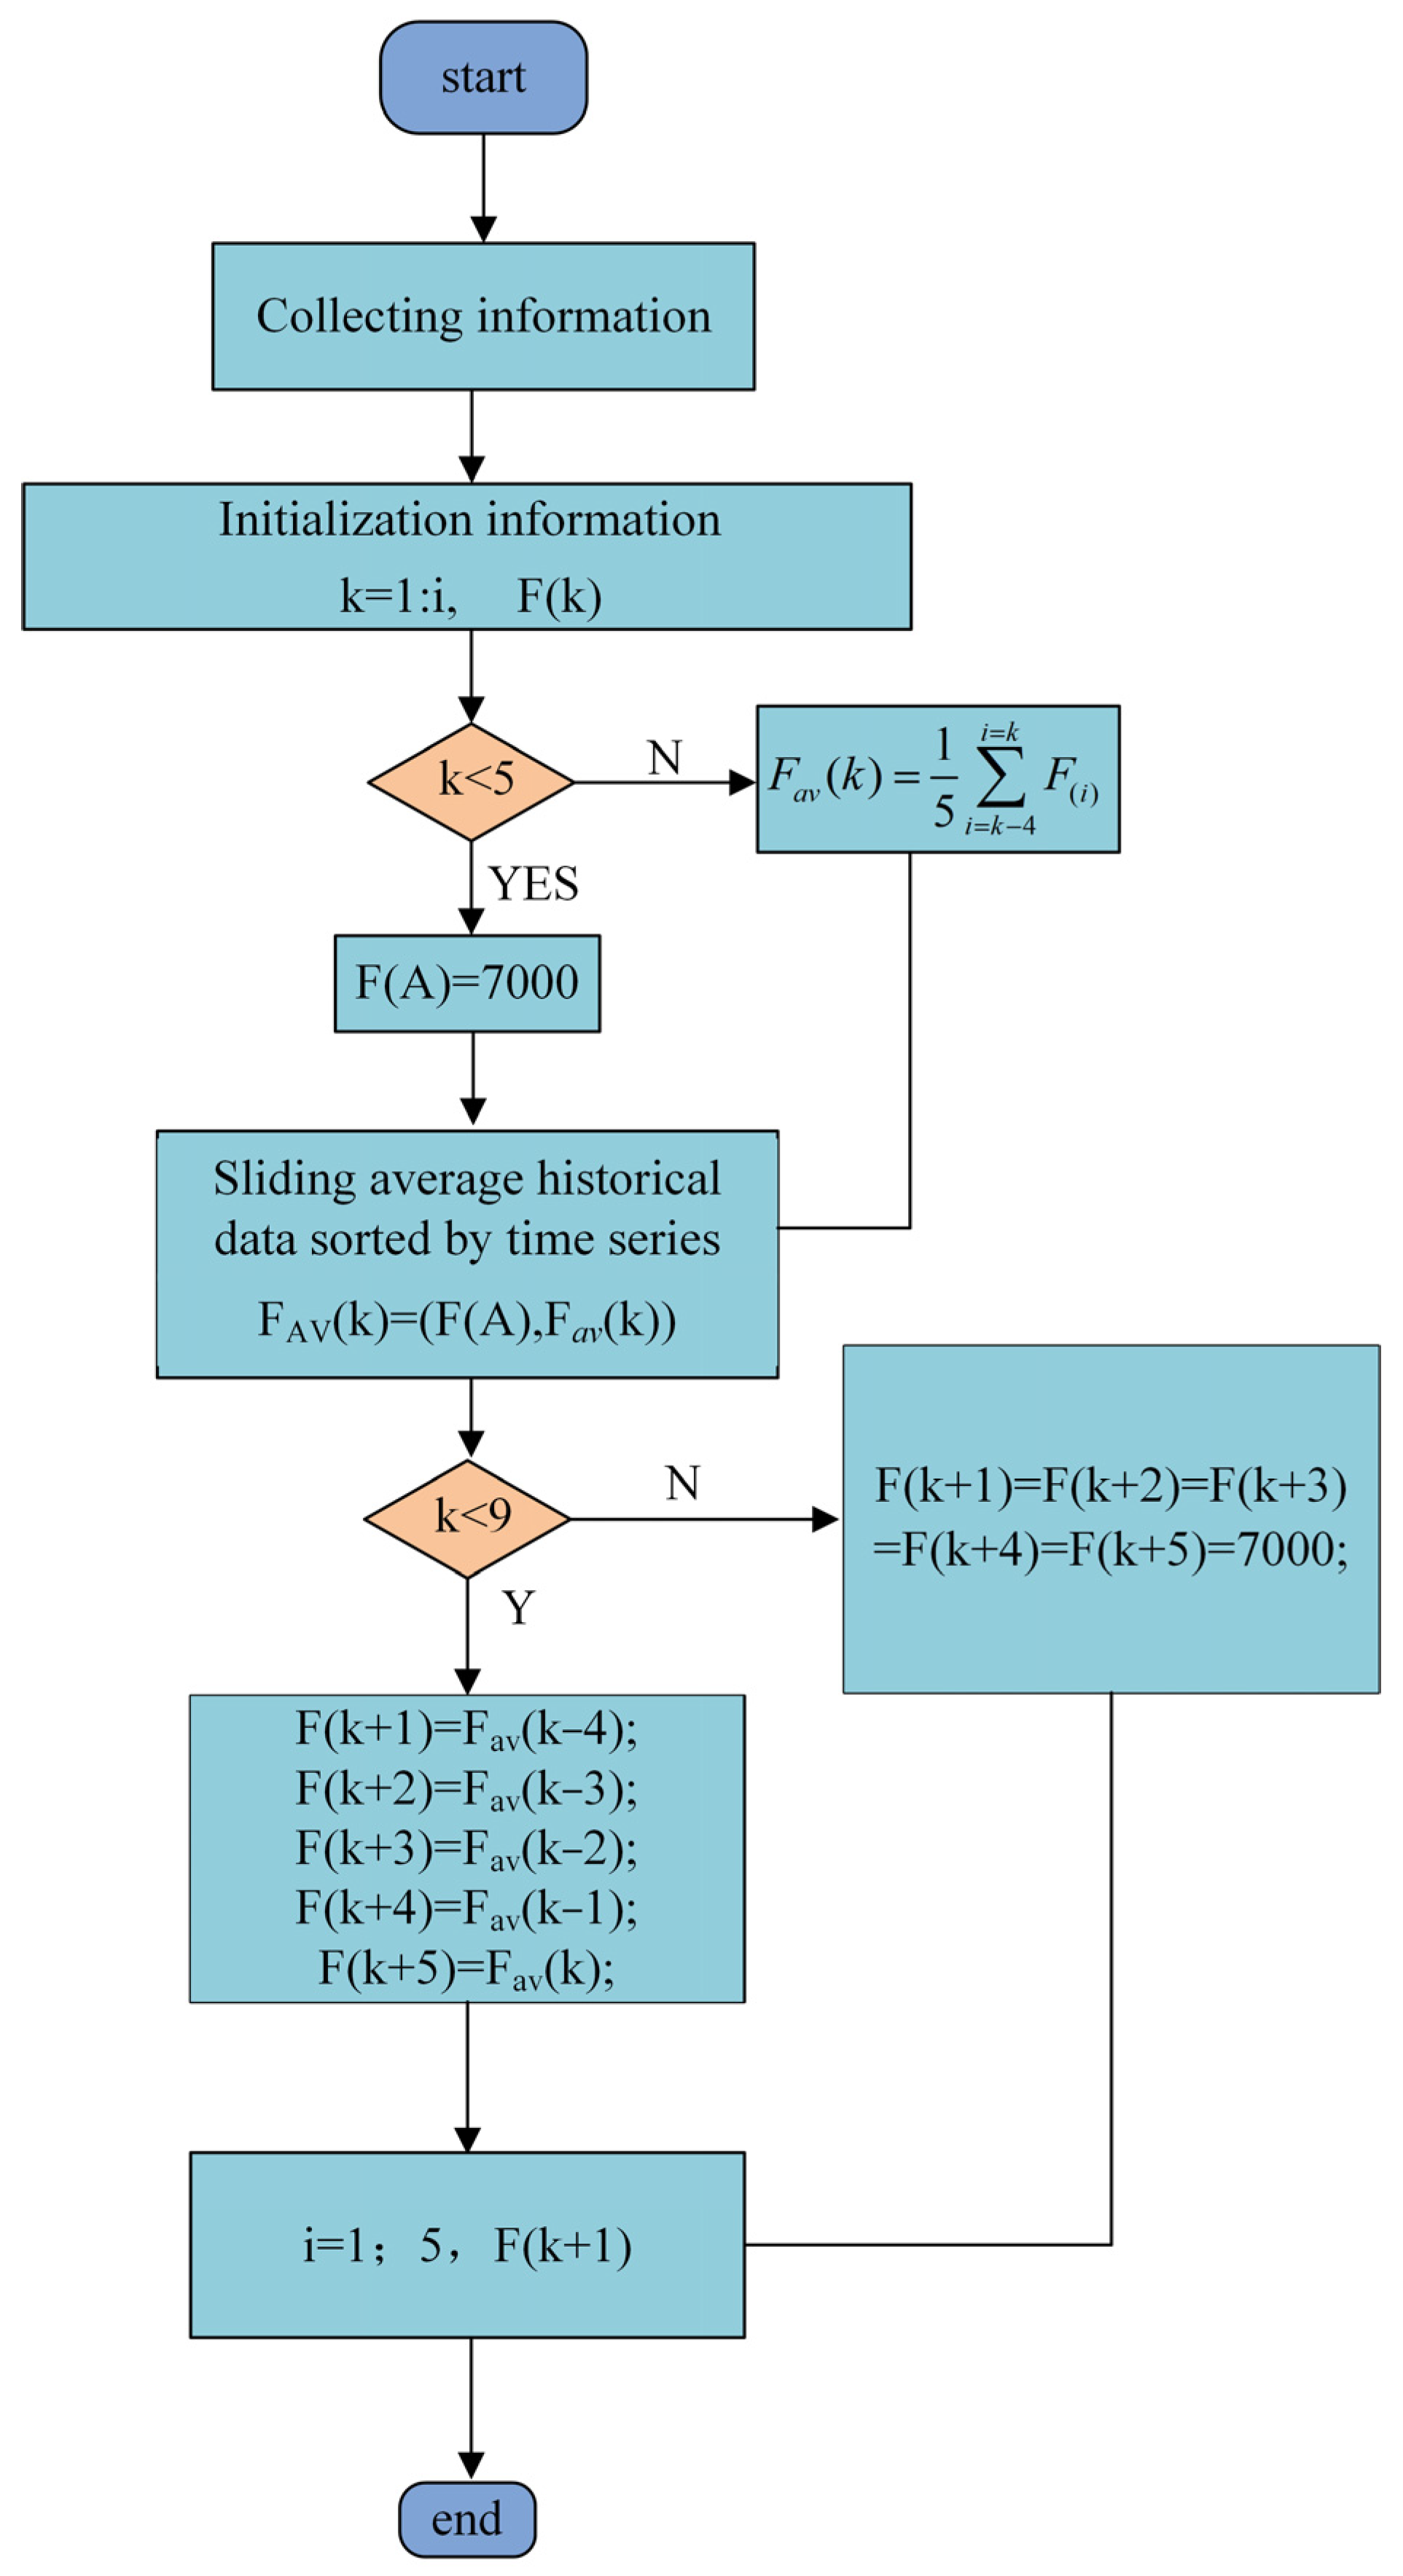
2.3.2. Prediction of Plow Resistance Based on Moving Average Window Theory

When an electric tractor performs plowing operation, the plowing resistance occupies the largest proportion of the total driving resistance. Combined with the electro–thermal coupling model presented in Section 2.1, it can be seen that the magnitude of the plowing resistance is the main factor affecting the heat production of the battery. Therefore, the future plowing resistance data are introduced into the system model to examine their effect on battery temperature regulation. The transmission process of plowing resistance information in the prediction process is shown in Figure 5.
The plowing resistance of a tractor during plowing operation has high variability and randomness. In this study, which proposes a plowing resistance prediction method based on the moving average theory, the prediction information is input into a nonlinear prediction model to assist in the prediction of battery heat production. The plowing resistance of the tractor during plowing operation is read from the sensors and the collected data are passed to the plowing resistance prediction model to predict the plowing resistance for five steps after the k moment. Here, the plowing resistance prediction model predicts the magnitude of the plowing resistance at moments k + 1 to k + 5 using data prior to moment k, and inputs the results obtained from the prediction as a perturbation into the nonlinear model prediction controller. The equation for prediction of plowing resistance is shown in the following equation:
F k + 1 = 1 m i = k 8 i = k 4 F ( i )
F k + 2 = 1 m i = k 7 i = k 3 F ( i )
F k + 3 = 1 m i = k 6 i = k 2 F ( i )
F k + 4 = 1 m i = k 5 i = k 1 F ( i )
F k + 5 = 1 m i = k 4 i = k F ( i )
where F ( i ) denotes the historical plow resistance captured by the sensor; m denotes the length of the window, where m is taken as 5, corresponding to the length of the window being 5 steps.
The specific prediction process of plow resistance is as follows, and the corresponding prediction flowchart is shown in Figure 6:
The first step acquires the plowing resistance information through the sensor, the second step initializes the information and arranges the plowing resistance information according to the time sequence, and the third step determines whether the current calculation step is less than 5. If the judgment result is yes, the output result is set as F(A) = 7000; if the judgment result is no, the plowing resistance Fav(k) is the output. The fourth step arranges the output result of the third step according to the time order to obtain the data set FAV(k). The fifth step is to judge whether the number of calculation steps is less than 9, and if the judgment result is yes then the output result is set as: i = 1:5, F(k + i) = 7000; if the calculation result is judged as no, the output is F(k + 1) = FAV(k − 4), F(k + 2) = FAV(k − 3), F(k + 3) = FAV(k − 2), F(k + 4) = FAV(k − 1), F(k + 5) = FAV(k). Finally, the prediction results are input into the system model of the NMPC predictive controller as perturbation information to improve the accuracy of the battery heat production prediction.

2.3.3. PID-Based Temperature Control Strategy for Battery Thermal Management System

PID control is calculated according to the controlled object of the real-time data collected information, and the given value is compared to the error generated by the proportional, integral, and differential control. The PID controller used in this paper uses the compressor speed feedback to control the battery temperature and to realize the temperature control of the battery cooling system. The expression is shown in the following equation:
u ( t ) = K p ( T T r e f ) + K i 0 t ( T T r e f ) d t + K d d ( T T r e f ) d t
where T indicates the actual temperature of the battery, °C; T r e f indicates the target temperature of the battery, °C.

3. Results and Discussion

3.1. Simulation Verification

To validate the effectiveness and superiority of the nonlinear model predictive control (NMPC)-based battery thermal management strategy under plowing conditions, a battery thermal management system model was established in the MATLAB/Simulink and Amesim platforms. The optimization effects of different control strategies were compared to evaluate their performance.
The simulation model in this article is built on a computer system equipped with a 12th Gen Intel(R) Core(TM) i5-12500H 2.50 GHz and 32 GB RAM memory, using MATLAB/Simulink 2022a and Amesim2310 environment. The hardware configuration and software environment provide sufficient computing performance and memory capacity to support the operation of complex simulation models.
The tractor plowing condition is selected as the tractor simulation test condition. The tractor plowing resistance is set as shown in Figure 7, with the plowing resistance fluctuating at 7.8 KN, the highest resistance reaching 8.07 KN, and the lowest resistance reaching 7.61 KN. The traveling speed is shown in Figure 8, with the speed fluctuating at 6.75 km/h, the highest speed reaching 6.9 km/h, and the lowest speed reaching 6.6 km/h. The setup is divided into two phases and the simulation process is divided into two stages. In the latter the battery temperature initially drops from 40 °C down to 30 °C due to the rapid cooling stage, and the battery temperature changes around 29.5 °C~30.5 °C as it is in the temperature maintenance stage. When the battery temperature is greater than 30 °C, the water pump speed is 1400 rpm, corresponding to the coolant mass flow rate of 0.371 kg/s. When the battery temperature is less than 30 °C, the water pump speed is 65 rpm, corresponding to the coolant mass flow rate of 0.015 kg/s. The water pump speed is 65 rpm, corresponding to the coolant mass flow rate of 0.015 kg/s.
Figure 9 represents the battery temperature variation under two control strategies. The design temperature control process is divided into a rapid cooling phase and a holding phase, as shown in the figure; in the rapid cooling phase (40 °C down to 30 °C) it takes 518 s to achieve the control objective based on the nonlinear modeling control (NMPC) control strategy, and it takes 512 s for the PID-based control strategy. It can also be seen from the figure that the holding phase (29.5 °C to 30 °C) is able to control the battery temperature to vary within the range of 29.5 °C to 30 °C using both control strategies.
As shown in Figure 10, under the influence of two different control strategies, the electric compressor presents a specific change in the rule of rotational speed. In the rapid battery cooling phase, that is, when the battery temperature is in the range of 40 °C down to 30 °C, the controller’s primary task is to reduce the battery temperature due to the large difference between the actual battery temperature and the target temperature. In this case, both control strategies drive the motorized compressor to operate continuously at the maximum speed (4000 rpm). Until 294 s, the controller based on the nonlinear model predictive control (NMPC) strategy, after considering the temperature difference as well as the energy consumption and other factors, implements the regulation of the compressor speed so that it changes accordingly. In the holding phase the cell temperature varies between 29.5 °C and 30.5 °C, and the compressor speed based on the PID control strategy varies between 1000 rpm and 3220 rpm, with an average speed of 2007 rpm, while the compressor speed based on the NMPC strategy varies between 1000 rpm and 2674 rpm, with an average speed of 1177 rpm. In comparison, the range of compressor speed variation based on NMPC strategy is reduced by 24.6% and the average speed is reduced by about 41%. In the heat preservation stage, NMPC can regulate the compressor speed according to the dynamic change in plowing resistance. At the same time, considering the temperature difference and energy consumption factors, with NMPC in the control of speed the change range shows a high degree of accuracy, effectively avoiding the overshoot phenomenon similar to that of PID control. Consequently, this ensures the stability of the system under the premise of realizing the compressor speed more accurately and offering efficient control, which improves the whole system in the heat preservation stage. This enhances the performance of the whole system in the heat preservation stage, optimizing the energy utilization efficiency and temperature control effect.
The variation trend of the mass flow rate of the refrigerant at the compressor outlet is consistent with that of the compressor speed, that is, they are positively correlated. Specifically, when the compressor speed decreases, the mass flow rate of the refrigerant also decreases accordingly. The specific situations of the mass flow rate changing with the compressor speed obtained through two different methods are shown in Figure 11.
Figure 12 represents the compressor mechanical power graphs under the two control strategies, as shown in the figure, during the rapid cooling phase (the cell temperature is from 40 °C down to 30 °C, and the time to reach the target temperature in the simulation is 518 s and 512 s for the NMPC-based control strategy and the comparison strategy, respectively), where the power of the compressor under the two control strategies ranges from 505 W~2448 W, and the average power is 1993 W and 2066 W. In comparison, the average power of the compressor based on the NMPC strategy is 3.3% smaller. In the temperature holding phase (battery temperature varies around 29.5 °C~30.5 °C), the average power of the compressor under the two control strategies is 457.77 W and 748 W, respectively, in which the average power of the compressor based on the NMPC strategy is reduced by 38.7%. Throughout the simulation (0~2400 s), the average power of the compressor speeds for the two strategies were 791.44 W and 1029.36 W, respectively, and in comparison the average power of the compressor based on the NMPC strategy was reduced by about 23.1%.
As shown in Figure 13, it can be seen from the figure that under the plowing condition, the cooling energy consumption of the rapid cooling phase (40 °C down to 30 °C in which the time to reach the target temperature based on the NMPC strategy and the comparison strategy in the simulation is 518 s and 512 s, respectively) and the cooling energy consumption of the battery temperature from the initial temperature to the target temperature under the action of the two control strategies is about 0.288 kWh and 0.294 kWh, compared with the PID control strategy. Therefore, the energy consumption of the cooling system under the NMPC strategy is reduced by about 2.04% year-on-year. In the insulation stage, the compressor energy consumption for lowering the battery temperature from the initial temperature to the target temperature under the two control strategies is about 0.239 kWh and 0.392 kWh, respectively, and the compressor energy consumption under the NMPC strategy is reduced by about 39% year-on-year compared with the PID comparison control strategy. Throughout the simulation stage, the compressor energy consumption for lowering the battery temperature from the initial temperature to the target temperature under the two control strategies is 0.527 kWh and 0.686 kWh, respectively, and the energy consumption of the cooling system under the NMPC strategy is reduced by about 23.1% year-on-year.
In order to verify the rationality of the moving average prediction model and explore the impact of load changes on cooling performance, this study conducted a simulation experiment on the thermal management system of an electric tractor under heavy load. The tractor plowing condition is selected as the tractor simulation test condition, and the tractor plowing resistance is set as shown in Figure 14. The plowing resistance fluctuates at 11.2 KN, with the highest resistance reaching 12.5 KN and the lowest resistance reaching 10.2 KN. The control strategy is NMPC. The plowing resistance data are the actual measured plowing resistance data and the plowing resistance obtained by the prediction method. This working condition is defined as working condition B.
The power battery thermal management control strategy based on the NMPC method proposed in this paper requires the prediction information of future plowing resistance. Under plowing conditions, the battery heat generation rate is mainly related to the plowing resistance. Figure 15 shows the variation in the plowing resistance under the two working conditions. The plowing resistance of working condition A fluctuates at 7.8 KN, with a fluctuation range of 0.46 KN. The average values of the actual plowing resistance and the predicted plowing resistance are 7840 N and 7837 N, respectively. The plowing resistance of working condition B fluctuates at 11.3 KN, with a fluctuation range of 2.3 KN. The actual average plowing resistance is 11,349 N, and the predicted average plowing resistance is 11,346 N. Since the sliding average algorithm has a smoothing effect under both working conditions, the predicted plowing resistance has a smaller fluctuation range than the actual plowing resistance.
Figure 16 is a comparison of the heat generation rates of the batteries under two working conditions. It can be seen from the figure that the overall change trends of the predicted heat generation rate and the actual heat generation rate of the batteries under the two working conditions are the same. The average values of the predicted heat generation rate and the actual heat generation rate of the batteries under working condition A are 555.77 W and 554.84 W, respectively, and the maximum error of the predicted heat generation rate between 10 s and 2400 s is no more than 7%. The average values of the predicted heat generation rate and the actual heat generation rate of the batteries under working condition B are 1022 W and 1032 W, respectively, and the maximum error of the predicted heat generation rate between 10 s and 2400 s is no more than 37%. Observations show that after 400 s, the battery heat generation under condition B stabilizes at around 1000 W, with a fluctuation range of 800 W. At the same time, the battery heat generation under condition A tends to fluctuate around 500 W, with a fluctuation range of 300 W. In addition, based on the observations of Figure 14 and Figure 15, it can be found that the battery heat generation is positively correlated with the magnitude of the plowing resistance. The control method proposed in this study focuses on regulating the temperature of the power battery. Significant changes in battery temperature are the result of long-term accumulation of heat inside the battery. Over a long period of time, the total heat generation of the battery is related to the average heat generation rate. Small prediction errors in heat generation within a very short time range are acceptable. Therefore, under experimental conditions, the plowing resistance prediction method proposed in this study can better predict the heat generation of the power battery.
In this study, the plowing resistance predicted by the sliding average window theory and the historical data of the plowing resistance obtained by actual measurement are used as disturbance inputs and input into the system model of the model predictive control (MPC) predictive controller. Through simulation experiments, the corresponding battery temperature changes are obtained. The specific data are shown in Figure 17. It can be observed from the figure that under working condition A the maximum deviation of battery temperature change in the simulation results is less than 0.4 °C. Under working condition B, the maximum deviation of battery temperature change in the simulation results is less than 0.5 °C. The results show that under plowing conditions, for the control process of the battery thermal management system, the plowing resistance predicted based on the sliding average window theory can play almost the same role as the actually measured plowing resistance, which provides a control basis for the battery thermal management system in a complex and changeable plowing operation environment and proves the feasibility and effectiveness of the prediction method in the field of battery thermal management.

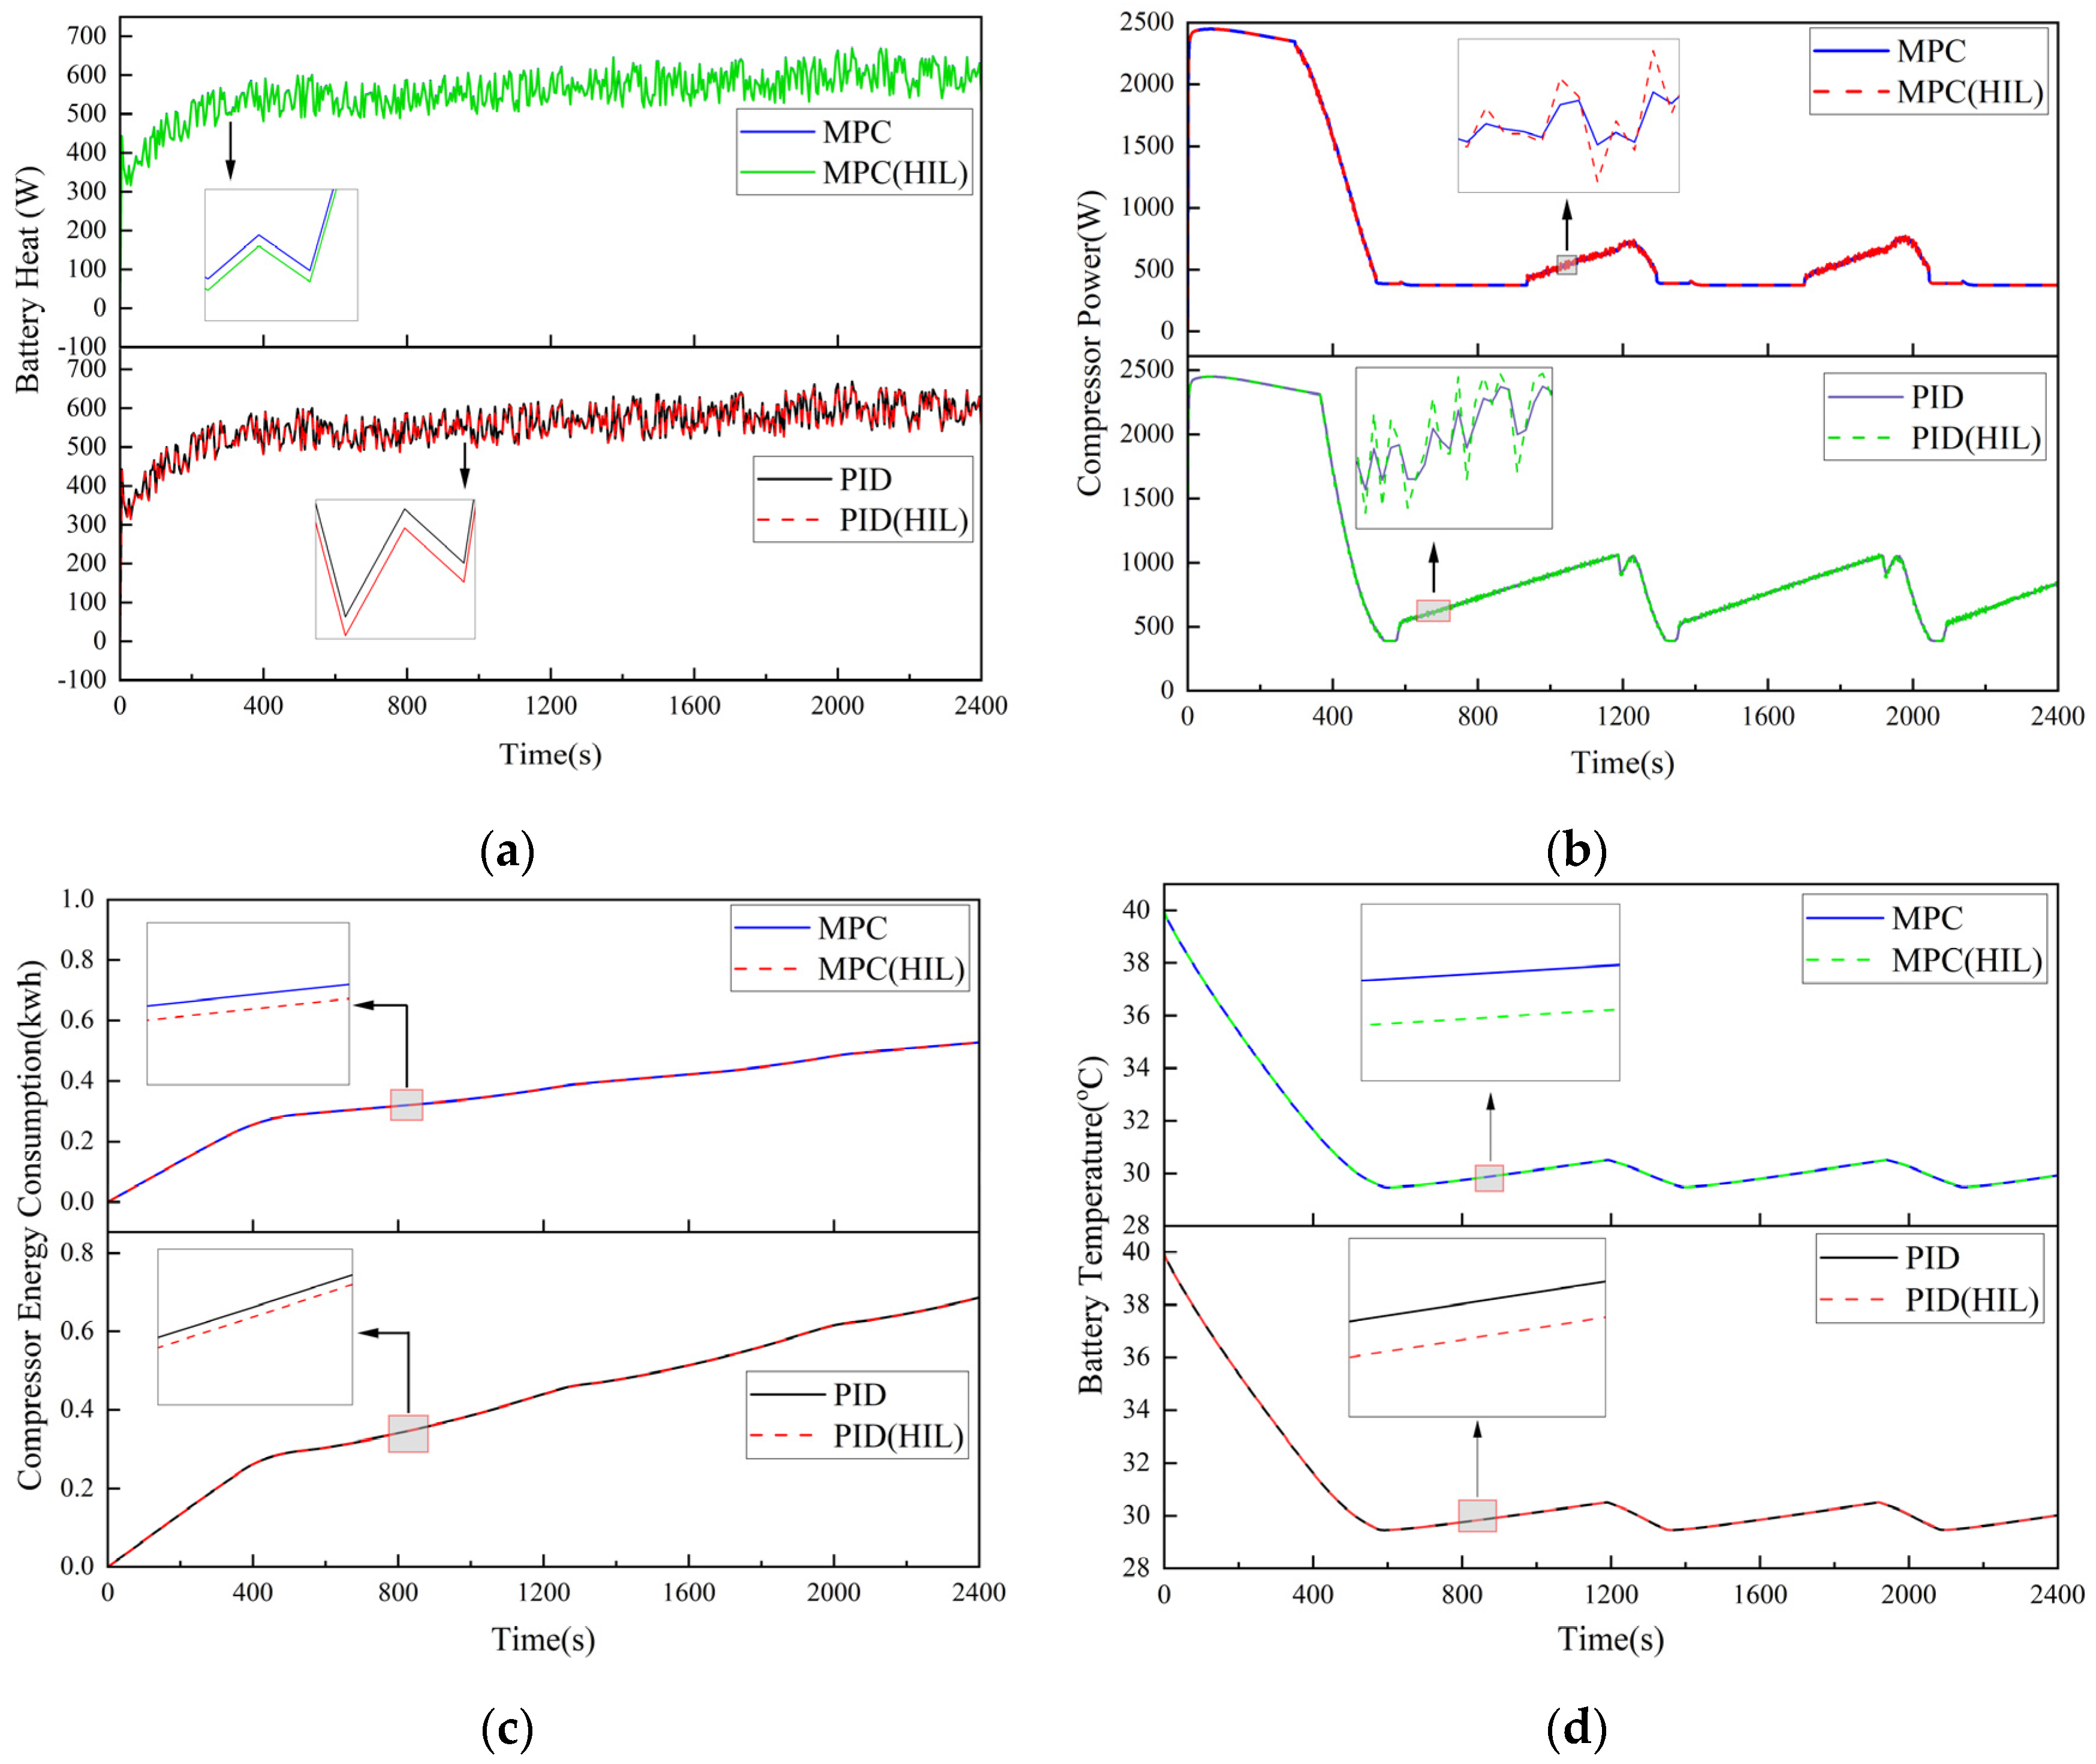
3.2. Hardware-in-the-Loop (HIL) Experiment

To validate the efficacy of the proposed thermal management control strategy for power batteries, this study conducted tests and verification of the nonlinear model predictive control (NMPC)-based thermal management control strategy and the proportional integral derivative (PID)-based thermal management control strategy using the MATLAB simulation platform and the hardware-in-the-loop (HIL) testing platform. The HIL test platform is mainly composed of the control model and the controlled object, which can simulate the actual operation process of the electric tractor and its battery thermal management system. The HIL test platform is mainly composed of control models and controlled objects, which can simulate the actual running process of the electric tractor and its battery thermal management system and realize the real-time experimental verification of the performance and energy saving effect of the battery thermal management system.
The core components of the HIL test platform include the HIL test cabinet, the PC, and the controller. The key components of the HIL test cabinet include the power management unit, signaling module, and real-time processor, etc. In terms of the real-time processor, and NI PXIe-8880 controller is selected, and the PC is running the Windows 10 operating system. It realizes the connection with the HIL test cabinet with the help of Ethernet, controls the HIL test cabinet by relying on the VeriStand software version 2021 R2, and then carries out the test experiments.
According to the testing needs, the HIL test environment is firstly configured via PC, the nonlinear model predictive control strategy is then written into the controller, and then the thermal management control system and the controller are loaded into the real-time processor and the HIL test data are observed and outputted via the VeriStand software on PC. The flowchart of the specific HIL test validation is shown in Figure 18.
According to Figure 19, it can be seen that the Matlab simulation results are basically consistent with the HIL test results, and it can be clearly seen that the nonlinear model prediction (NMPC)-based control strategy is also superior in the HIL test under the same operating conditions. After calculation, the Matlab simulation results and HIL test results under the two control strategies show that the root mean square error of the battery heat production is less than 2 W, the root mean square error of the compressor power is less than 8.05 W, the root mean square error of the compressor energy consumption is less than 0.0004 kWh, and the root mean square error of the battery temperature change is less than 0.0482 °C.

4. Conclusions

In this paper, a mathematical model of an electric tractor battery thermal management system is constructed, a plowing resistance prediction method based on moving average window theory is proposed, and a nonlinear model prediction control (NMPC) method of electric tractor power battery thermal management system applicable to plowing conditions is proposed. In order to verify the effectiveness of the proposed method, it is compared with the thermal management control method based on a PID control strategy, and the verification is carried out in MATLAB simulation and in a HIL simulation test. The results show the following:
(1) Under the operating conditions of plowing, both control strategies successfully achieved the goal of rapid regulation of the battery temperature within 520 s, so that the temperature of the battery was rapidly reduced from the initial 40 °C down to 30 °C, achieving the expected cooling effect. In the holding phase, both control strategies show good temperature control efficiency and can stably control the battery temperature within the temperature range of 29.5 °C to 30.5 °C, ensuring that the battery is in the appropriate operating temperature range, which further verifies the effectiveness and feasibility of the two control strategies in maintaining the stability of the battery temperature.
(2) In the rapid cooling phase, the two control strategies have the same trend of speed change; however, in the holding phase, the range of compressor speed change in the proposed method is reduced by 24.6% and the average speed is reduced by 41% compared with the comparison strategy. The proposed method can accurately regulate the compressor speed according to the dynamic change in plowing resistance, taking into account the temperature difference and energy consumption factors.
(3) Compared with the comparison strategy, the compressor energy consumption decreased by 2.04% in the rapid cooling phase, while the compressor energy consumption decreased by 23.1% in the whole temperature control phase including rapid cooling and holding.
(4) The effectiveness of the proposed method is verified by the HIL test platform. The Matlab simulation results of the proposed method are basically consistent with the HIL test, and the results show that the root mean square error of the battery temperature change is less than 0.0482 °C.
The method proposed in this paper provides a new theoretical foundation and technical approach for the thermal management control of electric tractor power batteries. The study proposes a nonlinear model prediction control (NMPC) method for the thermal management system of an electric tractor power battery which is applicable to plowing conditions. It focuses on the effect of the control strategy on energy consumption. In the future, the introduction of a battery aging model and an operation cost assessment method will be considered to study the impact of a thermal management control strategy on the actual cost of use. Since the plowing resistance prediction method is based on historical plowing resistance data collected by sensors, the application of our model and prediction method is limited by the accuracy of the sensors. In addition, we recognize that although the moving average model performs well in this study, other models should always be considered to further verify the robustness of the results. We plan to explore several alternative methods, such as weighted moving average, ARIMA model, exponential smoothing, and machine learning techniques. In future studies, we also plan to conduct more experiments on specific low-cost embedded platforms to evaluate the practical feasibility and performance of the NMPC approach.

Author Contributions

Conceptualization, X.G., J.Z. and M.L.; data curation, X.G.; formal analysis, R.X., X.Y., M.L. and M.S.; funding acquisition, J.Z.; investigation, J.Z. and M.S.; methodology, X.G. and J.Z.; project administration, X.Y.; resources, R.X., X.Y. and M.L.; software, X.G. and M.L.; supervision, R.X., J.Z., X.Y. and M.L.; validation, X.G.; visualization, X.G. and X.Y.; writing—original draft, X.G. and M.S.; writing—review and editing, R.X. and J.Z. All authors have read and agreed to the published version of the manuscript.

Funding

This research was funded by the National Key R&D Program of China (2022YFD2001203, 2022YFD2001201B); Henan Provincial Natural Science Foundation Project (242300420369); Key agricultural core technology research project (NK202216010103); Henan Province Key R&D Project (231111112600); Henan University of Science and Technology Innovation Team Support Program (24IRTSTHN029); Science and Technology Tackling Project of Henan Province (222102110233); Open Project of the Key Laboratory of Advanced Manufacturing Technology for Automotive Parts, Ministry of Education (2024KLMT03).

Institutional Review Board Statement

Not applicable.

Informed Consent Statement

Not applicable.

Data Availability Statement

The data presented in this study are available on request from the corresponding author.

Conflicts of Interest

Author Mengnan Liu was employed by the YTO Group Corporation. The remaining authors declare that the research was conducted in the absence of any commercial or financial relationships that could be construed as a potential conflict of interest.

Abbreviations

The following abbreviations are used in this manuscript:
NMPCnonlinear model prediction control
PIDproportional integral derivative
HILhardware-in-the-loop

References

  1. Xu, L.; Zhang, J.; Yan, X.; Zhao, S.; Wu, Y.; Liu, M. Review of Research for Agricultural Equipment Electrification Technology. Trans. Chin. Soc. Agric. Mach. 2023, 54, 1–12. [Google Scholar]
  2. Liu, M.; Lei, S.; Zhao, J.; Meng, Z.; Zhao, C.; Xu, L. Review of Development Process and Research Status of Electric Tractors. Trans. Chin. Soc. Agric. Mach. 2022, 53, 348–364. [Google Scholar]
  3. Zhang, J.; Zhang, L.; Sun, F.; Wang, Z. An overview on thermal safety issues of lithium-ion batteries for electric vehicle application. IEEE Access 2018, 6, 23848–23863. [Google Scholar] [CrossRef]
  4. Seong, W.M.; Park, K.Y.; Lee, M.H.; Moon, S.; Oh, K.; Park, H.; Lee, S.; Kang, K. Abnormal self-discharge in lithium-ion batteries. Energy Environ. Sci. 2018, 11, 970–978. [Google Scholar] [CrossRef]
  5. Tarascon, J.M.; Arman, M. Issues and challenges facing rechargeable lithium batteries. Nature 2001, 414, 359–367. [Google Scholar] [CrossRef]
  6. Mali, V.; Saxena, R.; Kumar, K.; Kalam, A.; Tripathi, B. Review on battery thermal management systems for energy-efficient electric vehicles. Renew. Sustain. Energy Rev. 2021, 151, 111611. [Google Scholar] [CrossRef]
  7. Xiong, P.; Zhang, F.; Zhang, X.; Wang, S.; Liu, H.; Sun, B.; Zhang, J.; Sun, Y.; Ma, R.; Bando, Y.; et al. Strain engineering of two-dimensional multilayered heterostructures for beyond-lithium-based rechargeable batteries. Nat. Commun. 2020, 11, 3297. [Google Scholar] [CrossRef]
  8. He, L.; Jing, H.; Zhang, Y.; Li, P.; Gu, Z. Review of thermal management system for battery electric vehicle. J. Energy Storage 2023, 59, 106443. [Google Scholar] [CrossRef]
  9. Goli, P.; Legedza, S.; Dhar, A.; Salgado, R.; Renteria, J.; Balandin, A.A. Graphene-enhanced hybrid phase change materials for thermal management of Li-ion batteries. J. Power Sources 2014, 248, 37–43. [Google Scholar] [CrossRef]
  10. Yu, Z.; Zhang, J.; Pan, W. A review of battery thermal management systems about heat pipe and phase change materials. J. Energy Storage 2023, 62, 106827. [Google Scholar] [CrossRef]
  11. Wang, H.; Tao, T.; Xu, J.; Mei, X.; Liu, X.; Gou, P. Cooling capacity of a novel modular liquid-cooled battery thermal management system for cylindrical lithium ion batteries. Appl. Therm. Eng. 2020, 178, 115591. [Google Scholar] [CrossRef]
  12. Fathoni, A.M.; Putra, N.; Mahlia, T.I. A systematic review of battery thermal management systems based on heat pipes. J. Energy Storage 2023, 73, 109081. [Google Scholar] [CrossRef]
  13. Akbarzadeh, M.; Kalogiannis, T.; Jaguemont, J.; Jin, L.; Behi, H.; Karimi, D.; Beheshti, H.; Van Mierlo, J.; Berecibar, M. A comparative study between air cooling and liquid cooling thermal management systems for a high-energy lithium-ion battery module. Appl. Therm. Eng. 2021, 198, 117503. [Google Scholar] [CrossRef]
  14. Basu, S.; Hariharan, K.S.; Kolake, S.M.; Song, T.; Sohn, D.K.; Yeo, T. Coupled electrochemical thermal modelling of a novel Li-ion battery pack thermal management system. Appl. Energy 2016, 181, 1–13. [Google Scholar] [CrossRef]
  15. Troncon, D.; Alberti, L. Case of study of the electrification of a tractor: Electric motor performance requirements and design. Energies 2020, 13, 2197. [Google Scholar] [CrossRef]
  16. Zhang, J.; Feng, G.; Yan, X.; He, Y.; Liu, M.; Xu, L. Cooperative control method considering efficiency and tracking performance for unmanned hybrid tractor based on rotary tillage prediction. Energy 2024, 288, 129874. [Google Scholar] [CrossRef]
  17. Zeng, W.; Ma, C.; Hu, S.; Li, S.; Zhang, Y. The performance investigation and optimization of reciprocating flow applied for liquid-cooling-based battery thermal management system. Energy Convers. Manag. 2023, 292, 117378. [Google Scholar] [CrossRef]
  18. Zuo, W.; Li, D.; Li, Q.; Cheng, Q.; Zhou, K.; Jiaqiang, E. Multi-objective optimization of multi-channel cold plate under intermittent pulsating flow by RSM and NSGA-Ⅱ for thermal management of electric vehicle lithium-ion battery pack. Energy 2023, 283, 129085. [Google Scholar] [CrossRef]
  19. Fayaz, H.; Afzal, A.; Samee, A.M.; Soudagar, M.E.; Akram, N.; Mujtaba, M.A.; Jilte, R.D.; Islam, M.T.; Ağbulut, Ü.; Saleel, C.A. Optimization of thermal and structural design in lithium-ion batteries to obtain energy efficient battery thermal management system (BTMS): A critical review. Arch. Comput. Methods Eng. 2022, 29, 129–194. [Google Scholar] [CrossRef]
  20. Ali, Z.M.; Jurado, F.; Gandoman, F.H.; Ćalasan, M. Advancements in battery thermal management for electric vehicles: Types, technologies, and control strategies including deep learning methods. Ain Shams Eng. J. 2024, 15, 102908. [Google Scholar] [CrossRef]
  21. Dai, W.; Lai, H. Comparative study of flow-channel layout schemes in liquid cooling plates of a prismatic battery module. Appl. Therm. Eng. 2024, 236, 121501. [Google Scholar] [CrossRef]
  22. Ma, K.; Wang, J.; Wang, Q.; Mao, Q. Numerical simulation of battery thermal management based on ring microchannel cold plate. Int. J. Therm. Sci. 2025, 210, 109563. [Google Scholar] [CrossRef]
  23. Wang, Z.; Guan, Q.; Zhang, H.; Wu, X.; Yu, D. Optimized design of liquid-cooled plate structure for flying car power battery system. J. Energy Storage 2024, 97, 112720. [Google Scholar] [CrossRef]
  24. Jahanpanah, J.; Soleymani, P.; Karimi, N.; Babaie, M.; Saedodin, S. Transient cooling of a lithium-ion battery module during high-performance driving cycles using distributed pipes—A numerical investigation. J. Energy Storage 2023, 74, 109278. [Google Scholar] [CrossRef]
  25. Cen, J.; Jiang, F. Li-ion power battery temperature control by a battery thermal management and vehicle cabin air conditioning integrated system. Energy Sustain. Dev. 2020, 57, 141–148. [Google Scholar] [CrossRef]
  26. Shen, M.; Gao, Q. System simulation on refrigerant-based battery thermal management technology for electric vehicles. Energy Convers. Manag. 2020, 203, 112176. [Google Scholar] [CrossRef]
  27. Lebrouhi, B.E.; Lamrani, B.; Ouassaid, M.; Abd-Lefdil, M.; Maaroufi, M.; Kousksou, T. Low-cost numerical lumped modelling of lithium-ion battery pack with phase change material and liquid cooling thermal management system. J. Energy Storage 2022, 54, 105293. [Google Scholar] [CrossRef]
  28. Guo, R.; Sun, Z.; Luo, M. Energy-efficient battery thermal management strategy for range extended electric vehicles based on model predictive control and dynamic programming. Energy 2024, 307, 132769. [Google Scholar] [CrossRef]
  29. Ma, Y.; Ding, H.; Mou, H.; Gao, J. Battery thermal management strategy for electric vehicles based on nonlinear model predictive control. Measurement 2021, 186, 110115. [Google Scholar] [CrossRef]
  30. Ma, J.; Liu, A.; Zhang, P.; Chen, Y.; Cai, Y. Collaborative thermal management of power battery and passenger cabin for energy efficiency optimization. Energy Convers. Manag. 2023, 293, 117514. [Google Scholar] [CrossRef]
  31. Liu, Z.; Xiong, C.; Du, X. Research on the optimization control strategy of a battery thermal management system based on serpentine liquid cooling combined with phase change material. J. Power Sources 2025, 630, 236127. [Google Scholar] [CrossRef]
  32. Huang, D.; Chen, Z.; Zhou, S. Model prediction-based battery-powered heating method for series-connected lithium-ion battery pack working at extremely cold temperatures. Energy 2021, 216, 119236. [Google Scholar] [CrossRef]
  33. Ma, Y.; Li, J. Iterative dynamic programming strategy for electric vehicle battery thermal management optimization. Adv. Theory Simul. 2022, 5, 2100602. [Google Scholar] [CrossRef]
  34. Lian, Y.; Ling, H.; Zhu, J.; Lv, J.; Xie, Z. Thermal management optimization strategy of electric vehicle based on dynamic programming. Control Eng. Pract. 2023, 137, 105562. [Google Scholar] [CrossRef]
  35. Fan, Y.; Zuo, X.; Zhan, D.; Zhao, J.; Zhang, G.; Wang, H.; Tan, X. A novel control strategy for active battery thermal management systems based on dynamic programming and a genetic algorithm. Appl. Therm. Eng. 2023, 233, 121113. [Google Scholar] [CrossRef]
  36. Song, Z.; Hofmann, H.; Li, J.; Hou, J.; Zhang, X.; Ouyang, M. The optimization of a hybrid energy storage system at subzero temperatures: Energy management strategy design and battery heating requirement analysis. Appl. Energy 2015, 159, 576–588. [Google Scholar] [CrossRef]
  37. Wang, R.; Zhang, H.; Chen, J.; Ding, R.; Luo, D. Modeling and model predictive control of a battery thermal management system based on thermoelectric cooling for electric vehicles. Energy Technol. 2024, 12, 2301205. [Google Scholar] [CrossRef]
  38. Varlese, C.; Haslinger, M.; Junger, C.; Konrad, J.; Krizan, R.; Hametner, C.; Hofmann, P. Predictive fuel cell thermal management for fuel cell electric tractors. Appl. Therm. Eng. 2025, 268, 125835. [Google Scholar] [CrossRef]
  39. Ma, Y.; Ding, H.; Liu, Y.; Gao, J. Battery thermal management of intelligent-connected electric vehicles at low temperature based on NMPC. Energy 2022, 244, 122571. [Google Scholar] [CrossRef]
  40. Bernardi, D.; Pawlikowski, E.; Newman, J. A general energy balance for battery systems. J. Electrochem. 1985, 132, 5. [Google Scholar] [CrossRef]
  41. Ma, Y.; Ma, Q.; Liu, Y.; Gao, J.; Chen, H. Two-level optimization strategy for vehicle speed and battery thermal management in connected and automated EVs. Appl. Energy 2024, 361, 122928. [Google Scholar] [CrossRef]
  42. Zhang, T.; Li, M.; Li, D. The Research of MPC in Secondary Cooling System of Battery. J. Eng. Thermophys. 2023, 45, 13–19. [Google Scholar] [CrossRef]
Figure 1. Battery electro–thermal coupling model.
Wevj 16 00249 g001
Figure 2. Equivalent internal resistance model.
Wevj 16 00249 g002
Figure 3. Schematic diagram of the battery thermal management system model.
Wevj 16 00249 g003
Figure 4. Nonlinear model predictive control for battery thermal management system.
Wevj 16 00249 g004
Figure 5. Schematic diagram of plow resistance prediction.
Wevj 16 00249 g005
Figure 6. Flow chart for prediction of plow resistance.
Wevj 16 00249 g006
Figure 7. Schematic diagram of plowing resistance.
Wevj 16 00249 g007
Figure 8. Tractor travel speed chart.
Wevj 16 00249 g008
Figure 9. Battery temperature variation under two control strategies.
Wevj 16 00249 g009
Figure 10. Schematic diagram of compressor speed.
Wevj 16 00249 g010
Figure 11. Mass flow rate of refrigerant at the compressor outlet for two control strategies.
Wevj 16 00249 g011
Figure 12. The compressor mechanical power graphs under the two control strategies.
Wevj 16 00249 g012
Figure 13. Compressor energy consumption graph for two control strategies.
Wevj 16 00249 g013
Figure 14. Plowing resistance under working condition B.
Wevj 16 00249 g014
Figure 15. Plowing resistance change diagram under two working conditions.
Wevj 16 00249 g015
Figure 16. Comparison of actual and predicted heat generation rates of batteries under two working conditions.
Wevj 16 00249 g016
Figure 17. Comparison of battery temperature changes under two working conditions.
Wevj 16 00249 g017
Figure 18. HIL test validation flowchart.
Wevj 16 00249 g018
Figure 19. Comparison of simulation and HIL experimental results: (a) two control methods for battery heat production; (b) compressor power; (c) compressor energy consumption; (d) battery temperature change.
Wevj 16 00249 g019
Disclaimer/Publisher’s Note: The statements, opinions and data contained in all publications are solely those of the individual author(s) and contributor(s) and not of MDPI and/or the editor(s). MDPI and/or the editor(s) disclaim responsibility for any injury to people or property resulting from any ideas, methods, instructions or products referred to in the content.

