Article

Unveiling the Kadaknath Gut Microbiome: Early Growth Phase Spatiotemporal Diversity

by
Amruta Nair
1,
Swapnil Prakash Doijad
2,*,
Mangesh Vasant Suryavanshi
3,
Anwesha Dey
4,
Satya Veer Singh Malik
5,
Bas E. Dutilh
2,6 and
Sukhadeo Baliram Barbuddhe
1,*
1
ICAR-National Meat Research Institute, Hyderabad 500092, India
2
Institute of Biodiversity, Faculty of Biological Sciences, Cluster of Excellence Balance of the Microverse, Friedrich Schiller University Jena, 07745 Jena, Germany
3
Department of Cardiovascular and Metabolic Sciences, Cleveland Clinic—Lerner Research Institute, Cleveland, OH 44106, USA
4
Department of Forest, West Bengal Zoo Authority, Kolkata 700106, India
5
Division of Veterinary Public Health, ICAR-Indian Veterinary Research Institute, Bareilly 243122, India
6
Theoretical Biology and Bioinformatics, Science4Life, Utrecht University, 3584 Utrecht, The Netherlands
*
Authors to whom correspondence should be addressed.
Microbiol. Res. 2025, 16(3), 54; https://doi.org/10.3390/microbiolres16030054
Submission received: 30 December 2024 / Revised: 6 February 2025 / Accepted: 24 February 2025 / Published: 26 February 2025

Abstract

:
The early growth phase is a critical period for the development of the chicken gut microbiome. In this study, the spatiotemporal diversity of the gastrointestinal microbiota, shifts in taxonomic composition, and relative abundances of the main bacterial taxa were characterized in Kadaknath, a high-value indigenous Indian chicken breed, using sequencing of the V3–V4 region 16S rRNA gene. To assess microbiome composition and bacterial abundance shifts, three chickens per growth phase (3, 28, and 35 days) were sampled, with microbiota analyzed from three gut regions (crop, small intestine, and ceca) per bird. The results revealed Firmicutes as the most abundant phylum and Lactobacillus as the dominant genus across all stages. Lactobacillus was particularly abundant in the crop at early stages (3 and 28 days), while the ceca exhibited a transition towards the dominance of genus Phocaeicola by day 35. Microbial richness and evenness increased with age, reflecting microbiome maturation, and the analyses of the microbial community composition revealed distinct spatiotemporal differences, with the ceca on day 35 showing the highest differentiation. Pathogen analysis highlighted a peak in poultry-associated taxa Campylobacter, Staphylococcus, and Clostridium paraputrificum in 3-day-old Kadaknath, particularly in the small intestine, underscoring the vulnerability of early growth stages. These findings provide critical insights into age-specific microbiome development and early life-stage susceptibility to pathogens, emphasizing the need for targeted interventions to optimize poultry health management and growth performance.

1. Introduction

The perpetually expanding global population and surge in protein demand pose a significant challenge to food and nutritional security. Poultry and poultry products are crucial in food supply and nutrition and contribute annually to the global gross domestic product (GDP) [1]. Poultry production has taken a quantum leap in India in the last few decades. Currently, the Indian poultry market is valued at USD 30.46 billion and is anticipated to grow at a compound annual growth rate (CAGR) of 8.1% from 2024 to 2032. The livestock sector, including the poultry segment, contributed 30.19% to the total agriculture gross value added in 2021–2022 [2,3].
In response to the increasing preference for organic and sustainable food systems, native chicken breeds are gaining popularity over commercial broilers due to their distinctive meat flavor, superior nutritional profile, and potential medicinal benefits [4]. The Kadaknath, originating from India, is an indigenous, endangered poultry renowned for its unique black meat, which is not only a delicacy but also recognized for its high protein, low fat, and enriched iron content, contributing to its nutritional, medicinal, health-promoting and immune-boosting properties [4,5]. The black meat of this breed, especially the muscle tissue, is rich in antioxidants, demonstrates remarkable resilience against common poultry diseases, and is well-suited to the varying climatic conditions of its native region, making it an ideal candidate for non-intensive farming practices [5,6]. Such characteristics underscore its potential as a crucial genetic resource for sustainable and organic poultry farming initiatives, which aim to reduce environmental impacts while maintaining poultry health and productivity. Native chicken breeds are intrinsically more resistant to pathogens, high temperatures, and other local conditions and hence can be exploited as an antibiotic-free alternative to improve poultry production in the specific region [7,8]. Despite these advantages, high mortality during the early-growth stage has been noted for decreased productivity, increased treatment costs, and economic losses in the poultry industry [9,10].
The microbiome of the gastrointestinal tract (GIT) of the chicken is a vital and intricate ecosystem that significantly influences poultry health by affecting nutrient absorption, immune function, and disease resistance [11]. The gut microbiome, especially during the early-growth stage, undergoes rapid and dynamic changes, shaping the overall health and resilience of the bird. In this critical window, the developing microbiome is highly susceptible to pathogenic colonization due to an underdeveloped immune system, an immature gut environment, and suboptimal commensal microbiota [12,13]. These transitions in the microbiome during early life are shaped by diet and other factors such as host genetics, breed, and environmental exposure [14,15,16,17]. The early vulnerability of chickens to pathogens underscores the necessity for timely interventions, and implementing strategies like administering probiotics and prebiotics early in life can effectively influence the gut microbiome, reducing pathogen presence and enhancing beneficial microbial communities [18,19].
Due to their indigenous nature, limited studies have been conducted on the gut microbiome of Kadaknath compared to more widely studied commercial broiler breeds [5,6]. Previous studies have primarily focused on examining the cecal gut microbiome of adult Kadaknath [20,21], while the progression of the microbiome in different gut sections of GIT with time remains unexplored. Studying different GIT regions, such as the crop, small intestine, and ceca, especially in the early growth phase would be crucial to further understanding the poultry’s overall health and physiological functions.
This study aims to characterize the microbial diversity and its temporal changes across different regions of the GIT in Kadaknath chickens during the early growth phase (3, 28, and 35 days) using 16S rRNA sequencing. Given the importance of microbiome development in the early development age, we aimed to explore the microbial composition, and transition across different gut regions (crop, small intestine, and ceca), identifying critical periods for microbiome-based interventions, and providing insights into the microbiome’s development over time in poultry.

2. Materials and Methods

2.1. Animal Maintenance and Sample Collection

The newly hatched chicks of Kadaknath (obtained from Kottiyodu, Mannarkkad, Palakkad district, Kerala) were kept in chicken coops under specific conditions: a temperature of 35 °C was maintained for an initial week and then gradually reduced, with a humidity of 50–60% with proper ventilation, adequate spacing, and a lighting intensity of 40–60 lux. No external bioactive substances or treatments like prebiotics, vaccines, and antibiotics were used on the chicks during the experimental study to avoid any influence on the natural microbiota. The birds were humanely euthanized (3, 28, and 35th day) in a registered slaughterhouse under the supervision of a licensed veterinarian in compliance with Food Safety and Standards (Licensing and Registration of Food Business) Regulations 2011. A total of 27 samples, 3 per age group per gastrointestinal region (crop, small intestine, and ceca), were collected from the slaughtered birds following the previously described protocol (Figure 1, Supplementary Data S1: ‘metadata’) [22,23], according to the circular V-11011(13)/5/2023-CPCSEA-DADF dated 5 June 2023 (ethical clearance is not required for the slaughter of birds intended for consumption). Each sample was collected in sterile conditions to prevent contamination. The metagenomic DNA was extracted using the QIAamp DNA Stool Mini Kit (Qiagen, Hilden, Germany) according to the manufacturer’s instructions. The quality and concentration of DNA were assessed employing nanodrop (Thermo Fisher Scientific, Waltham, MA, USA) and gel electrophoresis.

2.2. The 16S rRNA Gene Sequencing

The QC-passed metagenomic DNA samples were then processed, and the V3–V4 region of the 16S rRNA gene was amplified using the primer pair 338F (5′-ACTCCTACGGGAGGCAGCAG-3′) and 806R (5′-GGACTACHVGGGTWTCTAAT-3′). The PCR cycling parameters, using Q5 DNA polymerase (New England Biolabs, MA, USA), were 98 °C for 1 min, 35 cycles of 98 °C for 10 s, 49 °C for 30 s, and 72 °C for 30 s, with a final step of a 10 min extension at 72 °C followed by NGS library preparation using Nextera XT Index Kit (Illumina Inc., San Diego, CA, USA) [24]. The sequencing was carried out in a commercial setup (Eurofins Genomics India Pvt. Ltd., Bangalore, India). The quality of prepared libraries was checked in 1.2% agarose gel using the High Sensitivity D1000 ScreenTape® system (Agilent Technologies, Santa Clara, CL, USA). The libraries were sequenced on the Illumina MiSeq platform using 2 × 300 bp chemistry, targeting approximately 100,000 reads per sample. All the DNA sequencing data are publicly available https://www.ncbi.nlm.nih.gov/sra/PRJNA1200578 accessed on 19 December 2024.

2.3. Analysis of the 16S rRNA Sequencing Data

The raw reads of 16S rRNA gene sequencing reads were quality-filtered by trimmomatic v0.39 and analyzed by Quantitative Insights into Microbial Ecology 2 (QIIME2—version 2024.5). In brief, raw paired-end sequencing reads were imported into QIIME2 and checked for quality at the 5′ and 3′ end. Accordingly, the cut-off was chosen and reads were trimmed and denoised using the DADA2 plugin, which included filtering out low-quality reads, removing chimeric sequences, and dereplicating sequences to generate amplicon sequence variants (ASVs) (Supplementary Data S1: ‘sequence_stat’). A feature table was created, and a taxonomic assignment was performed using a pre-trained classifier on the Greengenes 2022.10 database. Non-bacterial sequences and singletons were filtered out to ensure accurate downstream analyses. The final step involved generating taxonomic bar plots in R to visualize the microbial community structure across different samples. To roughly estimate the pathogen’s diversity, we searched for selective bacterial taxa (genera) known to contain poultry pathogens as well as those that are of zoonotic importance, such as Salmonella, Escherichia, Campylobacter, Clostridium, Mycoplasma, Listeria, Pasteurella, Avibacterium, Ornithobacterium, Enterococcus, and Streptococcus spp.

2.4. Statistical Analysis

Alpha and beta diversity metrics were calculated to assess within-sample and between-sample diversity, respectively. Alpha diversity was calculated using the Shannon index and Simpson index to measure microbial richness and evenness within samples. Statistical differences in alpha diversity between growth stages and gut regions were evaluated using the Kruskal–Wallis test, with a p-value < 0.05 considered statistically significant. Beta diversity was calculated by the Bray–Curtis distance matrix using PERMANOVA (permutational multivariate analysis of variance) via the Adonis function in QIIME2, with 999 permutations and a significance threshold of p < 0.05. Differences in microbial composition between gut regions and growth stages were tested using beta-group significance tests in QIIME2. To ensure comparability across samples and minimize bias in diversity measurements, all samples were rarefied to an equal (10,000 reads) sequencing depth before performing alpha and beta diversity analyses.

3. Results

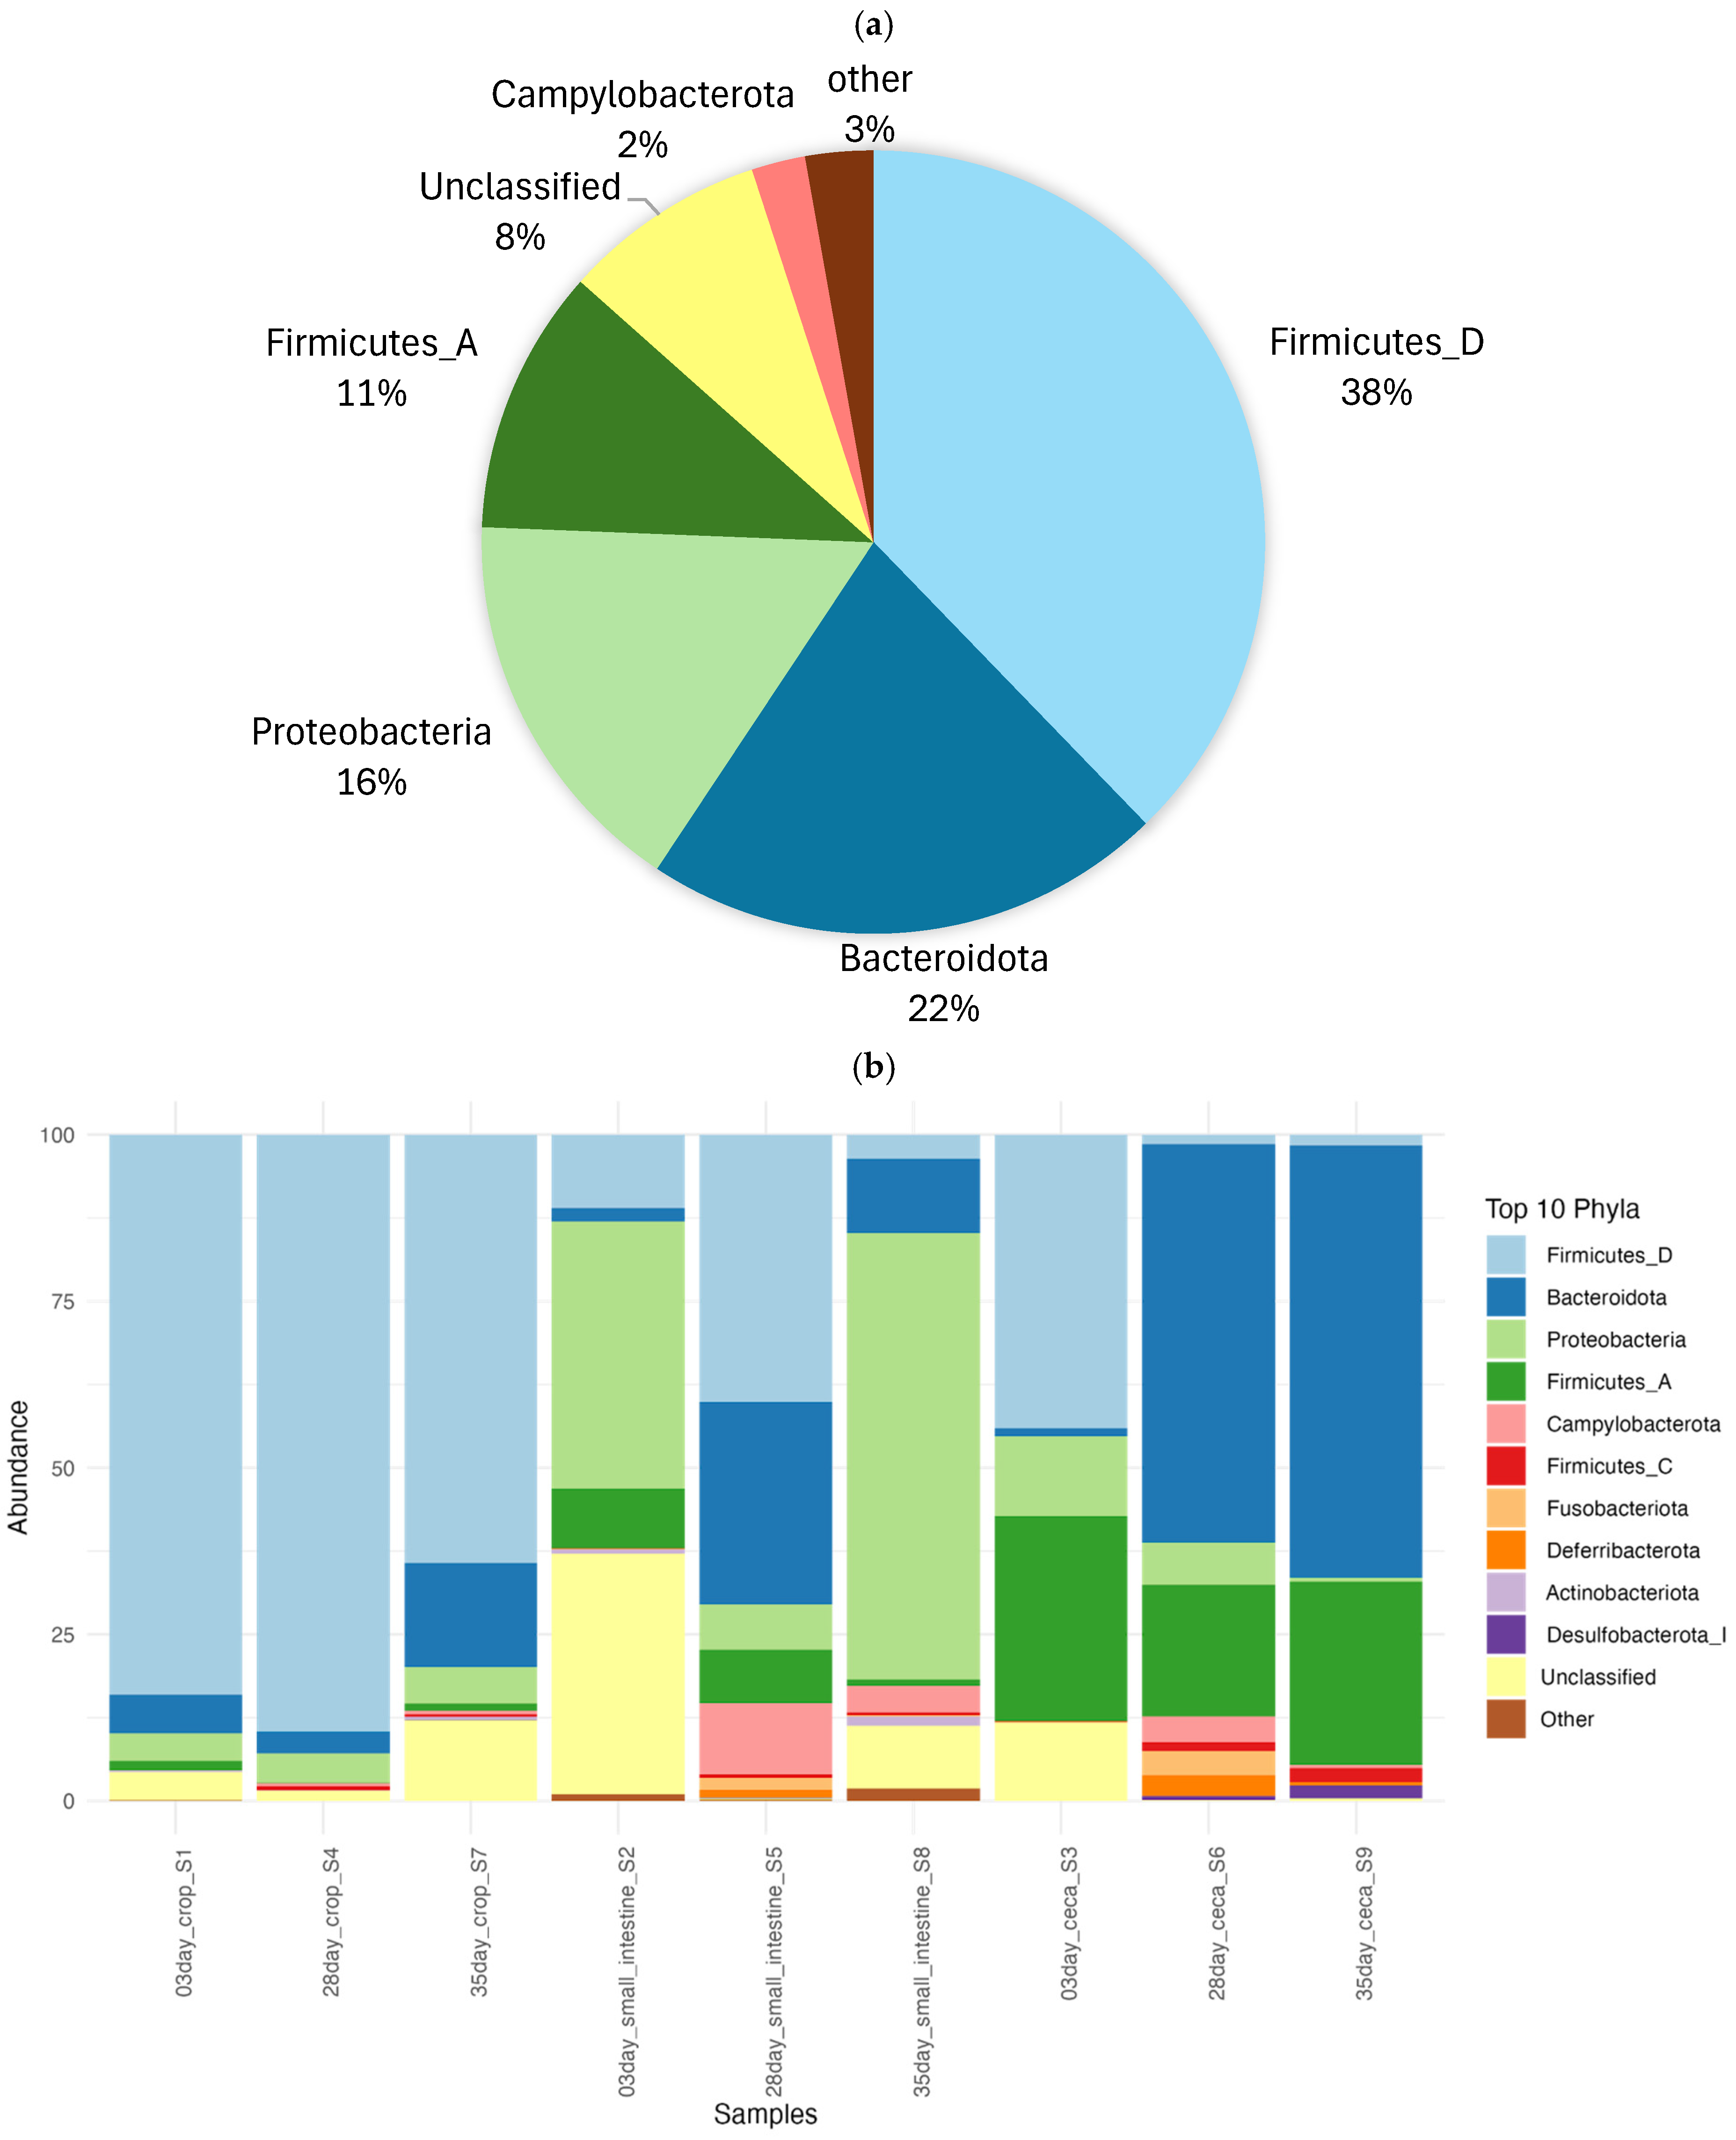
3.1. The Overall Diversity of Kadaknath Gut Microbiome

Our study investigated the gut microbiome of Kadaknath chickens across early growth phases, namely, 3, 28, and 35 days, and three regions of the gastrointestinal (GI) tract, the crop, small intestine, and ceca. The analysis revealed a complex and dynamic microbial community comprising at least 34 phyla, 233 families, and 371 genera. Among these phyla, Firmicutes_D, Bacteroidota, Proteobacteria, Firmicutes_A, and Campylobacterota were the most dominant, collectively accounting for over 88.79% of the microbiome (Figure 2a).
On day 3 post-hatch, Firmicutes_D was dominant (73.68% in the crop, 27.30% in the ceca), while Proteobacteria was notably high in the small intestine (36.08%) (Figure 2b). By day 28, Firmicutes_D declined, and Bacteroidota surged, particularly in the ceca (53.99%), indicating microbiome transition. On day 35, Firmicutes_D further decreased, while Bacteroidota remained dominant in the ceca (44.06%), reflecting microbiome maturation. Proteobacteria, which was initially abundant, declined by day 28 but showed a slight resurgence in the crop and small intestine on day 35.
At the genus level, Lactobacillus was the most abundant Firmicute, but its relative abundance declined over time across all gut regions (Figure 2c). On day 3, Lactobacillus dominated the crop (73.7%), but its prevalence dropped to 57.9% at 28 days and 32.3% at 35 days. Similarly, in the small intestine, Lactobacillus decreased from 5.9% (day 3) to 23.8% (day 28) and 1.5% (day 35). In contrast, Phocaeicola showed a significant increase over time, particularly in the ceca, where it rose from 0.1% on day 3 to 54% on day 28 and remained high at 44.1% on day 35. By 35 days, the microbiome showed further specialization, with Phocaeicola remaining dominant in the ceca (44.1%), Janthinobacterium rising in the small intestine (33.2%), and Ligilactobacillus increasing in the crop (20.4%). These trends indicate that microbiome maturation follows a structured transition, with dominant taxa shifting as chickens grow.
In addition to age-related changes, microbial composition varied between gut regions (crop, small intestine, and ceca). The ceca exhibited a major microbiome shift, transitioning from Firmicutes_D dominance (27.30%) at early stages to Bacteroidota predominance (53.99% on day 28, 44.06% on day 35), reflecting microbiome maturation. The small intestine initially had a high presence of Proteobacteria (36.08%), which declined significantly by day 28 but showed a minor resurgence on day 35. The crop remained largely dominated by Firmicutes_D, though its abundance gradually declined from 73.68% at early stages to 32.25% by day 35, with a slight increase in Bacteroidota and Proteobacteria in later stages.
At the genus level, Lactobacillus dominated the crop at all time points, decreasing from 73.7% (day 3) to 32.3% (day 35), whereas Phocaeicola became dominant in the ceca. The small intestine displayed a more diverse and transient microbial composition, with Janthinobacterium showing a significant increase (33.2% at 35 days).
A comparison of shared taxa across gut regions indicated that Lactobacillus, Phocaeicola, Janthinobacterium, Ligilactobacillus, and Limosilactobacillus were present in all regions at all ages but in different proportions (Figure 2d, Supplementary Data S1: ‘core_genus’). Some genera, such as Mediterraneibacter, Variovorax, and Bacteroides H, were detected in low proportions across all samples.
These spatiotemporal variations in microbial composition highlight the dual influence of age and gut region on microbiome diversification. The progressive shifts in dominant taxa suggest that the Kadaknath gut microbiome undergoes structured maturation, adapting to host age and gut region-specific conditions.

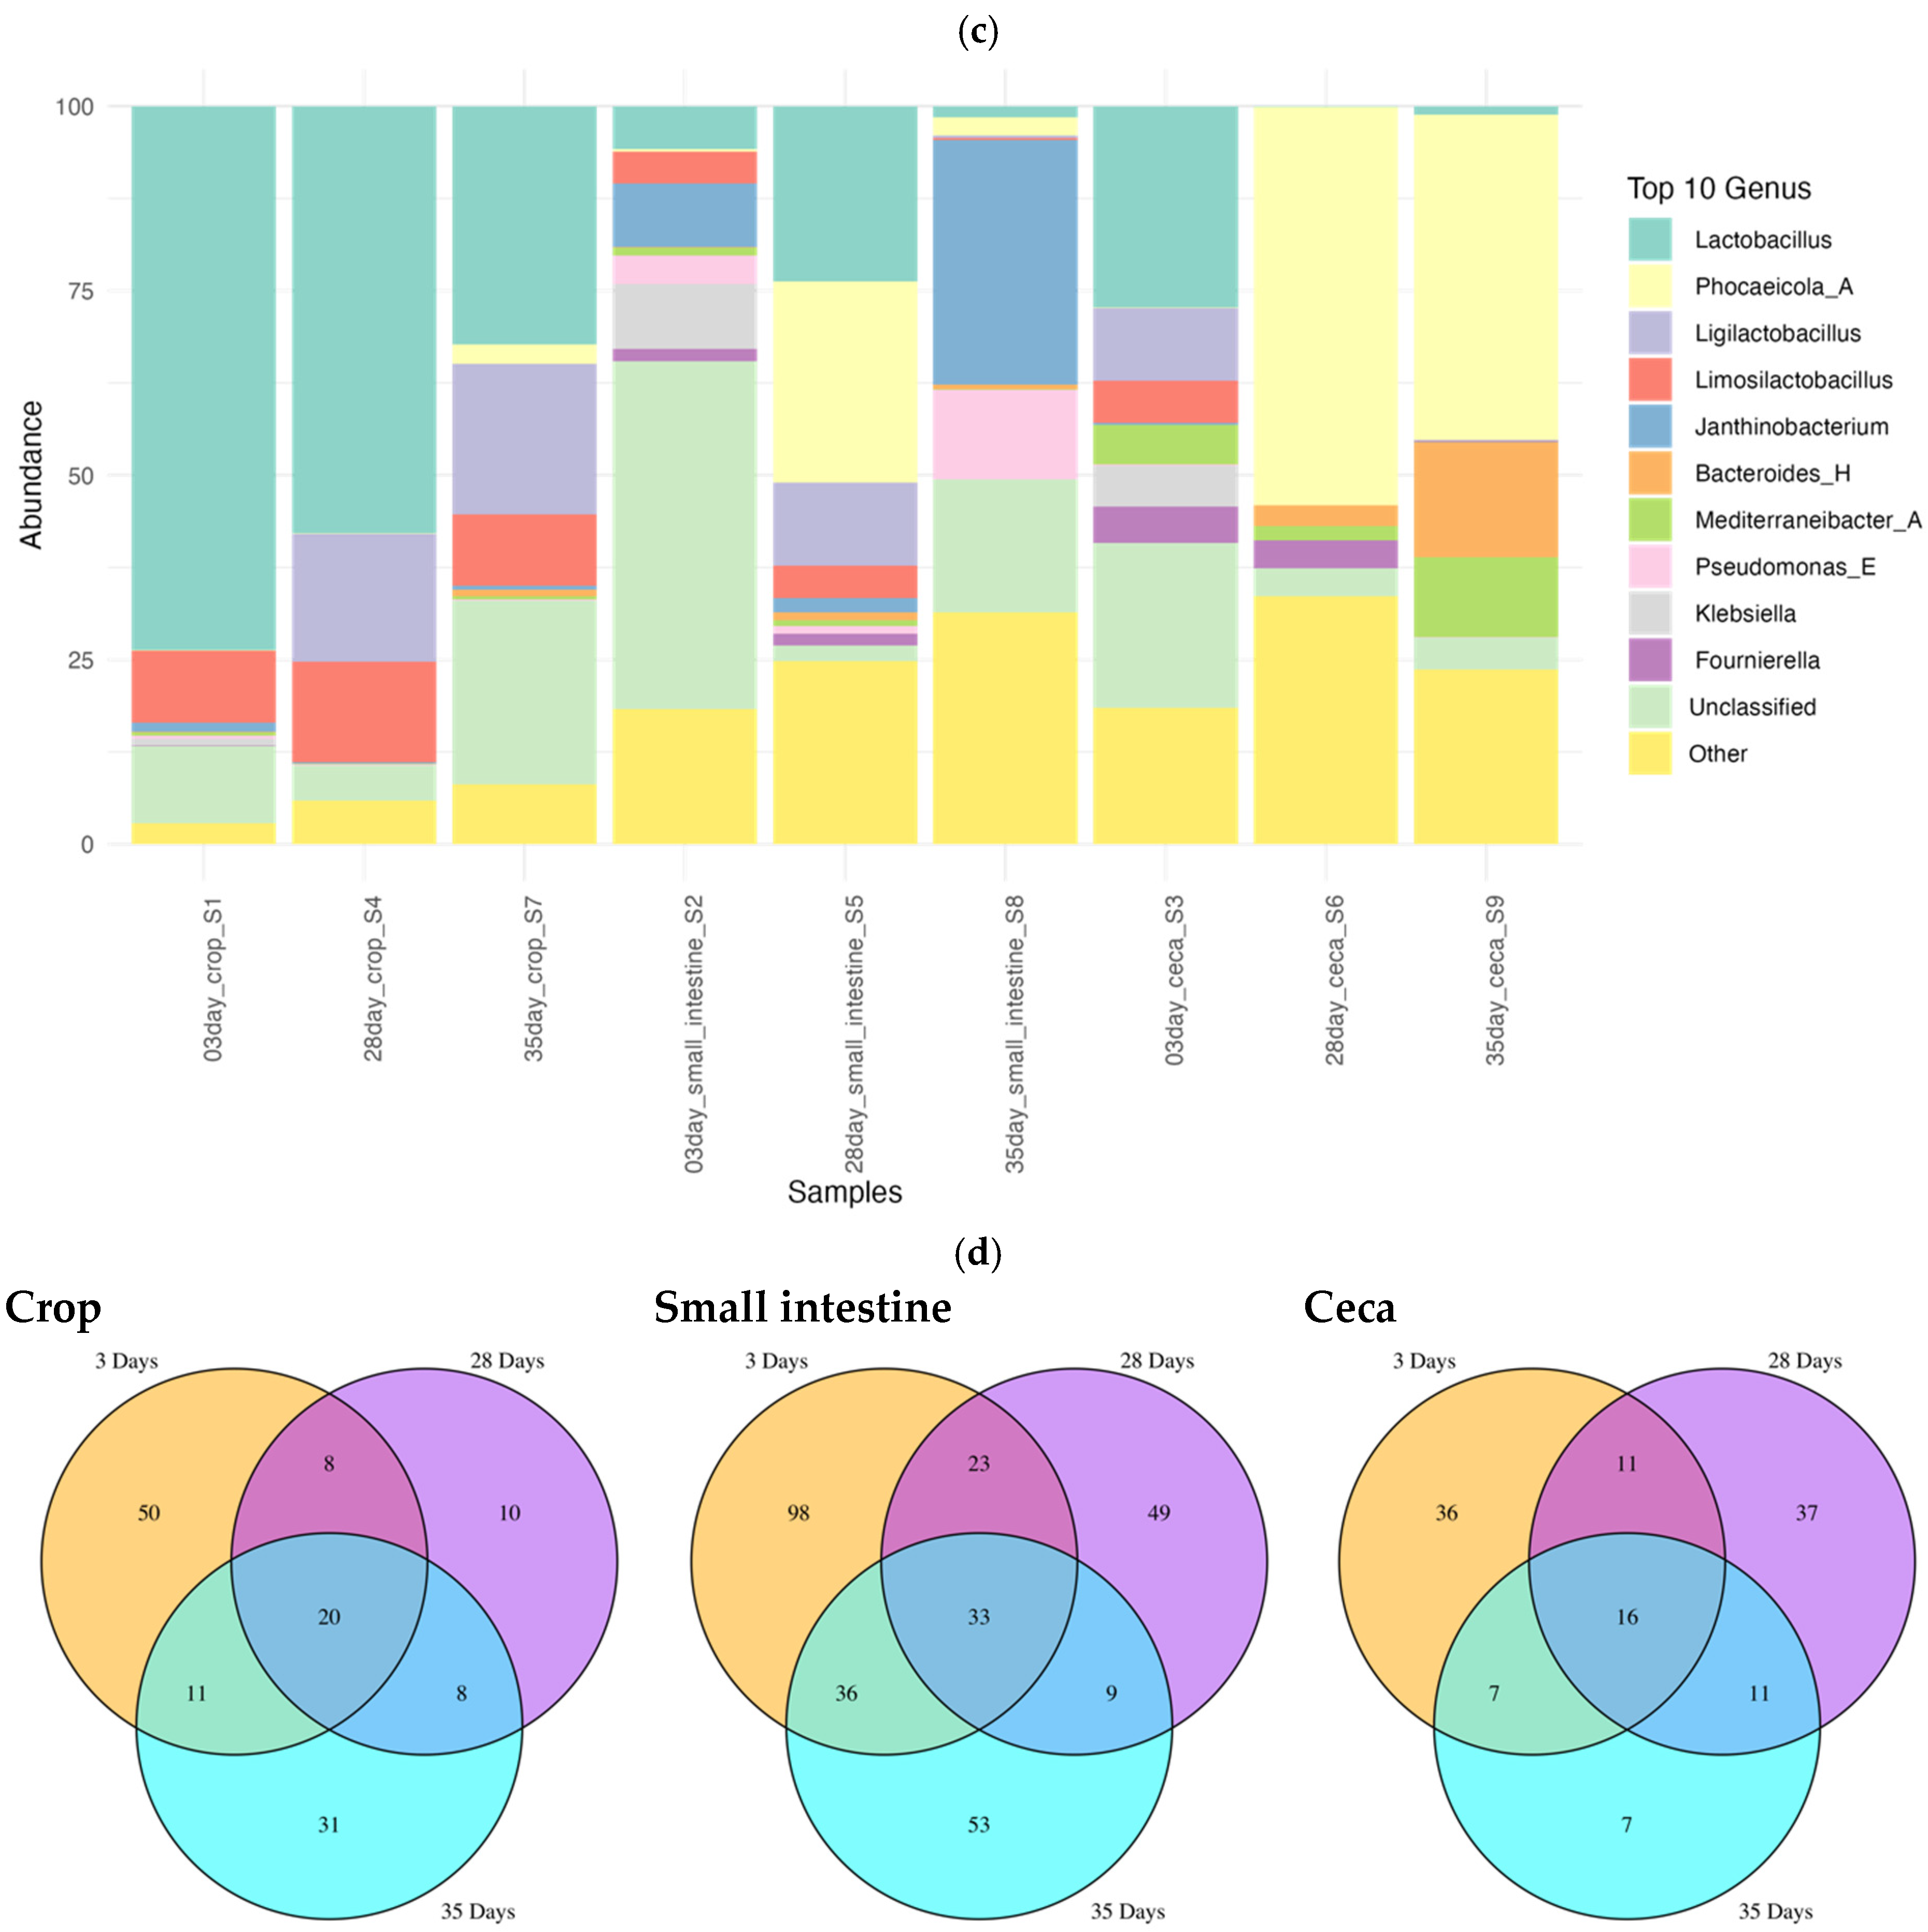
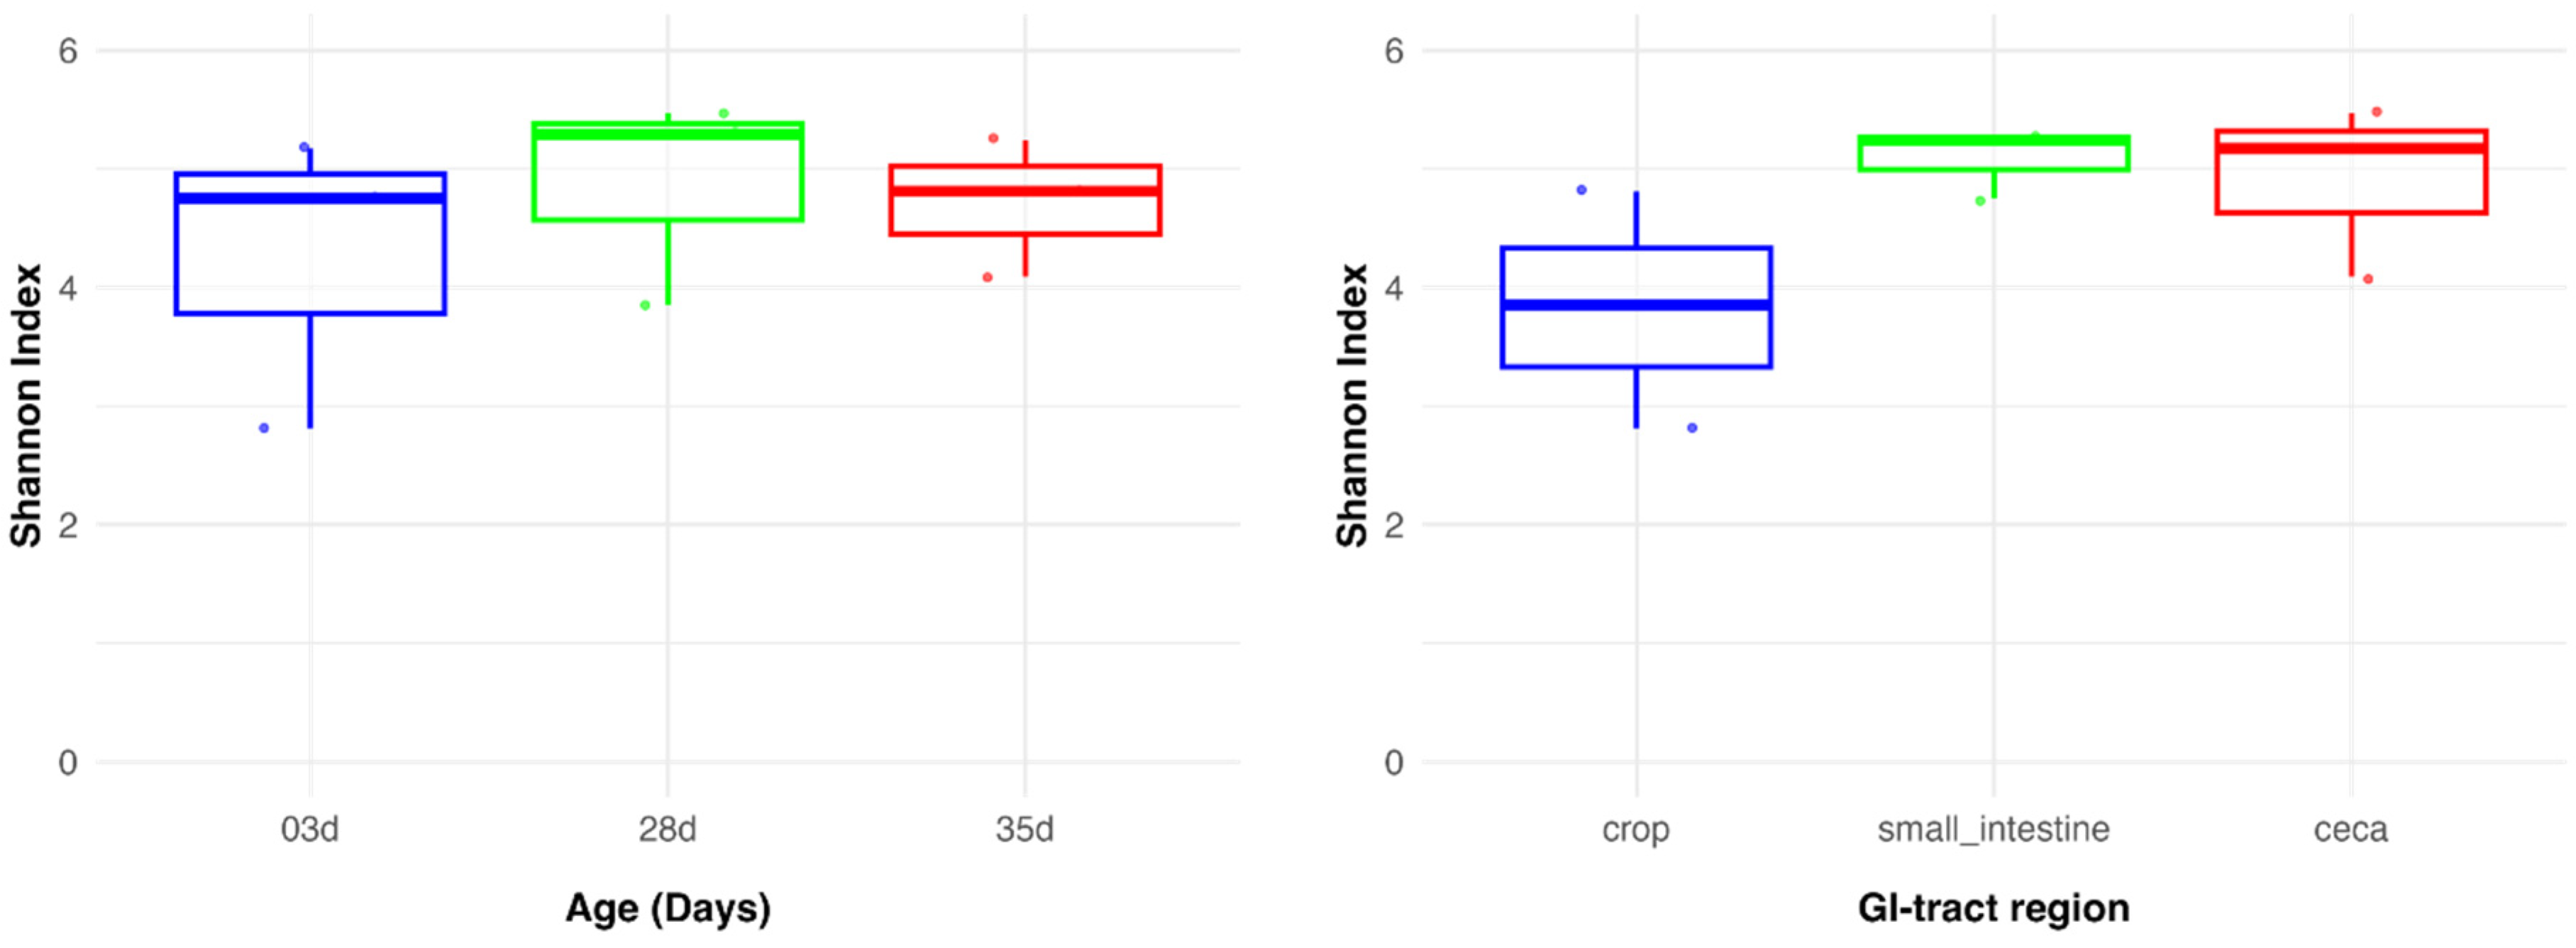
3.2. The Gut Microbiome of Kadaknath Exhibited Diversification and Maturation with Age

The alpha diversity of the Kadaknath gut microbiome, measured by the Shannon and Simpson indices (Shi and Sii, respectively), showed an increasing trend over time, suggesting microbiome maturation (Figure 3). However, Kruskal–Wallis analysis across all age groups did not reveal statistically significant differences in alpha diversity (H = 1.42, p = 0.491). Pairwise comparisons between growth stages (3-day vs. 4-week, 3-day vs. 5-week, and 4-week vs. 5-week) also did not show significant differences (all p > 0.05). Beta diversity analysis showed distinct microbiome composition trends over time, but PERMANOVA analysis of Bray–Curtis dissimilarity did not detect statistically significant differences across growth stages (p = 0.194). This suggests that while diversity increased with age and microbiome composition shifted over time, these changes were not statistically robust.
At three days post-hatch, the microbiome was characterized by lower diversity, particularly in the crop (Shi = 2.81, Sii = 0.64), where members of the Firmicutes_D, particularly Lactobacillus, were dominant. The relatively low average BC dissimilarity values (0.73 ± 0.04) for the third-day samples suggest greater microbial communities at this stage. By the 28th day, microbial diversity increased across all gut regions, reflecting microbiome maturation. The Shi and Sii rose to 3.85 and 0.83 in the crop, 5.29 and 0.94 in the small intestine, and 5.47 and 0.95 in the ceca, indicating a more complex and evenly distributed microbial community. The abundance of Lactobacillus remained high in the crop at 28 days, with additional beneficial lactic acid bacteria detected, including Enterococcus (0.08%), Streptococcus (0.06%), Pediococcus (0.09%), Lactococcus (0.005%), and Bifidobacterium (0.06%). By the 35th day, the microbial landscape showed further diversification. The crop’s Shi increased to 4.81, and the Sii rose to 0.92, reflecting continued microbial establishment. The ceca showed a slight decrease in diversity (Shi = 4.09, Sii = 0.88), while Phocaeicola became the dominant genus (44.05%), suggesting microbiome specialization.
In the case of GIT regions, the ceca exhibited the highest microbial diversity, with Shi values of 5.17 in the early stages, peaking at 5.47, before slightly decreasing to 4.09, while Sii remained high (0.94 at 28 days, 0.88 at 35 days). This region transitioned from Lactobacillus dominance (27.30%) to Phocaeicola predominance (53.98%, then 44.05%). The small intestine had moderate diversity, with Shi increasing from 4.75 to 5.24 and Sii stabilizing at 0.92, while Janthinobacterium expanded significantly (33.2%) in later stages. The crop exhibited the lowest alpha diversity (Shi = 2.81 early, rising to 4.81) and was dominated by Lactobacillus, though its abundance gradually declined over time.
The BC indicated higher microbial differentiation among gut regions than among age groups. However, PERMANOVA analysis of Bray–Curtis dissimilarity did not show statistically significant differences between gut regions (p = 0.08), suggesting that while distinct microbiome structures exist across gut sites, these differences were not statistically robust.
These findings suggest that gut-specific microbiota compositions remain distinct while the microbiome matures over time. The crop maintained Lactobacillus dominance, the small intestine harbored transient microbial populations, and the ceca developed a specialized fermentation-driven microbiome.

3.3. Pathogen Diversity in Kadakanath Chickens

Shifting our focus to pathogen diversity, we screened for OTUs associated with well-known poultry pathogens to provide a preliminary estimate of early colonization. Members of Campylobacter, Staphylococcus and Clostridium were detected across different samples. These pathogens exhibited varying abundances depending on the age of the chickens and the specific gut region (Supplementary Data S1: ‘pathogen’).
At three days post-hatch, the gut microbiome exhibited early-stage pathogen colonization, with Clostridium paraputrificum showing the highest abundance (2.87%) among detected pathogens. A small proportion (0.04%) of Campylobacter_D was noted in the ceca. Staphylococcus was more prevalent in the small intestine (0.13%) than in the ceca (0.12%) or crop (0.031). By 28 days, Campylobacter_D became the dominant pathogen, increasing significantly in the ceca (2.58%) and small intestine (0.94%), with moderate levels in the crop (0.10%). The presence of Clostridium species declined by this stage. At 35 days, Campylobacter_D remained prevalent in the ceca (0.36%) and crop (0.40%), but Clostridium perfringens and Clostridium_H emerged in the small intestine at low levels (0.11 and 0.07%, respectively). These shifts suggest that the early dominance of Clostridium species transitions toward increased Campylobacter prevalence in older chickens, indicating age-related pathogen succession.
In addition to age-driven changes, pathogen abundance varied across different gut regions. The ceca exhibited the highest microbial diversity and pathogen abundance, showing a shift from Clostridium dominance at three days to Campylobacter_D dominance at later stages. The small intestine consistently hosted moderate levels of Staphylococcus and Campylobacter, with Clostridium species emerging at later stages. The crop showed the lowest pathogen levels overall, though Campylobacter_D increased slightly at 35 days.
The overall proportion of potentially pathogenic bacteria was low (maximum relative abundance of 2.8%) compared to the dominant genera described in this study. Additionally, no noticeable disease symptoms were observed. These findings highlight the importance of monitoring gut microbiome changes in poultry to understand the underlying pathogen diversity in the early growth stage and improve poultry health management strategies.

4. Discussion

Kadaknath is an indigenous Indian chicken breed, and the farming of this breed is predominantly practiced in free-range and organic systems. In such conditions, chickens often become infected by pathogens through multiple sources, requiring careful management to ensure their health and safety. The gut microbiota plays a crucial role in their health, performance, and productivity, directly influencing host stress, tolerance, and immunity against invading pathogens [25]. In the early stages, pre-establishment of the gut microbiome with beneficial bacteria adhering to the epithelial cells is one of the pre-requisites to limit the survival and colonization of pathogens. A healthy microbiome fosters gut stability, supports growth, and enhances resilience, ultimately contributing to food safety [26]. In this study, we explored the spatiotemporal distribution, diversity, and colonization patterns of both beneficial and pathogenic bacteria of the gastrointestinal microbiome in the early growth stage of Kadaknath chickens. Using 16S rRNA sequencing, we analyzed microbiome composition across three distinct regions—crop, small intestine, and ceca—at three growth stages (3-, 28-, and 35-day old chicks), shedding light on microbiome maturation.
Our findings revealed spatiotemporal diversity in the gut microbiome of Kadaknath chickens. Firmicutes and Bacteroidota emerged as the dominant phyla, consistent with prior studies on poultry microbiomes [20,21], but their relative abundances varied across regions and ages. In the crop, the predominance of Lactobacillus at all three time points, particularly during the early stages, highlights its critical role in establishing a protective and functional microbiota [27]. Our study also supports the microbial successional pattern observed by the preceding study, where the gut microbiome in chickens undergoes changes with age, initially dominated by facultative aerobes and later by obligate anaerobes, mainly Firmicutes [28]. This pattern is evident in our study, where Firmicutes dominates as the chickens age.
Comparatively, the ceca exhibited greater microbial diversity and temporal diversity, transitioning from a Lactobacillus-dominated community to Phocaeicola-dominated at later stages. This shift aligns with the ceca’s role as a fermentation chamber for complex carbohydrates, which becomes more pronounced as the bird matures and transitions to a diet with increased fibrous content [29]. The rise in Phocaeicola, a genus within Bacteroidota, in the ceca mirrors findings in other studies linking its abundance to host energy metabolism and microbial maturation [30]. The small intestine, while showing moderate diversity, exhibited notable peaks of genera like Janthinobacterium at later stages, indicating transient colonization or responses to specific environmental or dietary factors. These findings highlight the distinct ecological roles of each gut region and their contributions to the overall microbial landscape.
The progressive increase in microbial richness and evenness observed in all gut regions underscores the maturation of the microbiome over time, as also noted in previous studies [20,21]. Alpha diversity metrics, such as the Shannon and Simpson indices, revealed a trend of increasing diversity from day 3 to day 35, with the most pronounced changes observed in the ceca. The increase in beta diversity, particularly in the ceca on day 35, highlights the functional specialization of this region as the microbiome matures. The differentiation of microbial communities across gut regions reflects their adaptation to distinct physiological and biochemical environments, emphasizing the complexity and interdependence of microbial ecosystems within the gastrointestinal tract. This spatial heterogeneity is reported earlier, with each gut segment playing a unique role in nutrient digestion and absorption and harboring its own distinct microbial composition [15,31]. The diverse, natural diet of Kadaknath chickens in their free-range setting comprising insects, worms, seeds, grains, garden greens, and kitchen scraps may explain this wide array of microorganisms and nutrients, fostering microbial diversity with age.
Given the diverse environmental exposure in free-range conditions, early-stage Kadaknath chickens may be prone to colonization by opportunistic pathogens. To assess this risk, we examined the presence of selective poultry-associated pathogens across different growth stages. The 3-day-old chickens exhibited the highest average percentage of poultry pathogens. This early stage may be particularly vulnerable to pathogenic colonization due to the immature immune system and gut microbiota [32]. The detection of Campylobacter and Clostridium, particularly during the early-growth stage (28 days), underscores the vulnerability of chickens during this critical period. Campylobacter, a zoonotic pathogen, was detected in the ceca and small intestine at 28 days, suggesting colonization and potential transmission risks during this growth stage. Nevertheless, the low levels of Campylobacter observed in this study contrast with other research where Campylobacter becomes more prevalent as chickens age, likely due to differences in environmental exposure or gut microbiome maturation [33,34,35,36]. Similarly, the presence of Clostridium paraputrificum in the ceca at earlier stages suggests a transitional phase in microbiome development where pathogenic taxa may temporarily proliferate before being outcompeted by commensal microbes. The presence of Clostridium also indicates early colonization by this pathogen, although at lower levels the gut environment favors the growth of Clostridium species; for example Clostridium perfringens has been documented to cause necrotic enteritis in poultry [37]. The presence of pathogens in early life stages gradually declined as the gut microbiota stabilized, a trend previously reported in poultry studies [32].
It is important to note that, in this study, the occurrence of pathogens is solely based on the 16S rRNA gene sequencing data, which, while highly informative for profiling microbial communities, has limitations in taxonomic resolution. Also, the presence of a particular 16S rRNA sequence does not confirm the active pathogenicity or viability of the microbes, as this method does not account for functional gene expression or metabolic activity. Thus, while our findings are predictive and provide valuable insights into microbial diversity and potential risks, they should be interpreted cautiously and validated using more targeted methods, such as whole genome sequencing or culture-based techniques. In addition, although we observed pathogens such as Klebsiella, Campylobacter, and Clostridium in different organs and time points, the overall proportion of pathogenic genera was low, and no clinical symptoms were observed in the chickens studied.
Unlike extensively studied commercial broilers, indigenous breeds like Kadaknath exhibit unique microbiome diversity shaped by their genetics, diet, and rearing conditions. The observed spatiotemporal patterns emphasize the need for breed-specific microbiome studies to address the distinct vulnerabilities and advantages of indigenous poultry. However, further research is needed to explore the functional implications of these microbial shifts. Metagenomic and metabolomic analyses could provide deeper insights into the metabolic capabilities of the microbiome and its contributions to host physiology. Additionally, longitudinal studies involving larger sample sizes and diverse rearing conditions could help validate the findings and identify factors influencing microbiome development.

5. Conclusions

This study provides insights into the spatiotemporal diversity of the gut microbiome in Kadaknath chickens, revealing distinct microbial succession patterns across different gut regions and growth stages. The early dominance of Lactobacillus in the crop and the transition to Phocaeicola in the ceca highlight the dynamic nature of microbiome maturation in this breed. The findings indicate that the first three days of life represent a critical period when pathogen colonization risk is the highest, coinciding with an immature gut microbiome. Though the overall presence of potential pathogens declined over time, their early detection underscores the importance of understanding microbiome stability in poultry health. These results contribute to a broader understanding of indigenous poultry microbiomes, which may help to make informed decisions and future directives for better poultry management practices. Future research should focus on elucidating the functional roles of key microbial taxa and their interactions with the host immune system through metagenomic and metabolomic approaches.

Supplementary Materials

The following supporting information can be downloaded at: https://www.mdpi.com/article/10.3390/microbiolres16030054/s1. Data S1: Metadata: Details about the samples analyzed in the study. It includes information such as sample IDs, collection time points (days 3, 28, and 35), gut regions (crop, small intestine, and ceca), and environmental conditions during sampling. Sequence_stat: Statistical details of the DNS sequencing data, includes metrics such as read counts, quality scores, filtering thresholds, and the percentage of reads retained after quality control and preprocessing. Abundance_g: Genus-level taxonomic abundance table. A color-coded system (ranging from red to green/low-to-high abundance) to visually represent the relative abundance (in percentage) of genera in different time points and GI regions. Abundance_s: Species-level taxonomic abundance table. A color-coded system (ranging from red to green/low-to-high abundance) to visually represent the relative abundance (in percentage) of species in different time points and GI regions. Core_genus: The table indicating genera observed in different time points and GI regions. The genus, if present (irrespective of their relative abundance) in crop or small intestine or ceca, and 3 or 28 or 35 days, were marked as ‘core’. Pathogen: Genus-level abundance of the shortlisted taxonomic genera known to contain poultry and zoonotic pathogenic species. For simplicity, the taxas are clustered based on genus level identity subsequently (right-side table).

Author Contributions

A.N. and S.B.B. conceived, designed, and conceptualized the experiments; A.N. and A.D. collected the samples and performed the experiments; A.N. and S.B.B. designed and conceptualized the metagenomic analysis; S.P.D. and B.E.D. interpreted the data and generated the figures; A.N. and S.B.B. analyzed the data; S.P.D., A.N. and M.V.S. wrote the paper; S.B.B. and S.V.S.M. were involved in supervision; S.B.B., S.V.S.M., M.V.S. and B.E.D. reviewed the manuscript; A.N. and S.B.B. were involved in funding acquisition. All authors have read and agreed to the published version of the manuscript.

Funding

This work is supported by a grant from the Department of Science and Technology, New Delhi, to Amruta Nair (DST/WOS-A/LS-281/2019 (G). S.P.D. and B.E.D. were supported by the European Research Council (ERC) Consolidator grant 865694: DiversiPHI, the Deutsche Forschungsgemeinschaft (DFG, German Research Foundation) under Germany’s Excellence Strategy—EXC 2051—Project-ID 390713860, and the Alexander von Humboldt Foundation in the context of an Alexander von Humboldt Professorship founded by the German Federal Ministry of Education and Research.

Institutional Review Board Statement

Not applicable.

Informed Consent Statement

Not applicable.

Data Availability Statement

All the DNA sequencing data are publicly available https://www.ncbi.nlm.nih.gov/sra/PRJNA1200578 accessed on 19 December 2024.

Acknowledgments

The authors are thankful to the Department of Science and Technology for the funding of the research work and to Principal Scientist P. Baswa Reddy (ICAR-NMRI) for all the guidance and support.

Conflicts of Interest

The authors declare no conflicts of interest.

References

  1. Mottet, A.; Tempio, G. Global poultry production: Current state and future outlook and challenges. World’s Poult. Sci. J. 2017, 73, 245–256. [Google Scholar] [CrossRef]
  2. Economic Survey 2023–2024. Press Information Bureau Government of India. Available online: https://static.pib.gov.in/WriteReadData/specificdocs/documents/2024/jul/doc2024722351601.pdf (accessed on 11 December 2024).
  3. FAO. Gateway to Poultry Production and Products. Available online: https://www.fao.org/poultry-production-products/products-processing/en/ (accessed on 11 December 2024).
  4. Haunshi, S.; Prince, L.L. Kadaknath: A popular native chicken breed of India with unique black colour characteristics. World’s Poult. Sci. J. 2021, 77, 427–440. [Google Scholar] [CrossRef]
  5. Sharma, R.; Sehrawat, R.; Ahlawat, S.; Sharma, V.; Parmar, A.; Thakur, M.S.; Mishra, A.K.; Tantia, M.S. An attempt to valorize the only black meat chicken breed of India by delineating superior functional attributes of its meat. Sci. Rep. 2022, 12, 3555. [Google Scholar] [CrossRef] [PubMed]
  6. Haunshi, S.; Rajkumar, U.; Padhi, M. Improvement of PD-4 (Aseel), an indigenous chicken, for growth and production traits. Indian J. Anim. Sci. 2019, 89, 419–423. [Google Scholar] [CrossRef]
  7. de Almeida, A.M.; Zuber, U. The effect of the Naked Neck genotype (Nana), feeding and outdoor rearing on growth and carcass characteristics of free-range broilers in a hot climate. Trop. Anim. Health Prod. 2010, 42, 99–107. [Google Scholar] [CrossRef]
  8. Ramasamy, K.T.; Reddy, M.R.; Raveendranathan, D.N.; Murugesan, S.; Chatterjee, R.N.; Ullengala, R.; Haunshi, S. Differential expression of toll-like receptor mRNA in white leghorn and indigenous chicken of India. Vet. Res. Commun. 2010, 34, 633–639. [Google Scholar] [CrossRef]
  9. Jones, P.J.; Niemi, J.; Christensen, J.P.; Tranter, R.B.; Bennett, R.M. A review of the financial impact of production diseases in poultry production systems. Anim. Prod. Sci. 2019, 59, 1585. [Google Scholar] [CrossRef]
  10. Naundrup Thofner, I.C.; Poulsen, L.L.; Bisgaard, M.; Christensen, H.; Olsen, R.H.; Christensen, J.P. Longitudinal study on causes of mortality in Danish broiler breeders. Avian Dis. 2019, 63, 400–410. [Google Scholar] [CrossRef]
  11. Maki, J.J.; Klima, C.L.; Sylte, M.J.; Looft, T. The microbial pecking order: Utilization of intestinal microbiota for poultry health. Microorganisms 2019, 7, 376. [Google Scholar] [CrossRef]
  12. Crhanova, M.; Hradecka, H.; Faldynova, M.; Matulova, M.; Havlickova, H.; Sisak, F.; Rychlik, I. Immune response of chicken gut to natural colonization by gut microflora and to Salmonella enterica serovar enteritidis infection. Infect. Immun. 2011, 79, 2755–2763. [Google Scholar] [CrossRef]
  13. Wigley, P. Blurred lines: Pathogens, commensals, and the healthy gut. Front. Vet. Sci. 2015, 2, 40. [Google Scholar] [CrossRef] [PubMed]
  14. Goodrich, J.K.; Davenport, E.R.; Waters, J.L.; Clark, A.G.; Ley, R.E. Cross-species comparisons of host genetic associations with the microbiome. Science 2016, 352, 532–535. [Google Scholar] [CrossRef] [PubMed]
  15. Zhou, Q.; Lan, F.; Li, X.; Yan, W.; Sun, C.; Li, J.; Yang, N.; Wen, C. The spatial and temporal characterization of gut microbiota in broilers. Front. Vet. Sci. 2021, 8, 712226. [Google Scholar] [CrossRef] [PubMed]
  16. Dai, D.; Qi, G.H.; Wang, J.; Zhang, H.J.; Qiu, K.; Wu, S.G. Intestinal microbiota of layer hens and its association with egg quality and safety. Poult. Sci. 2022, 101, 102008. [Google Scholar] [CrossRef] [PubMed]
  17. Rychlik, I. Composition and function of chicken gut microbiota. Animals 2020, 10, 103. [Google Scholar] [CrossRef]
  18. Rubio, L.A. Possibilities of early life programming in broiler chickens via intestinal microbiota modulation. Poult. Sci. 2019, 98, 695–706. [Google Scholar] [CrossRef]
  19. Broom, L.J.; Kogut, M.H. The role of the gut microbiome in shaping the immune system of chickens. Vet. Immunol. Immunopathol. 2018, 204, 44–51. [Google Scholar] [CrossRef]
  20. Pandit, R.; Hinsu, A.; Patel, N.; Koringa, P.; Jakhesara, S.J.; Thakkar, J.; Joshi, C.G.; Limon, G.; Psifidi, A.; Guitián, J.; et al. Microbial diversity and community composition of caecal microbiota in commercial and indigenous Indian chickens determined using 16s rDNA amplicon sequencing. Microbiome 2018, 6, 1. [Google Scholar] [CrossRef]
  21. Hay, M.C.; Hinsu, A.T.; Koringa, P.G.; Pandit, R.J.; Liu, P.Y.; Parekh, M.J.; Jakhesara, S.J.; Dai, X.; Crotta, M.; Fosso, B.; et al. Chicken caecal enterotypes in indigenous Kadaknath and commercial Cobb chicken lines are associated with Campylobacter abundance and influenced by farming practices. Front. Microbiomes 2023, 2, 1301609. [Google Scholar] [CrossRef]
  22. Yan, W.; Sun, C.; Zheng, J.; Wen, C.; Ji, C.; Zhang, D. Efficacy of fecal sampling as a gut proxy in the study of chicken gut microbiota. Front. Microbiol. 2019, 10, 2126. [Google Scholar] [CrossRef]
  23. Shang, Y.; Kumar, S.; Oakley, B.; Kim, W.K. Chicken gut microbiota: Importance and detection technology. Front. Vet. Sci. 2018, 5, 254. [Google Scholar] [CrossRef] [PubMed]
  24. Park, C.; Kim, S.B.; Choi, S.H.; Kim, S. Comparison of 16S rRNA Gene Based Microbial Profiling Using Five Next-Generation Sequencers and Various Primers. Front. Microbiol. 2021, 12, 693021. [Google Scholar] [CrossRef] [PubMed]
  25. Bolger, A.M.; Lohse, M.; Usadel, B. Trimmomatic: A flexible trimmer for Illumina sequence data. Bioinformatics 2014, 30, 2114–2120. [Google Scholar] [CrossRef] [PubMed]
  26. Pickard, J.M.; Zeng, M.Y.; Caruso, R.; Nunez, G. Gut microbiota: Role in pathogen colonization, immune responses, and inflammatory disease. Immunol. Rev. 2017, 279, 70–89. [Google Scholar] [CrossRef]
  27. Bernard, M.; Lecoeur, A.; Coville, J.L.; Bruneau, N.; Jardet, D.; Lagarrigue, S.; Meynadier, A.; Calenge, F.; Pascal, G.; Zerjal, T. Relationship between feed efficiency and gut microbiota in laying chickens under contrasting feeding conditions. Sci. Rep. 2024, 14, 8210. [Google Scholar] [CrossRef]
  28. Oladele, P.; Ngo, J.; Chang, T.; Johnson, T.A. Temporal dynamics of fecal microbiota community succession in broiler chickens, calves, and piglets under aerobic exposure. Microbiol. Spectr. 2024, 12, e0408423. [Google Scholar] [CrossRef]
  29. Deryabin, D.; Lazebnik, C.; Vlasenko, L.; Karimov, I.; Kosyan, D.; Zatevalov, A.; Duskaev, G. Broiler Chicken Cecal Microbiome and Poultry Farming Productivity: A Meta-Analysis. Microorganisms 2024, 12, 747. [Google Scholar] [CrossRef]
  30. Clausen, U.; Vital, S.T.; Lambertus, P.; Gehler, M.; Scheve, S.; Wohlbrand, L.; Rabus, R. Catabolic Network of the Fermentative Gut Bacterium Phocaeicola vulgatus (Phylum Bacteroidota) from a Physiologic-Proteomic Perspective. Microb. Physiol. 2024, 34, 88–107. [Google Scholar] [CrossRef]
  31. Bajagai, Y.S.; Van, T.T.H.; Joat, N.; Chousalkar, K.; Moore, R.J.; Stanley, D. Layer chicken microbiota: A comprehensive analysis of spatial and temporal dynamics across all major gut sections. J. Anim. Sci. Biotechnol. 2024, 15, 20. [Google Scholar] [CrossRef]
  32. Swelum, A.A.; Elbestawy, A.R.; El-Saadony, M.T.; Hussein, E.O.; Alhotan, R.; Suliman, G.M.; Taha, A.E.; Ba-Awadh, H.; El-Tarabily, K.A.; Abd El-Hack, M.E. Ways to minimize bacterial infections, with special reference to Escherichia coli, to cope with the first-week mortality in chicks: An updated overview. Poult. Sci. 2021, 100, 101039. [Google Scholar] [CrossRef]
  33. Awad, W.A.; Mann, E.; Dzieciol, M.; Hess, C.; Schmitz-Esser, S.; Wagner, M.; Hess, M. Age-related differences in the luminal and mucosa-associated gut microbiome of broiler chickens and shifts associated with Campylobacter jejuni infection. Front. Cell. Infect. Microbiol. 2016, 6, 154. [Google Scholar] [CrossRef] [PubMed]
  34. Feng, Y.; Zhang, M.; Liu, Y.; Yang, X.; Wei, F.; Jin, X.; Liu, D.; Guo, Y.; Hu, Y. Quantitative microbiome profiling reveals the developmental trajectory of the chicken gut microbiota and its connection to host metabolism. iMeta 2023, 2, 105. [Google Scholar] [CrossRef] [PubMed]
  35. Hermans, D.; Van Deun, K.; Martel, A.; Van Immerseel, F.; Messens, W.; Heyndrickx, M.; Haesebrouck, F.; Pasmans, F. Colonization factors of Campylobacter jejuni in the chicken gut. Vet. Res. 2011, 42, 82. [Google Scholar] [CrossRef] [PubMed]
  36. Han, Z.; Pielsticker, C.; Gerzova, L.; Rychlik, I.; Rautenschlein, S. The influence of age on Campylobacter jejuni infection in chicken. Dev. Comp. Immunol. 2016, 62, 58–71. [Google Scholar] [CrossRef]
  37. Van Immerseel, F.; De Buck, J.; Pasmans, F.; Huyghebaert, G.; Haesebrouck, F.; Ducatelle, R. Clostridium perfringens in poultry: An emerging threat for animal and public health. Avian Pathol. 2004, 33, 537–549. [Google Scholar] [CrossRef]
Figure 1. Schematic overview of GI tract sampling for microbiome studies. The figure illustrates the sampling sites of various gastrointestinal (GI) tract regions, viz. crop, small intestine, and ceca. Sampling was conducted at three distinct early growth phases: day 3, day 28, and day 35. At each time point, three samples from each GI tract region were collected for microbiome analysis, providing a comprehensive insight into the microbial community’s temporal diversity across different GI tract regions. The image was created using the Biorender platform.
Microbiolres 16 00054 g001
Figure 2. The most common phyla observed in the gastrointestinal regions of the microbiota of the Kadaknath chicken in their early growth phase (3 to 35 days). (a) The pie chart depicts the overall distribution of phyla. Only the top four abundant and unclassified phyla are labeled, and all remaining phyla are denoted as “other”. The bar chart represents the distribution of (b) phylum and (c) genera at different time points of the early growth phase and different GI regions. Only the top 10 abundant phyla or genera are labeled, and all remaining phyla are denoted as “other”. (d) The Venn diagram depicts the number of unique and shared species in different organs at 3, 28, and 35 days (details in the Supplementary Data S1: ‘core_genus’).
Microbiolres 16 00054 g002aMicrobiolres 16 00054 g002b
Figure 3. Alpha and beta diversity measurements based on age and GI-tract regions. Shannon index, Simpson index, and Bray–Curtis dissimilarities for age and GI-tract regions. With age, microbial diversity and their evenness increase in all three GI-tract regions studied (crop, small intestine, and ceca).
Microbiolres 16 00054 g003aMicrobiolres 16 00054 g003b
Disclaimer/Publisher’s Note: The statements, opinions and data contained in all publications are solely those of the individual author(s) and contributor(s) and not of MDPI and/or the editor(s). MDPI and/or the editor(s) disclaim responsibility for any injury to people or property resulting from any ideas, methods, instructions or products referred to in the content.

