Article

Characteristics of Root Cells during In Vitro Rhizogenesis under Action of NaCl in Two Tomato Genotypes Differing in Salt Tolerance

by
Liliya R. Bogoutdinova
1,*,
Ekaterina N. Baranova
1,2,*,
Neonila V. Kononenko
1,
Inna A. Chaban
1,
Ludmila N. Konovalova
1,2,
Alexander A. Gulevich
3,
Elena M. Lazareva
1,4 and
Marat R. Khaliluev
3,5
1
Cell Biology Laboratory, All-Russia Research Institute of Agricultural Biotechnology, Timiryazevskaya 42, Moscow 127550, Russia
2
N.V. Tsitsin Main Botanical Garden of Russian Academy of Sciences, Moscow 127276, Russia
3
Plant Cell Engineering Laboratory, All-Russia Research Institute of Agricultural Biotechnology, Timiryazevskaya 42, Moscow 127550, Russia
4
Biology Faculty, Lomonosov Moscow State University, Leninskie Gory 1, Building 40, Moscow 119991, Russia
5
Agronomy and Biotechnology Faculty, Moscow Timiryazev Agricultural Academy, Russian State Agrarian University, Timiryazevskaya 49, Moscow 127550, Russia
*
Authors to whom correspondence should be addressed.
Int. J. Plant Biol. 2023, 14(1), 104-119; https://doi.org/10.3390/ijpb14010010
Submission received: 4 November 2022 / Revised: 9 January 2023 / Accepted: 10 January 2023 / Published: 12 January 2023

Abstract

:
Understanding the mechanisms of plant salt tolerance as a complex trait is an integral part of many studies, the results of which have been used in the breeding process. The aim of this study was to compare the root response of two tomato (Solanum lycopersicum L.) genotypes (breeding line YaLF and cultivar Recordsmen) differing in salt tolerance. Rhizogenesis was induced in tomato shoots in vitro with different concentrations of NaCl in the culture medium. A number of morphobiological and cytological parameters were evaluated at the organ, tissue, and cellular levels for possible use in a comprehensive assessment of genotypes for salt tolerance. The influence of NaCl caused disruption of the cell cycle and redistribution of cells in the phases of the cell cycle. An increase in the degree of vacuolization was shown in cv Recordsmen at 75 and 150 mM NaCl and in the YaLF line at 150 mM NaCl. Under salt action, an increase/decrease in the length of cells such as columella cells (both genotypes) and epidermal cells (in cv Recordsmen at 75 and 150 mM NaCl) was shown. Differences between genotypes were demonstrated by changes in the area of the central cylinder and primary root cortex cells, as well as by changes of the Snucleolus/Snucleus ratio in these cells. Transmission electron microscopy (TEM) showed the modification of the chromatin structure in the root cells of these genotypes. Various cytoskeletal disorders were revealed in interphase cells of the tomato root of cv Recordsmen and the YaLF line by immunofluorescent staining under saline conditions. These morphometric and cytological parameters can be used for a comparative evaluation of genotypes differing in salt tolerance in a comprehensive assessment of varieties.

1. Introduction

Salinity is considered one of the major abiotic stresses limiting crop yield. [1]. Salt stress adversely affects vegetative growth and productivity and leads to a decrease in the wet and dry weights of leaves, shoots, and roots. First of all, it causes osmotic stress in the root tissues involved in the absorption of water by the plant, which leads to a reduction in growth rates [2]. The toxic effect of Na+ and Cl ions leads to the disruption of the integrity of the plasma membrane in cells, destruction of organelles, protein synthesis, changes in the structure of enzymes, and respiratory disorders [3]. The influence of salt inhibits cell division and cell elongation, which can also cause reduced growth [4,5]. An increase in the concentration of salts in an imbibed soil solution is accompanied by a significant decrease in the mass of shoots, plant height, and root length [6,7].
In some regions, soil salinity is one of the largest problems in the cultivation of plants, so the use of released salt-tolerant varieties on an industrial scale can significantly increase yields. Most plants, including important commercial and food crops, are glycophytes, which are extremely sensitive to salt concentrations in the soil, for example, the growth inhibition or plant death can be observed under 100–200 mM NaCl [8]. Therefore, one of the most important areas of breeding is the identification of salt-tolerant plant genotypes and their subsequent selection [9]. Currently, considerable attention is paid to the effect of salinity on the root system of glycophytes, which include tomatoes. Thus, tomato (S. lycopersicum L.) is cultivated in open fields in semi-arid and arid climates, where soil salinization is an ongoing problem [10]. During the seedling stage, the tomato is more sensitive to high salt concentrations in the soil compared to the later stages of ontogenesis [11]. A decrease in the length, as well as the wet and dry weights, of tomato roots has been shown with increasing salinity [12]. These characteristics are often used to assess the salt tolerance of tomato genotypes in vitro [13].
Classical methods used to select salt-tolerant cultivars are complex and time-consuming, whereas in vitro methods allow for selection over a short period of time and at different stages of development [13,14]. A study by Cano et al. (1998) revealed the possibility of using an in vitro system to evaluate the salt tolerance of cultivated (Lycopersicon esculentum Mill.) and wild (Lycopersicon pennellii (Correll) D’Arcy) tomato species using callus culture [15]. Some results indicate a positive correlation in terms of salinity tolerance between seedlings and adult plants [16].
The study of the mechanisms of plant resistance to salinity suggests the need to use an integrated approach subject to constant controlled conditions. Thus, the purpose of this work was to carry out a comparative assessment of the response of the roots of two tomato genotypes differing in salt tolerance regenerated under different conditions of NaCl salinity in vitro at different levels of organization in terms of a number of morphobiological and cytological indicators that can be proposed for a comprehensive assessment of genotypes for salt tolerance.

2. Materials and Methods

The objects of research were two tomato genotypes (Solanum lycopersicum L.) of different ecological and geographical origin: the YaLF breeding line and the cultivar Recordsmen selected in the Central and Lower Volga regions of the Russian Federation, respectively. The territories of these regions differ significantly in the degree of soil salinity, as a result of which the studied genotypes may differ in salt tolerance (non-tolerant line YaLF and tolerant cultivar Recordsmen). Therefore, these two genotypes were chosen as objects for study. The YaLF breeding line was isolated from the Yamal variety in the N.N. Timofeev breeding station of the K.A. Timiryazev Russian State Agrarian University, Moscow Agricultural Academy (kindly provided by Monakhos G.F.). The breeding line is used as a paternal form when obtaining the F1 Junior hybrid, which is included in the state register of breeding achievements and approved for use in the Russian Federation for cultivation in all regions in garden plots, home gardens, and small farms.
The tomato cultivar Recordsmen was obtained from Agrovnedrenie. In 2004, it was included in the state register of breeding achievements and approved for use on the territory of the Russian Federation for cultivation in all regions in garden plots, household plots, and farms [17].

2.1. Obtaining of Tomato Seedlings

During the first stage, the seeds were sterilized for 10 s in 96% ethanol, then for 7–8 min in a 20% aqueous solution of chlorine-containing commercial bleach ACE with the addition of 0.01% Tween 20. Then, the seeds were washed with autoclaved distilled water and placed in cultural vessels with Murashige and Skoog (MS) nutrient medium [18] supplemented with 3% sucrose and 0.7% agar (pH = 5.7–5.8) under aseptic conditions. Further in vitro cultivation was carried out, and donor seedlings were obtained according to the method described [19]. In each variant of the experiment, 10 seedlings were used, with 3 replicates (Supplementary Materials Figure S1).
The frequency of rhizogenesis and the morphometric characteristics of regenerated roots were assessed on the 8th day of the experiment (Supplementary Materials Figure S1). The frequency of rhizogenesis (%) was determined as the ratio of the number of seedlings with root organogenesis relative to the total number of seedlings. In addition, during cultivation, the time of the beginning of root formation and the number (pieces) of roots, as well as their length (cm) and wet and dry biomass (mg), were noted. Fresh and dry root weight was assessed using an analytical balance (Sartorius, Goettingen, Germany). To determine the dry weight, the roots were incubated at 65 °C until a constant weight was reached.

2.2. Light and Transmission Electron Microscopy (TEM)

Fragments of root tips with a length of 0.4 cm were fixed for 2 h at room temperature in a 2.5% solution of glutaraldehyde (Merck, Darmstadt, Germany) in 0.1 M Sorensen’s phosphate buffer (pH 7.2) with the addition of 1.5% sucrose (Supplementary Materials Figure S1). Then, the plant material was washed from the fixative in 0.1 M Sorensen’s buffer (pH 7.2) and additionally fixed with 1% OsO4 (Sigma-Aldrich, St. Louis, MO, USA) for 1 h at 4 °C. During the next stage, the fixed material was dehydrated in aqueous ethanol solutions of increasing concentration (30, 50, 70, 96, and 100%), followed by propylene oxide (Fluka, Germany) and embedded in a mixture of Epon812 and Araldit M epoxy resins (Merck, Germany) according to the standard method [20]. Sections with a thickness of 1–2 μm were obtained with a glass knife using an LKB-V ultramicrotome (LKB, Stockholm, Sweden), placed on glass slides, and embedded in a mixture of epoxy resins. Semi-thin sections were analyzed and photographed using an Olympus BX51 microscope (Olympus, Tokyo, Japan) equipped with a Color View II camera (Soft Imaging System, Muenster, Germany). During the study, cells of the columella, the primary cortex, and the central cylinder of the root were analyzed. Morphometric characteristics of cells (length and area) were determined using Cell A software (Olympus, Japan). When measuring each experimental variant, 300 cells of three roots of independent seedlings were analyzed (threefold repetition). The indicator is the ratio of the nucleus area of a particular cell to the area of the nucleolus of the same cell. This parameter was calculated for at least 300 cells of each tissue type (bark and central cylinder) from the roots of three different seedlings of the same variant. In our study, visual assessment was used to quantify the number and size of vacuoles. Ultrathin sections were obtained on an LKB-V ultramicrotome (LKB, Sweden) using a diamond knife (DuPont Instruments, Boynton Beach, FL, USA), placed on blends coated with Formvar support, and counterstained with uranyl acetate and lead citrate according to Reynolds [21]. The preparations were analyzed and photographed using an H-500 electron microscope (Hitachi, Tokyo, Japan) at an accelerating voltage of 75 kV.

2.3. Immunofluorescent Staining with Antibodies to Tubulin

Preparations of macerated cells were obtained according to the method described in [22]. The preparations were stained with DAPI (Sigma-Aldrich, St. Louis, MO, USA), embedded in Mowiol 4-88 (Hoechst, Frankfurt, Germany), and analyzed on an Axiovert 200 M microscope (Zeiss, Berlin, Germany) with epifluorescent illumination, a set of filters (with an excitation peak of 450–480 nm and an emission peak of 515–565 nm for Alexa Fluor 488 and an excitation peak of 365 nm and an emission peak of 420 nm for DAPI), and a Neola 100/1.24 lens. Sample photographs were taken with an AxioCam HRm digital camera (Carl Zeiss, Oberkochen, Germany) and processed in Adobe Photoshop 6.0.

2.4. Cytophotometric Analysis

Fragments of tomato root tips with a length of 4–5 mm were fixed in a mixture of ethanol and acetic acid (3:1) for 3 h, and hydrolysis was carried out with 5 N HCl for 40 min at 22 °C. The preparations were stained with Schiff’s reagent (Merck, Darmstadt, Germany). The DNA content was determined in relative units on an SMP-20 cytophotometer (Opton, Frankfurt am Main, Germany) with a ×16 objective, ×10 ocular, and a 0.08 mm probe. The nuclei of root meristematic cells in the stages of telophase (2C) or metaphase (4C) were used as a standard. For each variant, at least 300 nuclei from meristematic cells of 15 root fragments were analyzed in triplicate.

2.5. Statistical Analysis

Statistical treatments of experimental data were performed at a 5% significance level using analysis of variance (ANOVA) and Duncan’s multiple range tests with AGROS software (version 2.11, Moscow, Russia), as well as standard MS Excel software packages.

3. Results

Concentrations inhibiting root organogenesis, as well as the start time of root organogenesis, were established for the studied tomato genotypes in the growth process of seedlings on MS nutrient medium supplemented with 25–300 mM NaCl. In fragments of tomato seedlings of both genotypes, root formation was shown on the fourth day under control conditions. An increase in the time for the beginning of root formation was observed on the fifth day in both genotypes at 150 mM. A decrease in the frequency of rhizogenesis in the YaLF line was observed under conditions of 200 mM NaCl. In contrast to the YaLF line, a slight decrease in the frequency of rhizogenesis to 93.3% was observed in fragments of cv Recordsmen seedlings on a medium containing 250 mM NaCl.
When fragments of tomato seedlings were cultivated on a medium for rhizogenesis induction under saline conditions, significant differences between genotypes in the number of formed roots and their length were established (Figure 1). The presence of NaCl in the medium at the lowest concentration (25 mM) led to a significant decrease in the number of regenerated roots in tomato seedlings of the YaLF line compared to the control. Moreover, a significant increase in root length was observed. A subsequent decrease in the number of roots was noted under conditions of 150 mM NaCl (Figure 1a). In contrast to the YaLF line, a decrease in the number of roots in tomato seedlings of cv Recordsmen was observed only under conditions of 150 mM NaCl salinity, and the minimum NaCl concentration did not lead to a significant increase in root length (Figure 1b). The formation of shortened roots compared to the control was observed when seedlings of both tomato genotypes were cultivated on a medium for induction of rhizogenesis with the addition of 100 mM NaCl and higher. Furthermore, with an increase in the concentration of the stress factor, a significant decrease in root length occurred.
The presence of NaCl in the composition of the nutrient medium had a significant effect on the wet weight of regenerated roots in seedlings of both tomato genotypes (Figure 2a). An inverse relationship was established between the wet biomass index of roots regenerated on one seedling and the intensity of NaCl salinity. Moreover, there were no statistically significant differences between the studied tomato genotypes. In contrast to wet biomass, significant differences between genotypes were established in terms of dry weight of regenerated roots (Figure 2b). In general, both tomato genotypes were characterized by a decrease in dry root biomass with increased NaCl concentration in the nutrient medium. However, for the YaLF line, a significant decrease in this indicator compared to the control was already noted when seedlings were cultivated on a medium containing NaCl at the lowest concentration (25 mM), whereas for cv Recordsmen decreased dry root biomass occurred only under conditions of 100 mM NaCl and higher.
The results of cytophotometric analysis of the root meristem cells are shown in Figure 3. Both in the control plants of the YaLF line and in those grown at a concentration of 75 mM NaCl, the largest number of cells was observed in the G1 phase, with the fewest cells in the G2 phase of the cell cycle. With an increase in concentration to 150 mM, a decrease in the number of cells in the G1 phase and an increase in the G2 phase occurred compared with the control.
There was a slight decrease in the number of cells in the G1 phase compared with the control and a significant increase in the number of cells in the G2 period in tomatoes of cv Recordsmen at concentrations of 75 mM NaCl. An increase in concentration to 150 mM resulted in a decrease in the number of cells in the G1 phase and an increase in the number of cells in the G2 phase up to the formation of a block. Thus, significant differences between the tomato genotypes in the distribution of cells according to cell cycle phase were revealed at a concentration of 150 mM NaCl; the number of cells in the G1 period in the YaLF tomato line was 1.8 more than that in cv Recordsmen.
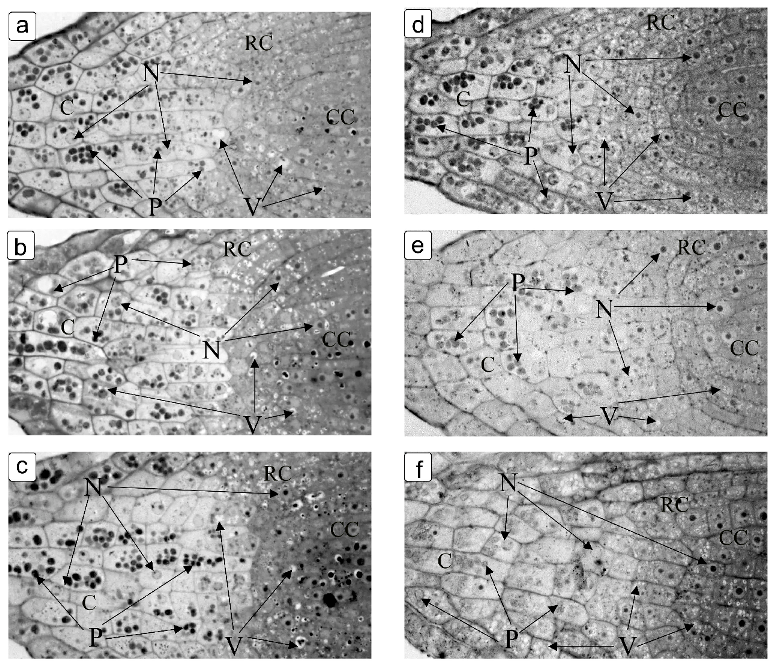
We studied the structural organization of tomato roots using semi-thin longitudinal sections of the YaLF line and cv Recordsmen (Figure 4) formed by rhizogenesis in seedlings when they were cultivated on nutrient media supplemented with 0.2 mg/L IBA and various concentrations of NaCl.
The stress-induced vacuolar changes appear to be related to the cell’s need to move salt ions into vacuoles. These changes include an enlargement of vacuoles under stress, the fusion of several vacuoles into one, and an increase in the number of vacuoles in cells. This can be designated as a change in “the degree of cell vacuolization”. The increase in vacuole volume may be partly caused by vesicle transport [23]. Various vacuolar functions are provided by different types of vacuoles, namely lytic vacuoles, protein storage vacuoles, pigment storage vacuoles, and prevacuolar compartments [24]. In our study, cell morphometry was used to quantify the number and size of vacuoles. During the study, the degree of vacuolization of the cells of the cap and cortex, as well as the length of the cells of the columella and epidermis, were analyzed. In the YaLF line at 75 mM NaCl, the degree of vacuolization of the cytoplasm of the cap cells remained comparable to that of the control, whereas an increase in this indicator compared to the control variant was shown at 150 mM NaCl (Figure 4). Damaging effects of NaCl in the roots of cv Recordsmen manifested in cell vacuolization compared with the control were observed in root cap cells only at 150 mM NaCl (Figure 4).
In the cells of the root cortex (RC) of the YaLF line at 75 mM NaCl, no increase in the degree of vacuolization was observed, whereas at 150 mM NaCl, an increase in this indicator was shown compared to the control variant. Damaging effects of NaCl in the cells of the root cortex of cv Recordsmen, expressed as an increase in cell vacuolization compared to the control, were noted at 75 and 150 mM NaCl.
Cytological examination revealed a change in the length of columella cells of both tomato genotypes. Thus, a decrease in the length of columella cells in the YaLF line was noted compared with the control variant at a concentration of 75 mM NaCl in the nutrient medium, whereas an increase in the length of the cells was observed at 150 mM NaCl. In cv Recordsmen, an increase in the length of columella cells was observed compared to the control at 75 and 150 mm NaCl (Table 1).
In addition, the change in the length of epidermal cells was studied. In epidermal cells of the YaLF line at 75 mM NaCl, a decrease in cell length was observed, whereas at 150 mM NaCl, cells were elongated. A decrease in the length of epidermal cells in cv Recordsmen at 75 and 150 mM NaCl was observed (Table 1).
A comparison was also made of the cell area in the cortex and the central cylinder of regenerated tomato roots in both tomato genotypes (Figure 5). The area of RC cells in the YaLF line was found to remain unchanged at 75 and 150 mM NaCl (Figure 5a). In cv Recordsmen, the area of RC cells was comparable to the control at 75 mM NaCl, whereas at 150 mM NaCl, it decreased (Figure 5b). In CCR (central cylinder of the root) cells of cv Recordsmen, the cell area increased at 75 and 150 mM NaCl compared to cultivation without salt treatment.
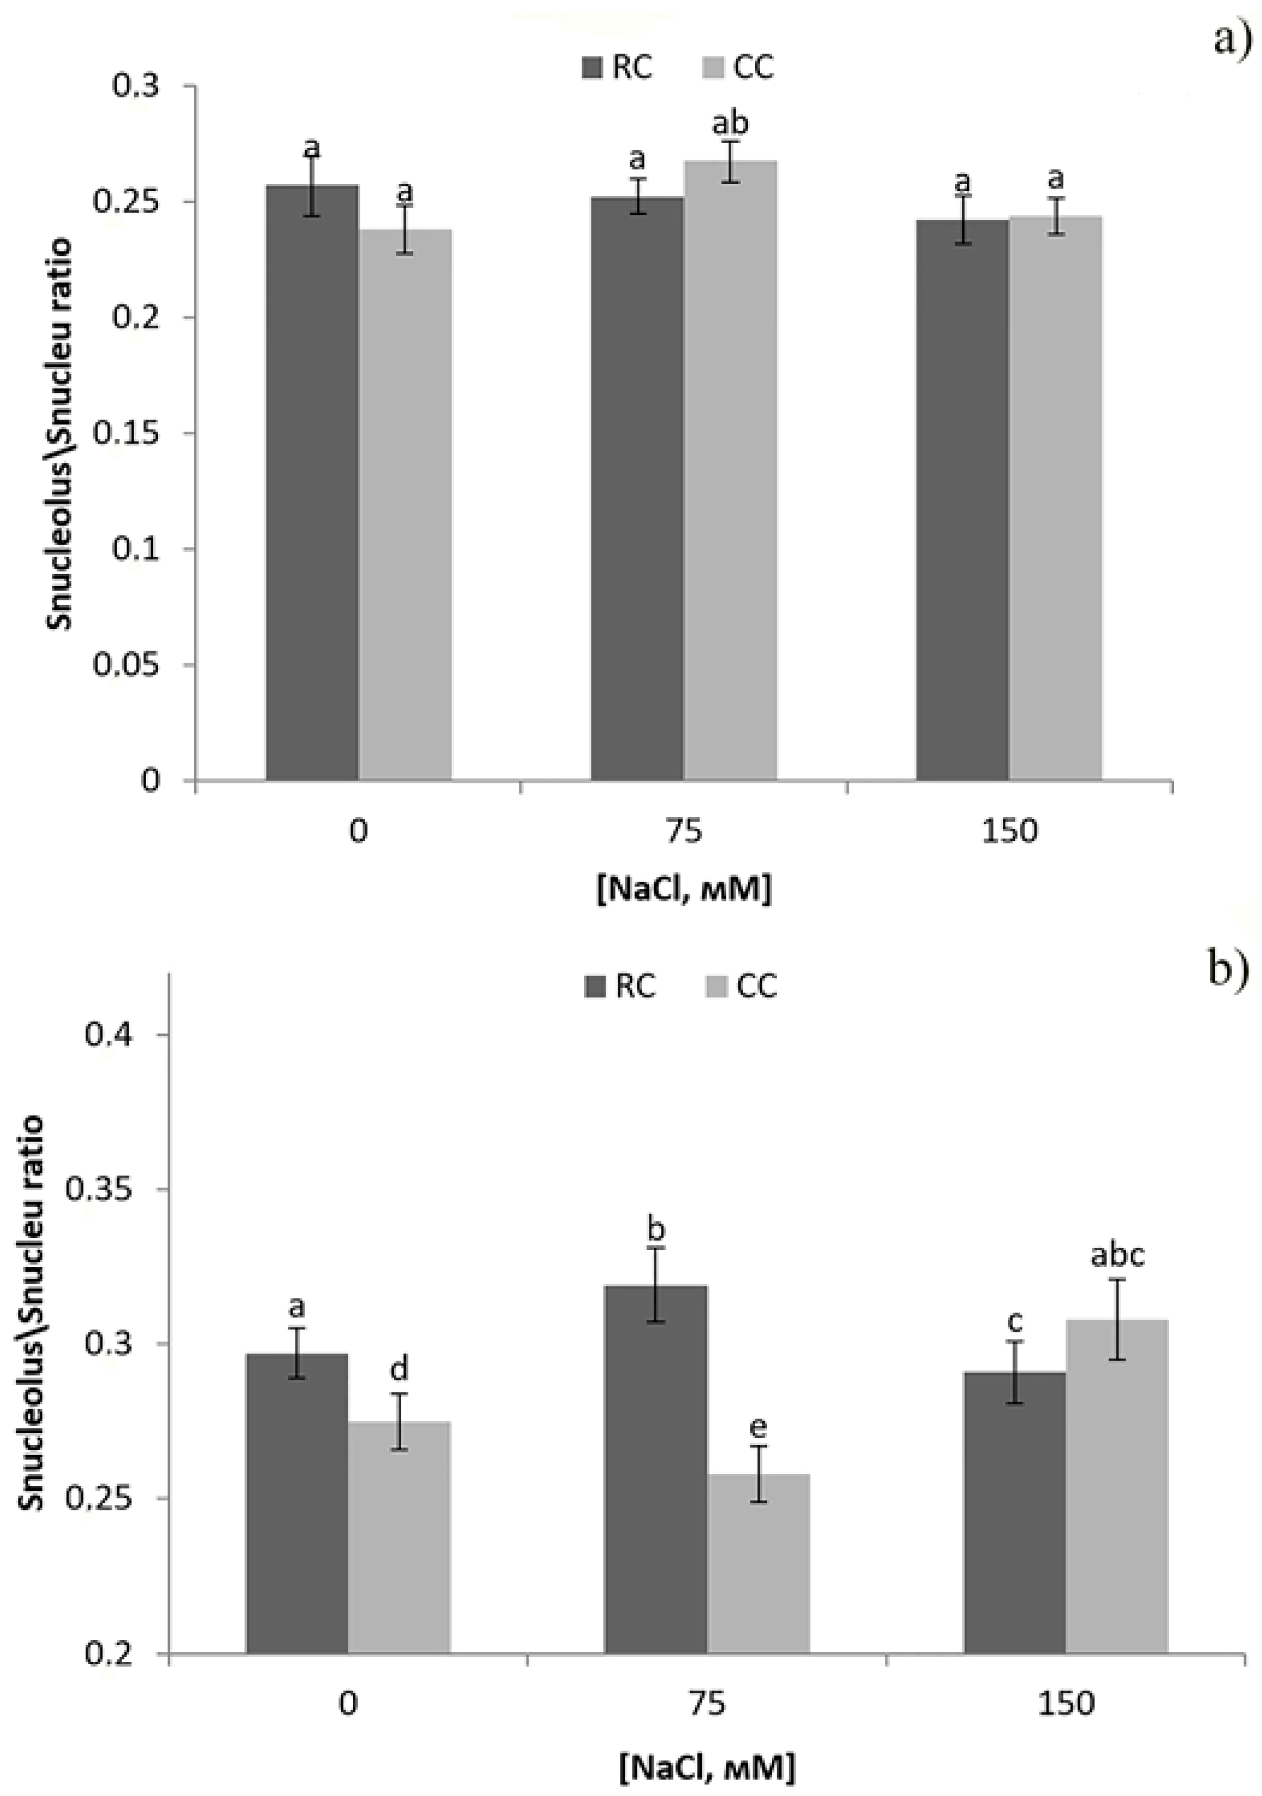
To indirectly determine the synthetic activity of tomato cells in both genotypes, the nucleolus–nucleus ratio in RC and CCR cells was studied. In the YLF line, the nucleolus–nucleus ratio in RC cells did not change when NaCl was added at all concentrations studied (Figure 6a). In cv Recordsmen, an increase in the Snucleolus/Snucleus ratio at 75 mM NaCl in RC cells was observed, whereas no significant differences were found at 150 (Figure 6b). In the YLF line, the Snucleolus/Snucleus ratio in CCR cells increased at 75 mM NaCl, whereas it remained at the control level at 150 mM NaCl. In cv Recordsmen, the Snucleolus/Snucleus ratio decreased in CCR cells at 75 mM NaCl (Figure 6a,b) and increased at 150 mM NaCl.
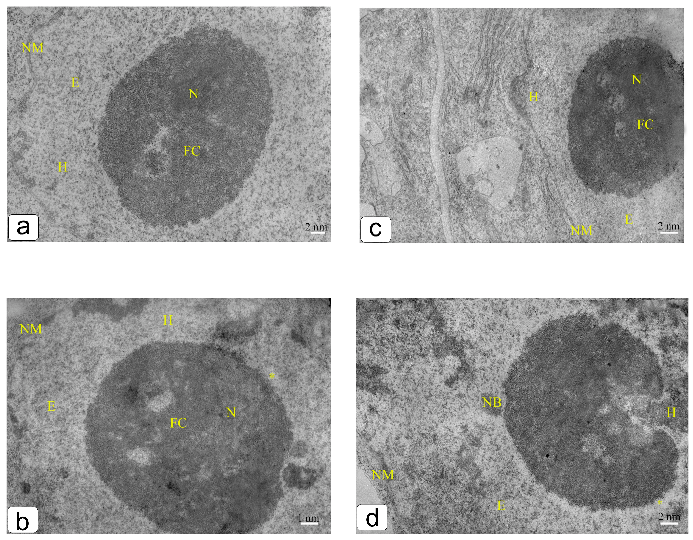
Because our examination of the Snucleolus/Snucleus ratio revealed changes in both genotypes, a study of the nuclear compartment ware carried out using TEM. The ultrastructural organization of nuclear compartments is characteristic of the parenchymal cells of the proliferating root zone (Figure 7; Supplementary Materials Figure S2). The nuclei had a central location; a nuclear membrane with shallow, pronounced invaginations was observed in the YaLF line (Figure 7a), and a nucleus with a rounded shape was observed in cv Recordsmen (Figure 7b). The nucleoli are round with clearly defined fibrillar centers (FCs) containing areas of condensed chromatin. The fibrillar zone in the FCs was weakly expressed under cultivation conditions without the addition of NaCl (Figure 7a,b). Most of the nucleolus was occupied by ordered preribosomal particles characterized as the granular component of the nucleolus. The main volume of the nucleoplasm had a structure characteristic of a tomato in a dispersed state of chromatin (euchromatin). Miniature clumps of condensed chromatin (heterochromatin) were observed along the periphery of the nucleus in the YaLF line (Figure 7a). The nuclei of cv Recordsmen were characterized by a different structure; in addition to small clumps associated with the nuclear membrane, there were also larger fragments of heterochromatin (Figure 7b).
The action of NaCl did not lead to a significant change in the ratio of osmotic pressure between the nucleus and cytoplasm and was variety-specific. For example, nuclear membrane invaginations did not change in the YaLF line (Figure 7c). The shape of the nucleus also remained unchanged in the cells of cv Recordsmen (Figure 7d). The density of the FC was increased. A clearly defined peripheral zone containing granular structures corresponding to proribosomes was visible in the nuclei (Figure 7c,d). The nucleoli of cv Recordsmen had a visible division into granular and fibrillar zones. The nucleoli also contained a clearly defined region of condensed chromatin corresponding to the nucleolus-forming region of the chromosome, which was well-defined inside the nucleolus. Such a structure is usually categorized as a segregated nucleolus. The nucleoplasm in the YaLF line changed insignificantly under the action of NaCl, but the number of clumps of condensed chromatin associated with the nuclear membrane was decreased (Figure 7b). The change in the nucleoplasm of the nuclei in cv Recordsmen under the impact of salt was more pronounced; chromatin clumps were noted in all zones of the nucleoplasm, with a branched structure along the periphery in which ordered globular formations could be observed (Figure 7d). In the YaLF line, the presence of nuclear bodies containing globular formations was noted in the interphase nuclei under both normal conditions and under the influence of salt (Figure 7b,d). It can be also noted that the volume of the nucleoli was less than in the control in both genotypes (Figure 7c,d).
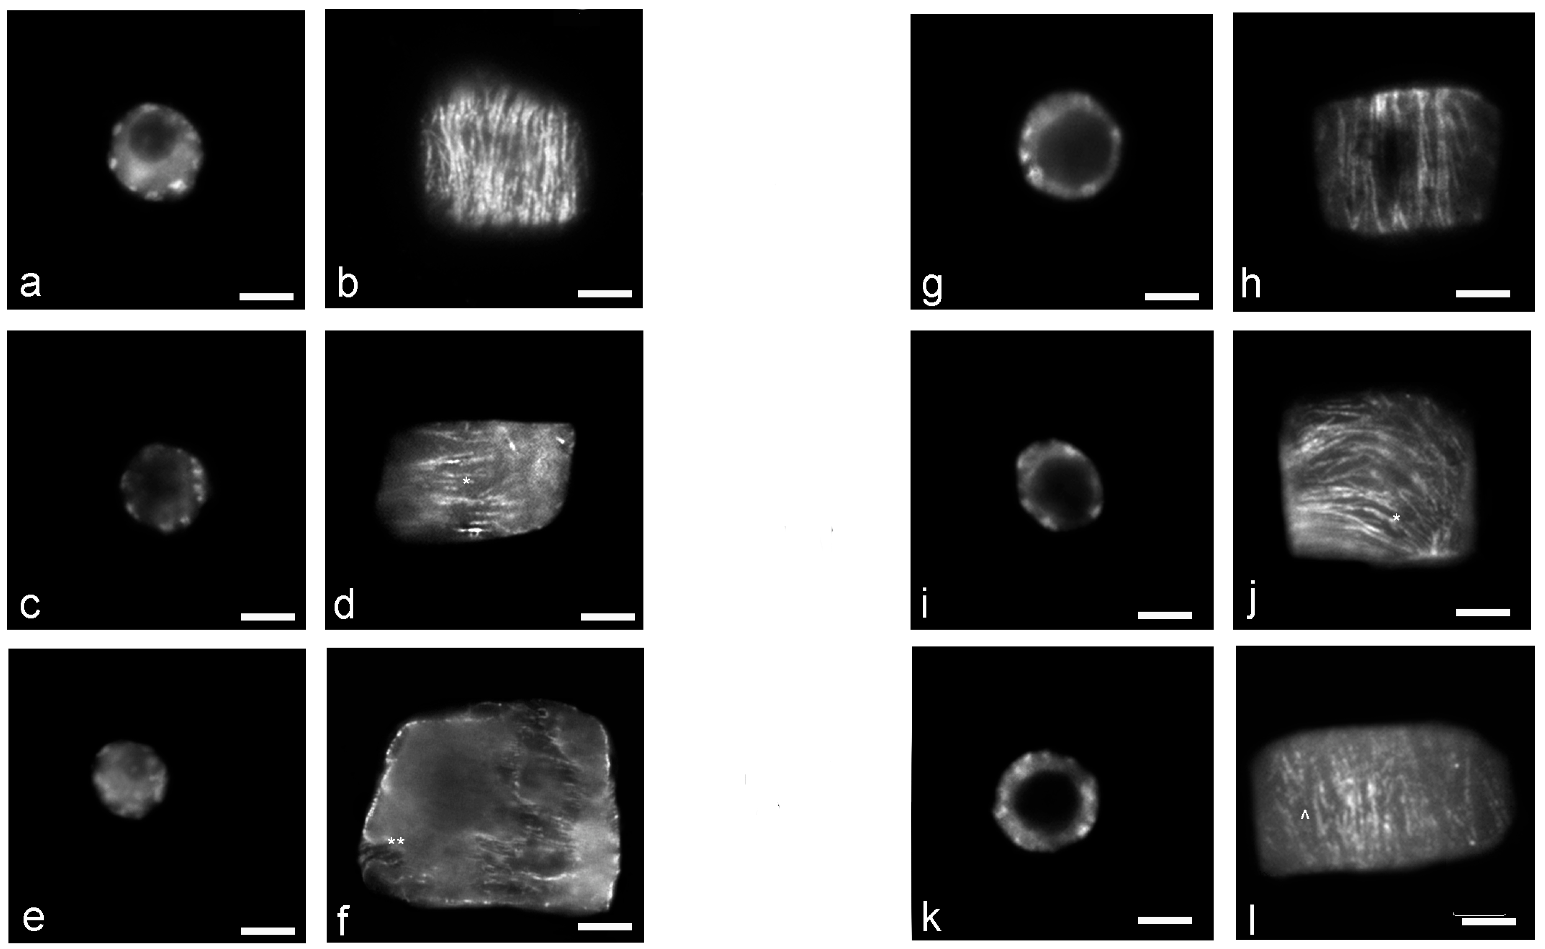
Changes in cellular parameters such as cell length can be associated with many factors, including changes in the cytoskeleton. In the interphase root cells of tomato seedlings in the YaLF line and cv Recordsmen, a clear and ordered network of bundles of cortical microtubules was revealed (Figure 8b,h). The network of cortical microtubules changed in both tomato genotypes at 75 mM NaCl (Figure 8d,j). The YaLF line showed fragmentation of microtubule bundles, noticeable thinning, and disruption of the cortical network order. When the NaCl concentration was increased to 150 mM, the performance of the plasma membrane was disturbed in the root cells of YaLF line seedlings. Invaginations were detected on the surface, and the cortical network of microtubules was disorganized (Figure 8f). Numerous cortical bundles were thinner than in control cells. In cv Recordsmen, the network of cortical microtubules changed, which was manifested in the disruption of the network arrangement at 75 mM NaCl, whereas thinning of microtubules was characteristic under conditions of 150 mM NaCl (Figure 8l).

4. Discussion

Salt stress is known to cause structural and anatomical changes in the root cells themselves [4,22,25,26]. Salinity inhibits cell division and tissue expansion [5,22], which may explain the decrease in the length and number of roots demonstrated in both genotypes in our study. However, in cv Recordsmen, as a more salt-tolerant variety, a decrease in these indices was observed at a higher concentration of NaCl (the number of roots was reduced at 150 mM, and the length was reduced at 100 mM).
Other studies have shown a decrease in the length, as well as the wet and dry mass, of shoots and roots with an increase in salinity [27], which is consistent with the decrease in wet and dry root biomass observed in both examined genotypes in the present study. The fresh weight of YaLF line plants decreased in proportion to the increase in the salt concentration in the medium. Moreover, the dry weight of YaLF tomatoes significantly declined when seedlings were cultivated on a medium containing 25 mM NaCl, whereas in cv Recordsmen, such a decrease was observed at a NaCl concentration of 100 mM and higher. A change in the water content in root tissues inhibits growth [28] and may reduce the fresh weight [29]. A decrease in root dry weight can be caused by a decrease in photosynthesis products [30] or by a delay in the entry of metabolites into the root system [31]. The differences between varieties shown observed in the present study are consistent with the data reported in other studies. Alsafari et al. (2019) found a decrease in the dry and wet biomass of the roots of Marmande and Oria tomato varieties with the addition of NaCl [32].
In response to environmental stress factors, meristematic cells can switch to an endoreduplication cycle in which mitosis is absent [33]. As a consequence, a high level of ploidy affects the morphology of both the nucleus and the cell [34]. Studies in tomatoes have provided new data in favor of the karyoplasmic ratio theory, which states that there is a causal relationship between the increase in the volume of the nucleus and cytoplasm (and therefore the volume of the cell) [35]. As a result of our study, a change in the parameters of the cell cycle in the roots of both tomato genotypes under the influence of NaCl was established, which manifests itself in the redistribution of cells across the phases of the cell cycle and may be due to the transition to the endoreduplication cycle. The accumulation of cells in one of the phases, leading stoppage (blockage) of the cell cycle, was noted in seedlings of tomato cv Recordsmen under the action of NaCl in the G2 phase, which inhibits division, stopping the mitosis process.
Compartmentalization of sodium in vacuoles is considered one of the key mechanisms of adaptation to salinity. Plant cells contain several types of vacuoles [36]. When storage protein is utilized, vacuoles merge, with the subsequent formation of a large central vacuole and a change in the protein composition of the vacuolar membrane [37,38]. Thus, the formation of vacuoles in root cells under the influence of NaCl was shown to be associated with the use of storage protein and subsequent fusion of vacuoles [20]. Vacuoles in the bark cells of the root tips of Hordeum vulgare L. and mangrove Bruguiera sexangula (Lour.) Poir. swelled for 3 h in response to increased salt concentrations (150 mM NaCl) [39]. The same was found in Arabidopsis thaliana [40]. A decrease in the degree of vacuolization in the cells of the aleurone layer reported under conditions of salt stress may have been due to changes in the active cytoskeleton [41]. It was mentioned in previous works that vacuolization of root tip cells may be an adaptive response to the accumulation of excess ions under saline conditions, which protects the cytoplasm from toxic levels of ions [42]. In a study by Ibrahim et al. (2019), root cell vacuolization was also observed under salt stress in barley [43]. Vacuolization in tomato root cells of cv Recordsmen (at 75 and 150 mM NaCl) and the YaLF line (at 150 mM NaCl) under salinity conditions may be associated with differences in the properties of the vacuolar membrane and changes in the osmotic potential, transport, and activity of enzymes, as well as with a violation of the cytoskeleton. In addition, this may be due to the occurrence of a non-optimal pH value [44].
Salinity prevents cell division and cell elongation, which can contribute to a decrease in the size of the apical meristems, cortex, and vascular cylinder and cause a decrease in growth [45]. Cell expansion depends primarily on the osmotic potential and turgor, as well as the ability of the cell wall to stretch. The change in the length of columella cells in both genotypes and the length of epidermal cells in cv Recordsmen at 75 and 150 mM NaCl observed in the study may have occurred due to a change in cell expansion, which, accordingly, affects the length of the whole root. Li et al. (2011) showed a slight increase in the size of tomato cells when exposed to 200 mM NaCl for 48 h and a significant increase after 96 h at the same concentration [46]. A similar effect of salinity on the anatomical structure of tomato root cells was demonstrated by Alsafari [32]. In our study, an increase in the area of cells of the central cylinder in the YaLF line at 150 mM NaCl was noted, but a decrease in the area of cells of these tissues was also noted at 75 mM NaCl. In the cells of the central cylinder of the root in cv Recordsmen at 75 and 150 mM NaCl, the cell area was increased, whereas the area of the primary root cortex at 150 mM NaCl was decreased, in contrast to the YaLF line. These changes may be associated with a violation of the water balance of plants under the action of NaCl, which is expressed by a decrease in tissue hydration, leading to a decrease in cell size [2].
The degree of chromatin condensation can change under the influence of environmental factors [47,48,49]. Under the influence of stressors, a change in the shape of the nucleus and nuclear membrane is observed, and invaginations can form [50]. In this study, significant changes in the ultrastructure of the nuclear compartment under stress were described. It can be assumed that the condensation/decondensation of chromatin depends on changes in the pH level in the nucleus and the content of certain ions, such as Ca2+ or Mg2+, and is a result of disturbances in acetylation, methylation, phosphorylation, and other chromatin modifications. The above reasons, in combination or separately, can cause the changes in Snucleolus/Snucleus ratio observed in this work in the cells of the cortex and the central cylinder in the root of cv Recordsmen and in the cells of the central cylinder of the YaLF line. Changes in the chromatin structure in these genotypes were also confirmed at the ultrastructural level. Both normally and under the influence of various factors, the morphological features of the structural organization of the nucleus according to the genotype may be preserved [51]. However, damage to nuclei is often detected by studying the ultrastructure of nuclei in cells exposed to salt. Thus, when exposed to salinity, serious damage to the structure of the nuclei and nuclear membranes of roots cells of wheat varieties was reported in [52]. Goswami et al. (2020) showed that hyperosmotic stress reduces the roundness and size of nuclei, in combination with an increase in the expression of sensory response genes [53]. In seedlings not exposed to mannitol, most of the nuclei were round, whereas the nuclei of treated cells were irregular in shape and reduced in size. Under conditions of reduced osmotic stress, i.e., 0.15 M mannitol, no nuclear deformation was found in root meristems. This study shows three responses of the nucleus to hyperosmotic stress: with up to 0.15 M mannitol, the shape of the nucleus is stable; with 0.3 M mannitol, the nuclei shrink; and above 0.3 M mannitol, the nuclei are even more deformed, and the cells die, which corresponds to damage under strong hyperosmotic conditions. Stress affects the shape of nuclei [54,55]. It has also been shown that hyperosmotic stress leads to a decrease in the size of the nucleus due to the uneven distribution of macromolecules between the cytoplasm and nucleoplasm [56].
Under salinity conditions, we observed segregation of nucleoli and an increase in fibrillar compartments. This effect is often described under abiotic influences [57]. We observed decondensation of chromatin and the disappearance of clumps in the YaLF line and a decrease in heterochromatin and the size of its clumps in cv Recordsmen under the action of salt. A change in chromatin condensation was also noted under the action of heat stress [58]. The effects of changes in the ratio of eu- and heterochromatin are characteristic of cells subjected to abiotic stresses, which is associated with complex biochemical processes of chromatin remodeling that result in changes in expression [8,59].
It has been shown that microtubules play an important role in abiotic stress due to changes in their location and structural organization and can cause changes in cell size [60,61,62]. Atypical components of the cytoskeleton in tomato root cells exposed to NaCl and Na2SO4 at different levels of ROS, as well as shortening and thinning of microtubules, were observed in the cytoplasm of tobacco root cells in longitudinal and transverse sections [63]. Thus, microtubules play crucial roles in plant adaptation and tolerance to salt stress [64,65]. In cv Recordsmen and the YaLF line, in addition to bundles of different densities, thinning of the cortical network was shown, and in the YaLF line, a violation of the ordered arrangement of microtubules was also found. Another reason for the changes described herein may be associated with MAP proteins, which change the organization, dynamics, and stability of cortical microtubules, thereby facilitating cell adaptation to increased salinity.

5. Conclusions

As a result of the study of the influence of NaCl on tomato genotypes differing in tolerance, significant differences were established in terms of morphometric and cytological criteria. Differences in quantitative criteria were manifested at the organ level in terms of the number and length of roots, as well as their fresh and dry weight. In addition, the contrasting genotypes differed in the length of the epidermal and columella cells, the area of the root cells, and the nucleolus–nucleus ratio in the cells of the primary cortex and the central cylinder of the root. Changes in the cell cycle were also observed at the cellular level. Differences in qualitative indicators were revealed, at the tissue level, as reflected by a change in the degree of vacuolization of the cap and cortex cells. At the cellular level, noticeable differences were observed in qualitative characteristics such as the structure of the microtubule system and the ultrastructure of nuclei and nucleoli. The data obtained during this study can be used to optimize methods for selecting salt-tolerant plants in the early stages of their development, which can significantly accelerate the breeding process. This approach can also be used for other model plants and valuable crops in relation to other stressful environmental effects (for example, heavy metals, drought, and other stressors).

Supplementary Materials

The following supporting information can be downloaded at: https://www.mdpi.com/article/10.3390/ijpb14010010/s1, Figure S1: Nuclear ultrastructural organization in the cells of the primary root cortex. Figure S2: (addition to the Figure 7). Nucleus ultrastructural organization in the cells of the primary root cortex of the YaLF line (A—control, C—150 mM NaCl) and cv Recordsmen (B—control, D—150 mM NaCl) in vitro in photographs obtained by TEM. Abbreviations: H—het-erochromatin, FC—fibrillar center, E—euchromatin, N—nucleolus, NB—nuclear body, NM—nuclear membrane, *—electron-transparent region around the nucleolus.

Author Contributions

Conceptualization, E.N.B. and M.R.K.; methodology, L.R.B., E.N.B., and M.R.K.; software, A.A.G.; validation, E.N.B. and A.A.G.; formal analysis, L.R.B., E.N.B., and M.R.K.; investigation, L.R.B., E.N.B., N.V.K., I.A.C., L.N.K., and E.M.L.; resources, E.N.B. and M.R.K.; data curation, E.N.B., L.N.K. and M.R.K.; writing—original draft preparation, L.R.B., E.N.B., and M.R.K.; writing—review and editing, E.N.B. and A.A.G.; visualization, E.N.B. and A.A.G.; supervision, E.N.B. and M.R.K.; project administration, E.N.B. and M.R.K. All authors have read and agreed to the published version of the manuscript.

Funding

This manuscript was written according to assignment No. 0431-2022-0003 (ARRIAB) and 122042700002-6 (MBG RAS) of the Ministry of Science and Higher Education of the Russian Federation.

Institutional Review Board Statement

Not applicable.

Informed Consent Statement

Not applicable.

Data Availability Statement

Not applicable.

Conflicts of Interest

The authors declare no conflict of interest.

References

  1. Flowers, T.J. Improving crop salt tolerance. J. Exp. Bot. 2004, 55, 307–319. [Google Scholar] [CrossRef] [PubMed]
  2. Safdar, H.; Amin, A.; Shafiq, Y.; Ali, A.; Yasin, R.; Shoukat, A.; Sarwar, M.I. A review: Impact of salinity on plant growth. Nat. Sci. 2019, 17, 34. [Google Scholar]
  3. Baetz, U.; Eisenach, C.; Tohge, T.; Martinoia, E.; De Angeli, A. Vacuolar chloride fluxes impact ion content and distribution during early salinity stress. Plant Physiol. 2016, 172, 1167. [Google Scholar] [CrossRef] [PubMed] [Green Version]
  4. Islam, F.; Yasmeen, T.; Arif, M.S.; Ali, S.; Ali, B.; Hameed, S.; Zhou, W. Plant growth promoting bacteria confer salt tolerance in Vigna radiata by up-regulating antioxidant defense and biological soil fertility. Plant Growth Regul. 2016, 80, 23. [Google Scholar] [CrossRef]
  5. Baranova, E.N.; Gulevich, A.A. Asymmetry of plant cell divisions under salt stress. Symmetry 2021, 13, 1811. [Google Scholar] [CrossRef]
  6. Civelek, C.; Yildirim, E. Effects of exogenous glycine betaine treatments on growth and some physiological characteristics of tomato under salt stress condition. Atatürk Üniv. Ziraat Fakült. Dergisi. 2019, 50, 153. [Google Scholar]
  7. Ghorbani, A.; Omran, V.O.G.; Razavi, S.M.; Pirdashti, H.; Ranjbar, M. Piriformospora indica confers salinity tolerance on tomato (Lycopersicon esculentum Mill.) through amelioration of nutrient accumulation, K+/Na+ homeostasis and water status. Plant Cell Rep. 2019, 38, 1151. [Google Scholar] [CrossRef]
  8. Malcolm, C.V.; Lindley, V.A.; O’Leary, J.W.; Runciman, H.V.; Barrett-Lennard, E.G. Halophyte and glycophyte salt tolerance at germination and the establishment of halophyte shrubs in saline environments. Plant Soil 2003, 253, 171–185. [Google Scholar] [CrossRef]
  9. Zhu, G.Y.; Kinet, J.M.; Lutts, S. Characterization of rice (Oryza sativa L.) F3 populations selected for salt resistance. I. Physiological behavior during vegetative growth. Euphytica 2001, 121, 251–263. [Google Scholar] [CrossRef]
  10. Qadir, M.; Quillerou, E.; Nangia, V.; Murtaza, G.; Singh, M.; Thomas, R.J.; Drechsel, P.; Noble, A.D. Economics of salt-induced land degradation and restoration. Nat. Res. Forum 2014, 38, 282–295. [Google Scholar] [CrossRef]
  11. Wafa’a, A. Comparative effects of drought and salt stress on germination and seedling growth of Pennisetum divisum (Gmel.) Henr. Amer. J. Appl. Sci. 2010, 7, 640–646. [Google Scholar]
  12. Saeed, A.; Shahid, M.Q.; Anjum, S.A.; Khan, A.A.; Shakeel, A.; Saleem, M.F.; Saeed, N. Genetic analysis of NaCl tolerance in tomato. Genet. Mol. Res. 2011, 10, 1754–1776. [Google Scholar] [CrossRef]
  13. Zaki, H.E.; Yokoi, S. A comparative in vitro study of salt tolerance in cultivated tomato and related wild species. Plant Biotechnol. 2016, 33, 361–372. [Google Scholar] [CrossRef]
  14. Sultana, N.; Sultana, I.; Sultana, S. Effect of salinity on in vitro performance of tomato (Lycopersicon esculentum L.). Bangladesh J. 2019, 36, 43–46. [Google Scholar]
  15. Cano, E.A.; Pérez-Alfocea, F.; Moreno, V.; Bolarin, M.C. Responses to NaCl stress of cultivated and wild tomato species and their hybrids in callus cultures. Plant Cell Rep. 1996, 15, 791–794. [Google Scholar] [CrossRef]
  16. Tahir, M.; Zafar, M.M.; Imran, A.; Hafeez, M.A.; Rasheed, M.S.; Mustafa, H.S.B.; Ullah, A. Response of tomato genotypes against salinity stress at germination and seedling stage. Nat. Sci. 2018, 16, 10–17. [Google Scholar]
  17. Bogoutdinova, L.R.; Baranova, G.B.; Baranova, E.N.; Khaliluev, M.R. Comparative anatomical and morphological studies of the epidermal and cortical parenchyma hypocotyl cells of two tomato genotypes (Solanum lycopersicum L.) under sodium chloride stress in vitro. Sel’skokhozyaistvennaya Biol. 2016, 51, 318–326. [Google Scholar] [CrossRef]
  18. Murashige, T.; Skoog, F. A revised medium for rapid growth and bioassays with tobacco tissue culture. Physiol. Plant. 1962, 15, 473–497. [Google Scholar] [CrossRef]
  19. Khaliluev, M.R.; Bogoutdinova, L.R.; Raldugina, G.N.; Baranova, E.N. A simple and effective bioassay method suitable to comparative in vitro study of tomato salt tolerance at early development stages. Methods Protoc. 2022, 5, 11. [Google Scholar] [CrossRef]
  20. Baranova, E.N.; Gulevich, A.A.; Kalinina-Turner, E.B.; Koslov, N.N. Effects of NaCl, Na2SO4 and mannitol on utilization of storage protein and transformation of vacuoles in the cotyledons and seedling roots of alfalfa (Medicago sativa L.). Russ. Agric. Sci. 2011, 37, 11–19. [Google Scholar] [CrossRef]
  21. Reynolds, E.S. The use of lead citrate at high pH as an electron-opaque stain in electron microscopy. J. Cell Biol. 1963, 17, 208–212. [Google Scholar] [CrossRef] [PubMed] [Green Version]
  22. Bogoutdinova, L.R.; Baranova, E.N.; Baranova, G.B.; Kononenko, N.V.; Lazareva, E.M.; Smirnova, E.A.; Khaliluev, M.R. Morpho-biological and cytological characterization of tomato roots (Solanum lycopersicum L.; cv. Rekordsmen) regenerated under NaCl salinity in vitro. Cell Tissue Biol. 2020, 14, 228–242. [Google Scholar] [CrossRef]
  23. Sharma, S.; Dietz, K.; Mimura, T. Vacuolar compartmentalization as an indispensable component of heavy metal detoxification in plants. Plant Cell Environ. 2016, 39, 1112–1126. [Google Scholar] [CrossRef] [PubMed] [Green Version]
  24. Martinoia, E.; Maeshima, M.; Neuhaus, H.E. Vacuolar transporters and their essential role in plant metabolism. J. Exp. Bot. 2007, 83, 83–102. [Google Scholar] [CrossRef] [PubMed]
  25. Baranova, E.N.; Gulevich, A.A.; Polyakov, V.Y. Effects of NaCl, Na2SO4, and mannitol on storage lipid mobilization in the cotyledons and roots of purple alfalfa seedlings. Russ. J. Plant Physiol. 2006, 53, 779–784. [Google Scholar] [CrossRef]
  26. Baranova, E.N.; Gulevich, A.A.; Polyakov, V.Y. Effect of NaCl, Na2SO4, and mannitol on utilization of storage starch and formation of plastids in the cotyledons and roots of alfalfa seedlings. Russ. J. Plant Physiol. 2007, 54, 50–57. [Google Scholar] [CrossRef]
  27. Ratnakar, A.; Rai, A. Effect of sodium chloride salinity on seed germination and early seedling growth of Trigonella foenum-graecum L. Var. Peb. Octa J. Environ. Res. 2013, 1, 4. [Google Scholar]
  28. Whitmore, A.P.; Whalley, W.R. Physical effects of soil drying on roots and crop growth. J. Exp. Bot. 2009, 60, 2845–2857. [Google Scholar] [CrossRef] [Green Version]
  29. Javot, H.; Maurel, C. The role of aquaporins in root water uptake. Ann. Bot. 2002, 90, 301–313. [Google Scholar] [CrossRef] [Green Version]
  30. Flexas, J.; Diaz-Espejo, A.; Galmes, J.; Kaldenhoff, R.; Medrano, H.; Ribas-Carbo, M. Rapid variations of mesophyll conductance in response to changes in CO2 concentration around leaves. Plant Cell Environ. 2007, 30, 1284–1298. [Google Scholar] [CrossRef]
  31. Lawlor, D.W.; Cornic, G. Photosynthetic carbon assimilation and associated metabolism in relation to water deficits in higher plants. Plant Cell Environ. 2002, 25, 275–294. [Google Scholar] [CrossRef] [Green Version]
  32. Alsafari, S.A.; Galal, H.K.; Bafeel, S.O. Growth and anatomy of tomato (Solanum lycopersicum Mill.) cultivars Marmande and Oria under salinity stress. Pak. J. Bot. 2019, 51, 1199–1207. [Google Scholar] [CrossRef]
  33. De Veylder, L.; Larkin, J.C.; Schnittger, A. Molecular control and function of endoreplication in development and physiology. Trends Plant Sci. 2011, 16, 624–634. [Google Scholar] [CrossRef]
  34. Bourdon, M.; Pirrello, J.; Cheniclet, C.; Coriton, O.; Bourge, M.; Brown, S.; Frangne, N. Evidence for karyoplasmic homeostasis during endoreduplication and a ploidy-dependent increase in gene transcription during tomato fruit growth. Development 2012, 139, 3817–3826. [Google Scholar] [CrossRef] [Green Version]
  35. Katagiri, Y.; Hasegawa, J.; Fujikura, U.; Hoshino, R.; Matsunaga, S.; Tsukaya, H. The coordination of ploidy and cell size differs between cell layers in leaves. Development 2016, 143, 1120–1125. [Google Scholar] [CrossRef] [Green Version]
  36. Jiang, L.; Phillips, T.E.; Rogers, S.W.; Rogers, J.C. Biogenesis of the protein storage vacuole crystalloid. J. Cell Biol. 2000, 150, 755–770. [Google Scholar] [CrossRef]
  37. Muntz, K.; Belozersky, M.A.; Dunaevsky, Y.E.; Schlereth, A.; Tiedemann, J. Stored proteinases and the Initiation of storage protein mobilization in seeds during germination and seedling growth. J. Exp. Bot. 2001, 52, 1741–1752. [Google Scholar] [CrossRef] [Green Version]
  38. Di Sansebastiano, G.P.; Paris, N.; MarcMartin, S.; Neuhaus, J.M. Regeneration of a lytic central vacuole and of neutral peripheral vacuoles can be visualized by green fluorescent proteins targeted to either type of vacuoles. Plant Physiol. 2001, 126, 78–86. [Google Scholar] [CrossRef] [Green Version]
  39. Mimura, T.; Kura-Hotta, M.; Tsujimura, T.; Ohnishi, M.; Miura, M.; Okazaki, Y.; Mimura, M.; Maeshima, M.; Washitani-Nemoto, S. Rapid increase of vacuolar volume in response to salt stress. Planta 2003, 216, 397–402. [Google Scholar] [CrossRef]
  40. Hamaji, K.; Nagira, M.; Yoshida, K.; Ohnishi, M.; Oda, Y.; Uemura, T. Dynamic aspects of ion accumulation by vesicle traffic under salt stress in Arabidopsis. Plant Cell Physiol. 2009, 50, 2023–2033. [Google Scholar] [CrossRef] [Green Version]
  41. Dermendjiev, G.; Schnurer, M.; Weiszmann, J.; Wilfinger, S.; Ott, E.; Gebert, C. Tissue-Specific Proteome and Subcellular Microscopic Analyses Reveal the Effect of High Salt Concentration on Actin Cytoskeleton and Vacuolization in Aleurone Cells during Early Germination of Barley. Int. J. Mol. Sci. 2021, 22, 9642. [Google Scholar] [CrossRef] [PubMed]
  42. El-Banna, Y.; Attia, T. Root tip meristematic cell and leaf chloroplast structure in three barley (Hordeum vulgare L.) genotypes exposed to salinity stress. Cytologia 1999, 64, 69–76. [Google Scholar] [CrossRef] [Green Version]
  43. Ibrahim, W.; Qiu, C.; Zhang, C.; Cao, F.; Shuiji, Z.; Wu, F. Comparative physiological analysis in the tolerance to salinity and drought individual and combination in two cotton genotypes with contrasting salt tolerance. Physiol. Plant. 2019, 165, 155–168. [Google Scholar] [CrossRef] [PubMed]
  44. Parida, A.K.; Das, A.B. Salt tolerance and salinity effects on plants: A review. Ecotox. Environ. Saf. 2005, 60, 324–349. [Google Scholar] [CrossRef] [PubMed]
  45. Islam, F.; Yasmeen, T.; Ali, S.; Ali, B.; Farooq, M.A.; Gill, R.A. Priming-induced antioxidative responses in two wheat cultivars under saline stress. Acta Physiol. Plant. 2015, 37, 153. [Google Scholar] [CrossRef]
  46. Li, J.; Liu, L.; Bai, Y.; Zhang, P.; Finkers, R.; Du, Y.; Visser, R.G.F.; van Heusden, A.W. Seedling salt tolerance in tomato. Euphytica 2011, 178, 403–414. [Google Scholar] [CrossRef]
  47. Vriet, C.; Hennig, L.; Laloi, C. Stress-induced chromatin changes in plants: Of memories, metabolites and crop improvement. Cell Mol. Life Sci. 2015, 72, 1261–1273. [Google Scholar] [CrossRef]
  48. Lämke, J.; Bäurle, I. Epigenetic and chromatin-based mechanisms in environmental stress adaptation and stress memory in plants. Genome Biol. 2017, 18, 124. [Google Scholar] [CrossRef]
  49. Kim, J.H. Multifaceted chromatin structure and transcription changes in plant stress response. Int. J. Mol. Sci. 2021, 22, 2013. [Google Scholar] [CrossRef]
  50. Baranova, E.N.; Chaban, I.A.; Kononenko, N.V.; Khaliluev, M.R.; Christov, N.K.; Gulevich, A.A.; Todorovska, E.G. Ultrastructural organization of the domains in the cell nucleus of dicotyledonous and monocotyledonous plants under abiotic stress. Russ. Agric. Sci. 2017, 43, 199–206. [Google Scholar] [CrossRef]
  51. Jabeen, Z.; Hussain, N.; Han, Y.; Shah, M.J.; Zeng, F.; Zeng, J.; Zhang, G. The differences in physiological responses, ultrastructure changes, and Na+ subcellular distribution under salt stress among the barley genotypes differing in salt tolerance. Acta Physiol. Plant. 2014, 36, 2397. [Google Scholar] [CrossRef]
  52. Zeeshan, M.; Lu, M.; Sehar, S.; Holford, P.; Wu, F. Comparison of biochemical, anatomical, morphological, and physiological responses to salinity stress in wheat and barley genotypes deferring in salinity tolerance. Agronomy 2020, 10, 127. [Google Scholar] [CrossRef] [Green Version]
  53. Goswami, R.; Asnacios, A.; Milani, P.; Graindorge, S.; Houlné, G.; Mutterer, J. Mechanical shielding in plant nuclei. Curr. Biol. 2020, 30, 2013–2025. [Google Scholar] [CrossRef]
  54. Irianto, J.; Swift, J.; Martins, R.; McPhail, G.; Knight, M.; Discher, D.; Lee, D. Osmotic drives challenge rapid and reversible chromatin condensation in chondrocytes. Biophys. J. 2013, 104, 759–769. [Google Scholar] [CrossRef] [Green Version]
  55. Lovett, D.; Shekhar, N.; Nickerson, J.; Roux, K.; Lele, T. Modulation of nuclear shape by substrate rigidity. Cell Mol. Bioeng. 2013, 6, 230–238. [Google Scholar] [CrossRef] [Green Version]
  56. Finan, J.; Guilak, F. The effects of osmotic stress on the structure and function of the cell nucleus. J. Cell Biochem. 2010, 109, 460–467. [Google Scholar] [CrossRef]
  57. Čiamporová, M.; Mistrík, I. The ultrastructural response of root cells to stressful conditions. Environ. Exp. Bot. 1993, 33, 11–26. [Google Scholar] [CrossRef]
  58. Probst, A.V.; Scheid, O.M. Stress-induced structural changes in plant chromatin. Curr. Opin. Plant Biol. 2015, 27, 8–16. [Google Scholar] [CrossRef] [Green Version]
  59. Roy, S.; Soni, P. Unraveling the epigenetic landscape for salt tolerance in plants. Int. J. Plant Biol. 2022, 13, 443–462. [Google Scholar] [CrossRef]
  60. Onelli, E.; Scali, M.; Caccianiga, M.; Stroppa, N.; Morandini, P.; Pavesi, G.; Moscatelli, A. Microtubules play a role in trafficking prevacuolar compartments to vacuoles in tobacco pollen tubes. R. Soc. Open Biol. 2018, 8, 180078. [Google Scholar] [CrossRef] [Green Version]
  61. Bogoutdinova, L.R.; Lazareva, E.M.; Chaban, I.A.; Kononenko, N.V.; Dilovarova, T.A.; Khaliluev, M.R.; Kurenina, L.V.; Gulevich, A.A.; Smirnova, E.A.; Baranova, E.N. Salt stress-induced structural changes are mitigated in transgenic tomato plants over-expressing superoxide dismutase. Biology 2020, 9, 297. [Google Scholar] [CrossRef] [PubMed]
  62. Giordano, M.; Petropoulos, S.A.; Rouphael, Y. Response and defence mechanisms of vegetable crops against drought, heat and salinity stress. Agriculture 2021, 11, 463. [Google Scholar] [CrossRef]
  63. Baranova, E.N.; Christov, N.K.; Kurenina, L.V.; Khaliluev, M.R.; Todorovska, E.G.; Smirnova, E.A. Formation of atypical tubulin structures in plant cells as a nonspecific response to abiotic stress. Bulg. J. Agric. Sci. 2016, 22, 987–992. [Google Scholar]
  64. Chun, H.J.; Baek, D.; Jin, B.J.; Cho, H.M.; Park, M.S.; Lee, S.H.; Lim, L.H.; Cha, Y.J.; Bae, D.-W.; Kim, S.T.; et al. Microtubule dynamics plays a vital role in plant adaptation and tolerance to salt stress. Int. J. Mol. Sci. 2021, 22, 5957. [Google Scholar] [CrossRef]
  65. Yang, P.; Jin, J.; Zhang, J.; Wang, D.; Bai, X.; Xie, W.; Hu, T.; Zhao, X.; Mao, T.; Qin, T. MDP25 mediates the fine—Tuning of microtubule organization in response to salt stress. J. Integr. Plant Biol. 2022, 64, 1181–1195. [Google Scholar] [CrossRef]
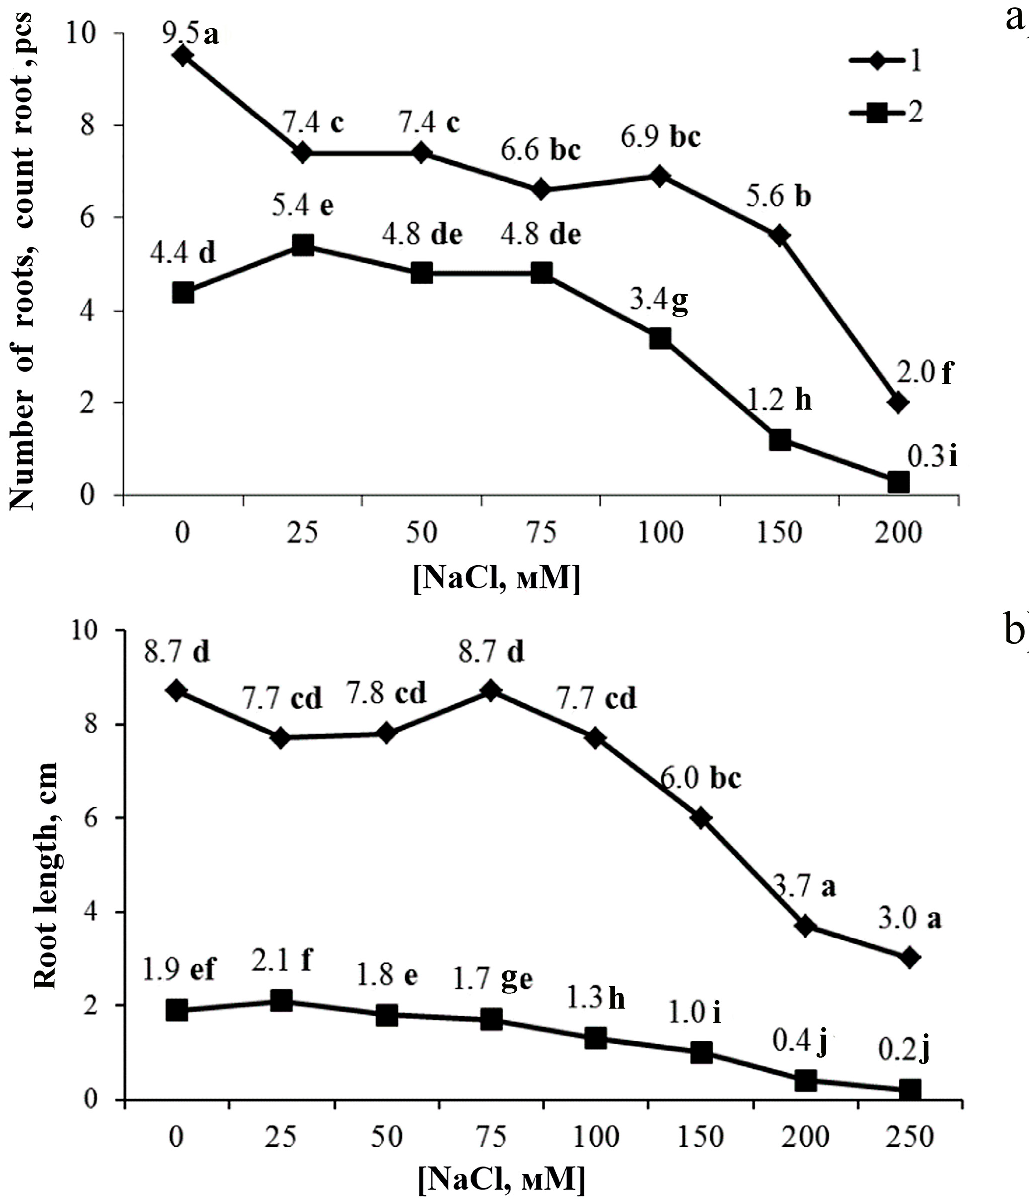
Figure 1. Effect of different concentrations of NaCl in the nutrient medium for rhizogenesis induction on the number of regenerated roots and their length in tomato seedlings of the YaLF line (a) and cv Recordsmen (b). Means followed by the same letter are not significantly different at α = 0.05 according to Duncan’s multiple range test.
Ijpb 14 00010 g001
Figure 2. Effect of different concentrations of NaCl in the nutrient medium for rhizogenesis induction on the fresh (a) and dry (b) weight of roots in tomato seedlings of the YaLF line and cv Recordsmen. Means followed by the same letter are not significantly different at α = 0.05 according to Duncan’s multiple range test.
Ijpb 14 00010 g002
Figure 3. Determination of the distribution of the tomato root meristem cells of the YaLF line (a) and cv Recordsmen (b) by cytophotometric analysis in the phases of the cell cycle under various concentrations of NaCl. The columns indicate the percentage of cells in a given phase of the cell cycle. Means followed by the same letter are not significantly different at α = 0.05 according to Duncan’s multiple range test.
Ijpb 14 00010 g003
Figure 4. Longitudinal sections of tomato root in the YaLF line ((a) 0 mM NaCl; (b) 75 mM NaCl; (c) 150 mM NaCl)) and cv Recordsmen ((d) 0 mM NaCl; (e) 75 mM NaCl; (f) 150 mM NaCl)) under various concentrations of sodium chloride. Abbreviations: C—columella cells; RC—root cortex cell; CC—central cylinder cells; N—nucleus; P—plastid; V—vacuole. The images were taken at 30× objective magnification.
Ijpb 14 00010 g004
Figure 5. The effect of different NaCl concentrations in the nutrient medium for the induction of rhizogenesis on the cell area of the YaLF tomato line (a) and cv Recordsmen (b) as shown by light microscopy. Abbreviations: RC—root cortex cell; CC—central cylinder cell. Means followed by the same letter are not significantly different at α = 0.05 according to Duncan’s multiple range test.
Ijpb 14 00010 g005
Figure 6. The effect of different NaCl concentrations in the nutrient medium for the induction of rhizogenesis on the Snucleolus/Snucleus of the YaLF tomato line (a) and cv Recordsmen (b), as shown by light microscopy. Abbreviations: RC—root cortex cell; CC—central cylinder cell. Means followed by the same letter are not significantly different at α = 0.05 according to Duncan’s multiple range test.
Ijpb 14 00010 g006
Figure 7. Photographs of nuclear ultrastructural organization in the cells of the primary root cortex of the YaLF line (a) control, (c) 150 mM NaCl) and cv Recordsmen (b) control, (d) 150 mM NaCl) obtained in vitro by TEM. Abbreviations: H—heterochromatin, FC—fibrillar center, E—euchromatin, N—nucleolus, NB—nuclear body, NM—nuclear membrane, *—electron-transparent region around the nucleolus.
Ijpb 14 00010 g007
Figure 8. α-tubulin immunocytochemical detection in interphase root cells of tomato seedlings using antibodies to tubulin under control conditions, as well as under the action of NaCl at various concentrations. (a,b) YaLF line under 0 mM NaCl; (c,d) YaLF line under 75 mM NaCl; (e,f) YaLF line under 150 mM NaCl; (g,h) cv Recordsmen under 0 mM NaCl; (i,j) cv Recordsmen under 75 mM NaCl; (k,l)—cv Recordsmen under 75 mM NaCl. * fragmentation of microtubules; ** disorganizations of the cortical microtubules; ^ thinning of microtubules. Scale is 5 µm.
Ijpb 14 00010 g008
Table 1. The length of the tomato epidermis and columella cells.
YaLFRecordsmen
Cell Length Relative to Control, %Cell Length Relative to Control, %
NaCl Concentration in the Medium (mM)ColumellaEpidermisColumellaEpidermis
0100100100100
7598.6195.87118.981.97
150130.55102.48155.1174.59
The length of these cells was determined relative to the control (%) in the YaLF line and cv Recordsmen under the influence of various concentrations of NaCl. The length was viewed at the mesostructure level.
Disclaimer/Publisher’s Note: The statements, opinions and data contained in all publications are solely those of the individual author(s) and contributor(s) and not of MDPI and/or the editor(s). MDPI and/or the editor(s) disclaim responsibility for any injury to people or property resulting from any ideas, methods, instructions or products referred to in the content.