Abstract
Soybean is a major crop in the world and an essential source for minerals, including iron (Fe) and zin (Zn). Deficiency of Fe and Zn in soil and soybean plants result in yield loss and poor seed nutritional qualities. Information on genomic regions and candidate genes controlling seed Fe and Zn accumulation in soybean seed is limited. Therefore, The objective of this research was to identify genetic regions, known as quantitative trait loci (QTL), and candidate genes that control the accumulation of Fe and Zn in soybean mature seeds. A ‘Forrest’ by ‘Williams 82’ (F × W82) recombinant inbred line (RIL) population (n = 306) was used and genotyped using a total of 5405 single nucleotides polymorphism (SNP) markers using Infinium SNP6K BeadChips. A two-year experiment was conducted across two environments: North Carolina in 2018 (NC) and Illinois in 2020 (IL). Only QTL with LOD scores ≥ 2.5, as identified by the composite interval mapping (CIM) method, are reported here. In total, 6 QTL were identified for seed Fe; specifically, 3 QTL (qFe-01-[NC-2018], qFe-02-[NC-2018], and qFe-03-[NC-2018]) were located on chromosomes 1, 2, and 6, respectively, in the NC environment, and 3 QTL (qFe-01-[IL-2020], qFe-02-[IL-2020], and qFe-03-[IL-2020]) were positioned on chromosomes 1, 2, and 12, respectively, in the IL environment. A total of 6 QTL associated with seed Zn were also identified; 4 QTL (qZn-01-[NC-2018]; qZn-02-[NC-2018]; qZn-03-[NC-2018]; and qZn-04-[NC-2018]), respectively on Chr 2, 3, 7, and 19 in NC; and 2 QTL (qZn-01-[IL-2020] and qZn-02-[IL-2020]), respectively, on Chr 5 and 8 in IL. Several functional genes encode Fe- and Zn-proteins, transcription factors, proteins-zinc finger motifs (involved in DNA binding and transcriptional regulation; crosstalk between the regulatory pathways of Zn and Fe transporters) were identified and located within the QTL interval. To our knowledge, and based on the literature available, the QTL identified here on Chr 2 and Chr 6 are novel and were not previously identified. This current research provides a new knowledge of the genetic basis of seed Fe and Zn and the markers associated with QTL. The QTL identified here will contribute to efficient marker assisted selection for higher Fe and Zn content in soybean seeds. The candidate genes and metal-responsive transcription factors may coordinate the expression of both Zn and Fe transporters in response to changes in metal availability, providing new knowledge on minerals uptake and transport mechanisms, allowing for possible genetic engineering application.
Keywords:
soybean; RIL; Forrest; Williams 82; linkage map; micronutrients genes; iron; zinc; nutrition; SNP 1. Introduction
Iron (Fe) and zinc (Zn) are essential micronutrients (trace elements) for humans, animals, and plants nutrition. Their deficiencies in soil and plants result in crop loss, poor seed quality, and detrimental nutritional value [1,2,3,4,5,6,7]. Soybean seed is a major source of minerals, including Fe and Zn, for human diet and livestock. Information on genomic regions (QTL) and candidate genes controlling seed Fe and Zn accumulation in soybean mature seed is limited. Therefore, the objective of the current research was to identify genetic regions (QTL) and candidate genes controlling Fe and Zn accumulation in soybean mature seeds. This step is essential for Fe and Zn genetic fortification.
Iron and Zn are involved in several metabolic pathways, and physiological and genetic processes [8]. For example, they are involved in phenolics accumulation [5] and Strategy I in Fe acquisition for dicots. They are also involved in ROS (reactive oxygen species), SOD (superoxide dismutases), and Fe deficiency and chlorosis [9,10,11]. Similar to Fe, Zn is also involved in several metabolic pathways. For example, Zn plays an essential role in enzymes [12] and plant tolerance to environmental stress factors [13]. Further, Zn (as metal protein) is required for RNA polymerase [14], DNA and RNA replication, transcription, expression, and structure [15,16]. Furthermore, Zn is even needed as proteins-containing Zn (metal-proteins) genes in human genome [16,17,18,19].
Identifying genomic regions or candidates genes controlling Fe and Zn content in soybean mature seed is still limited [8]. Previous literature related to Fe or Zn QTL and genes in soybean were conducted on shoot (roots, stems or combined), leaves, or on unmature seeds, or studying seeds under specific treatments such Fe application. For example, studying iron deficiency chlorosis (IDC) indicated that IDC is a complex trait. This trait is controlled by either a major gene with modifying genes, or by a polygenic mechanism with each gene having a minor effect [20]. For example, Lin et al. [20] evaluated two populations, Pride B216 × A15 and Anoka × A7, and identified four QTL on Chr 20, 3, and 5. These QTL were responsible for 21.6% of the phenotypic variation in the Pride B216 × A15 population. In the Anoka × A7 population, two major QTLs responsible for 75.3% of the variation with a major QTL on Chr 3 were also identified [20]. Using SSR, RFLP, and BARCSOYSSR markers on 92 F2:4 lines and QTL analysis, a two-year experiment was conducted in 2008 and 2009 [9]. In 2008, King et al. [9] were able to identify QTL on Chr 12 with marker interval of Sutt635pa-132H and position of 7 cM. This QTL had a LOD of 3, and explained 25.7% of the phenotypic variation of seed Fe content. Also, they were able to detect another QTL on Chr 7 with a marker interval of pk-417H-pk-70T and a position of 69.9 cM. This QTL had LOD of 2.5, and explained 20.1% of the phenotypic variance of the trait. In 2009, they were able to identify QTL on Chr 1 with a marker interval of Satt295-Satt383 and position 49.9 cM. This QTL had LOD of 4.3, and explained 21.2% of the Fe content. The other QTL was identified on Chr 17 with marker intervals of Satt528-Satt488 with a position of 193.4 cM and LOD of 3.0. This QTL explained 14.3% of the phenotypic variance of the trait. For Zn content, two suggestive QTL were identified on Chr 12 and Chr 19 in 2008, and one suggestive QTL was detected on Chr 7 in 2009 [9]. The QTL on Chr 12 positioned between Sat-334-S12-0711 markers and at the position of 105.6 cM with LOD of 3.7. This QTL explained 21.2% of the phenotypic differences for Zn content. The other identified QTL was on Chr 19, and positioned between the markers Satt-Satt143 and at a position of 42.8 cM with LOD 3.0. This QTL explained 16.7% of Zn content difference. In 2009, they were able to identify one QTL on Chr 7, with a marker intervals Satt175-pk-pk174H with a position of 52.2 cM and LOD of 2.8. The QTL explained 19% of the phenotypic variation of Zn content. Using QTL analysis for the combined data, King et al. [9] found one major QTL for seed Fe accumulation with LOD score of 4.3 on Chr 20 and explained 21.5% of the variation. This QTL was in the marker interval pa515-1-Satt239. They concluded that there was a potential genetic association between Fe-effificiency and Fe accumulation soybean seeds [21].
Ramamurthy et al. [22] used three F5-derived RIL mapping populations, derived from crosses of Williams 82 (Williams 82 × DSR-173; Williams 82 × NKS19-90; and Williams 82 × Vinton 81), and were able, using individual mapping populations analysis, to identify two QTL linked to seed Fe content and three QTL associated with seed Zn content. They found one Fe QTL on Chr 3 with a peak at 53.9 cM and LOD of 3.36. This QTL explained 13% of the phenotypic trait variation of Fe content, and with additive effect of 3.25. The second QTL was on Chr 20 with a peak of 12 cM and LOD of 3.79. This QTL explained 22% of the phenotypic variation of Fe content, and additive effects of 4.17. For Zn, the first QTL was on Chr 3 with a peak at 47.5 cM and LOD of 4.35. A percentage of 6% was responsible for phenotypic variation of Zn content and an additive effect of −1.1. The second QTL was on Chr 3 with a peak of 57.7 cM and LOD of 4, and 14% of phenotypic variation for Zn content and an additive effect of −1.1. The third QTL was on Chr 9 with a peak of 16.7 cM and LOD of 3.12, and 13% was responsible for the phenotypic variation of Zn content with an additive effect of −1.35.
Recently, Wang et al. [8] were able to identify 5 QTL for seed Fe content on Chr 4 and Chr 5; 2 QTL on Chr 7 and Chr 13, with LOD ranging from 3.8 to 23.6 cM. In one environment, two QTL were identified. One on Chr 5 with a peak position of 96.7 cM, and R2 ranged from 4.9% to 23.76%. The second QTL was identified on Ch 7 with a peak position of 79.4 cM with R2 of 23%. In the second environment, 3 QTL were detected; one QTL on Chr 4 at a position of 28.5 cM and R2 of 8.46%; second QTL on Chr 7 with a position at 90 cM, and R2 of 29.86%. A third QTL was identified on Chr 13 with a position of 85.7 cM, and R2 of 29.86%. They also mapped 5 QTL related to seed Zn content with LOD ranging from 3.64 to 20.4, and R2 ranged from 3.35 to 26.48%. In one environment, 2 QTL were identified on Chr 3. One QTL with a position of 128.5 cM and R2 of 12.79%. The other QTL had a position of 124.4 cM and R2 of 8.94%. In addition, they detected one QTL on Chr 11 with position of 89.6 cM and R2 of 6.28%; one QTL on Chr 18 at 124.4 cM and R2 of 5.04%; and two QTL on Chr 20 (one QTL with a position of 55 cM and R2 of 9.57%, and the other QTL with a position of 56.3 cM and R2 of 26.48%). In the other environment, two QTL were detected on Chr 20; one QTL with a position of 53.4 cM and R2 of 6.98%, and the other QTL was at 55 cM with R2 of 21.43%. They also reported, using genome sequencing, a total of 12 candidate genes were found in one major QTL for seed Fe content and two major QTLs for seed Zn content.
Based on the above literature, it is clear that information on genomic regions (QTL) and candidate genes controlling seed Fe and Zn accumulation in mature soybean seeds is still limited. The lack of this limited information could be due to the genetic diversity among parents, population size, type of markers used, and the number of markers tested, and the size of genome covered [8,20,23,24,25,26]. Therefore, the objective of the current research was to further identify QTL and molecular markers related to seed Fe and Zn accumulation in soybean mature seeds using a soybean high density ‘Forrest’ by ‘Williams 82’ (F × W82) recombinant inbred line (RIL) population (n = 306). Also, their candidates genes for Fe and Zn in soybean mature seed were also explored.
2. Materials and Methods
2.1. Plant Material and Growth Conditions
In this study, we used ‘Forrest’ × ‘Williams 82’ RIL population for mapping. The cultivar ‘Forrest’ was derived from the cross of ‘Dyer’ and ‘Bragg’, developed by USDA [27]. The cultivar ‘Williams 82’ was derived from a cross of ‘Williams’ and ‘Kingwa’ [28]. The genomes of soybean cultivars including Forrest and Williams 82 genomes are duplicated polyploid genomes with highly conserved gene-rich regions [29]. Originally, the ‘Forrest’ × ‘Williams 82’ RIL population was developed with more than 1000 RILs [30]. The genetic map used in this study was based on 306 RILs and 2075 SNP markers, and was previously developed [31]. Briefly, a total of 5405 SNP markers were generated from the Infinium SNP6K BeadChips. However, 2075 polymorphic SNPs were mapped on the 20 soybean chromosomes [31]. The genetic map covered 4029.9 cM with an average marker density of 1.94 cM, average maximum gap of 43.2 cM, and genetic length ranged from 153.7 cM for Chr 18 to 308.3 cM for Chr 2 [31].
Two experiments were conducted. The first experiment was conducted on a farm in Spring Lake, NC (35.17° N, 78.97° W) in 2018. The QTL analysis in this experiment was based only on 187 RILs due to hurricane Florence damage in September 2018 (wind speed was more than 90 mph) and deer damage. The second experiment was conducted on a farm in Carbondale, IL (37° N, 89° W) in 2020, and involved 306 RILs. Seeds of parents and RILs were planted on a 75 cm row-spacing. Drip irrigation was used as needed until seed maturity. No additional fertilizer was applied. Temperature in Spring Lake, NC (2018), during the growing season (May–Sept.), ranged from 7.2 to 35 °C, partly (40%) to mostly cloudy (80%), wind speeds ranged from 55 to more than 90 mph [31], and soil was mainly sandy (NC Sandhills). In Carbondale, IL (2020), the temperatures ranged from 7.2 to 29.4 °C, mostly clear (25%) to mostly cloudy (80%), wind speeds ranged from 30 to 38 mph. In this location, Firestorm (contains Paraquat dichloride) (Gramoxone® SL 2.0, Syngenta, Greensboro, NC, USA) was used to control annual grass and broad-leaved weeds. Dual II Magnum herbicide (Syngenta, Greensboro, NC, USA) was applied as pre-emergent herbicide to control most annual grasses and small-seeded broadleaf early-season. For the post-emergent herbicide, Round Up Pro Concentrate (50.2% Glyphosate) (Monsanto Co., St. Louis, MI, USA) was sprayed. The soil in this location was mainly silty clay loam (Southern IL). Details of growth conditions and field management was reported elsewhere [31]. No toxicity or deficiency symptoms of Fe or Zn were observed on soybean during its growth or maturity. Initially, our breeding research goal was to map QTL for soybean seed protein, oil, isoflavone, and amino acids. It has been shown that the parents (Williams 82 and Forrest) were contrasting in seed protein, oil, isoflavones, and some amino acids [31]. Mineral analysis of the current RILs showed a wide range of Zn and Fe concentrations and other nutrients among the RILs and the RILs/progeny showed higher concentrations of Fe and Zn than the two parents. We call this Transgressive Segregation where the progeny shows more genetic variation and variation in gene expression than their parents. This observation provided us with the opportunity to have identified significant QTL associated with both Zn and Fe. Also, Fe and Zn content trait in soybean is a complex polygenic trait, and previous studies, including this study, mapped QTL for different seed nutrients using various mapping biparental populations where parents may not necessarily have contrasting amounts of nutrient content. Therefore, these parents were used for QTL mapping for seed Fe and Zn.
2.2. Analysis for Seed Fe and Zn
The concentrations of seed Fe and Zn were measured in mature seeds at R8 stage by digesting 0.6 g of dried, ground seed in HNO3 for 30 to 45 min. Seed samples were ground to pass through 1-mm sieve using a Laboratory Mill 3600 (Perten, Springfield, IL, USA). The concentration of Fe and Zn were determined using inductively coupled plasma spectrometry (ICP) as described in detail by Bellaloui et al. [32,33,34].
2.3. DNA Isolation, SNP Genotyping, and Genetic Map Construction
Genomic DNA of the RIL population and the parents were extracted as described in detail by others elsewhere [31]. Briefly, DNA was extracted by a standard cetyltrimethyl ammonium bromide (CTAB) method with minor modifications [35]. The concentration of DNA was quantified by a spectrophotometer (NanoDrop Technologies Inc., Centreville, DE, USA) and using 50 ng/µL for genotyping. As detailed above, the genetic map used in this study was based on 306 RILs and 2075 SNP markers. The genetic map was previously developed and constructed and detailed elsewhere [31]. A total of 5405 SNP markers were generated from the Infinium SNP6K BeadChips, and only 2075 polymorphic SNPs were mapped on the 20 soybean chromosomes [31]. Briefly, genotyping using SNPs was conducted in the Soybean Genomics and Improvement Laboratory, USDA-ARS, Beltsville, MD, USA, using the Illumina Infinium SoySNP6K BeadChips (Illumina, Inc., San Diego, CA, USA) [36]. Then, SNP alleles were called using GenomeStudio Genotyping Module 2.0 (Illumina, Inc., San Diego, CA, USA). To construct the genetic linkage map, JoinMap 4.0 [37] was used. A LOD score threshold of ≥2.5 and a maximum genetic distance of 50 cM to group markers were used [21,31]. The linkage groups were assigned to corresponding soybean chromosomes as described in Soy-Base [38,39].
2.4. Fe and Zn QTL Detection and Their Candidate Genes
QTL detection and statistical analysis were conducted as described in detail elsewhere [31]. Briefly, the broad sense heritability analysis from two-way ANOVA was conducted using the following equation: H2 = σG2/[σG2 + (σGE2/e) + (σe2/re)] where σG2 (variance of genetic factor), σGE2 (variance of genotype-environment interactions), and σe2 (variance of random effect) were calculated with e (number of environment) and r normalization [40]. The significance level of the assessed traits was shown using R package car (type II Wald chi-square tests) (R Software, version R 4.2.0, accessed on 15 June 2023) [41]. Composite interval mapping (CIM) methods of Win-QTL Cartographer 2.5 (Windows QTL Cartographer 2.5. Department of Statistics, North Carolina State University, Raleigh, NC; http://statgen.ncsu.edu/qtlcart/WQTLCart.htm, accessed on 21 May 2024) [42] was used to identify QTL for seed Fe and Zn concentrations in RIL population. The default parameters of WinQTL Cartographer were chosen (Model 6, 1 cM step size, 10 cM window size, 5 control markers, and 1000 permutations threshold) [42]. Chromosomes were drawn using MapChart 2.2 [43]. Our QTL designation in the two years followed the approach used by others [31]. Fe and Zn candidate genes were annotated from the Wm82 Genome Browser of Soybase using SoyBase Genome browser [31,44].
2.5. Statistical Analysis
R statistical package (R Software) [41] was used in the statistical analysis including ANOVA and broad sense heritability (H2) using its native packages. In this study, we only had three technical replicates due to cost effect of this student-centered project, but these replicates/repetition could only be considered as one biological replicate and hence, F value and probability could not be generated if both line and year were included in the model. Therefore, to see the effect of Year or Line, they were run separately in the model. Analysis of Means (maximum and minimum values, and SE) were conducted using Proc Means in SAS (SAS, Statistical Analysis Systems, Cary, NC, USA, 2002–2012) [45]. Mean comparisons were conducted by Fisher’s Protected LSD test and the level of significance was p ≤ 0.05 using SAS [7]. Correlations were conducted by SAS using PROC REG.
3. Results
3.1. ANOVA and Statistical Analysis
In 2018, Fe concentrations in RILs ranged from 43.76 mg/kg to 122.99 mg/kg with a mean value of 69.49 mg/kg (Table 1). Zinc concentrations in RILs ranged from 29.71 mg/kg to 52.85 mg/kg with a mean value of 40.67 mg/kg. In 2020, Fe concentrations in RILs ranged from 31.40 mg/kg to 86.60 mg/kg, with a mean value of 60.74 mg/kg. Zinc concentrations for RILs ranged from 32.50 mg/kg to 63.60 mg/kg, with a mean value of 44.44 mg/kg (Table 1). The distribution of nutrients showed normal and bimodal distributions, reflecting physiological and genetic complexity of these relationships in these lines (Figure 1, Figure 2, Figure 3 and Figure 4). The interaction of physiological and genetic factors with the environmental factors resulted in some genotypes accumulating more nutrients than others (Figure 1, Figure 2, Figure 3 and Figure 4). ANOVA indicated that the year had significant effects (F value = 23.57; P = 0.0002). Line, and the interaction between year and line were not significant (F = 0.45, P = 0.99; and F = 55 and P = 0.997, respectively). This suggested that the ranking of each line in each year had not been changed, although the Fe and Zn concentrations in each year was different (Table 1). Of course, there were significant differences between lines in each given year for Fe and Zn concentration, and this was evident in the range of the concentration (Table 1). The broad sense heritability over two years showed differences for Fe and Zn concentrations. Iron had lower heritability (12.5%) than Zn (30.4%), indicating that some of portion of the phenotypic variation was not detected due to the complexity of both traits, especially Fe. This is one of the challenges for these traits as they are controlled by multiple genes and their interactions with the environment/location occur. Of course, these interactions impact the physiological and metabolic pathways of these nutrients in terms of uptake, transport, enzymes involved, and the resulting accumulation of Fe and Zn in seeds. Sum square (SS) and mean square (MS) showed that the variance of Fe and Zn were high, although the SS and MS for Zn is lower than Fe (Table 2). The low heritability of Fe means that the environment effect was large, the trait is complex, and further experiment across location and years with more replications are needed to achieve higher heritability, significant QTL, and higher LOD for Fe.

Table 1.
Statistical components of soybean seed Fe (mg/kg) and Zn (mg/kg) in ‘Forrest’ by ‘Williams 82’ recombinant inbred soybean lines (RILs) population in 2018 NC and 2020 in IL.
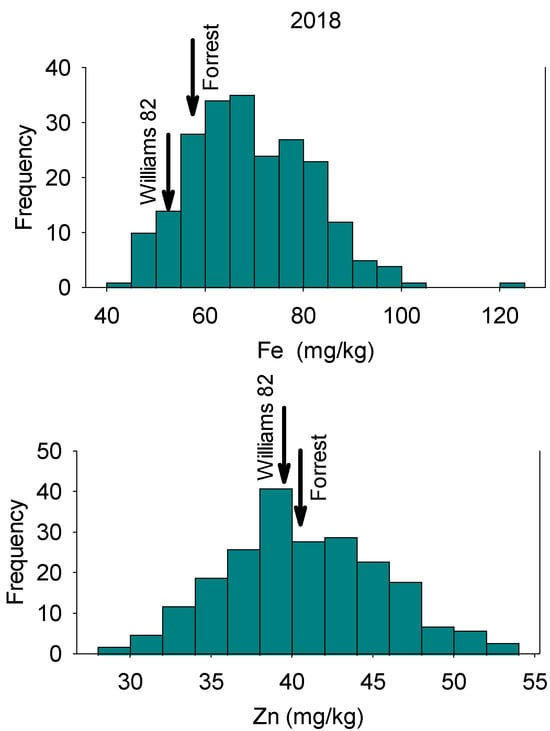
Figure 1.
Frequency distribution for seed Fe concentration (top graph) and seed Zn concentration (bottom graph) in 2018 in the Forrest’ by ‘Williams 82’ recombinant inbred soybean lines (RILs) population in soybean. Gaps that exist in any distribution graph indicate there is zero line in that range.
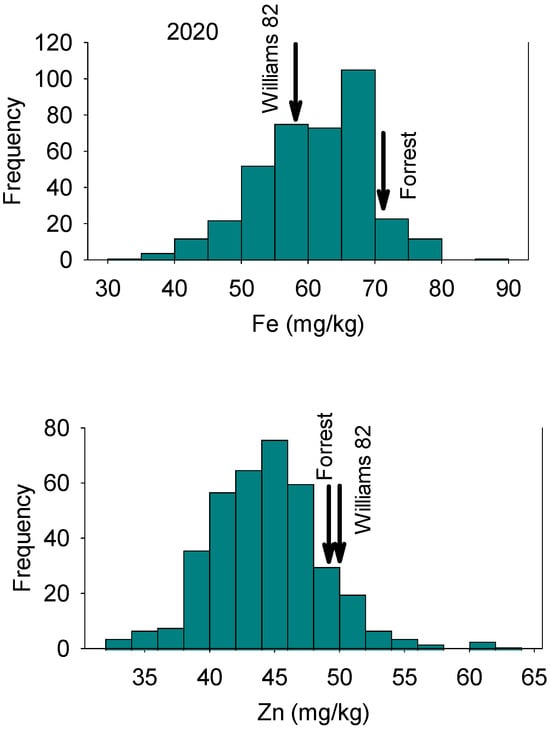
Figure 2.
Frequency distribution for seed Zn concentration (top graph) and Zn concentration (bottom graph) in 2020 in the Forrest’ by ‘Williams 82’ recombinant inbred soybean lines (RILs) population in soybean in 2020. Gaps that exist in any distribution graph indicate there is zero line in that range.
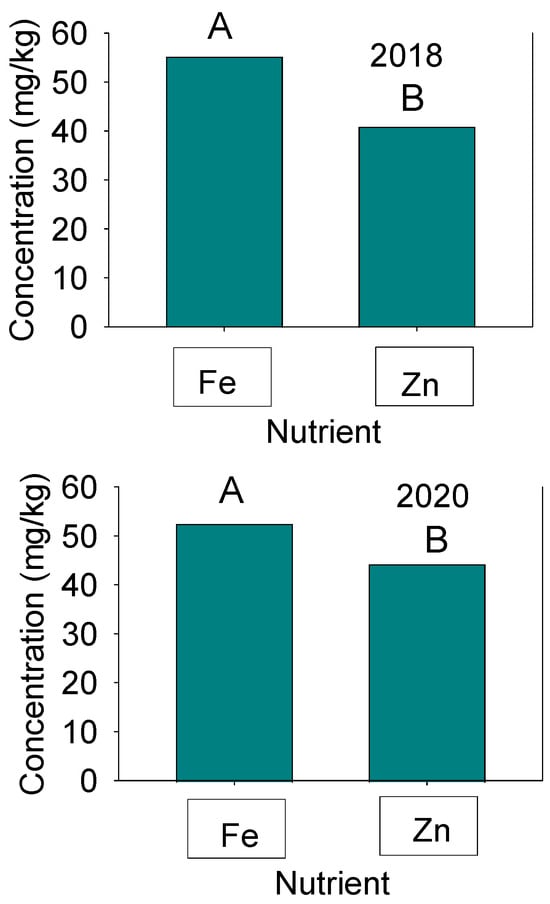
Figure 3.
Concentrations of seed Fe and Zn in 2018 (Top graph) and 2020 (bottom graph) in the Forrest’ by ‘Williams 82’ recombinant inbred soybean lines (RILs) population in soybean. Mean (A and B) comparisons were conducted by Fisher’s Protected LSD test and the level of significance was p ≤ 0.05 using SAS.
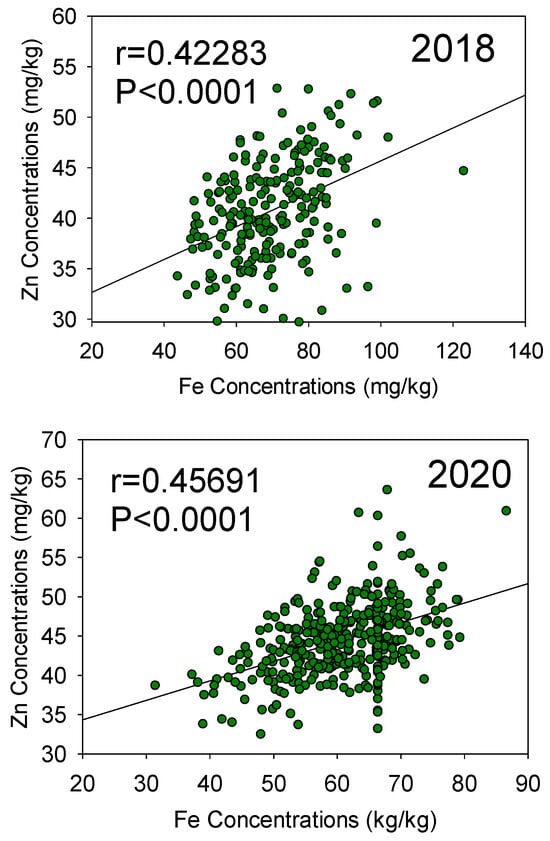
Figure 4.
Patterns of correlation between seed Fe and seed Zn concentrations in 2018 (top graph) and 2020 (bottom graph) in the Forrest’ by ‘Williams 82’ recombinant inbred soybean lines (RILs) population in soybean.
Table 2.
Statistical components (Sum Square and Mean Square) and broad-sense heritability (H2) of soybean seed Fe and Zn in ‘Forrest’ by ‘Williams 82’ recombinant inbred soybean lines (RILs) population across two years (2018 and 2020).
3.2. Fe and Zn QTL
A total of 6 QTL were identified for seed Fe. Three (qFe-01-[NC-2018]; qFe-02-[NC-2018]; and qFe-03-[NC-2018] on Chr 1, 2, and 6, respectively, in NC (2018) (Table 3; Figures S1, S2 and S5), and three QTL (qFe-01-[IL-2020]; qFe-02-[IL-2020]; and qFe-03-[IL-2020], respectively, on Chr 1, 2, and 12, in IL (2020) (Table 3; Figures S1, S2 and S8). A total of 6 QTL associated with seed Zn were identified. Four QTL (qZn-01-[NC-2018]; qZn-02-[NC-2018]; qZn-03-[NC-2018]; and qZn-04-[NC-2018], respectively on Chr 2, 3, 7, and 19 in NC (Table 3; Figures S2, S3, S6 and S9); and 2 QTL (qZn-01-[IL-2020] and qZn-02-[IL-2020], respectively, on Chr 5 and 8 in IL (Table 3; Figures S4 and S7). In 2018, QTL qFe-01-[NC-2018], on Chr 1 (Table 3; and Figure S1) was at the marker Gm01_4968769-Gm01_4932276 and position interval of 85.1–88.9cM, with LOD of 2.76 and R2 of 4.69. Similar for QTL qFe-02-[NC-2018] on Chr 2 at marker Gm02_9925870, position intervals of 140.1–142.2 cM, with LOD 2.53 and R2 6.63. For qFe-03-[NC-2018], on Chr 6, the QTL was positioned at Gm06_1584748-Gm06_3361566, with position intervals range of 177.1–198.9 cM, LOD of 7.05 and R2 of 12.75. In 2020, 3 QTL (qFe-01-[IL-2020]; qFe-02-[IL-2020]; and qFe-03-[IL-2020]), were detected on Chr 1, 2, and 12 (Figures S1, S2, and S8); QTL qFe-01-[IL-202] was at the marker 1 Gm01_5324236-Gm01_5264250 and position interval range of 61.2–61.6 cM, with LOD of 2.98 and R2 of 3.31. The QTL on Chr 2 (qFe-02-[IL-2020]) at the marker Gm02_5102501-Gm02_1481798, positioned at intervals range of 133.4–133.5 cM, with LOD of 5.27 and R2 of 5.97. The third QTL (qFe-03-[IL-2020]) on Chr 12 was detected at the marker Gm12_553862-Gm12_1632399 with position intervals ranged between 177.3–187.3 cM, and LOD of 6.44 and R2 of 7.38.
Table 3.
QTL for seed iron (Fe) and zinc (Zn) concentrations in two environments over two years [(Spring Lake, NC (2018); and Carbondale, IL (2020)]. Only QTL with LOD scores ≥ 2.5 and identified by composite interval mapping (CIM) method of QTL Cartographer (Wang et al., 2012 [42]) are reported. Chr = chromosome; Pos. = The peak position of the significant QTL; LOD = Logarithm of the odds; R2 =Percentage of variation explained by each identified QTL; Add. Eff. = Additive effect; a negative value indicates that the Forrest allele increased the trait value.
For Zn QTL, the first QTL (qZn-01-[NC-2018]) on Chr 2 was positioned at the marker Gm02_1037321-Gm02_1020061, with position intervals ranged between 138.4–139.8 cM, with LOD of 3.5 and R2 of 6.87. The second QTL (qZn-02-[NC-2018]) on Chr 3 was positioned at the marker Gm03_4198497-Gm03_4479032 with an interval position of 153.1–164.1 cM with LOD of 3.52 and R2 of 7.18. QTL qZn-03-[NC-2018] on Chr 7 positioned at the marker Gm07_2121760-Gm07_1092699, and interval position of 104.4–114.9 cM, with LOD of 4.45 and R2 of 8.79. The fourth QTL (qZn-04-[NC-2018]) for seed Zn is on Chr 19 and is positioned at the marker Gm19_5032228 at the marker Gm19_5032228 and interval marker position of 186.5–188.9 cM. The LOD value was 2.50 with a percentage of 4.73%. explaining the phenotypic variance the trait. In 2020, only two QTL (qZn-01-[IL-2020] and qZn-02-[IL-2020]), were identified on Chr 5 and 8, respectively (Table 3; Figures S4 and S7). QTL qZn-01-[IL-2020] was detected at the marker position Gm05_3674925-Gm05_3361872 and QTL qZn-02-[IL-2020] was positioned at the marker Gm08_1247584-Gm08_1572868. QTL qZn-01-[IL-2020] had interval position of 29.4–29.8 cM with LOD of 2.51 and R2 of 3.31. However, QTL qZn-02-[IL-2020] had an interval position of 98.41–100.4 cM with LOD of 2.54, with R2 of 3.91. A significant positive correlation between seed iron (Fe) and seed zinc (Zn) concentrations was observed in both 2018 (R = 0.42283, P < 0.0001) and 2020 (R = 0.45691, P < 0.0001), with a stronger correlation noted in 2020 (Figure 4).
3.3. Fe and Zn Candidate Genes
Twelve gene candidates have been identified (Table 4). These are: GlymaLee.01G024000.1/GlymaLee.01G049700.1; GlymaLee.02G078100.1; Glyma.06G021000; GlymaLee.01G024000.1/GlymaLee.01G049700.1; Glyma.02g124700; GlymaLee.12G121900.1; Glyma.02G013000; Glyma.03G033750; GlymaLee.10G030400.1; Glyma.19G037800; GlymaLee.05G051100.1; Glyma.08G016500. Their function ranges from metabolic, regulation, and structure to cofactors and transporters. Detailed functions of these candidate genes are presented in Table 5.
Table 4.
QTL and candidate genes for seed Fe and Zn accumulation in the ‘Forrest’ by ‘Williams 82’ recombinant inbred soybean lines (RILs) population (RILs) population in soybean two environments over two years [(Spring Lake, NC (2018); and Carbondale, IL (2020)]. Only QTL with LOD scores ≥ 2.5 and identified by composite interval mapping (CIM) method of QTL Cartographer (Wang et al., 2012 [42]), are reported. Candidate genes, controlling Fe and Zn accumulation associated with previously reported QTLs using SoyBase Genome Browser, are presented.
Table 5.
Candidate genes and their functional annotation for seed Fe and Zn accumulation in the ‘Forrest’ by ‘Williams 82’ recombinant inbred soybean lines (RILs) population in soybean two environments over two years [(Spring Lake, NC (2018); and Carbondale, IL (2020)]. Only QTL with LOD scores ≥ 2.5 and identified by composite interval mapping (CIM) method of QTL Cartographer (Wang et al., 2012 [42]) are reported. Candidate genes, controlling Fe and Zn accumulation associated with previously reported QTLs using SoyBase Genome Browser, are presented.
4. Discussion
Knowledge of genomic regions and genes candidates controlling soybean concentrations/accumulation in mature seeds is still very limited. The current study is an attempt to further understand the genetic basis of seed Fe and Zn concentrations by identifying QTL and candidates genes related to seed Fe and Zn accumulation.
ANOVA showed that both year and line significantly affected the Fe and Zn concentrations in seed. The year effect was probably due to the temperature in each year, as temperature affects the uptake, mobilization, and accumulation of these nutrients in the seed [3,5,7]. The significant line effect was due to the genotypic effect of parents on these lines and the wide range of Fe and Zn concentration in each line as a result. The no effect of year by line interaction indicated that although the magnitude of the concentrations in seeds changed significantly, but the ranking of each line in each year did not change. The distribution of nutrients showed normal and bimodal distributions, indicating the physiological and genetic complexity and interactions of the trait. The interaction of physiological and genetic factors with the environmental factors resulted in some genotypes accumulating more nutrients than others [5,7].
In the current study, we were able to identify a total of 6 QTL for seed Fe. Two QTL for Fe were detected on the same chromosome, but positioned in different loci and different interval marker positions. QTL qFe-01-[NC-2018] on Chr 1 positioned at marker Gm01_ 4968769-Gm01_ 4932276, with interval position of 85.1–88.9 cM in 2018. However, QTL qFe-01-[IL-2020] on Chr 1 positioned at marker Gm01 _5324236-Gm01_ 5264250 with interval position of 61.2–61.6 cM. This indicated that the two QTL could be responsible for seed Fe concentrations, but they interacted with the environmental factors in each location. However, QTL on Chr 6 were detected only for one year, indicating the environmental differences effects on QTL. Similar observation was observed for QTL related to seed Zn concentrations where a total of 6 QTL associated with seed Zn were identified. These QTL showed their existence only in one year, but did not in the other. For example, four QTL (qZn-01-[NC-2018]; qZn-02-[NC-2018]; qZn-03-[NC-2018]; and qZn-04-[NC-2018], respectively on Chr 2, 3, 7, and 19 in 2018 in NC; and 2 QTL (qZn-01-[IL-2020] and qZn-02-[IL-2020], respectively, on Chr 5 and 8 in 2020 in IL. The effect of environmental factors on QTL were previously reported. For instance, it has been reported that both environmental factors and genotype × environment interactions can influence the phenotype of the trait across different environments and years. Wang et al. [8] also reported that QTL × environment interaction can influence the effect and stability of QTLs. Interactions of QTL with locations and years pose a major challenge to QTL mapping and marker assisted selection, and this may be related to the genetic diversity among parents, population size, the number of markers tested. This observation was noticed in different species, including soybean [8,20,23,24,25,26]. Based on the literature, limited QTL were identified for seed Fe and seed Zn concentrations or accumulation, and most of Fe QTL detected were related to iron deficiency chlorosis based on leaf or shoot Fe deficiency symptoms, and not to seed Fe concentration at seed maturity stage. For example, Lin et al. [20] evaluated two populations, Pride B216 × A15 and Anoka × A7, to identify QTL related to Fe deficiency, and were able to detect four QTL on Chr 20, 3, and 5. They were able to identify two major QTLs responsible for 75.3% of the variation with a major QTL on Chr 3 in the Anoka × A7 population. Ramamurthy et al. [22], using three F5-derived RIL mapping populations, were able to identify two QTL linked to seed Fe content and three QTL linked with seed Zn content. One Fe QTL on Chr 3 with a peak of 53.9 cM and the second QTL was on Chr 20 with a peak at 12 cM. For Zn, the first QTL was on Chr 3 with a peak at 47.5 cM and the second QTL was on Chr 3 with a peak at 57.7 cM, and the third QTL on Chr 9 with a peak at 16.7 cM. Another two QTLs for seed Fe and Zn content were identified by Ning et al. [46]; one Fe QTL on Chr 3 and Zn QTL on Chr 4 in one year; and Fe QTL on Chr 3 and Zn QTL on Chr 11 in another year. King et al. [9] conducted a two-year experiment, in 2008 and 2009, using SSR, RFLP, and BARCSOYSSR markers on 92 F2:4 lines and seed Fe QTL analysis. In 2008, they were able to map one QTL on Chr 12 with marker intervals of Sutt635pa-132H, position of 7 cM, and another QTL on Chr 7 with a marker interval of pk-417H-pk-70T with a position of 69.9 cM. In 2009, they were able to detect one QTL on Chr 1 with marker interval Satt295-Satt383 and position 49.9 cM; another QTL on Chr 17 with marker intervals of Satt528-Satt488 with position of 193.4cM; and a third QTL. In addition, they detected two QTL in 2008 for seed Zn; one on Chr 12 positioned between Sat-334-S12-0711 markers, at the position of 105.6 cM; another QTL on Chr 19 positioned between the markers Satt-Satt143, position at 42.8 cM [9]. In 2009, they identified one QTL on Chr 7, with a marker intervals Satt175-pk-pk174H, at position of 52.2 cM [9].
Recently, others [8] were able to identify 5 QTL for seed Fe content on Chr 4, 5; 2 QTL on Chr 7 and 13. In one environment, Wang et al. [8] identified 1 QTL on Chr 5 with a peak position of 96.7 cM, and the other on Ch 7 with a peak position of 79.4 cM. In the second environment, 3 QTL were detected; one QTL detected on Chr 4 with a position at 28.5 cM; the second QTL on Chr 7 with a position of 90 cM; and a third QTL on Chr 13 with a position of 85.7cM. Similarly, they identified, in one environment, 5 QTL related to seed Zn concentration. Two QTL were identified on Chr 3, one QTL with a position of 128.5 cM and the other QTL with a position of 124.4 cM; one QTL on Chr 11 with position of 89.6 cM; one QTL on Chr 18 with 124.4 cM; and two QTL on Chr 20 (one QTL with a position of 55 cM and the other QTL with a position of 56.3 cM). In the second environment, two QTL were detected on Chr 20; one QTL with a position of 53.4 cM and the other at 55 cM. Bellaloui et al. [7] were able to identify new QTL related to seed Fe and seed Zn in a population of 92 F5:7 RILs that was derived from a cross between MD 96-5722 (MD) and ‘Spencer’, using a genetic linkage map based on 5376 SNPs [21]. They were able to identify 5 QTL for Fe (qIRO001-qIRO005) on Chr 3, 5, 9, 16, 18, respectively, and 7 QTL for Zn (qZIN001-qZIN007) on Chr 3, 5, 9, 16, and 18, respectively. The five Fe QTL (qIRO001-qIRO005) were situated at the peak position of 15.60, 9.50, 0.50, 12.00, and 2.20 cM, respectively, with LOD interval of 15.60–15.80, 8.50–9.50; 0.40–0.50; 10.90–12.20; and 2.10–2.20 cM. Marker intervals for qIRO001- qIRO005 were ss245030179-ss245023395, ss245747167- ss245786667, ss246870684- ss246877864, ss248983974- ss248977568, and ss249623816- ss249632893. For Zn, most of peak positions and LOD intervals were relatively close to those of Fe QTL. The peak ranged from 1.50 to 15.70 cM, and LOD intervals ranged from 1.30 to 15.70 cM so that Fe QTL clustered with Zn QTL on the chromosomes. Although R2 is low (ranged from 3.32% to 12.75%) to explain the phenotypic variance of the trait, generally, and except for qZn-04 on Chr 19 in 2018, all other QTL had significant value of LOD (LOD threshold ≥ 2.5), for example, Figure S10, indicating the important linkage of these QTL to the trait and its inheritance.
The candidate genes underneath identified QTL for Fe and Zn concentration in soybean seeds using SoyBase Genome Browser [44] included: Fe(II)-dependent oxygenase superfamily, Fe superoxide dismutase 2 Iron ion binding oxidoreductase, C2H2-like zinc finger protein, WRKY family transcription factor, and Cu/Zn-superoxide dismutase copper chaperone (Table 4 and Table 5). These annotated genes were located within the QTL interval or vicinity areas. There were more candidate genes existed within these loci for the analyzed traits, may suggest the functional significance of these intervals for the nutrients in soybean plants. For instance, several genes encoded proteins with zinc finger motifs, involved in DNA binding and transcriptional regulation, were identified within Fe QTL, indicating that the crosstalk between the regulatory pathways of Zn and Fe transporters. The metal-responsive transcription factors may coordinate the expression of both Zn and Fe transporters in response to changes in metal availability. Therefore, deciphering the intricacies of Zn and Fe transporter regulation is necessary for maintaining metal homeostasis and preventing deficiencies or toxicities occurred in soybean crop. Further search was made to identify the total numbers of unique SNPs and the number of putative loci associated with shoot concentrations macronutrients (Ca, Mg, K, P, and S) and micronutrients (B, Cu, Fe, Mn, and Zn). Dhanapal et al. [47], using GWAS approach and 31,748 SNPs, they were able to identify several SNPs markers and putative loci related to shoot Fe and Zn. Also, they were able to identify genes with annotations, indicating mineral nutrient transport. Moreover, two QTLs identified using GWAS approach in other studies were also found in our study. The marker ss715579327 was a significant SNP in soybean plant, which associated with B and Fe nutrient combination in soybean stem [40]. The genomic location of the SNP marker shared the collinearity with the intervals of our QTL qFe-1 in two environments. The candidate gene of Glyma.02g124700 in the referred study above appeared to be identified at the same interval as that of QTL qFe-2 in our study.
5. Conclusions
In the current research, we were able to identify novel QTL that are associated with seed Fe and Zn accumulation. The RILs showed a wide range of seed Fe and seed Zn concentrations that can be used a source for breeding selections. The identified QTL and markers associated with the trait can be used to advance our knowledge of Fe and Zn genetic mapping, and in future marker assistant selection for higher Fe and Zn content in soybean seed. The low heritability of Fe indicated the large effects of environment, genes by environment interactions, and the complexity of the trait, indicating the necessity of further research across years, locations, and higher number of replicates. The candidate genes annotated here will deepen and advance our knowledge of mineral genetic pathways at the molecular level. The metal-responsive transcription factors may coordinate the expression of both Zn and Fe transporters in response to changes in metal availability, providing new knowledge on minerals uptake and transport mechanisms, allowing for possible genetic engineering application.
Supplementary Materials
The following supporting information can be downloaded at: https://www.mdpi.com/article/10.3390/ijpb15020035/s1, Figure S1. Chromosome 1 and parameters associated with the quantitative trait loci (QTL) for seed Fe and seed Zn in ‘Forrest’ by ‘Williams 82’ recombinant inbred soybean lines (RILs) population. A total of 5405 single nucleotides polymorphism (SNP) markers using Infinium NP6K BeadChips. A total 2075 polymorphic SNPs were mapped on the 20 soybean chromosomes. Figure S2. Chromosome 2 and parameters associated with the quantitative trait loci (QTL) for seed Fe and seed Zn in ‘Forrest’ by ‘Williams 82’ recombinant inbred soybean lines (RILs) population. A total of 5405 single nucleotides polymorphism (SNP) markers using Infinium SNP6K BeadChips. A total 2075 polymorphic SNPs were mapped on the 20 soybean chromosomes. Figure S3. Chromosome 3 and parameters associated with the quantitative trait loci (QTL) for seed Fe and seed Zn in ‘Forrest’ by ‘Williams 82’ recombinant inbred soybean lines (RILs) population. A total of 5405 single nucleotides polymorphism (SNP) markers using Infinium SNP6K BeadChips. A total 2075 polymorphic SNPs were mapped on the 20 soybean chromosomes. Figure S4. Chromosome 4 and parameters associated with the quantitative trait loci (QTL) for seed Fe and seed Zn in ‘Forrest’ by ‘Williams 82’ recombinant inbred soybean lines (RILs) population. A total of 5405 single nucleotides polymorphism (SNP) markers using Infinium SNP6K BeadChips. A total 2075 polymorphic SNPs were mapped on the 20 soybean chromosomes. Figure S5. Chromosome 6 and parameters associated with the quantitative trait loci (QTL) for seed Fe and seed Zn in ‘Forrest’ by ‘Williams 82’ recombinant inbred soybean lines (RILs) population. A total of 5405 single nucleotides polymorphism (SNP) markers using Infinium SNP6K BeadChips. A total 2075 polymorphic SNPs were mapped on the 20 soybean chromosomes. Figure S6. Chromosome 7 and parameters associated with the quantitative trait loci (QTL) for seed Fe and seed Zn in ‘Forrest’ by ‘Williams 82’ recombinant inbred soybean lines (RILs) population. A total of 5405 single nucleotides polymorphism (SNP) markers using Infinium SNP6K BeadChips. A total 2075 polymorphic SNPs were mapped on the 20 soybean chromosomes. Figure S7. Chromosome 8 and parameters associated with the quantitative trait loci (QTL) for seed Fe and seed Zn in ‘Forrest’ by ‘Williams 82’ recombinant inbred soybean lines (RILs) population. A total of 5405 single nucleotides polymorphism (SNP) markers using Infinium SNP6K BeadChips. A total 2075 polymorphic SNPs were mapped on the 20 soybean chromosomes. Figure S8. Chromosome 12 and parameters associated with the quantitative trait loci (QTL) for seed Fe and seed Zn in ‘Forrest’ by ‘Williams 82’ recombinant inbred soybean lines (RILs) population. A total of 5405 single nucleotides polymorphism (SNP) markers using Infinium SNP6K BeadChips. A total 2075 polymorphic SNPs were mapped on the 20 soybean chromosomes. Figure S9. Chromosome 19 and parameters associated with the quantitative trait loci (QTL) for seed Fe and seed Zn in ‘Forrest’ by ‘Williams 82’ recombinant inbred soybean lines (RILs) population. A total of 5405 single nucleotides polymorphism (SNP) markers using Infinium SNP6K BeadChips. A total 2075 polymorphic SNPs were mapped on the 20 soybean chromosomes. Figure S10. Example of some significant QTL as indicated by their logarithms of adds (LOD) for Zn (top) and Fe (bottom).
Author Contributions
Conceptualization, M.A.K. and K.M.; methodology, D.K., J.Y., Q.S., F.B., T.R., E.W., N.L., N.B. and A.M.; validation, M.A.K., K.M. and H.T.N.; formal analysis, D.K., J.Y., A.M. and N.B.; investigation, K.M., D.K. and A.M.; resources, K.M., N.B., A.M. and H.T.N.; genotyping, Q.S.; data curation, D.K. and J.Y.; writing—original draft preparation, N.B., M.A.K. and D.K.; writing—review and editing, D.K., J.Y., N.B., N.L., H.M., A.M., M.A.K., K.M. and H.T.N.; visualization, J.Y.; supervision, M.A.K., J.Y., K.M., H.M. and H.T.N.; project administration, M.A.K., K.M., H.T.N. and N.B. All authors have read and agreed to the published version of the manuscript.
Funding
This research was funded by the U.S. Department of Agriculture, Agricultural Research Service Project 6066-21220-014-000D, SIUC, UM, and FSU.
Institutional Review Board Statement
Not applicable.
Informed Consent Statement
Not applicable.
Data Availability Statement
Data supporting reported results are available on request from the corresponding author.
Acknowledgments
We would like to thank Tri D. Vuong for his technical support on the SoySNP6K Infnium genotyping and linkage map construction. Manuscript technical support provided by Sandra Mosley and Rama Gadi is also appreciated. Mention of trade names or commercial products in this publication is solely for the purpose of providing specific information and does not imply recommendation or endorsement by the United States Department of Agriculture (USDA). The findings and conclusions in this publication are those of the authors and should not be construed to represent any official USDA or U.S. Government determination or policy. USDA is an equal opportunity provider and employer.
Conflicts of Interest
The authors declare no conflict of interest.
References
- Saleem, M.H.; Rizwan, M.; Jabri, H.A.; Alsafran, M. Functions and strategies for enhancing zinc availability in plants for sustainable agriculture. Front. Plant Sci. 2022, 13, 1033092. [Google Scholar] [CrossRef] [PubMed]
- Al-Mutairi, A.A.; Cavagnaro, T.R.; Khor, S.F.; Neumann, K.; Burton, R.A.; Watts-Williams, S. The effect of zinc fertilisation and arbuscular mycorrhizal fungi on grain quality and yield of contrasting barley cultivars. Funct. Plant Biol. 2020, 47, 122–133. [Google Scholar] [CrossRef] [PubMed]
- Andresen, E.; Peiter, E.; Küpper, H. Trace metal metabolism in plants. J. Exp. Bot. 2018, 69, 909–954. [Google Scholar] [CrossRef] [PubMed]
- Mengel, K.; Kirkby, E.A. Principles of Plant Nutrition; International Potash Institute: Worblaufen, Switzerland, 1982. [Google Scholar]
- Marschner, H. Mineral Nutrition of Higher Plants; Academic Press: London, UK, 1995. [Google Scholar]
- Bellaloui, N.; Smith, J.R.; Ray, J.D.; Gillen, A.M. Effect of maturity on seed composition in the early soybean production system as measured on near-isogenic soybean lines. Crop Sci. 2009, 49, 608–620. [Google Scholar] [CrossRef]
- Bellaloui, N.; Khandaker, L.; Akond, M.; Kantartzi, S.K.; Meksem, K.; Mengistu, M.; Lightfoot, D.A.; Kassem, M.A. Identification of QTL underlying seed micronutrients accumulation in ‘MD 96-5722’ by ‘Spencer’ recombinant inbred lines of soybean. Atlas J. Plant Biol. 2015, 1, 39–49. [Google Scholar] [CrossRef]
- Wang, H.; Jia, J.; Cai, Z.; Duan, M.; Jiang, Z.; Xia, Q.; Ma, Q.; Lian, T.; Nian, H. Identification of quantitative trait loci (QTLs) and candidate genes of seed Iron and zinc content in soybean [Glycine max (L.) Merr.]. BMC Genom. 2022, 146, 146. [Google Scholar] [CrossRef]
- King, K.E.; Peiffer, G.A.; Reddy, M.; Lauter, N.; Lin, S.F.; Cianzio, S.; Shoemaker, R.C. Mapping of iron and zinc quantitative trait loci in soybean for association to iron deficiency chlorosis resistance. J. Plant Nutr. 2013, 36, 2132–2153. [Google Scholar] [CrossRef]
- Grotz, N.; Guerinot, M. Molecular aspects of Cu, Fe and Zn homeostasis in plants. Biochim. Biophys. Acta 2006, 1763, 595–608. [Google Scholar] [CrossRef] [PubMed]
- Kirkby, E.A.; Romheld, V. Micronutrients in Plant Physiology: Functions, Uptake, and Mobility; International Fertilizer Society: Cambridge, UK, 2004. [Google Scholar]
- Sousa, S.F.; Lopes, A.B.; Fernandes, P.A.; Ramos, M.J. The zinc proteome: A tale of stability and functionality. Dalton Trans. 2009, 38, 7946–7956. [Google Scholar] [CrossRef]
- Cakmak, I. Possible roles of zinc in protecting plant cells from damage by reactive oxygen species. New Phytol. 2000, 146, 185–205. [Google Scholar] [CrossRef]
- Prask, J.A.; Plocke, D.J.A. Role of zinc in the structural integrity of the cytoplasmic ribosomes of Euglena gracilis. Plant Physiol. 1971, 48, 150–155. [Google Scholar] [CrossRef] [PubMed]
- Coleman, J.E. Zinc proteins: Enzymes, storage proteins, transcription factors, and replication proteins. Annu. Rev. BioChem. 1992, 61, 897–946. [Google Scholar] [CrossRef] [PubMed]
- Andreini, C.; Bertini, I.; Rosato, A. Metalloproteomes: A bio-informatic approach. Acc. Chem. Res. 2009, 42, 1471–1479. [Google Scholar] [CrossRef] [PubMed]
- Sekimoto, H.; Hoshi, M.; Nomura, T.; Yokota, T. Zinc deficiency affects the levels of endogenous gibberellins in Zea mays L. Plant Cell Physiol. 1997, 38, 1087–1090. [Google Scholar] [CrossRef]
- Maret, W.; Li, Y. Coordination dynamics of zinc in proteins. Chem. Rev. 2009, 109, 4682–4707. [Google Scholar] [CrossRef] [PubMed]
- Andreini, C.; Bertini, I.; Cavallaro, G. Minimal functional sites allow a classification of zinc sites in proteins. PLoS ONE 2011, 6, e26325. [Google Scholar] [CrossRef]
- Lin, S.; Cianzio, S.; Shoemaker, R.C. Mapping genetic loci for iron deficiency chlorosis in soybean. Mol. Breed. 1997, 3, 219–229. [Google Scholar] [CrossRef]
- Kassem, M.A. Seed amino acids, macronutrients, micronutrients, sugars, and other compounds. In Soybean Seed Composition: Protein, Oil, Fatty Acids, Amino Acids, Sugars, Mineral Nutrients, Tocopherols, and Isoflavones; Springer: Cham, Switzerland, 2021. [Google Scholar] [CrossRef]
- Ramamurthy, R.K.; Jedlicka, J.; Graef, G.L.; Waters, B.M. Identification of new QTLs for seed mineral, cysteine, and methionine concentrations in soybean [Glycine max (L.) Merr.]. Mol. Breed. 2014, 34, 431–445. [Google Scholar] [CrossRef]
- Diers, B.W.; Cianzio, S.R.; Shoemaker, R.C. Possible identification of quantitative trait loci affecting iron efficiency in soybean. J. Plant Nutr. 1992, 10, 2127–2136. [Google Scholar] [CrossRef]
- Kumar, S.; Hash, C.T.; Thirunavukkarasu, N.; Singh, G.; Rajaram, V.; Rathore, A.; Senapathy, S.; Mahendrakar, M.D.; Yadav, R.S.; Srivastava, R.K. Mapping quantitative trait loci controlling high iron and zinc content in self and open pollinated grains of pearl millet [Pennisetum glaucum (L.) R. Br.]. Front. Plant Sci. 2016, 7, 1636. [Google Scholar] [CrossRef]
- Rai, K.N.; Govindaraj, M.; Rao, A.S. Genetic enhancement of grain iron and zinc content in pearl millet. Qual. Assur. Saf. Crops Foods 2012, 4, 119–125. [Google Scholar] [CrossRef]
- Qin, J.; Shi, A.; Mou, B.; Grusak, M.A.; Weng, Y.; Ravelombola, W.; Bhattarai, G.; Dong, L.; Yang, W. Genetic diversity and association mapping of mineral element concentrations in spinach leaves. BMC Genom. 2017, 18, 941. [Google Scholar] [CrossRef] [PubMed]
- Hartwig, E.E.; Epps, J.M. Registration of ‘Forrest’ soybeans. Crop Sci. 1973, 13, 287. [Google Scholar] [CrossRef]
- Bernard, R.L.; Cremeens, C.R. Registration of Williams 82 soybean. Crop Sci. 1988, 28, 1027–1028. [Google Scholar] [CrossRef]
- Shultz, J.L.; Kurunam, D.; Shopinski, K.; Iqbal, M.J.; Kazi, S.; Zobrist, K.; Bashir, R.; Yaegashi, S.; Lavu, N.; Afzal, A.J.; et al. The soybean genome database (SoyGD): A browser for display of duplicated, polyploid, regions and sequence tagged sites on the integrated physical and genetic maps of Glycine max. Nucleic Acids Res. 2006, 34, D758–D765. [Google Scholar] [CrossRef] [PubMed]
- Wu, X.; Vuong, T.D.; Leroy, J.A.; Shannon, J.G.; Sleper, D.A.; Nguyen, H.T. Selection of a core set of RILs from Forrest x Williams to develop a framework map in soybean. Theor. Appl. Genet. 2011, 122, 1179–1187. [Google Scholar] [CrossRef] [PubMed][Green Version]
- Knizia, D.; Yuan, J.; Bellaloui, N.; Vuong, T.; Usovsky, M.; Usovsky, M.; Song, Q.; Betts, F.; Register, T.; Williams, E.; et al. The soybean high density ‘Forrest’ by ‘Williams 82’ SNP-based genetic linkage map identifies QTL and candidate genes for seed isoflavone content. Plants 2021, 10, 2029. [Google Scholar] [CrossRef] [PubMed]
- Bellaloui, N.; Saha, S.; Tonos, J.L.; Scheffler, J.A.; Jenkins, J.N.; McCarty, J.C.; Stelly, D.M. Effects of interspecific chromosome substitution in upland cotton on cottonseed micronutrients. Plants 2020, 9, 1081. [Google Scholar] [CrossRef] [PubMed]
- Bellaloui, N.; Smith, J.R.; Gillen, A.M.; Ray, J.D. Effects of maturity, genotypic background, and temperature on seed mineral composition in near-isogenic soybean lines in the early soybean production system. Crop Sci. 2011, 51, 1161–1171. [Google Scholar] [CrossRef]
- Bellaloui, N.; Turley, R.B. Effects of fuzzless cottonseed phenotype on cottonseed nutrient composition in near isogenic cotton (Gossypium hirsutum L.) mutant lines under well-watered and water stress conditions. Front. Plant Sci. 2013, 4, 516. [Google Scholar] [CrossRef]
- Vuong, T.D.; Sleper, D.A.; Shannon, J.G.; Nguyen, H.T. Novel quantitative trait loci for broad-based resistance to soybean cyst nematode (Heterodera glycines Ichinohe) in soybean PI 567516C. Theor. Appl. Genet. 2010, 121, 1253–1266. [Google Scholar] [CrossRef] [PubMed]
- Song, Q.; Yan, L.; Quigley, C.; Fickus, E.; Wei, H.; Chen, L.; Dong, F.; Araya, S.; Liu, J.; Hyten, D.; et al. Soybean BARCSoySNP6K: An assay for soybean genetics and breeding research. Plant J. 2020, 104, 800–811. [Google Scholar] [CrossRef] [PubMed]
- Van Ooijen, J.W. Joinmap 4.0 Software for the Calculation of Genetic Linkage Maps in Experimental Populations; Plant Research International: Wageningen, The Netherlands, 2006. [Google Scholar]
- Brown, A.V.; Conners, S.I.; Huang, W.; Wilkey, A.P.; Grant, D.; Weeks, N.T.; Cannon, S.B.; Graham, M.A.; Nelson, R.T. A new decade and new data at SoyBase, the USDA-ARS soybean genetics and genomics database. Nucleic Acids Res. 2020, 49, D1496–D1501. [Google Scholar] [CrossRef] [PubMed]
- Grant, D.; Nelson, R.T.; Cannon, S.B.; Shoemaker, R.C. SoyBase, the USDA-ARS soybean genetics and genomics database. Nucleic Acids Res. 2010, 38, D843–D846. [Google Scholar] [CrossRef] [PubMed]
- Pilet-Nayel, M.L.; Muehlbauer, F.J.; McGee, R.J.; Kraft, J.M.; Baranger, A.; Coyne, C.J. Quantitative trait loci for partial resistance to Aphanomyces root rot in pea. Theor. Appl. Genet. 2002, 106, 28–39. [Google Scholar] [CrossRef] [PubMed]
- R Software. Available online: https://www.r-project.org (accessed on 15 June 2023).
- Wang, S.; Basten, C.J.; Zeng, Z.B. Windows QTL Cartographer 2.5; Department of Statistics, NCSU: Raleigh, NC, USA, 2012; Available online: http://statgen.ncsu.edu/qtlcart/WQTLCart.htm (accessed on 8 August 2023).
- Voorrips, R.E. MapChart: Software for the graphical presentation of linkage maps and QTL. J. Hered. 2002, 93, 77–78. [Google Scholar] [CrossRef] [PubMed]
- SoyBase Genome Browser. Available online: https://www.soybase.org/SequenceIntro.php (accessed on 9 April 2024).
- Statistical Analysis Systems (SAS); SAS Institute: Cary, NC, USA, 2002–2012.
- Ning, L.; Sun, P.; Wang, Q.; Ma, D.; Hu, Z.; Zhang, D.; Zhang, G.; Cheng, H.; Yu, D. Genetic architecture of biofortification traits in soybean (Glycine max L. Merr.) revealed through association analysis and linkage mapping. Euphytica 2015, 204, 353–369. [Google Scholar] [CrossRef]
- Dhanapal, A.P.; Ray, J.D.; Smith, J.R.; Purcell, L.C.; Fritschi, F.B. Identification of novel genomic loci associated with soybean shoot tissue macro and micronutrient concentrations. Plant Gen. 2018, 11, 170066. [Google Scholar] [CrossRef]


Disclaimer/Publisher’s Note: The statements, opinions and data contained in all publications are solely those of the individual author(s) and contributor(s) and not of MDPI and/or the editor(s). MDPI and/or the editor(s) disclaim responsibility for any injury to people or property resulting from any ideas, methods, instructions or products referred to in the content. |
© 2024 by the authors. Licensee MDPI, Basel, Switzerland. This article is an open access article distributed under the terms and conditions of the Creative Commons Attribution (CC BY) license (https://creativecommons.org/licenses/by/4.0/).