Article

Nitrate Reductase and Glutamine Synthetase Enzyme Activities and Chlorophyll in Sorghum Leaves (Sorghum bicolor) in Response to Organic Fertilization

by
Ericka Nieves-Silva
1,*,
Engelberto Sandoval-Castro
1,*,
Adriana Delgado-Alvarado
1,
María D. Castañeda-Antonio
2 and
Arturo Huerta-De la Peña
1
1
Colegio de Postgraduados, Campus Puebla, Boulevard Forjadores de Puebla No. 205, Santiago Momoxpan, Municipio de San Pedro Cholula 72760, Mexico
2
Centro de Investigaciones en Ciencias Microbiológicas del Instituto de Ciencias, Benemérita Universidad Autónoma de Puebla, Puebla 72490, Mexico
*
Authors to whom correspondence should be addressed.
Int. J. Plant Biol. 2024, 15(3), 827-836; https://doi.org/10.3390/ijpb15030059
Submission received: 16 July 2024 / Revised: 3 August 2024 / Accepted: 15 August 2024 / Published: 20 August 2024
(This article belongs to the Section Plant Physiology)

Abstract

:
Sorghum is a plant that mainly requires chemical nitrogen fertilization. There are organic fertilizers that can provide nutrients to plants with great benefits to the soil, such as chicken manure. To determine the influence of organic fertilization on nitrate reductase (NR), glutamine synthetase (GS), and the amount of chlorophyll, sorghum plants were grown using the following four treatments: soil (T1), soil + chicken manure 100 kg ha−1 of nitrogen (N) (T2), soil + chicken manure 200 kg ha−1 N (T3), and soil + ammonium sulfate 100 kg ha−1 N (T4). Leaves were sampled in the vegetative stage (VS), the reproductive stage (RS), and the maturation stage (MS). The highest NR activity occurred in plants with T2 and T3 in the VS. The highest GS activity was in T3 and T4 in the RS. The amount of chlorophyll a was the same in all phenological stages. However, the amount of chlorophyll b was influenced by the type of fertilization at different phenological stages. Organic fertilizers (OF) produced the highest NR activity. On the other hand, GS activity was higher with chemical fertilization (T4), which was equal to the second dose of organic fertilization (T3). Finally, chlorophyll a and b were influenced by both types of fertilization, and was different from T1.

1. Introduction

Sorghum (Sorghum bicolor) is a crop that has diverse uses around the world as a source of energy for biofuels and as food for animals and humans [1]. This crop is industrialized and requires large amounts of nitrogen (N); this element plays an important role in plant development, because, if there is not an adequate supply, plants cannot produce the amino acids required to generate essential proteins for plant cells, negatively affecting plant growth [2]. N is equally important for the cultivation of S. bicolor at recommended doses of between 100 and 120 kg ha−1 N, encouraging rapid growth and a sufficient leaf area for greater radiation interception [3]. The main sources of N for plants are in the forms of nitrate (NO3) and ammonium (NH4+), but the assimilation of these molecules requires enzymes that convert inorganic N to organic N. Nitrate reductase (NR) and glutamine synthetase (GS) are the main enzymes involved in this conversion [4]. Firstly, the enzyme NR is responsible for reducing N to nitrite (NO2) in the cytosol; on the other hand, in the chloroplasts, ammonium is assimilated by GS to obtain glutamine; both enzymes are involved in a system that regulates specific signals, which is required in plants [4]. Chlorophyll is a central pigment necessary for photosynthesis to take place in plants, because it is responsible for trapping solar energy and storing it in the form of chemical energy; this process is fundamental in plant growth [5]. The main source of fertilization in sorghum is chemical fertilization, where there is generally no efficiency in the absorption of nutrients by plants; the resulting excess N that is not absorbed is lost via leaching, runoff, and volatilization, affecting the environment and causing economic losses [6,7]. In recent years, the use of organic fertilizers (OF) has been promoted as an alternative, since it has been demonstrated that the addition of organic manures provides benefits to the soil such as a greater porosity, surface crusting, and, therefore, greater water retention; all of these benefits are a result of the availability of organic matter [8]. OF also release nutrients that meet the physiological needs of the plants of interest, so there is an efficient use of nutrients and nutrient losses are minimized [9]. In relation to the above, in previous work, it has been shown that N fixation, and, therefore, enzyme activity, is influenced by fertilization sources [10], and, also, that the amount of chlorophyll can be influenced by the same factor, with a higher amount of chlorophyll being observed in OF treatments [11,12]. However, there is no information on the influence of OF on sorghum; therefore, the objective of this work is to determine the influence of organic fertilization on the enzymatic activity of NR and GS, as well as on the amount of chlorophyll, in sorghum leaves at different phenological stages.

2. Materials and Methods

2.1. Plant Material

S. bicolor seeds were grown in polyethylene bags under greenhouse conditions (20–24 °C; 60 ± 10%) and were irrigated every 3 days. The experiment was set up based on a completely randomized design with 4 treatments (Table 1), each with 12 replicates. Measurements were taken at 30 (vegetative stage), 60 (reproductive stage), and 90 (maturation stage) days.

2.2. Determination of Nitrate Reductase Activity (NR)

According to the methodology of Jaworski [13], with modifications, 50 mg of leaves was taken from each treatment, cut into 2 mm pieces, and placed in a dark vial containing 1.5 mL of potassium phosphate buffer (0.05 M, pH 7.8) and 1.5 mL of KNO2 (0.4 M). Then, the samples were evacuated with a vacuum pump for 3 min, followed by incubation at 37 °C for 75 min, and the activity was stopped by placing the samples in boiling water for 5 min. Finally, 200 µL of the sample extract was taken and added to 1 mL of sulfanilamide (1%) and 1 mL of naphthyl (0.020%), leaving the samples to stand for 30 min. The enzymatic activity of NR was measured using the absorbance in a spectrophotometer at 540 nm to determine the nitrite formed from a standard curve of a solution of potassium nitrite; the activity was expressed in µmol formed of NO2 h−1 g−1 of fresh weight (µmol NO2 h−1 g−1 FW).

2.3. Determination of Glutamine Synthetase Activity (GS)

According to the methodology of O’neal and Joy [14] with modifications, 50 mg of leaves was taken to be ground in a cold mortar (4 °C) with 1 mL of TRIS-HCl (0.1 M, pH 7.8), and the extract was placed in tubes for centrifugation at 10,000× g for 20 min (4 °C). Then, 0.2 mL of the following reagents were placed in tubes: L-Glutamate (0.6 M), hydroxylamide hydrochloride (0.045 M), MgSO4 (0.45 M), ATP (0.06 M), TRIS-HCl (0.1 M, pH 7.8), and 0.1 mL of enzyme extract. The blank contained all reagents except ATP. The above mixture was incubated in a water bath (30 °C) for 20 min, and, after this period of time, the reaction was terminated with 0.5 mL FeCl3 (0.37 M), 0.5 mL trichloroacetic acid (0.2 M), and 0.5 mL HCl (0.67 M). This mixture was centrifuged at 10,000× g for 5 min (4 °C) and read in a spectrophotometer at 540 nm to determine the amount of γ-glutamyl hydroxamate (γ-GHM), and GS activity was expressed in µmol formed of γ-GHM h−1 g−1 of fresh weight (µmol γ-GHM h−1 g−1 FW).

2.4. Determination of Chlorophyll a and b

To determine the chlorophyll a and b content, firstly, 50 mg of leaves was taken from the second pair of leaves of the plant and cut into 2 mm pieces, then placed in 1.5 mL of 80% acetone at 4 °C. This was sonicated for 3 min and allowed to stand in the dark at 4 °C for 24 h. After the resting period, the sample was sonicated for 30 sec and centrifuged at 2350× g for 5 min. Finally, the absorbance of the sample was measured in a spectrophotometer at 646 nm (chlorophyll a) and 663 nm (chlorophyll b), determining the amount of chlorophyll in mg g−1.

2.5. Statistical Analysis

The data obtained were subjected to an analysis of variance (ANOVA) and Tukey’s posterior test to determine differences among treatments and phenological stages. Statistical Analysis System (SAS) version 3.81 was used.

3. Results

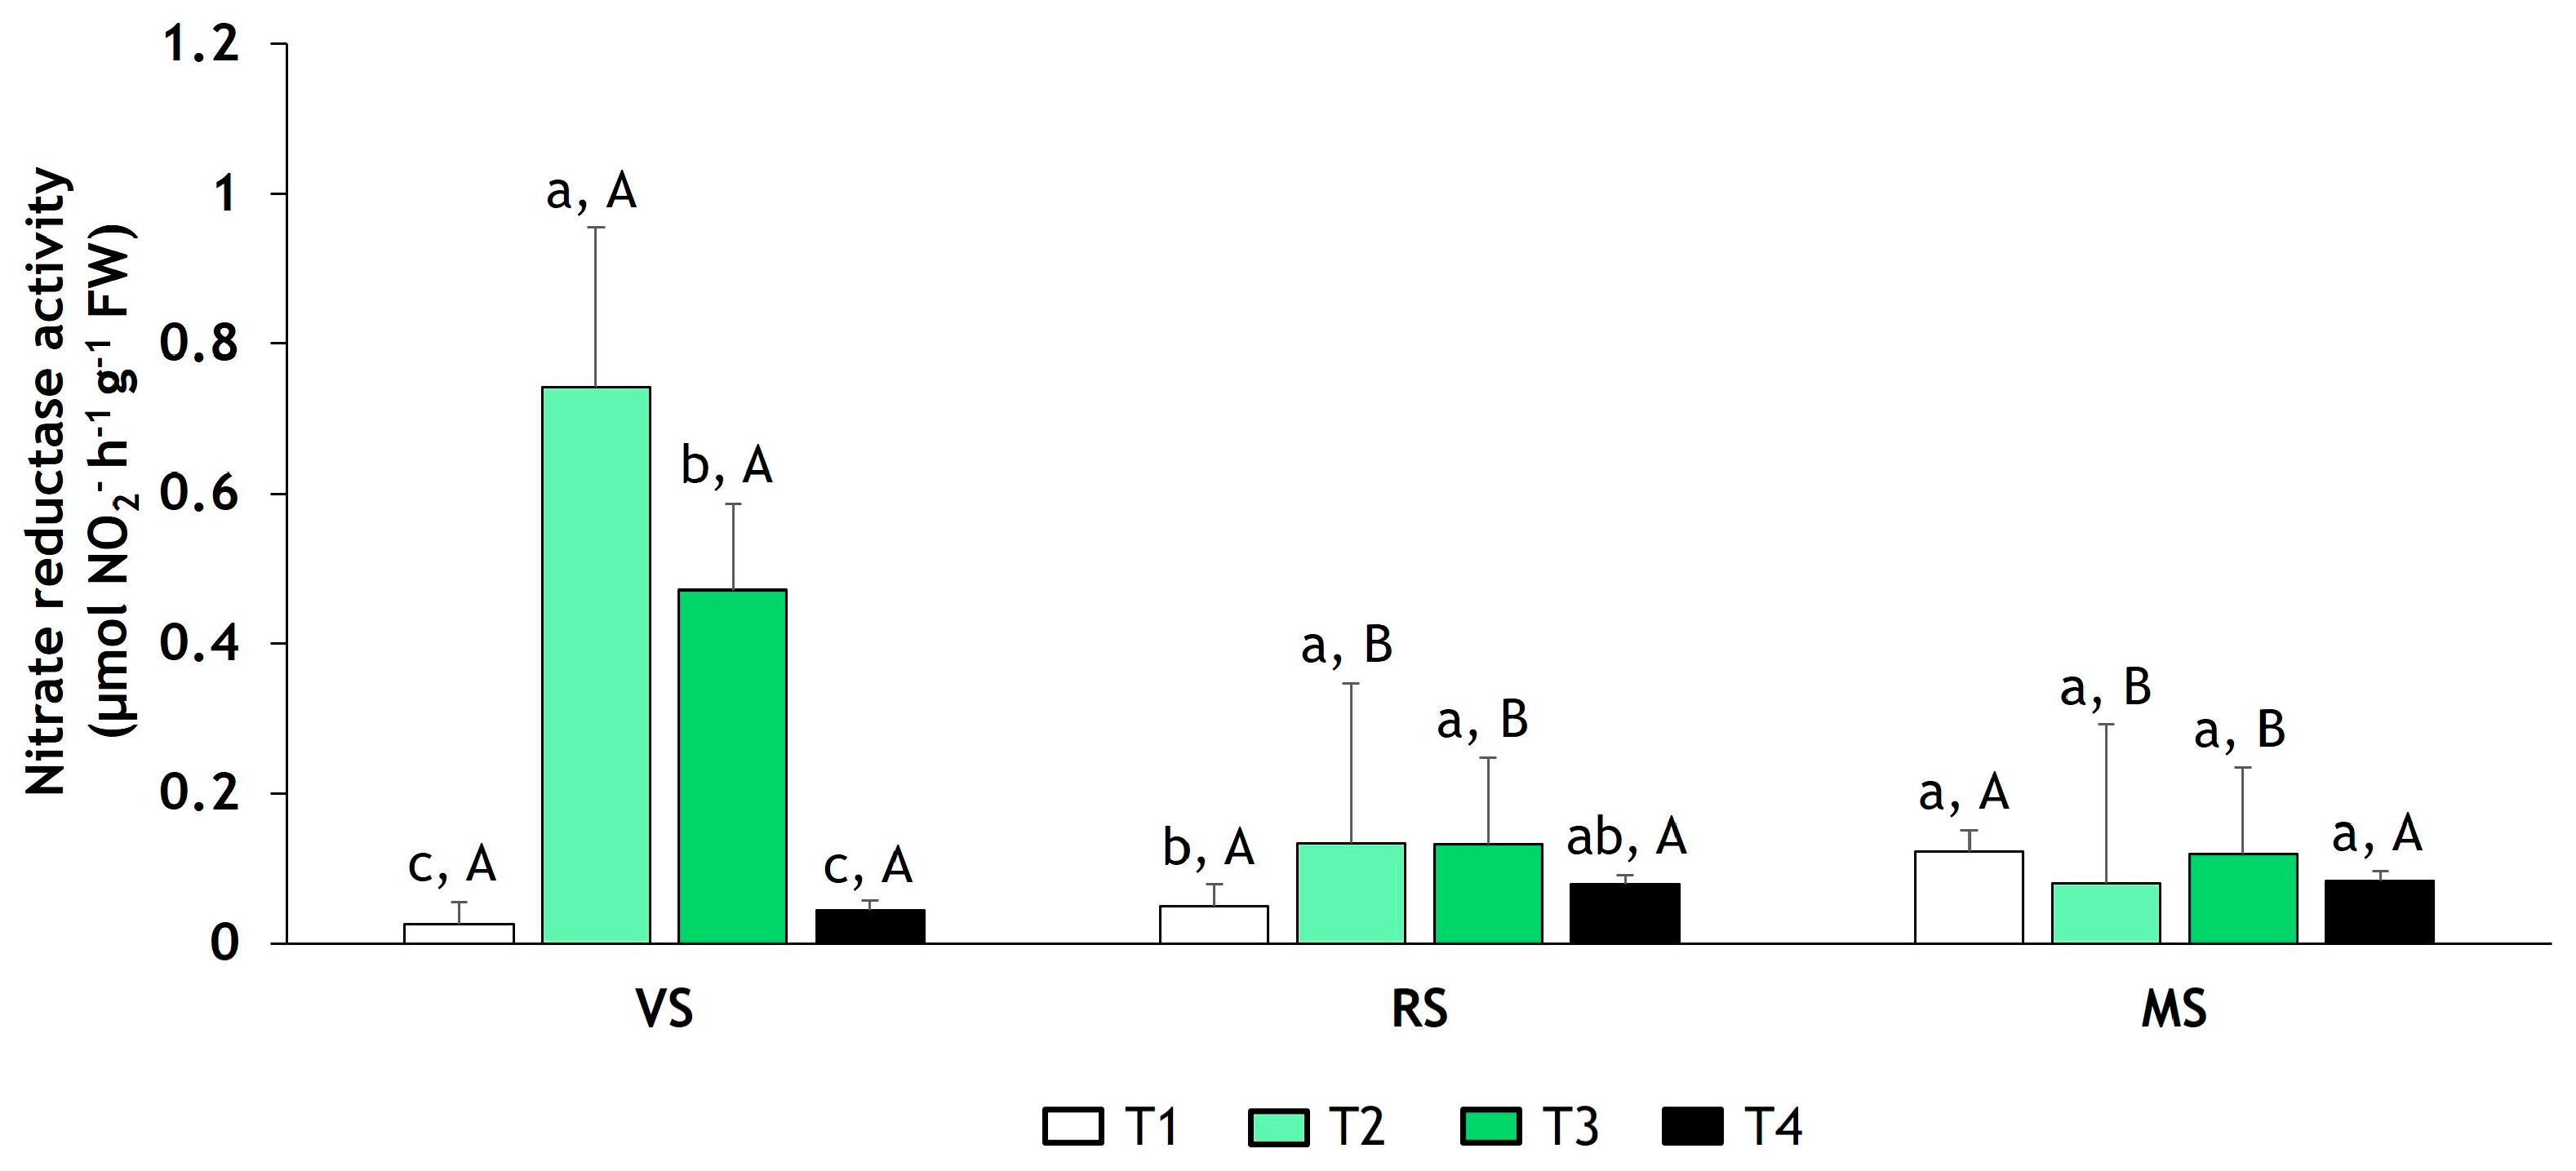
3.1. Determination of NR Activity

In the vegetative stage (VS), there was higher NR activity in T2 (0.74257) and T3 (0.47118) than T4 (0.04397) and T1 (0.02553) (Tukey’s test, p < 0.05) (Figure 1). Similarly, in the reproductive stage (RS), the highest NR activity was in T2 (0.13426) and T3 (0.13257), followed by T4 (0.07881) and T1 (0.04974) (Tukey’s test, p < 0.05) (Figure 1). Finally, the NR activity in the maturation stage (MS) was equal in all treatments (Tukey’s test, p > 0.05) (Figure 1).
The NR activity in the phenological stages varied according to treatment. The highest NR activity was in the VS in T2 (0.74257), which decreases significantly (Tukey’s test, p < 0.05) in the RS (0.13426) and MS (0.08021) (Figure 1). In T3, the same trend appeared in which the highest activity was in the VS (0.47118) (Tukey’s test, p < 0.05), followed by the RS (0.13257) and MS (0.11919), which were not much different from each other (Tukey’s test, p > 0.05) (Figure 1). On the other hand, in T1 and T4, the NR activity was the same in each phenological stage (Tukey’s test, p > 0.05) (Figure 1).

3.2. Determination of GS Activity

The GS activity in the VS was different among treatments (Tukey’s test, p < 0.05): T4 (9.11) and T3 (8.32) had a higher activity, followed by T2 (6.06) and T1 (5.17) (Figure 2). In the RS, the same trend was obtained in T3 (9.92) and T4 (9.37), these two treatments having the highest activity (Tukey’s test, p < 0.05), followed by T2 (5.63) and T1 (4.53) (Figure 2). Finally, in the MS, the highest activity was obtained in T3 (6.27) and T4 (4.83), which was significantly different from T2 (2.95) and T1 (1.91) (Tukey’s test, p < 0.05) (Figure 2).
The GS activity in the phenological stages was different according to treatment (Tukey’s test, p < 0.05): in T1, the highest activity was in the VS (5.17), remaining similar in the RS (4.53), and decreasing in the MS (1.91) (Figure 2). Likewise, in T2, the highest activity was in the VS (6.06), being equal in the RS (5.63), and decreasing in the MS (2.95) (Tukey’s test, p < 0.05) (Figure 2). In T3, the GS activity was different in the three phenological stages, with the highest activity in the RS (9.92) (Tukey’s test, p < 0.05) (Figure 2). Finally, T4 had the highest activity in the VS (9.11) and the RS (9.37), decreasing in the MS (4.83) (Tukey’s test, p < 0.05) (Figure 2).

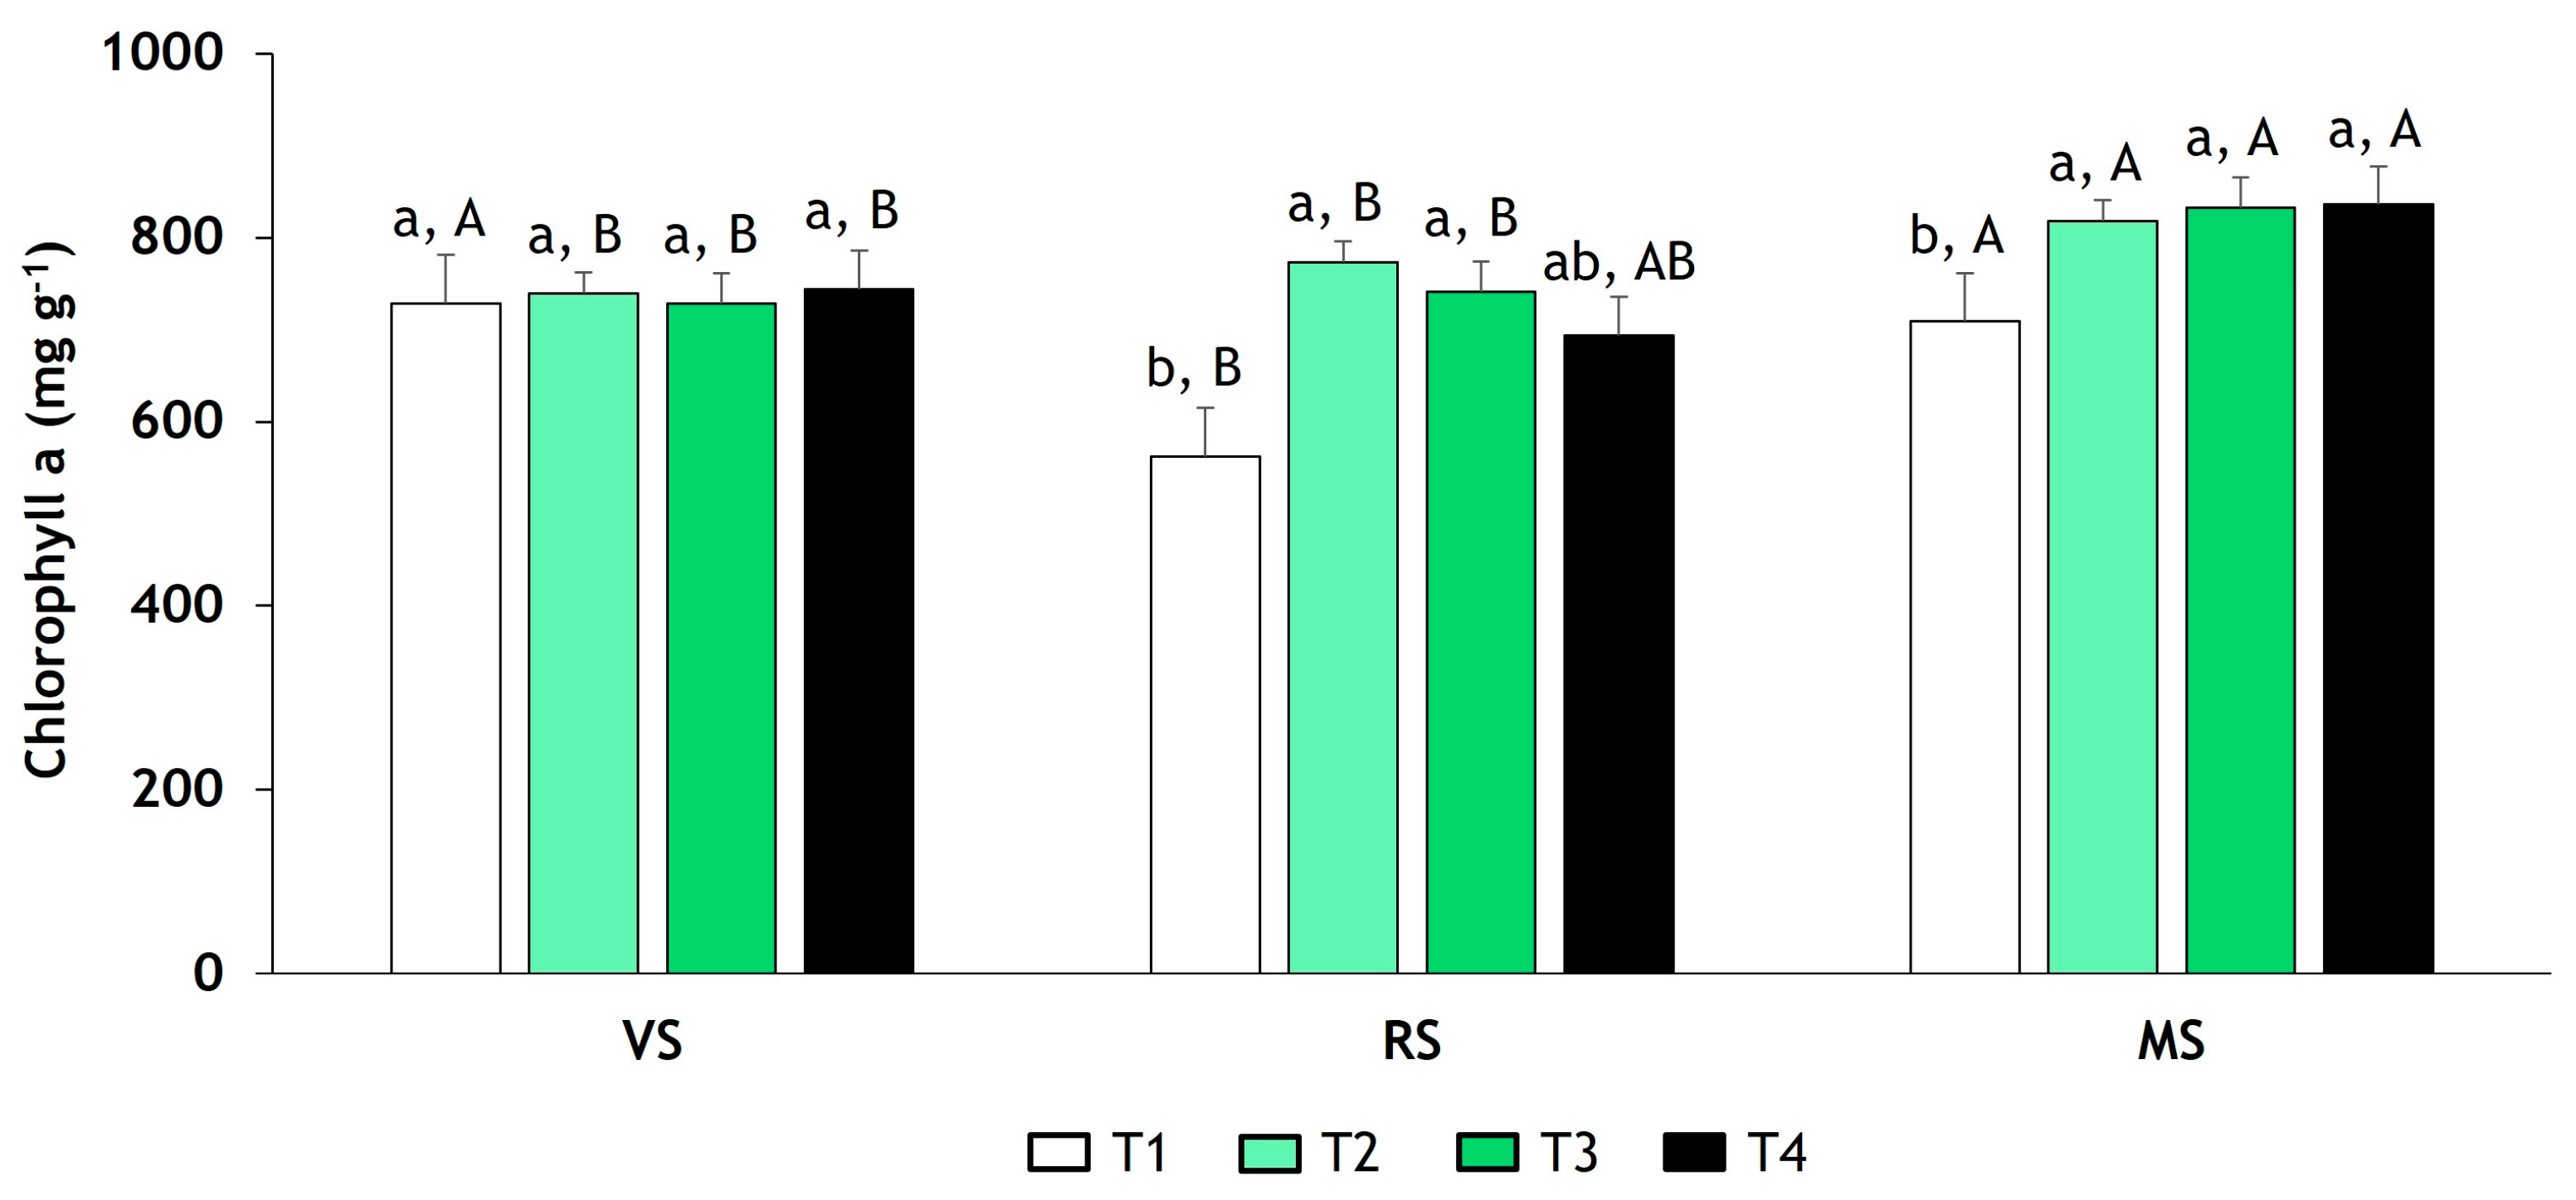
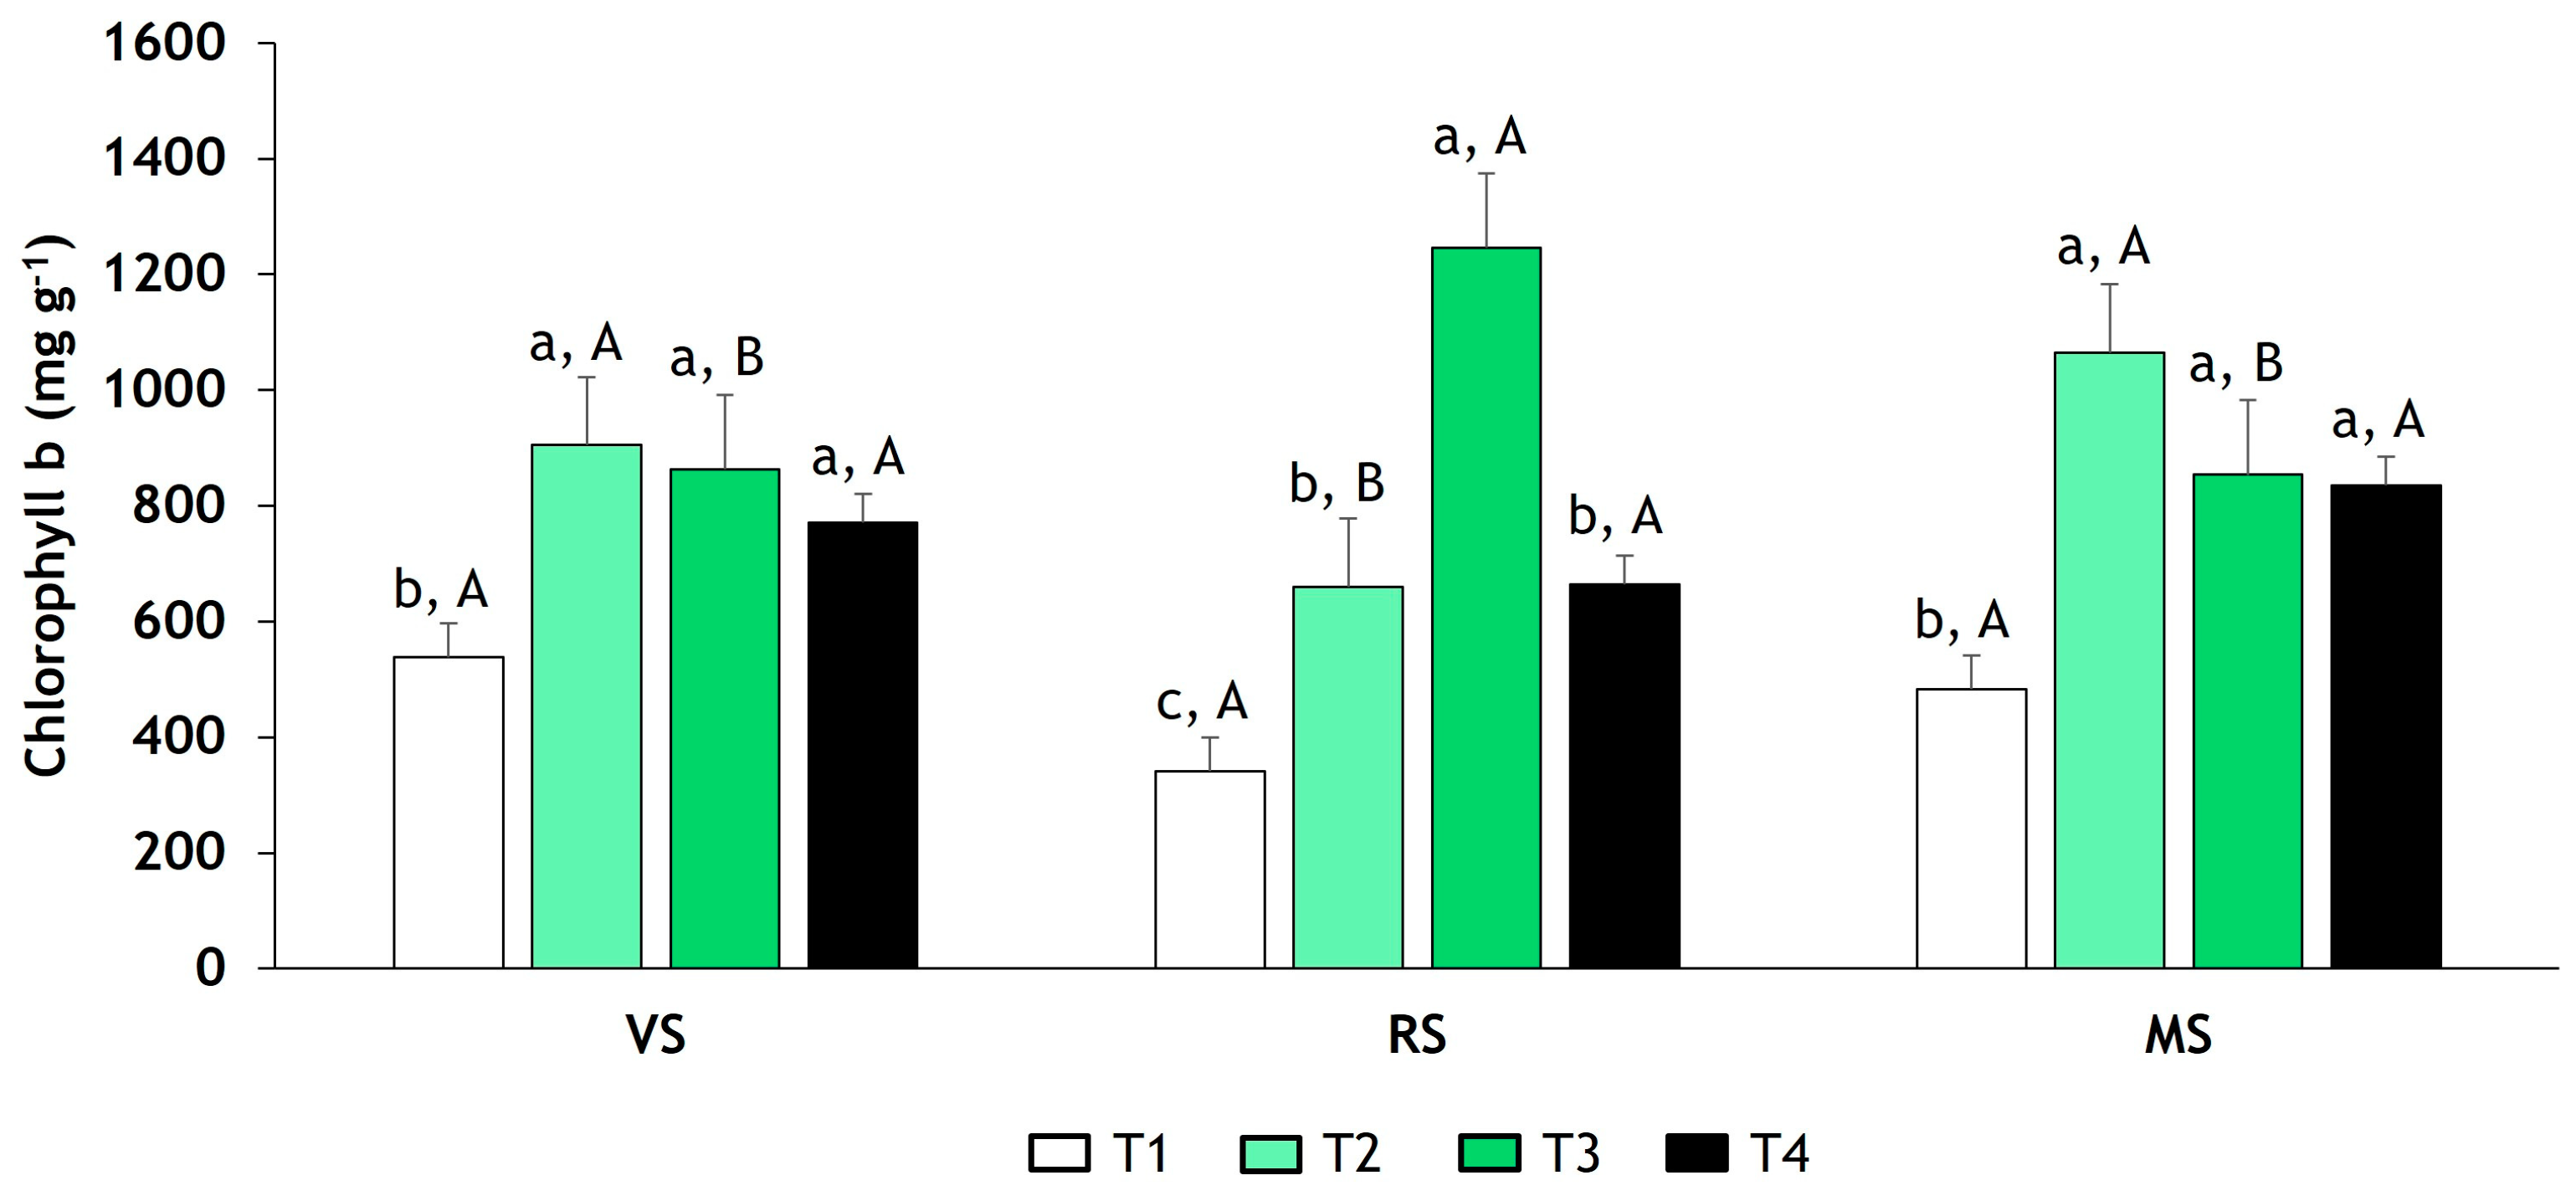
3.3. Determination of Chlorophyll a and b

The amount of chlorophyll a present during the VS was equal in all treatments (Tukey’s test, p > 0.05) (Figure 3). In the RS, the amount of chlorophyll a was equal and higher in T2 (773.1) and T3 (740.93) (Tukey’s test, p > 0.05), but it decreased in T1 (562.19) (Tukey’s test, p < 0.05) (Figure 3). In the MS, fertilized plants had the highest amount of chlorophyll a, these being different to T1 (709.08) (Tukey’s test, p < 0.05) (Figure 3). The amount of chlorophyll a according to the phenological stages was different for all treatments (Tukey’s test, p < 0.05): the highest amount was in T1 in the VS (728.83), decreasing in the RS (562.19), and increasing again in the MS (709.08) (Tukey’s test, p < 0.05) (Figure 3). Conversely, the highest amount of chlorophyll a in T2 was in the MS (818.27), higher than in the RS (773.1) and VS (738.97) (Tukey’s test, p < 0.05) (Figure 3). In T3, the amount of chlorophyll a was the highest in the MS (832.51) and different to the RS (740.93) and VS (728.83) (Tukey’s test, p < 0.05) (Figure 3). Similarly, in T4, the amount of chlorophyll a was the highest in the MS (836.06) and different to the VS (744.18) (Tukey’s test, p < 0.05) (Figure 3).
T2 (905.21), T3 (862.49), and T4 (770.45) presented high amounts of chlorophyll b, being higher than T1 (537.95) in the VS (Tukey’s test, p < 0.05) (Figure 4). In the RS, the highest amount of chlorophyll b was in T3 (1245.67), followed by T2 (660.3), T4 (664.05), and T1 (341.62) (Tukey’s test, p < 0.05) (Figure 4). Finally, in the MS, the amount of chlorophyll b was equal and higher in T2 (1064.9), T3 (853.6), and T4 (835) (Tukey’s test, p > 0.05), but different to T1 (Tukey’s test, p < 0.05) (Figure 4). Regarding the differences in treatment among the phenological stages, the amount of chlorophyll b in T1 was the highest in the VS (537.95), decreasing in the RS (341.62), and increasing again in the MS (482.4), but was not statistically different (Tukey’s test, p > 0.05) (Figure 4). In T2, chlorophyll b was higher in the MS (1064.9) and VS (905.21), being different to the RS (660.3) (Tukey’s test, p < 0.05) (Figure 4). In T3, for chlorophyll b, the highest amount was obtained in the RS (1245.67), being lower in the VS (862.49) and MS (853.6) (p < 0.05, Figure 4). Finally, in T4, the amount of chlorophyll b was equal in the VS (770.45), RS (664.05), and MS (835) (Tukey’s test, p > 0.05) (Figure 4).

4. Discussion

Related to the data obtained, it has been reported that OF such as cow manure and vermicompost provide the soil with organic material that influences the greater availability of nitrogenous elements and, therefore, increases NR activity [15,16]. This coincides with the data reported in this work, in which the treatments with chicken manure had the highest activity compared to conventional fertilization in the VS. Another aspect is that NR activity is related to an increase in N dose, and this trend is also present in other plants such as maize and coffee [17,18]. This does not coincide with the results obtained in this work that indicate that, in the VS, T2 representing the lower dose of N was the one that had a higher NR activity than in the high dose. However, it should be noted that conventional fertilization (T4), which has the same dose as T2, had lower activity and equal activity to the control, which is in agreement with the results of another report, which indicates that NR activity was higher in plants treated with OF [16]. NR activity was promoted by both types of fertilization in the VS, contrary to the results obtained with T1, which shows that both types of fertilization influenced NR activity. This can be attributed to N availability, directly affecting plant metabolism, and is an effect that has been reported in other plants such as Citrus reticulata, Zea mays, and Oryza sativa [19,20,21].
Differences in NR activity in the phenological stages according to treatment have previously been reported in sorghum, where the activity was higher in the RS and decreased in the MS [22], a trend which is different from the data reported here for sorghum. Likewise, it has been reported that enzyme activity decreases according to plant age, which is attributed to metabolic changes in the plant and natural leaf ontogenesis [23]. However, the above differs from the results presented here, where the OF promoted NR activity in the VS. This finding may be due to a higher N availability resulting from the presence of organic matter and, thus, a rapid N reduction at this stage [16,24].
In relation to GS activity, it has been reported that, in a greater presence of N, there is greater GS activity, which coincides in this work with T2 and T3 having differences in the activity of this enzyme in both doses [25]. Nevertheless, when OF (T2) and conventional fertilization (T4) were contrasted at the same doses, they presented different activity, being higher with conventional fertilization, which is in agreement with another report, where GS activity was the highest in lettuce fertilized with NPK than with OF [26]. Although GS activity was significantly influenced by chemical fertilization in the present work, it has been reported that the combination of OF and conventional fertilization promotes GS activity to a greater extent than if only conventional fertilization is used as a source [27].
The GS activity in the phenological stages was different according to treatment, coinciding with the results of another study in sorghum plants [22], which suggests that the activity in sorghum decreases in each phenological stage. This trend is presented in maize plants, where it has been reported that there is a decrease in GS activity as the plant grows [18,28], coinciding, in this work, with the results in T1, T2, and T4. However, in T3, the activity was higher in the RS, a result which is in agreement with that obtained in coffee plants, resulting from a high mobilization of amino acids due to the higher availability of N [17,29]. In this sense, it has been reported that glutamine is an amino acid with a high availability in the phloem of plants in the RS; thus, it is expected that there is greater GS activity at this stage [24]. Moreover, N accumulation has been related to anthesis, which marks the stage at which flag leaf senescence begins and, thus, grain filling, which, in turn, depends on the amount of amino acid translocation that directly influences grain yield [30,31].
It has been reported that the amount used in plant fertilization influences the amount of chlorophyll a and b: as there is an increase in N, there is a higher concentration of chlorophyll, and even these two factors have been correlated in such a way that, by measuring chlorophyll, we can understand the state or concentration of N in the plant [32]. These data differ with most of the data reported here, the main trend being that the chlorophyll concentration was equal in all treatments; however, only in the RS with T3 was it observed that, with a higher amount of N, there was a greater amount of chlorophyll b. Another important factor is that the amount of chlorophyll has been reported to be higher in chemically fertilized plants than with OF [12]; in this study, there was no statistical difference between fertilized treatments so that organic and conventional fertilization did not influence the amount of chlorophyll in all phenological stages. Supporting the above, organic and conventional fertilization increased the amount of chlorophyll in plants to the same extent, with the amount of chlorophyll being higher in fertilized plants than in plants without any fertilization [33]. In other studies, it has been shown that the use of OF such as manure increases the amount of chlorophyll a and b to a greater extent than chemical fertilizers [11]. In the present study, although no differences were found between treatments in the amount of chlorophyll, there was a tendency to present a greater amount of chlorophyll in treatments with OF. On the other hand, there are already reports in sorghum of the amount of chlorophyll related to N levels, reporting a similar behavior to that presented in this work with T1 and T2, where we found no differences in the amount of chlorophyll. However, they also reported a higher amount of chlorophyll a than b, contrary to what we obtained in our work [34]. This higher amount of chlorophyll b in sorghum plants could represent an advantage since the abundance of chlorophyll b is attributed to the overexpression of the enzyme chlorophyllide a oxygenase, and, as a consequence of this, there is a higher amount of proteins of the electron transport chain, which influences the increase in light capture [35]. This could be due to the fertilization sources used and the plant varieties used [34]. However, in future studies, it would be interesting to sow plants in field conditions in order to contrast these results and determine whether there is a change due to the availability of light.
Regarding the amount of chlorophyll dependent on phenological stages, it has been reported that mature leaves have a higher amount of chlorophyll than juvenile leaves; likewise, an increase in chlorophyll a and b in wheat was observed according to plant maturity [36,37]. This coincides with the present work, in which, in most of the treatments, a higher amount of chlorophyll was obtained in the MS. Therefore, our results are contrary to those obtained with cucumber, where a higher amount of chlorophyll was found in the VS and a decreasing amount in the RS and MS [38]. Similarly, the amount of chlorophyll was increasing only in chlorophyll a in T2 and T3, but, in general, the overall behavior of chlorophyll a and b is that, in the VS, chlorophyll decreased and increased again in the MS. This trend coincides with the results of a study of buster grain sorghum, which showed that the behavior was not continuously ascending or descending [39]. These results could be related to the fact that N absorption in the RS (the stage with a lower amount of chlorophyll) was used to produce necessary physical structures [40], such as reaching the highest amount of leaf area, so that, at this stage, the panicle size is defined and flowering begins. After this process, N can be used to form a higher amount of chlorophyll again in the MS. Another reason for the difference between our data and those reported previously may be the plant genotype being used, which causes variations in the amount of chlorophyll [40]. On the other hand, changes in the increase or decrease in the amount of chlorophyll may be due to an increase in the activity of the enzyme chlorophyllase, which is responsible for the natural breakdown of chlorophyll [41].

5. Conclusions

The treatments fertilized with chicken manure promoted NR activity in the VS in sorghum plants, expressing this as a greater amount of nitrate. However, it is important to adequately fertilize the crops, since fertilization with chicken manure at the recommended dose (T2) presented higher NR activity than with a higher dose (T3), thus avoiding the accumulation of nitrate and, therefore, the inefficient use of nitrogen. On the other hand, GS activity was influenced to a greater extent by fertilization with chicken manure at a higher dose (T3) and with conventional fertilization, which indicates that NR and GS activity behave differently depending on the treatments used, such that combining conventional fertilization with organic fertilizers could have a positive impact. Conversely, the amounts of chlorophyll a and b were equally influenced by the fertilized treatments, which suggests that fertilizers influence the photosynthetic efficiency of sorghum.
Enzymatic activity differs according to the sorghum phenological stage, in which NR has a higher activity in the VS, GS, and RS, and, finally, the amount of chlorophyll is higher in the VS and MS; thus, the N assimilation and the N requirement in each phenological stage are different.

Author Contributions

Conceptualization, E.N.-S. and A.D.-A.; methodology, E.N.-S. and A.D.-A.; software, E.N.-S.; validation, E.S.-C., A.D.-A., E.S.-C., M.D.C.-A. and A.H.-D.l.P.; formal analysis, E.N.-S.; investigation, E.N.-S. and A.D.-A.; resources, E.N.-S. and E.S.-C.; data curation, E.N.-S. and E.S.-C.; writing—original draft preparation, E.N.-S.; writing—review and editing E.N.-S., E.S.-C., A.D.-A., M.D.C.-A. and A.H.-D.l.P.; visualization, E.N.-S.; supervision, E.N.-S. and A.D.-A.; project administration, E.N.-S., A.D.-A. and E.S.-C.; funding acquisition, E.N.-S. and E.S.-C. All authors have read and agreed to the published version of the manuscript.

Funding

This study is a product of the doctoral dissertation of the first author, who is grateful to the Consejo Nacional de Humanidades, Ciencias y Tecnologías (CONAHCyT) for grant number 814396 in support of her doctoral studies.

Institutional Review Board Statement

Not applicable.

Informed Consent Statement

Not applicable.

Data Availability Statement

The data are contained within the article.

Conflicts of Interest

The authors declare no conflicts of interest.

References

  1. Ikuze, E.; Cromwell, S.; Ayayee, P.; Louis, J. Influence of microbes in mediating sorghum resistance to sugarcane aphids. Diversity 2024, 16, 85. [Google Scholar] [CrossRef]
  2. Liang, G.; Hua, Y.; Chen, H.; Luo, J.; Xiang, H.; Song, H.; Zhang, Z. Increased nitrogen use efficiency via amino acid remobilization from source to sink organs in Brassica napus. Crop J. 2023, 11, 119–131. [Google Scholar] [CrossRef]
  3. Carrasco, N.; Zamora, M.; Melin, A. Manual de Sorgo, 1st ed.; Instituto Nacional de Tecnología Agropecuaria, Ediciones INTA: Buenos Aires, Argentina, 2011; p. 110. [Google Scholar]
  4. Hussain, S.; Khaliq, A.; Noor, M.; Tanveer, M.; Hussain, H.; Hussain, S.; Shah, T.; Mehmood, T. Metal toxicity and nitrogen metabolism in plants: An Overview. In Carbon and Nitrogen Cycling in Soil; Datta, R., Meena, R., Pathan, S., Cecchereni, M., Eds.; Springer: Singapore, 2019; pp. 221–248. [Google Scholar] [CrossRef]
  5. Mandal, R.; Dutta, G. From photosynthesis to biosensing: Chlorophyll proves to be a versatile molecule. Sens. Int. 2020, 1, 100058. [Google Scholar] [CrossRef]
  6. Tyagi, J.; Ahmad, S.; Malik, M. Nitrogenous fertilizers: Impact on environment sustainable, mitigation strategies, and challenges. Int. J. Environ. Sci. Technol. 2022, 19, 11649–11672. [Google Scholar] [CrossRef]
  7. Rodríguez-Espinosa, T.; Papamichael, I.; Voukkali, I.; Pérez, A.; Almendro, M.; Navarro-Pedreño, J.; Zorpas, A.; Gómez, I. Nitrogen management in farming systems under the use of agricultural wastes and circular economy. Sci. Total Environ. 2023, 876, 162666. [Google Scholar] [CrossRef]
  8. Sedlar, O.; Balík, J.; Cerný, J.; Kulhánek, M.; Smatanová, M. Long-term application of organic fertilizers in relation to soil organic matter quality. Agronomy 2023, 13, 175. [Google Scholar] [CrossRef]
  9. Singh, R.; Kumar, S.; Sainger, M.; Sainger, P.; Barnawal, D. Eco-friendly nitrogen fertilizers for sustainable agriculture. In Adaptative Soil Management: From Theory to Practices; Rakshit, A., Abhilash, P., Singh, H., Ghosh, S., Eds.; Springer: Singapore, 2017; pp. 227–246. [Google Scholar] [CrossRef]
  10. Shi, W.; Zhao, H.; Chen, Y.; Wang, J.; Han, B.; Li, C.; Lu, J.; Zhang, L. Organic manure rather than phosphorus fertilization primarily determined asymbiotic nitrogen fixation rate and the stability of diazotrophic community in an upland red soil. Agric. Ecosyst. Environ. 2021, 319, 107535. [Google Scholar] [CrossRef]
  11. Ikyo, B.; Enenche, D.; Omotosho, S.; Ofeozo, M.; Rotimi, T. Spectroscopic analysis of the effect of organic and inorganic fertilizers on the chlorophylls pigment in amaranth and jute mallow vegetables. Nig. Ann. Pure Appl. Sci. 2020, 3, 115–121. [Google Scholar] [CrossRef]
  12. Cevheri, C.; Sakin, E.; Ramazanoglu, E. Effects of different fertilizers on some soil enzymes activity and chlorophyll contents of two cotton (G. hirsutum L.) varieties grown in a saline and non-saline soil. J. Plant Nutr. 2021, 45, 95–106. [Google Scholar] [CrossRef]
  13. Jaworski, E. Nitrate reductase assay in intact plant tissues. Biochem. Biophys. Res. Commun. 1971, 43, 1274–1279. [Google Scholar] [CrossRef] [PubMed]
  14. O’neal, D.; Joy, K. Glutamine synthetase of pea leaves I. purification, stabilization, and pH optima. Arch. Biochem. Biophys. 1973, 159, 113–122. [Google Scholar] [CrossRef]
  15. Purbajanti, E.; Slamet, W.; Fuskhah, E. Nitrate reductase, chlorophyll content and antioxidant in okra (Abelmoschus esculentus Moench) under organic fertilizer. J. Appl. Hortic. 2019, 21, 213–217. [Google Scholar] [CrossRef]
  16. Purbajanti, E.; Slamet, W.; Fuskhah, E.; Rosyida, R. Effects of organic and inorganic fertilizers on growth, activity of nitrate reductase and chlorophyll contents of peanuts (Arachis hypogaea L.). IOP Conf. Ser. Earth Environ. Sci. 2019, 250, 012048. [Google Scholar] [CrossRef]
  17. Reis, A.; Favarin, J.; Gallo, L.; Malavolta, E.; Moraes, M.; Junior, J. Nitrate reductase and glutamine synthetase activity in coffee leaves during fruit development. Rev. Bras. Cienc. Solo 2009, 33, 315–324. [Google Scholar] [CrossRef]
  18. Kaur, A.; Bedi, S.; Kumar, M. Physiological basis of nitrogen use efficiency at variable nitrogen application rates in maize. Agric. Res. J. 2019, 56, 40–48. [Google Scholar] [CrossRef]
  19. Xiong, H.; Ma, H.; Hu, B.; Zhao, H.; Wang, J.; Rennenberg, H.; Shi, X. Nitrogen fertilization stimulates nitrogen assimilation and modifies nitrogen partitioning in the spring shoot leaves of citrus (Citrus reticulata Blanco) trees. J. Plant Physiol. 2021, 267, 153556. [Google Scholar] [CrossRef]
  20. Chen, H.; Huang, L. Effect of nitrogen fertilizer application rate on nitrate reductase activity in maize. Appl. Ecol. Env. Res. 2020, 18, 2879–2894. [Google Scholar] [CrossRef]
  21. Wang, J.; Fu, Z.; Chen, G.; Zou, G.; Song, X.; Liu, F. Runoff nitrogen (N) losses and related metabolism enzyme activities in paddy field under different nitrogen fertilizer levels. Environ. Sci. Pollut. Res. 2018, 25, 27583–27593. [Google Scholar] [CrossRef] [PubMed]
  22. Oliveira, C.; Lobato, A.; Costa, R.; Maia, W.; Santos, B.; Alves, G.; Brinez, B.; Neves, H.; Santos, M.; Cruz, F. Nitrogen compounds and enzyme activities in sorghum induced to water deficit during three stages. Plant Soil Environ. 2009, 55, 238–244. [Google Scholar] [CrossRef]
  23. Da Silva, A.; Borges, V.; Guimaraes, L.; De Almeida, D.; Martins, M.; Zuffo, C.; Rodrigues, S.; Lucena, I. Nitrate reductase activity in the different phenophases of “palmer” mango cultivated in the semiarid. J. Appl. Bot. Food Qual. 2021, 94, 192–198. [Google Scholar] [CrossRef]
  24. Argentel, L.; Garatuza, J.; Arredondo, T.; Yépez, E. Effects of experimental warming on peroxide, nitrate reductase and glutamine synthetase activities in wheat. Agron. Res. 2019, 17, 22–32. [Google Scholar] [CrossRef]
  25. Rehman, M.; Yang, M.; Fahad, S.; Salem, M.; Liu, L.; Liu, F.; Deng, G. Morpho-physiological traits, antioxidant capacity and nitrogen metabolism in Boehmeria nivea L. under nitrogen fertilizer. Agron. J. 2020, 112, 2988–2997. [Google Scholar] [CrossRef]
  26. Kirova, E.; Geneva, M.; Kostadinov, K.; Filipov, S. Improving yield and quality-related physiological characteristics of lettuce by integrated inorganic and organic fertilizers management. Saudi J. Biol. Sci. 2022, 27, 797–804. [Google Scholar] [CrossRef]
  27. Iqbal, A.; He, L.; Ali, I.; Ullah, S.; Khan, A.; Akhtar, K.; Wei, S.; Fahad, S.; Khan, R.; Jiang, L. Co-incorporation of manure and inorganic fertilizer improves leaf physiological traits, rice production and soil functionality in paddy field. Sci. Rep. 2021, 11, 10048. [Google Scholar] [CrossRef]
  28. Singh, P.; Tomar, R.; Kumar, K.; Kumar, B.; Rakshit, S.; Singh, I. Morpho-physiological and biochemical characterization of maize genotypes under nitrogen stress conditions. Indian J. Genet. Pl. Br. 2021, 81, 255–265. [Google Scholar] [CrossRef]
  29. Neto, A.; Favarin, J.; dos Reis, A.; Tezotto, T.; Munhoz, E.; Lavres, J.; Gallo, L. Nitrogen metabolism in coffee plants in response to nitrogen supply by fertigation. Theor. Exp. Plant Phys. 2015, 27, 41–50. [Google Scholar] [CrossRef]
  30. Luo, L.; Zhang, Y.; Xu, G. How does nitrogen shape plant architecture? J. Exp. Bot. 2020, 71, 4415–4427. [Google Scholar] [CrossRef]
  31. Guo, N.; Gu, M.; Hu, J.; Qu, H.; Xu, G. Rice OsLHT1 functions in leaf-to-panicle nitrogen allocation for grain yield and quality. Front. Plant Sci. 2020, 11, 1150. [Google Scholar] [CrossRef]
  32. Mendoza-Tafolla, R.; Juarez-Lopez, P.; Ontiveros-Capurata, R.; Sandoval-Villa, M.; Alia-Tejacal, I.; Alejo-Santiago, G. Estimating nitrogen and chlorophyll status of romaine lettuce using SPAD and at LEAF readings. Not. Bot. Horti Agrobo. Cluj-Napoca 2019, 47, 751–756. [Google Scholar] [CrossRef]
  33. Chamle, D.; Raut, D. Evaluation of organic and inorganic fertilizers on chlorophyll content, leaf area and yield of maize. EPRA J. Agric. Rural. Econ. Res. 2021, 10, 15–17. [Google Scholar]
  34. Ahmad, I.; Zhu, G.; Zhou, G.; Song, X.; Ibrahim, M.; Salih, G. Effect of N on growth, antioxidant capacity, and chlorophyll content of sorghum. Agronomy 2022, 12, 501. [Google Scholar] [CrossRef]
  35. Biswal, A.; Pattanayak, G.; Pandey, S.; Leelavathi, S.; Reddy, V.; Govindjee, G.; Tripathy, B. Light intensity-dependent modulation of chlorophyll b biosynthesis and photosynthesis by overexpression of chlorophyllide a oxygenase in tobacco. Plant Physiol. 2012, 159, 433–449. [Google Scholar] [CrossRef] [PubMed]
  36. Cevahir, G.; Yentür, S.; Yazgan, M.; Ünal, M.; Yilmazer, N. Peroxidase activity in relation to anthocyanin and chlorophyll content in juvenile and adult leaves of “MINI-STAR” Gazania splendens. Pak. J. Bot. 2004, 36, 603–609. [Google Scholar]
  37. Tranaviciene, T.; Siksnianiene, J.; Urbonaviciute, A.; Vaguseviciene, I.; Samuoliene, G.; Duchovskis, P.; Sliesaravicius, A. Effects of nitrogen fertilizers on wheat photosynthetic pigment and carbohydrate contents. Biologija 2007, 53, 80–84. [Google Scholar] [CrossRef]
  38. Padilla, F.; Peña-Fleitas, M.; Gallardo, M.; Giménez, C.; Thompson, B. Derivation of sufficiency values of chlorophyll meter to estimate cucumber nitrogen status and yield. Comput. Electron. Agric. 2017, 141, 54–64. [Google Scholar] [CrossRef]
  39. Souza, C.; Brant, C.; Soares, R. Chlorophyll index (SPAD) and macronutrients relation and productive performance of sorghum hybrids in different sowing dates. Aust. J. Crop Sci. 2016, 10, 546–555. [Google Scholar] [CrossRef]
  40. Argenta, G.; Regis, P.; Sangoi, L. Leaf relative chlorophyll content as an indicator parameter to predict nitrogen fertilization in maize. Cienc. Rural. 2004, 34, 1379–1387. [Google Scholar] [CrossRef]
  41. Kraj, W. Chlorophyll degradation and the activity of chlorophyllase and Mg-dechelatase during leaf senescence in Fagus sylvatica. Dendrobiology 2015, 74, 43–57. [Google Scholar] [CrossRef]
Figure 1. NR activity in vegetative (VS), reproductive (RS), and maturation (MS) stages in S. bicolor plants. The mean values with different lowercase letters indicate significant differences among treatments (T1, T2, T3, and T4) (Tukey’s p < 0.05). The mean values with different capital letters in the same treatment indicate significant differences among phenological stages (VS, RS, and MS) (Tukey’s p < 0.05). T1: soil; T2: soil + chicken manure 100 kg ha−1 N; T3: soil + chicken manure 200 kg ha−1 N; and T4: soil + ammonium sulfate 100 kg ha−1 N.
Ijpb 15 00059 g001
Figure 2. GS activity in vegetative (VS), reproductive (RS), and maturation (MS) stages in S. bicolor plants. The mean values with different lowercase letters indicate significant differences among treatments (T1, T2, T3, and T4) (Tukey’s p < 0.05). The mean values with different capital letters in the same treatment indicate significant differences among phenological stages (VS, RS, and MS) (Tukey’s p < 0.05). T1: soil; T2: soil + chicken manure 100 kg ha−1 N; T3: soil + chicken manure 200 kg ha−1 N; and T4: soil + ammonium sulfate 100 kg ha−1 N.
Ijpb 15 00059 g002
Figure 3. Comparison of the amount of chlorophyll a in vegetative (VS), reproductive (RS), and maturation (MS) stages in S. bicolor plants. The mean values with different lowercase letters indicate significant differences among treatments (T1, T2, T3, and T4) (Tukey’s p < 0.05). The mean values with different capital letters in the same treatment indicate significant differences among phenological stages (VS, RS, and MS) (Tukey’s p < 0.05). T1: soil; T2: soil + chicken manure 100 kg ha−1 N; T3: soil + chicken manure 200 kg ha−1 N; and T4: soil + ammonium sulfate 100 kg ha−1 N.
Ijpb 15 00059 g003
Figure 4. Comparison of the amount of chlorophyll b in vegetative (VS), reproductive (RS), and maturation (MS) stages in S. bicolor plants. The mean values with different lowercase letters indicate significant differences among treatments (T1, T2, T3, and T4) (Tukey’s p < 0.05). The mean values with different capital letters in the same treatment indicate significant differences among phenological stages (VS, RS, and MS) (Tukey’s p < 0.05). T1: soil; T2: soil + chicken manure 100 kg ha−1 N; T3: soil + chicken manure 200 kg ha−1 N; and T4: soil + ammonium sulfate 100 kg ha−1 N.
Ijpb 15 00059 g004
Table 1. Fertilization treatments in S. bicolor.
TreatmentsDescription
T1Soil (4.4% organic matter; nitrogen 100 ppm; phosphorus 0.80 ppm; potassium 5.50 ppm; and pH 7.4)
T2100 kg ha−1 N (chicken manure) + soil
T3200 kg ha−1 N (chicken manure) + soil
T4100 kg ha−1 N (ammonium sulfate) + soil
Disclaimer/Publisher’s Note: The statements, opinions and data contained in all publications are solely those of the individual author(s) and contributor(s) and not of MDPI and/or the editor(s). MDPI and/or the editor(s) disclaim responsibility for any injury to people or property resulting from any ideas, methods, instructions or products referred to in the content.

