
The Toxic Effects of Petroleum Diesel, Biodiesel, and Renewable Diesel Exhaust Particles on Human Alveolar Epithelial Cells

 , , , , , , ,
Abstract
:
1. Introduction
2. Materials and Methods
2.1. Engine, Exhaust Dilution, and Fuels
2.2. Sampling and Chemical/Physical Characterization of DEPs
2.3. Sample Preparation for Cell Studies
2.4. Experimental Setup for Toxicological Study
2.5. Assessments of Inflammation Mediators
2.6. Analyses of Cell Viability
2.7. Assessment of ROS inside Cells
2.8. Sub-G1 and Cell Cycle
2.9. OTM Analysis
2.10. Statistical Analysis
2.11. Use of Generative AI
3. Results and Discussion
3.1. Fuels
3.2. Particle Size Distribution
3.3. Chemical Composition of the Exhaust Particles
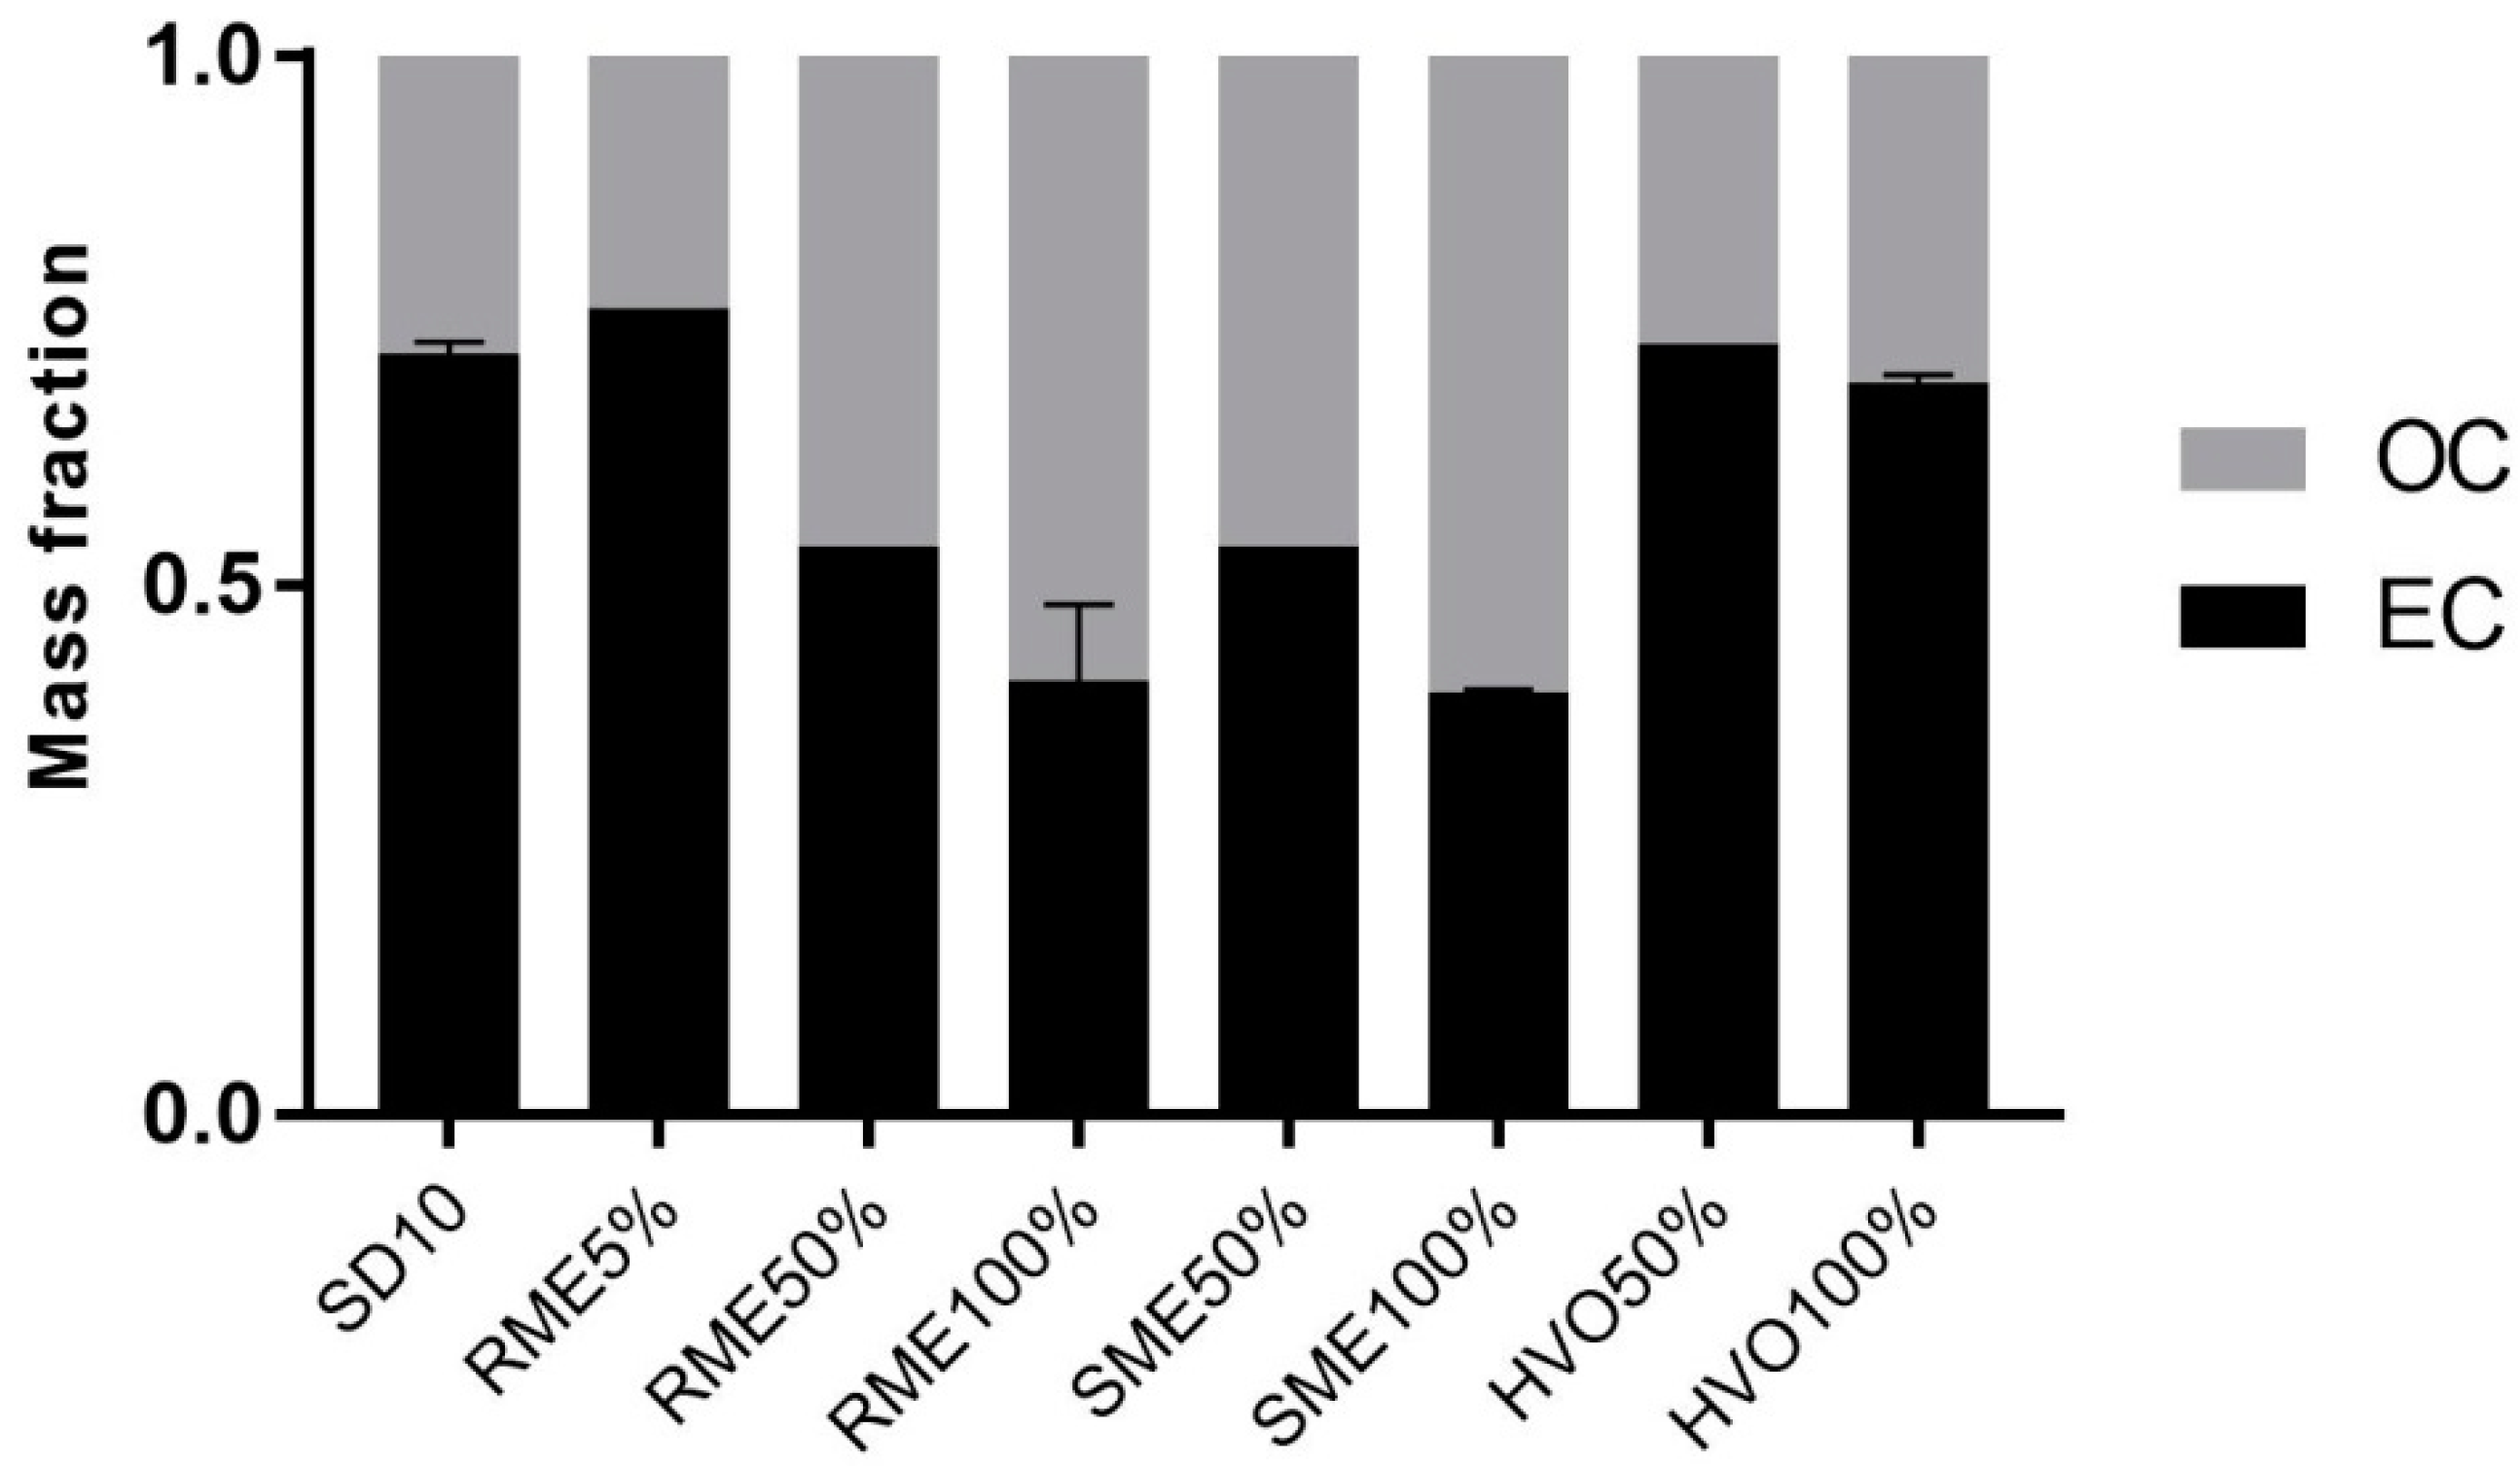
3.3.1. Carbon Fractionation and Metals
3.3.2. PAH and Oxy-PAH
3.4. Cytotoxicity
3.5. ROS Production
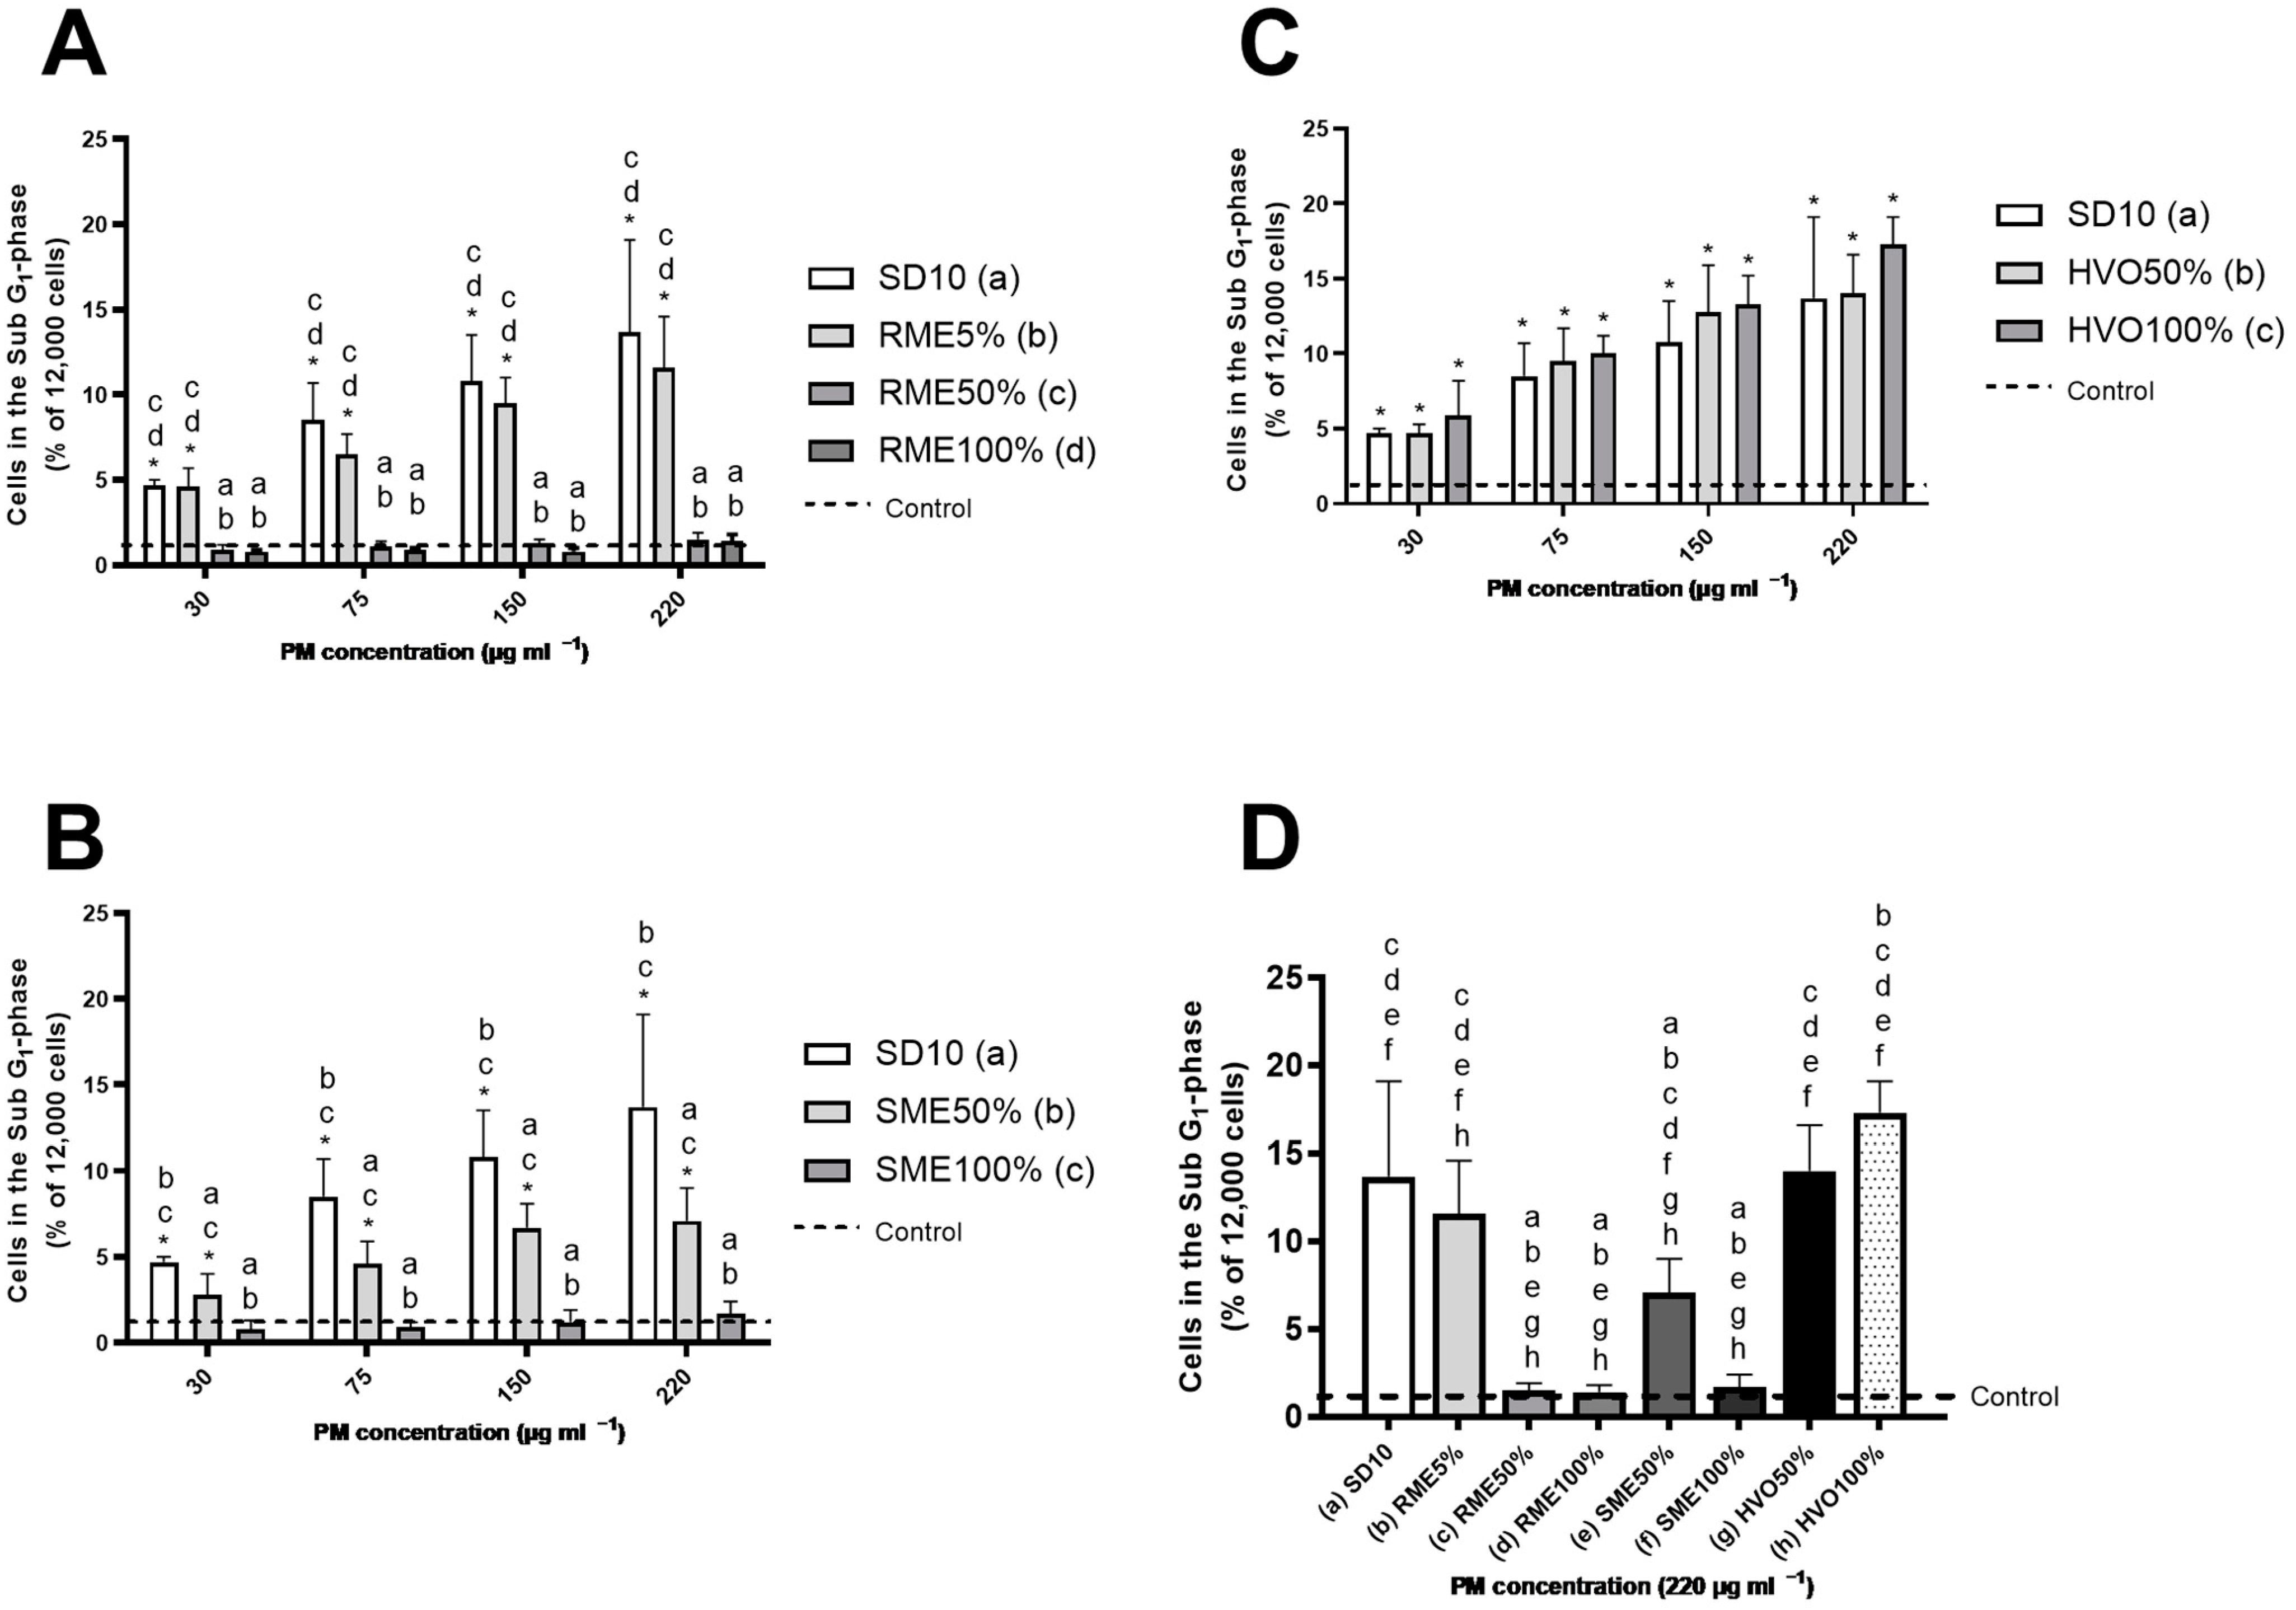
3.6. Genotoxicity
3.7. Inflammation
3.8. Methodological Considerations
4. Summary
5. Conclusions
Supplementary Materials
Author Contributions
Funding
Institutional Review Board Statement
Informed Consent Statement
Data Availability Statement
Acknowledgments
Conflicts of Interest
References
- IPCC. Contribution of Working Groups I, II and III to the Sixth Assessment Report of the Intergovernmental Panel on Climate Change; Core Writing Team, Lee, H., Romero, J., Eds.; Climate Change 2023: Synthesis Report; IPCC: Geneva, Switzerland, 2023. [Google Scholar]
- Malik, K.; Capareda, S.C.; Kamboj, B.R.; Malik, S.; Singh, K.; Arya, S.; Bishnoi, D.K. Biofuels production: A review on sustainable alternatives to traditional fuels and energy sources. Fuels 2024, 5, 157–175. [Google Scholar] [CrossRef]
- Bessagnet, B.; Allemand, N.; Putaud, J.-P.; Couvidat, F.; André, J.-M.; Simpson, D.; Pisoni, E.; Murphy, B.N.; Thunis, P. Emissions of Carbonaceous Particulate Matter and Ultrafine Particles from Vehicles—A Scientific Review in a Cross-Cutting Context of Air Pollution and Climate Change. Appl. Sci. 2022, 12, 3623. [Google Scholar] [CrossRef] [PubMed]
- Guo, C.; Lv, S.; Liu, Y.; Li, Y. Biomarkers for the adverse effects on respiratory system health associated with atmospheric particulate matter exposure. J. Hazard. Mater. 2022, 421, 126760. [Google Scholar] [CrossRef] [PubMed]
- Long, E.; Carlsten, C. Controlled human exposure to diesel exhaust: Results illuminate health effects of traffic-related air pollution and inform future directions. Part. Fibre Toxicol. 2022, 19, 11. [Google Scholar] [CrossRef]
- Holme, J.A.; Vondráček, J.; Machala, M.; Lagadic-Gossmann, D.; Vogel, C.F.A.; Le Ferrec, E.; Sparfel, L.; Øvrevik, J. Lung cancer associated with combustion particles and fine particulate matter (PM2.5)-The roles of polycyclic aromatic hydrocarbons (PAHs) and the aryl hydrocarbon receptor (AhR). Biochem. Pharmacol. 2023, 216, 115801. [Google Scholar] [CrossRef]
- Dummer, T.J.B.; Yu, X.; Cui, Y.; Nauta, L.; Saint-Jacques, N.; Sweeney Magee, M.; Rainham, D.G.C. Traffic-Related Air Pollution and Risk of Lung, Breast, and Urinary Tract Cancer in Halifax, Nova Scotia. J. Occup. Environ. Med. 2023, 65, e485–e490. [Google Scholar] [CrossRef]
- Calderón-Garcidueñas, L.; Ayala, A. Air Pollution, Ultrafine Particles, and Your Brain: Are Combustion Nanoparticle Emissions and Engineered Nanoparticles Causing Preventable Fatal Neurodegenerative Diseases and Common Neuropsychiatric Outcomes? Environ. Sci. Technol. 2022, 56, 6847–6856. [Google Scholar] [CrossRef] [PubMed]
- Koul, R.; Kumar, N.; Singh, R.C. A review on the production and physicochemical properties of renewable diesel and its comparison with biodiesel. Energy Sources Part A 2019, 43, 2235–2255. [Google Scholar] [CrossRef]
- Chuah, L.F.; Bokhari, A.; Asif, S.; Klemeš, J.J.; Dailin, D.J.; Enshasy, H.E.; Yusof, A.H.M. A Review of Performance and Emission Characteristic of Engine Diesel Fuelled by Biodiesel. Chem. Eng. Trans. 2022, 94, 1099–1104. [Google Scholar]
- Aljaafari, A.; Fattah, I.M.R.; Jahirul, M.I.; Gu, Y.; Mahlia, T.M.I.; Islam, M.A.; Islam, M.S. Biodiesel Emissions: A State-of-the-Art Review on Health and Environmental Impacts. Energies 2022, 15, 6854. [Google Scholar] [CrossRef]
- Omidvarborna, H.; Kumar, A.; Kim, D.S. Variation of diesel soot characteristics by different types and blends of biodiesel in a laboratory combustion chamber. Sci. Total Environ. 2016, 544, 450–459. [Google Scholar] [CrossRef] [PubMed]
- Prokopowicz, A.; Zaciera, M.; Sobczak, A.; Bielaczyc, P.; Woodburn, J. The effects of neat biodiesel and biodiesel and HVO blends in diesel fuel on exhaust emissions from a light duty vehicle with a diesel engine. Environ. Sci. Technol. 2015, 49, 7473–7482. [Google Scholar] [CrossRef] [PubMed]
- Krais, A.M.; Essig, J.Y.; Gren, L.; Vogs, C.; Assarsson, E.; Dierschke, K.; Nielsen, J.; Strandberg, B.; Pagels, J.; Broberg, K.; et al. Biomarkers after controlled inhalation exposure to exhaust from hydrogenated vegetable Oil (HVO). Int. J. Environ. Res. Public Health 2021, 18, 6492. [Google Scholar] [CrossRef]
- Palani, Y.; Devarajan, C.; Manickam, D.; Thanikodi, S. Performance and emission characteristics of biodiesel-blend in diesel engine: A review. Environ. Eng. Res. 2022, 27, 200338. [Google Scholar] [CrossRef]
- Wei, J.; Wang, Y. Effects of biodiesels on the physicochemical properties and oxidative reactivity of diesel particulates: A review. Sci. Total Environ. 2021, 788, 147753. [Google Scholar] [CrossRef] [PubMed]
- Godri Pollitt, K.J.; Chhan, D.; Rais, K.; Pan, K.; Wallace, J.S. Biodiesel fuels: A greener diesel? A review from a health perspective. Sci. Total Environ. 2019, 688, 1036–1055. [Google Scholar] [CrossRef]
- Southern, D.; Hellier, P.; Talibi, M.; Leonard, M.O.; Ladommatos, N. Re-assessing the toxicity of particles from biodiesel combustion: A quantitative analysis of in vitro studies. Atmos. Environ. 2021, 261, 118570. [Google Scholar] [CrossRef]
- Landwehr, K.R.; Hillas, J.; Mead-Hunter, R.; O’Leary, R.A.; Kicic, A.; Mullins, B.J.; Larcombe, A.N.; AusREC; WAERP. Soy biodiesel exhaust is more toxic than mineral diesel exhaust in primary human airway epithelial cells. Environ. Sci. Technol. 2019, 53, 11437–11446. [Google Scholar] [CrossRef]
- Jalava, P.I.; Aakko-Saksa, P.; Murtonen, T.; Happo, M.S.; Markkanen, A.; Yli-Pirilä, P.; Hakulinen, P.; Hillamo, R.; Mäki-Paakkanen, J.; Salonen, R.O.; et al. Toxicological properties of emission particles from heavy duty engines powered by conventional and bio-based diesel fuels and compressed natural gas. Part. Fibre Toxicol. 2012, 9, 37. [Google Scholar] [CrossRef]
- Shvedova, A.A.; Yanamala, N.; Murray, A.R.; Kisin, E.R.; Khaliullin, T.; Hatfield, M.K.; Tkach, A.V.; Krantz, Q.T.; Nash, D.; King, C.; et al. Oxidative stress, inflammatory biomarkers, and toxicity in mouse lung and liver after inhalation exposure to 100% biodiesel or petroleum diesel emissions. J. Toxicol. Environ. Health A 2013, 76, 907–921. [Google Scholar] [CrossRef]
- Bhavaraju, L.; Shannahan, J.; William, A.; McCormick, R.; McGee, J.; Kodavanti, U.; Madden, M. Diesel and biodiesel exhaust particle effects on rat alveolar macrophages with in vitro exposure. Chemosphere 2014, 104, 126–133. [Google Scholar] [CrossRef] [PubMed]
- Scholten, R.H.; Essig, Y.J.; Roursgaard, M.; Jensen, A.; Krais, A.M.; Gren, L.; Dierschke, K.; Gudmundsson, A.; Wierzbicka, A.; Møller, P. Inhalation of hydrogenated vegetable oil combustion exhaust and genotoxicity responses in humans. Arch. Toxicol. 2021, 95, 3407–3416. [Google Scholar] [CrossRef] [PubMed]
- Unosson, J.; Kabéle, M.; Boman, C.; Nyström, R.; Sadiktsis, I.; Westerholm, R.; Mudway, I.S.; Purdie, E.; Raftis, J.; Miller, M.R.; et al. Acute cardiovascular effects of controlled exposure to dilute Petrodiesel and biodiesel exhaust in healthy volunteers: A crossover study. Part. Fibre Toxicol. 2021, 18, 22. [Google Scholar] [CrossRef] [PubMed]
- Rahman, M.; Upadhyay, S.; Ganguly, K.; Introna, M.; Ji, J.; Boman, C.; Muala, A.; Blomberg, A.; Sandström, T.; Palmberg, L. Comparable Response Following Exposure to Biodiesel and Diesel Exhaust Particles in Advanced Multicellular Human Lung Models. Toxics 2023, 11, 532. [Google Scholar] [CrossRef] [PubMed]
- Karthikeyan, S.; Breznan, D.; Thomson, E.M.; Blais, E.; Vincent, R.; Kumarathasan, P. Concordance between In Vitro and In Vivo Relative Toxic Potencies of Diesel Exhaust Particles from Different Biodiesel Blends. Toxics 2024, 12, 290. [Google Scholar] [CrossRef] [PubMed]
- Alemayehu, Y.A.; Asfaw, S.L.; Terfie, T.A. Exposure to urban particulate matter and its association with human health risks. Environ. Sci. Pollut. Res. Int. 2020, 27, 27491–27506. [Google Scholar] [CrossRef]
- Uski, O.J.; Rankin, G.D.; Wingfors, H.; Magnusson, R.; Boman, C.; Muala, A.; Blomberg, A.; Bosson, J.; Sandström, T. In vitro toxicity evaluation in A549 cells of diesel particulate matter from two different particle sampling systems and several resuspension media. J. Appl. Toxicol. 2024, 44, 1269–1278. [Google Scholar] [CrossRef] [PubMed]
- Setiyo, M.; Yuvenda, D.; Samuel, O. The concise latest report on the advantages and disadvantages of pure biodiesel (B100) on engine performance: Literature review and bibliometric analysis. Indones. J. Sci. Technol. 2021, 6, 469–490. [Google Scholar] [CrossRef]
- Ogunkunle, O.; Ahmed, N.A. A review of global current scenario of biodiesel adoption and combustion in vehicular diesel engines. Energy Rep. 2019, 5, 1560–1579. [Google Scholar] [CrossRef]
- Barath, S.; Mills, N.L.; Lundbäck, M.; Törnqvist, H.; Lucking, A.J.; Langrish, J.P.; Söderberg, S.; Boman, C.; Westerholm, R.; Löndahl, J.; et al. Impaired vascular function after exposure to diesel exhaust generated at urban transient running conditions. Part. Fibre Toxicol. 2010, 7, 19. [Google Scholar] [CrossRef]
- Nyström, R.; Sadiktsis, I.; Ahmed, T.M.; Westerholm, R.; Koegler, J.H.; Blomberg, A.; Sandström, T.; Boman, C. Physical and chemical properties of RME biodiesel exhaust particles without engine modifications. Fuel 2016, 186, 261–269. [Google Scholar] [CrossRef]
- Geller, M.D.; Biswas, S.; Fine, P.M.; Sioutas, C. A new compact aerosol concentrator for use in conjunction with low flow-rate continuous aerosol instrumentation. J. Aerosol Sci. 2005, 36, 1006–1022. [Google Scholar] [CrossRef]
- Wang, D.; Pakbin, P.; Saffari, A.; Shafer, M.M.; Schauer, J.J.; Sioutas, C. Development and evaluation of a high-volume aerosol-into-liquid collector for fine and ultrafine particulate matter. Aerosol Sci. Technol. 2013, 47, 1226–1238. [Google Scholar] [CrossRef]
- Kim, S.; Jaques, P.A.; Chang, M.; Froines, J.R.; Sioutas, C. Versatile aerosol concentration enrichment system (VACES) for simultaneous in vivo and in vitro evaluation of toxic effects of ultrafine, fine and coarse ambient particles Part I: Development and laboratory characterization. J. Aerosol Sci. 2001, 32, 1281–1297. [Google Scholar] [CrossRef]
- Sioutas, C.; Kim, S.; Chang, M. Development and evaluation of a prototype ultrafine particle concentrator. J. Aerosol Sci. 1999, 30, 1001–1017. [Google Scholar] [CrossRef]
- Wingfors, H.; Hägglund, L.; Magnusson, R. Characterization of the size-distribution of aerosols and particle-bound content of oxygenated PAHs, PAHs, and n-alkanes in urban environments in Afghanistan. Atmos. Environ. 2011, 45, 4360–4369. [Google Scholar] [CrossRef]
- Turpin, B.J.; Saxena, P.; Andrews, A. Measuring and simulating particulate organics in the atmosphere: Problems and prospects. Atmos. Environ. 2000, 34, 2983–3013. [Google Scholar] [CrossRef]
- Cavalli, F.; Viana, M.; Yttri, K.E.; Genberg, J.; Putaud, J.P. Toward a standardised thermal-optical protocol for measuring atmospheric organic and elemental carbon: The EUSAAR protocol. Atmos. Meas. Tech. 2010, 3, 79–89. [Google Scholar] [CrossRef]
- Mosmann, T. Rapid colorimetric assay for cellular growth and survival: Application to proliferation and cytotoxicity assays. J. Immunol. Methods 1983, 65, 55–63. [Google Scholar] [CrossRef]
- Demirbas, A. Importance of biodiesel as transportation fuel. Energy Policy 2007, 35, 4661–4670. [Google Scholar] [CrossRef]
- Murtonen, T.; Aakko-Saksa, P.; Kuronen, M.; Mikkonen, S.; Lehtoranta, K. Emissions with heavy-duty diesel engines and vehicles using FAME, HVO and GTL fuels with and without DOC+POC after treatment. SAE Int. J. Fuels Lubr. 2010, 2, 147–166. [Google Scholar] [CrossRef]
- Agarwal, A.K.; Krishnamoorthi, M. Review of morphological and chemical characteristics of particulates from compression ignition engines. Int. J. Engine Res. 2023, 24, 2807–2865. [Google Scholar] [CrossRef]
- Gali, N.K.; Yang, F.; Cheung, C.S.; Ning, Z. A comparative analysis of chemical components and cell toxicity properties of solid and semi-volatile PM from diesel and biodiesel blend. J. Aerosol Sci. 2017, 111, 51–64. [Google Scholar] [CrossRef]
- Zhang, H.; He, J.; Li, S.; Iojoiu, E.E.; Galvez, M.E.; Chen, Y. Effect of Biodiesel impurities (K, Na, P) on non-catalytic and catalytic activities of Diesel soot in model DPF regeneration conditions. Fuel Process. Technol. 2020, 199, 106293. [Google Scholar] [CrossRef]
- Bendtsen, K.M.; Gren, L.; Malmborg, V.B.; Shukla, P.C.; Tunér, M.; Essig, Y.; Krais, A.M.; Clausen, P.A.; Berthing, T.; Loeschner, K.; et al. Particle characterization and toxicity in C57BL/6 mice following instillation of five different diesel exhaust particles designed to differ in physicochemical properties. Part. Fibre Toxicol. 2020, 17, 38. [Google Scholar] [CrossRef] [PubMed]
- Karavalakis, G.M.; Robledo, T.; Miguel, A. A Review of Polycyclic Aromatic Hydrocarbon and Polycyclic Aromatic Hydrocarbon Derivative Emissions from Off-Road, Light-Duty, Heavy-Duty, and Stationary Sources. University of California, Riverside, and Bourns College of Engineering-Center for Environmental Research and Technology (CE-CERT). 2020. Available online: https://ww2.arb.ca.gov/sites/default/files/2020-08/PAH_White_Paper_ADA.pdf (accessed on 8 September 2024).
- Ratcliff, M.A.; Dane, A.; Williams, A.; Ireland, J.D.; Luecke, J.H.; McCormick, R.; Voorhees, K.J. Diesel particle filter and fuel effects on heavy-duty diesel engine emissions. Environ. Sci. Technol. 2010, 44, 8343–8349. [Google Scholar] [CrossRef]
- Wu, G.; Ge, J.C.; Choi, N.J. A Comprehensive Review of the Application Characteristics of Biodiesel Blends in Diesel Engines. Appl. Sci. 2020, 10, 8015. [Google Scholar] [CrossRef]
- Shah, S.D.; Ogunyoku, T.A.; Miller, J.W.; Cocker, D.R., 3rd. On-road emission rates of PAH and n-alkane compounds from heavy-duty diesel vehicles. Environ. Sci. Technol. 2005, 39, 5276–5284. [Google Scholar] [CrossRef]
- Borras, E.; Tortajada-Genaro, L.; Vazquez, M.; Zielinska, B. Polycyclic aromatic hydrocarbon exhaust emissions from different reformulated diesel fuels and engine operating conditions. Atmos. Environ. 2009, 43, 5944–5952. [Google Scholar] [CrossRef]
- Lea-Langton, A.; Li, H.; Andrews, G. Comparison of Particulate PAH Emissions for Diesel, Biodiesel and Cooking Oil Using a Heavy Duty DI Diesel Engine; SAE Technical Paper 2008-01-1811; SAE International: Warrendale, PA, USA, 2008. [Google Scholar] [CrossRef]
- Hoseini, S.S.; Najafi, G.; Ghobadian, B.; Mamat, R.; Sidik, N.A.C.; Azmi, W.H. The effect of combustion management on diesel engine emissions fueled with biodiesel-diesel blends. Renew. Sustain. Energy Rev. 2017, 73, 307–331. [Google Scholar] [CrossRef]
- Fiebig, M.; Wiartalla, A.; Holderbaum, B.; Kiesow, S. Particulate emissions from diesel engines: Correlation between engine technology and emissions. J. Occup. Med. Toxicol. 2014, 9, 6. [Google Scholar] [CrossRef] [PubMed]
- Vojtisek-Lom, M.; Pechout, M.; Dittrich, M.; Beránek, V.; Kotek, M.; Schwarz, J.; Vodička, P.; Milcová, A.; Rossnerová, A.; Ambrož, A.; et al. Polycyclic aromatic hydrocarbons (PAH) and their genotoxicity in exhaust emissions from a diesel engine during extended low-load operation on diesel and biodiesel fuels. Atmos. Environ. 2015, 109, 9–18. [Google Scholar] [CrossRef]
- Bünger, J.; Krahl, J.; Schröder, O.; Schmidt, L.; Westphal, G.A. Potential hazards associated with combustion of bio-derived versus petroleum-derived diesel fuel. Crit. Rev. Toxicol. 2012, 42, 732–750. [Google Scholar] [CrossRef] [PubMed]
- Martin, N.; Lombard, M.; Jensen, K.R.; Kelley, P.; Pratt, T.; Traviss, N. Effect of biodiesel fuel on “real-world”, nonroad heavy duty diesel engine particulate matter emissions, composition and cytotoxicity. Sci. Total Environ. 2017, 586, 409–418. [Google Scholar] [CrossRef]
- Kooter, I.M.; van Vught, M.A.T.M.; Jedynska, A.D.; Tromp, P.C.; Houtzager, M.M.G.; Verbeek, R.P.; Kadijk, G.; Mulderij, M.; Krul, C.A.M. Toxicological characterization of diesel engine emissions using biodiesel and a closed soot filter. Atmos. Environ. 2011, 45, 1574–1580. [Google Scholar] [CrossRef]
- Steiner, S.; Czerwinski, J.; Comte, P.; Popovicheva, O.; Kireeva, E.; Müller, L.; Heeb, N.; Mayer, A.; Fink, A.; Rothen-Rutishauser, B. Comparison of the toxicity of diesel exhaust produced by bio- and fossil diesel combustion in human lung cells in vitro. Atmos. Environ. 2013, 81, 380–388. [Google Scholar] [CrossRef]
- Liu, Y.Y.; Lin, T.C.; Wang, Y.J.; Ho, W.L. Carbonyl compounds and toxicity assessments of emissions from a diesel engine running on biodiesels. J. Air Waste Manag. 2009, 59, 163–171. [Google Scholar] [CrossRef]
- Darzynkiewicz, Z.; Bruno, S.; Del Bino, G.; Gorczyca, W.; Hotz, M.A.; Lassota, P.; Traganos, F. Features of apoptotic cells measured by flow cytometry. Cytometry 1992, 13, 795–808. [Google Scholar] [CrossRef]
- Lankoff, A.; Brzoska, K.; Czarnocka, J.; Kowalska, M.; Lisowska, H.; Mruk, R.; Øvrevik, J.; Wegierek-Ciuk, A.; Zuberek, M.; Kruszewski, M. A comparative analysis of in vitro toxicity of diesel exhaust particles from combustion of 1st- and 2nd-generation biodiesel fuels in relation to their physicochemical properties-the FuelHealth project. Environ. Sci. Pollut. Res. Int. 2017, 24, 19357–19374. [Google Scholar] [CrossRef]
- Malorni, L.; Guida, V.; Sirignano, M.; Genovese, G.; Petrarca, C.; Pedata, P. Exposure to sub-10nm particles emitted from a biodiesel-fueled diesel engine: In vitro toxicity and inflammatory potential. Toxicol. Lett. 2017, 270, 51–61. [Google Scholar] [CrossRef]
- Jalava, P.I.; Tapanainen, M.; Kuuspalo, K.; Markkanen, A.; Hakulinen, P.; Happo, M.S.; Pennanen, A.S.; Ihalainen, M.; Yli-Pirilä, P.; Makkonen, U.; et al. Toxicological effects of emission particles from fossil- and biodiesel-fueled diesel engine with and without DOC/POC catalytic converter. Inhal. Toxicol. 2010, 22 (Suppl. S2), 48–58. [Google Scholar] [CrossRef] [PubMed]
- Libalova, H.; Rossner, P.; Vrbova, K.; Brzicova, T.; Sikorova, J.; Vojtisek-Lom, M.; Beranek, V.; Klema, J.; Ciganek, M.; Neca, J.; et al. Comparative Analysis of Toxic Responses of Organic Extracts from Diesel and Selected Alternative Fuels Engine Emissions in Human Lung BEAS-2B Cells. Int. J. Mol. Sci. 2016, 17, 1833. [Google Scholar] [CrossRef] [PubMed]
- Liu, Y.; Chan, C.K. The oxidative potential of fresh and aged elemental carbon-containing airborne particles: A review. Environ. Sci. Process. Impacts 2022, 24, 525–546. [Google Scholar] [CrossRef] [PubMed]
- Li, R.; Han, Y.; Wang, L.; Shang, Y.; Chen, Y. Differences in oxidative potential of black carbon from three combustion emission sources in China. J. Environ. Manag. 2019, 240, 57–65. [Google Scholar] [CrossRef]
- Bates, J.T.; Fang, T.; Verma, V.; Zeng, L.; Weber, R.J.; Tolbert, P.E.; Abrams, J.Y.; Sarnat, S.E.; Klein, M.; Mulholland, J.A.; et al. Review of Acellular Assays of Ambient Particulate Matter Oxidative Potential: Methods and Relationships with Composition, Sources, and Health Effects. Environ. Sci. Technol. 2019, 53, 4003–4019. [Google Scholar] [CrossRef]
- Kowalska, M.; Wegierek-Ciuk, A.; Brzoska, K.; Wojewodzka, M.; Meczynska-Wielgosz, S.; Gromadzka-Ostrowska, J.; Mruk, R.; Øvrevik, J.; Kruszewski, M.; Lankoff, A. Genotoxic potential of diesel exhaust particles from the combustion of first- and second-generation biodiesel fuels-the FuelHealth project. Environ. Sci. Pollut. Res. Int. 2017, 24, 24223–24234. [Google Scholar] [CrossRef]
- Magnusson, P.; Oczkowski, M.; Øvrevik, J.; Gajewska, M.; Wilczak, J.; Biedrzycki, J.; Dziendzikowska, K.; Kamola, D.; Królikowski, T.; Kruszewski, M.; et al. No adverse lung effects of 7- and 28-day inhalation exposure of rats to emissions from petrodiesel fuel containing 20% rapeseed methyl esters (B20) with and without particulate filter-the FuelHealth project. Inhal. Toxicol. 2017, 29, 206–218. [Google Scholar] [CrossRef]
- Weatherly, L.M.; Shane, H.L.; Baur, R.; Lukomska, E.; McKinney, W.; Roberts, J.R.; Fedan, J.S.; Anderson, S.E. Effects of inhaled tier-2 diesel engine exhaust on immunotoxicity in a rat model: A hazard identification study. Part II. Immunotoxicology. Toxicol. Rep. 2024, 12, 135–147. [Google Scholar] [CrossRef] [PubMed]
- Hemmingsen, J.G.; Møller, P.; Nøjgaard, J.K.; Roursgaard, M.; Loft, S. Oxidative stress, genotoxicity, and vascular cell adhesion molecule expression in cells exposed to particulate matter from combustion of conventional diesel and methyl ester biodiesel blends. Environ. Sci. Technol. 2011, 45, 8545–8551. [Google Scholar] [CrossRef]
- Gerlofs-Nijland, M.E.; Totlandsdal, A.I.; Tzamkiozis, T.; Leseman, D.L.; Samaras, Z.; Låg, M.; Schwarze, P.; Ntziachristos, L.; Cassee, F.R. Cell toxicity and oxidative potential of engine exhaust particles: Impact of using particulate filter or biodiesel fuel blend. Environ. Sci. Technol. 2013, 47, 5931–5938. [Google Scholar] [CrossRef]
- Swanson, K.J.; Funk, W.E.; Pleil, J.D. Release of the pro-inflammatory markers by BEAS-2B cells following in vitro exposure to biodiesel extracts. Open Tox J. 2009, 3, 8–15. [Google Scholar] [CrossRef]
- Fukagawa, N.K.; Li, M.; Poynter, M.E.; Palmer, B.C.; Parker, E.; Kasumba, J.; Holmén, B.A. Soy biodiesel and petrodiesel emissions differ in size, chemical composition and stimulation of inflammatory responses in cells and animals. Environ. Sci. Technol. 2013, 47, 12496–12504. [Google Scholar] [CrossRef] [PubMed]


| Fuel | SD10 | RME5% | RME50% | RME100% | SME50% | SME100% | HVO50% | HVO100% | ||||
|---|---|---|---|---|---|---|---|---|---|---|---|---|
| n | 3 | R | 1 | 1 | 2 | R | 1 | 2 | R | 1 | 2 | R |
| PAHs | ||||||||||||
| fluorene | 1.3 | 6 | 1.5 | 1.3 | 1 | 16 | 1.6 | 1.2 | 5 | 1.5 | 1.4 | 41 |
| phenanthrene | 41 | 7 | 47 | 17.6 | 7.5 | 9 | 33 | 13 | 5 | 39 | 26 | 6 |
| anthracene | 8.4 | 12 | 9.1 | 3.3 | 1.4 | 7 | 7.1 | 2.4 | 10 | 7.4 | 4 | 5 |
| 3-Methylphenanthrene | 13 | 15 | 12 | 5.3 | 2.5 | 9 | 6.2 | 3.8 | 3 | 9.2 | 5.8 | 6 |
| 2-Methylphenanthrene | 16 | 15 | 14 | 7.5 | 3.8 | 9 | 8.2 | 5 | 5 | 11 | 8.1 | 5 |
| 2-Methylanthracene | 5.2 | 13 | 5 | 2.1 | 0.5 | 52 | 0.3 | 0.2 | 47 | 1.2 | 2.4 | 9 |
| 9-Methylphenanthrene | 20 | 14 | 17 | 7.6 | 2.7 | 36 | 7 | 2.1 | 1 | 12 | 8.3 | 9 |
| 1-methylphenanthrene | 16 | 14 | 16 | 8.6 | 3.4 | 30 | 9 | 2.4 | 1 | 12 | 8.4 | 7 |
| 1,7-Dimethylphenanthrene | 8.4 | 10 | 11 | 5.6 | 2.6 | 31 | 4.8 | 2.6 | 10 | 6.6 | 4 | 6 |
| Σ Dimethyl-178 a | 77 | 13 | 66 | 33 | 13 | 28 | 33 | 15 | 2 | 48 | 31 | 5 |
| fluoranthene | 27 | 0.2 | 30 | 20 | 7.8 | 25 | 16 | 6.4 | 3 | 20 | 13 | 1 |
| pyrene | 31 | 1 | 31 | 22 | 8.6 | 31 | 19 | 6.7 | 0.2 | 21 | 14 | 2 |
| 3-Methylfluoroanthene b | 5.5 | 1 | 6.0 | 4.5 | 2.8 | 17 | 4.4 | 3.1 | 3 | 3.5 | 2.3 | 2 |
| Retene | 5.3 | 8 | 5.5 | 3 | 1.4 | 37 | 2.7 | 1.3 | 2 | 3.2 | 2.2 | 4 |
| 4-Methylpyrene | 4.5 | 1 | 4.3 | 2.8 | 1.5 | 26 | 2.9 | 1.7 | 9 | 2.7 | 1.4 | 1 |
| 1-Methylpyrene | 2.2 | 4 | 2.3 | 1.8 | 1 | 31 | 1.8 | 1.1 | 5 | 1.4 | 0.6 | 3 |
| benz(a)anthracene | 1.2 | 6 | 1.1 | 1.4 | 1 | 20 | 1.3 | 1.2 | 0.5 | 0.6 | 0.4 | 9 |
| triphenylene + chrysene | 3.9 | 4 | 3.8 | 4 | 3.6 | 8 | 4.1 | 3.8 | 2 | 2.4 | 1.6 | 4 |
| 3-Methylchrysene b | 0.8 | 8 | 0.8 | 0.8 | 0.6 | 5 | 0.8 | 0.7 | 3 | 0.5 | 0.4 | 11 |
| 6-Methylchrysene | 0.3 | 10 | 0.3 | 0.4 | 0.3 | 1 | 0.3 | 0.4 | 9 | 0.2 | 0.1 | 7 |
| Σ Methyl-228 c | 2 | 7 | 2 | 2.2 | 2.1 | 1 | 2 | 2.2 | 1 | 1.3 | 1.1 | 6 |
| benzo(b + j)fluoranthene | 1.3 | 3 | 1.3 | 1.3 | 1.5 | 21 | 1.4 | 1.6 | 1 | 0.7 | 0.4 | 1 |
| benzo(k)fluoranthene | 0.3 | 25 | 0.2 | 0.2 | 0.3 | 8 | 0.4 | 0.3 | 16 | 0.1 | 0.1 | 1 |
| benzo(e)pyrene | 1.2 | 7 | 1.3 | 1.2 | 1.3 | 18 | 1.3 | 1.5 | 6 | 0.6 | 0.5 | 4 |
| benzo(a)pyrene | 0.5 | 9 | 0.4 | 0.5 | 0.5 | 29 | 0.3 | 0.5 | 16 | 0.2 | 0.1 | 2 |
| perylene | 0.05 | 19 | 0.06 | 0.03 | 0.04 | 2 | 0.06 | 0.1 | 10 | 0.03 | 0.01 | 17 |
| indeno(1,2,3-cd)pyrene | 0.5 | 13 | 0.6 | 0.3 | 0.4 | 12 | 0.4 | 0.4 | 1 | 0.4 | 0.4 | 48 |
| dibenz(a, h + a, c)anthracene | 0.1 | 28 | 0.1 | 0.1 | 0.1 | 5 | 0.1 | 0.1 | 9 | 0.05 | 0.1 | 24 |
| benzo(ghi)perylene | 0.7 | 16 | 0.9 | 0.4 | 0.7 | 12 | 0.5 | 0.5 | 12 | 0.2 | 0.2 | 5 |
| Sum of 44 PAHs | 216 | 7 | 223 | 124 | 58 | 18 | 135 | 64 | 0.3 | 158 | 107 | 5 |
| Sum of genotoxic PAHs | 61 | 5 | 66 | 42 | 22 | 19 | 42 | 21 | 1 | 48 | 30 | 4 |
| Sum of heavy PAHs | 30 | 3 | 31 | 25 | 19 | 15 | 25 | 20 | 0.5 | 18 | 12 | 4 |
| Fuels | SD10 | RME5% | RME50% | RME100% | SME50% | SME100% | HVO50% | HVO100% | ||||
|---|---|---|---|---|---|---|---|---|---|---|---|---|
| n | 3 | R | 1 | 1 | 2 | R | 1 | 2 | R | 1 | 2 | R |
| Ketones | ||||||||||||
| 9H-fluoren-9-one | 19 | 8 | 22 | 7.5 | 4.2 | 15 | 18 | 7.6 | 7 | 23 | 16 | 4 |
| 1H-phenalene-one | 59 | 1 | 43 | 26 | 16 | 25 | 30 | 16 | 4 | 40 | 31 | 7 |
| 10H-anthracene-9-one | 3 | 20 | 1.7 | 1.2 | <0.4 | na | na | 0.6 | 1.2 | 9 | ||
| 4H-cyclopenta[def]phenanthren-4-one | 10 | 6 | 12 | 9.7 | 7.4 | 4 | 12 | 10 | 4 | 12 | 8.2 | 4 |
| 11H-benzo[a]fluorene-11-one | 4.4 | 9 | 3.6 | 4.6 | 4.1 | 9 | 4.6 | 5.4 | 3 | 3.4 | 2.2 | 8 |
| 7H-benzo[de]anthracene-7-one | 4.5 | 5 | 3.7 | 4.0 | 4.2 | 10 | 4.4 | 5.0 | 9 | 3.4 | 1.9 | 13 |
| 6H-benzo[cd]pyrene-6-one | 1.7 | 11 | 1.7 | 1.5 | 1.9 | 30 | 1.6 | 2.0 | 2 | 1.0 | 0.8 | 10 |
| Quinones | ||||||||||||
| anthracene-9,10-dione | 33 | 3 | 28 | 14 | 6.8 | 30 | 17 | 5.1 | 1 | 22 | 20 | 5 |
| 2-methyl-anthracene-9,10-dione | 9.3 | 6 | 7.0 | 4.1 | na | na | na | 2.6 | 3.6 | 1 | ||
| 2-ethyl-anthracene-9,10-dione | 0.5 | 18 | 0.4 | 0.4 | 0.5 | 9 | 0.3 | 0.4 | 14 | 0.3 | 0.4 | 2 |
| benz[a]anthracene-7,12-dione | 1.2 | 15 | 0.8 | 1.3 | 1.0 | 23 | 0.9 | 1.1 | 8 | 0.8 | 0.7 | 35 |
| naphthacene-5,12-dione | 0.3 | 20 | 0.2 | 0.3 | 0.2 | 28 | 0.1 | 0.5 | 10 | 0.2 | 0.1 | 23 |
| Sum of 12 Oxy-PAHs | 146 | 2 | 124 | 74 | 46 | 16 | 89 | 53 | 3 | 110 | 86 | 6 |
Disclaimer/Publisher’s Note: The statements, opinions and data contained in all publications are solely those of the individual author(s) and contributor(s) and not of MDPI and/or the editor(s). MDPI and/or the editor(s) disclaim responsibility for any injury to people or property resulting from any ideas, methods, instructions or products referred to in the content. |
© 2024 by the authors. Licensee MDPI, Basel, Switzerland. This article is an open access article distributed under the terms and conditions of the Creative Commons Attribution (CC BY) license (https://creativecommons.org/licenses/by/4.0/).
Share and Cite
Uski, O.J.; Rankin, G.; Wingfors, H.; Magnusson, R.; Boman, C.; Lindgren, R.; Muala, A.; Blomberg, A.; Bosson, J.A.; Sandström, T. The Toxic Effects of Petroleum Diesel, Biodiesel, and Renewable Diesel Exhaust Particles on Human Alveolar Epithelial Cells. J. Xenobiot. 2024, 14, 1432-1449. https://doi.org/10.3390/jox14040080
Uski OJ, Rankin G, Wingfors H, Magnusson R, Boman C, Lindgren R, Muala A, Blomberg A, Bosson JA, Sandström T. The Toxic Effects of Petroleum Diesel, Biodiesel, and Renewable Diesel Exhaust Particles on Human Alveolar Epithelial Cells. Journal of Xenobiotics. 2024; 14(4):1432-1449. https://doi.org/10.3390/jox14040080
Chicago/Turabian StyleUski, Oskari J., Gregory Rankin, Håkan Wingfors, Roger Magnusson, Christoffer Boman, Robert Lindgren, Ala Muala, Anders Blomberg, Jenny A. Bosson, and Thomas Sandström. 2024. "The Toxic Effects of Petroleum Diesel, Biodiesel, and Renewable Diesel Exhaust Particles on Human Alveolar Epithelial Cells" Journal of Xenobiotics 14, no. 4: 1432-1449. https://doi.org/10.3390/jox14040080
APA StyleUski, O. J., Rankin, G., Wingfors, H., Magnusson, R., Boman, C., Lindgren, R., Muala, A., Blomberg, A., Bosson, J. A., & Sandström, T. (2024). The Toxic Effects of Petroleum Diesel, Biodiesel, and Renewable Diesel Exhaust Particles on Human Alveolar Epithelial Cells. Journal of Xenobiotics, 14(4), 1432-1449. https://doi.org/10.3390/jox14040080