Article

Wheat Yield and Protein Estimation with Handheld and Unmanned Aerial Vehicle-Mounted Sensors

by
Olga S. Walsh
1,*,
Juliet M. Marshall
2,
Eva Nambi
1,
Chad A. Jackson
3,
Emmanuella Owusu Ansah
1,
Ritika Lamichhane
1,
Jordan McClintick-Chess
4 and
Francisco Bautista
1
1
Parma R&E Center, University of Idaho, Parma, ID 83660, USA
2
Idaho Falls R&E Center, University of Idaho, Idaho Falls, ID 83402, USA
3
Aberdeen R&E Center, University of Idaho, Aberdeen, ID 83210, USA
4
AG Idaho Consulting LLC, Wilder, ID 83676, USA
*
Author to whom correspondence should be addressed.
Agronomy 2023, 13(1), 207; https://doi.org/10.3390/agronomy13010207
Submission received: 11 November 2022 / Revised: 29 December 2022 / Accepted: 2 January 2023 / Published: 10 January 2023

Abstract

:
Accurate sensor-based prediction of crop yield and grain quality in-season would enable growers to adjust nitrogen (N) fertilizer management for optimized production. This study assessed the feasibility (and compared the accuracy) of wheat (Triticum aestivum L.) yield, grain N uptake, and protein content prediction with in-season crop spectral reflectance measurements (Normalized Difference Vegetative Index, NDVI) obtained with a handheld GreenSeeker (GS) sensor and an Unmanned Aerial Vehicle (UAV)-mounted sensor. A strong positive correlation was observed between GS NDVI and UAV NDVI at Feekes 5 (R2 = 0.78) and Feekes 10 (R2 = 0.70). At Feekes 5, GS NDVI and UAV NDVI explained 42% and 43% of wheat yield, respectively. The correlation was weaker at Feekes 10 (R2 of 0.34 and 0.25 for GS NDVI and UAV NDVI, respectively). The accuracy of wheat grain N uptake prediction was comparable to that of yield: the R2 values for GS NDVI and UAV NDVI were 0.53 and 0.37 at Feekes 5 and 0.13 and 0.20 at Feekes 10. We found that neither GS NDVI nor UAV NDVI in-season data were useful in prediction of wheat grain protein content. In conclusion, wheat yield and grain N uptake can be estimated at Feekes 5 using either handheld or aerial based NDVI with comparable accuracy.

1. Introduction

Making N recommendations is difficult due to the tremendous variability in available soil N and crop yields across time and space. Nitrogen can be a yield-limiting nutrient in cropping systems; if used appropriately, N fertilization provides one of the greatest returns on investment in terms of crop yield and quality [1]. Walsh et al. [2] highlighted the importance of updating N fertilizer guidelines based on environmental conditions and modern wheat varieties. Data collected in multiple field trials across Idaho indicated that current University of Idaho N fertilizer recommendations could be adjusted (decreased) without negatively impacting wheat yield or quality. Decreasing N fertilizer inputs without yield/quality penalties would translate into considerable economic, agronomic, and environmental benefits to Idaho growers and agricultural communities.
In recent decades, increasing N use efficiency (NUE) using crop sensors has gained attention, with the focus on optimizing N input while simultaneously maintaining crop yields [3]. Precision agriculture (PA) is a concept that involves observing, measuring, and responding to spatial and temporal variability. The PA technologies toolbox includes satellite imagery, crop sensors, and UAVs. The PA technologies enable growers to recognize and measure variations present in the fields and to manage fertilizer inputs with a much finer degree of precision than ever before possible [4].
Precision crop sensors such as GS (Trimble Navigation Ltd., Sunnyvale, CA, USA) have been successfully used to accurately estimate crop yield potential and the crop’s prospective responsiveness to N mid-season. This methodology enables producers to generate fertilizer N recommendations based on crop need for N. Although [2] showed that wheat grain yield potential was accurately estimated mid-season using NDVI-based crop sensors in Idaho, limited work has been conducted on developing sensor-based N recommendations for Idaho wheat varieties. Further, to date, no work has been undertaken to compare the handheld sensors and a sensor-equipped UAV for accuracy of wheat yield, grain N uptake, and protein content estimation.
Precision agriculture represents one of the most extensive markets for UAVs. The UAV is an uncrewed aircraft which is controlled remotely by an operator with the ability to carry payloads such as cameras to acquire aerial images [5]. In recent years, UAVs have become increasingly widespread for various agricultural applications. UAVs are remote sensing systems which enable us to capture crop reflectance in the VIS–NIR region of the spectrum to access crop development and assess N concentration. High spatial and temporal resolution images acquired with UAVs are valuable for many agriculture-related purposes. Mounted on the UAVs, sensors, and cameras enable time-efficient examination of large fields to evaluate crop parameters contributing to yield and quality in various growing environments. UAVS are greatly advantageous in terms of low cost, high flexibility for flight planning and data acquisition scheduling, and operating below cloud cover, making them a useful tool to study crop biophysical parameters [6].
Canopy vegetation indices enable us to accurately estimate variability in grain yield potential before harvest at a large spatial scale. The UAV-based imagery was found useful in the in-season estimation of crop yield [7]. A study by Hassan et al. [8] reported that an early-season prediction of wheat yield could be accomplished through the assessment of yield-related secondary traits measured with UAV-mounted sensors. The regression analysis between UAV NDVI and wheat grain yield at Feekes 11 (grain filling stage) had higher R2 values. On the other hand, [9] reported a higher predictive power for wheat yield (R2 = 0.92) UAV-based NDVI at flowering (Feekes 10); the correlation decreased (R2 = 0.35) at maturity. Zeng et al. [10] conducted a study to predict wheat yields using various UAV-based indices. They reported that vegetative indices had a high correlation with wheat grain yield during stem elongation, flowering, and early maturity growth stages (R2 = 0.76 − 0.93), with the flowering stage (Feekes 10) having the highest prediction power (R2 = 0.88 − 0.93).
Veverka, Chatterjee, and Carlson [11] found that the variation in Red Edge Normalized Vegetation Index (RENDVI) obtained with a UAV camera (MicaSense Red Edge) from tillering to booting (Feekes 2–Feekes 10) explained 60% of variation in the grain protein content of spring wheat (R2 = 0.60). Zhou et al. [12] calculated UAV-based spectral indices [Simple Ratio (SR), NDVI, NDVI (GNDVI), Chlorophyll Index (CI), Red-Edge Chlorophyll Index (CIred-edge), and Normalized Difference Red Edge Index (NDRE)]. They utilized a multispectral camera (Sequoia+, Parrot, France) mounted on a UAV (Solo, 3DR, Berkeley, CA, USA). A strong correlation (R2 = 0.55 − 0.66) was observed between wheat grain protein content predicted at tillering and grain filling stages and laboratory-measured protein values. Wang et al. [13] identified anthesis as the best growth stage for estimating wheat protein content from vegetative indices. On the other hand, accumulated spectral index jointing (Feekes 6) to initial grain filling stage gave higher prediction accuracy for grain yield and protein content. Of all the assessed spectral indices, only the UAV-based Red Edge NDVI predicted wheat protein content at tillering through flag leaf emergence (R2 = 0.60) [11]. They concluded that the use of UAV-based sensors has the potential to predict grain protein content and noted that determining the optimal growth stage for data collection is critical. They also suggested that conducting validation studies in the neighboring fields should increase the accuracy of protein prediction.
Ground-based canopy level measurements obtained with handheld sensors (such as plant temperature and chlorophyll content) had lower prediction power for wheat yield (R2 = 0.52 − 0.85) compared to UAV-based indices [10]. Duan et al. [9] found that UAV NDVI were less accurate in predicting yield compared to spectral measurements obtained with handheld sensors. They attributed this to UAV captures signals from background objects, such as soil and senesced leaves. They also reported that altitude may affect the accuracy of yield prediction when using UAV-based imagery. For example, when a Red Edge camera is mounted on a UAV flown at 30–50 m altitude, the UAV-based NDVI was strongly correlated with GS NDVI (R2 = 0.85). When the UAV was flown at a higher altitude, the correlation between the UAV-based NDVI and GS NDVI was not as robust. Hassan et al. [8] utilized a Sequoia 4.0 multi-spectral sensor (AgEagle Aerial Systems Inc., Wichita, KS, USA) mounted on an advance auto operational DJI Inspire 1 model T600 (SZ DJI Technology Co., Shenzhen, China) UAV for non-destructive high-throughput phenotyping of NDVI. They found that UAV-based NDVI measurements were highly consistent with GS NDVI.
As reported by Ogaya and Peñuelasm [14], the spectral response of the vegetation is related to the surface characteristics and cellular structure of leaves and depends on the concentrations and distributions of photosynthetic pigments and other biochemical components. The differences in yield prediction using UAVs and handheld sensors may be due to the difference in wavelengths (band width). For example, unlike the handheld Crop Circle sensor, the Sequoia camera can register chlorophyll B absorption at 642 nm [15]. Naser et al. [16] noted that GS NDVI of wheat decreased as the crop approached maturity, which is likely due to structural and physiological changes within the wheat plants. As the plant canopy transforms from early-season emergence and green-up to late-summer maturity, its reflectance properties change significantly.
We hypothesized that the in-season spectral measurements (NDVI) from handheld (GS) and aerial (UAV) sensors can be used to accurately estimate wheat yield, grain N uptake, and protein content.
The objectives of this study were: (1) to assess the feasibility of wheat yield, grain N uptake, and protein content prediction with in-season crop spectral reflectance measurements, and (2) to compare a handheld canopy sensor and a sensor-equipped UAV for accuracy of wheat yield, grain N uptake, and protein content estimation.

2. Materials and Methods

2.1. Experimental Locations

Field studies were conducted at 5 locations in southern Idaho (Aberdeen, 42°56′36″ N, 112°50′22″ W; Ashton, 44°4′20″ N, 111°26′52″ W; Parma, 43°47′10″ N, 116°56′34″ W; Rupert, 42°37′5″ N, 113°40′28″ W; and Soda Springs, 42°39′29″ N, 111°35′46″ W) during the 2015 (except Parma), 2016, and 2017 growing seasons, resulting in fourteen site-years. All experimental sites are characterized by semi-arid climates with long, cold, and moderately snowy winters and hot, dry summers typical for southern Idaho. Detailed information about experimental locations, climatic parameters, and soil characteristics are reported in [17].
Soft white spring wheat (Triticum aestivum L.) (cv. Alturas) was planted at Parma with an H&N Equipment research plot drill. Hard red spring wheat (cv. Cabernet) was planted using a Hege 500 series plot drill at all other sites. Plant density was approximately 3.9 million seed ha−1 (106.5 kg seeds ha−1) with row spacing of 0.18 m. The plots were 1.52 m wide by 4.27 m long and reduced to 3.05 m using glyphosate herbicide and rototiller prior to harvest. Granular urea (46-0-0) was surface-broadcasted immediately after planting at 5 rates (0, 84, 168, 252, and 336 kg N ha−1). Plots were arranged in a randomized complete block design (RCBD) with four replications, resulting in 20 plots per location. Wheat was irrigated every 7–10 days with sprinkle irrigation, except for Soda Springs (dryland location).

2.2. Unmanned Aerial System

An octocopter UAV 3D Robotics 8X+ (3D Robotics, Berkley, CA, USA) (Figure 1) was used to carry camera payloads to acquire ultra-high-resolution imagery. The octocopter’s onboard computers control navigation, altitude, and communications in flight using 3DR u-blox GPS with Compass, while sending real-time telemetry and video output and receiving control inputs over the 3DR Radio v2 connection.
The octocopter was equipped with a 3-Axis Gimbal (3D Robotics Inc., Berkeley, CA, USA). The empty weight of the octocopter with 14.8v dc 10,000 mAh lithium polymer rechargeable battery is 800 g; weight increased to 1.8 kg with camera and Solo Gimbal. A MicaSense Red Edge™ 3 Multispectral Camera (MicaSense Inc., Seattle, WA, USA) with an integrated Global Positioning System with an accuracy of 2–3 m, mounted on the octocopter was used to obtain the imagery.
The MicaSense Red Edge™ 3 Multispectral Camera acquires 1.3-megapixel images in five spectral bands (red, green, blue, near infrared, and red edge) with 12-bit Digital Negative or 16-bit Tag Image File Format radiometric resolution. The ground spatial resolution of images from the narrowband imager is 8 cm (per band) at 120 m above ground level. During the flight, the camera’s Downwelling Light Sensor (MicaSense Inc., Seattle, WA, USA) measured and recorded the ambient light for each of the five bands. The gain and exposure settings are automatically optimized for each image and each spectral band to avoid blurring or over-exposure.

2.3. Multispectral Image Acquisition and Processing

The UAV images were captured at 100 m above the ground level in sunny and cloud-free conditions within 2 h of solar noon, with flights of approximately 15 min in duration. Mission planner software was used to shape the flight route and select the sensor parameters to ensure an adequate overlap between images required for mosaicking. Two flight missions were performed at each location at Feekes 5 (tillering) and Feekes 10 (boot) of wheat growth stages. These stages were chosen because N fertilizer applied at these growth stages has the potential to optimize wheat yield and grain quality, respectively.
Images were imported to MicaSense Atlas software for radiometric calibration, georeferencing, and mosaicking. The Pix4D Mapper finds hundreds of tie-points between overlapped images and stitches the individual images together to produce a single ortho-rectified image of the whole area of interest. The accuracy of an outputted reconstructed image is typically two times the ground spatial resolution. The mosaicked images were radiometrically calibrated using the Red Edge Camera Radiometric Calibration Model in Atlas software. The Calibrated Reflectance Panel was placed close to the research plots during each flight mission; an image of the panel was captured immediately before and after each flight. Atlas software uses calibration curves associated with the Calibrated Reflectance Panel to run the calibration model and convert the raw pixel values of an image into absolute spectral radiance values. The output of the radiometric calibration model is a 5-layer, 16-bit ortho-rectified Geo TIFF image.

2.4. Handheld Sensor Data Collection

For each location, in all growing seasons, both the aerial and ground-based data sets were collected at the same growth stage, and, whenever possible, on the same day, but never more than 5 days apart. Biomass production was estimated with NDVI obtained with a GS handheld optical sensor by scanning the two middle rows of wheat plants at 70 cm above the wheat canopy at Feekes 5 and 10. The handheld GS utilizes two wavelengths: 656 nm (red) and 774 nm (NIR). At a walking speed of 5 km h−1, spectral reflectance data were collected at a rate of seventy readings m−2. The GS sensor employs a patented technology to measure crop reflectance and output NDVI values [18]. The NDVI is calculated as follows: NDVI = (ρNIR − ρRed)/(ρNIR + ρRed), where ρNIR and ρRed are the fractions of reflected near-infrared (NIR) and red radiation, respectively, returned from the sensed area [19].

2.5. Post-Harvest Data Analysis

At maturity, wheat yield was determined by harvesting plots with a Wintersteiger Delta (Salt Lake City, UT, USA) small plot combine equipped with a mini Grain Analysis Computer (GAC) with a Harvest Master Classic GrainGage HM800 moisture tester (Juniper Systems, Inc., Logan, UT, USA) run by Mirus software (Juniper Systems, Inc., Logan, UT, USA). The by-plot grain weights were adjusted to 13.5% moisture and extrapolated to yield on a kg per ha basis. Grain total N content was quantified using near infrared reflectance spectroscopy (NIR) with a Perten DA 7250 NIR analyzer (Perten Instruments, Inc., Springfield, IL, USA). Grain protein content was calculated by multiplying grain total N content by 5.7 [20]. Wheat grain N uptake was computed by multiplying grain yield by total N concentration of the grain.

2.6. Statistical Analysis

The relationships between GS NDVI and UAV NDVI and spring wheat yield, grain N uptake, and protein content were evaluated. Using SAS 9.4 [21], PROC UNIVARIATE was used to test the data normality and to determine any potential data extremes. The dataset was plotted using a PROC CORR and PROC GPLOT to identify any possible datapoint outliers and omit them, if necessary. Next, data were analyzed across site-years by ANOVA using PROC GLM to obtain Pearson correlation coefficients. Figures and regressions were generated using Excel (Microsoft Corp., Redmond, WA, USA).

3. Results and Discussion

Comprehensive results on the effects of N fertilizer rates on wheat grain yield, grain protein content, grain N uptake, and N use efficiency have been published in [19]. In short, our results indicated that optimum N rate depended on the environment and field-specific prevailing conditions. This suggests that each growing season presents its own challenges in determining crop demand for N, due to temporal variability. In terms of grain quality, grain protein was significantly affected by N rate in ten out of fourteen site-years. Higher N rates resulted in higher grain protein content, but lower N use efficiency.
Table 1 summarizes the Pearson’s correlation coefficients as a measure of the strength of the association between GS NDVI and UAV NDVI, and wheat yield, grain N uptake, and grain protein content. Wheat yield and grain N uptake were most closely correlated with GS NDVI and UAV NDVI at Feekes 5, r = 0.56 and 0.51, respectively (p < 0.05) (Table 1). The GS NDVI and UAV NDVI relationship with wheat yield and grain N uptake was weaker for Feekes 10 with r = 0.34 and 0.36, respectively. No apparent relationship between GS NDVI and UAV NDVI with grain protein content was observed for Feekes 5 or Feekes 10 (Table 1).

3.1. Relationship between GS NDVI and UAV NDVI

In this study, we observed a strong positive correlation between GS NDVI and UAV NDVI at Feekes 5 (R2 = 0.78) and Feekes 10 (R2 = 0.70) (Figure 2). Across all N rates, the relationship between GS NDVI and UAV NDVI was strong, positive, and linear at both Feekes 5 and Feekes 10 [19]. Hassan et al. [8] also noted significant correlations with R2 ranging from 0.38 to 0.90 between GS NDVI and UAV NDVI during stem elongation to late grain filling in wheat. Ya et al. [22] observed a strong GS NDVI vs UAV NDVI correlation (R2 values of 0.58–0.80) while mapping rice (Oryza sativa L.) fields. They concluded that, due to high correlation between the GS NDVI and UAV NDVI, the application of aerial imagery is a promising tool for in-season monitoring of fields and prediction of crop nutrient status. A comparison between GS NDVI and UAV NDVI in tall fescue (Festuca arundinacea) and bermudagrass (Cynodon dactylon) has shown equally high R2 (0.96–0.98) [23].

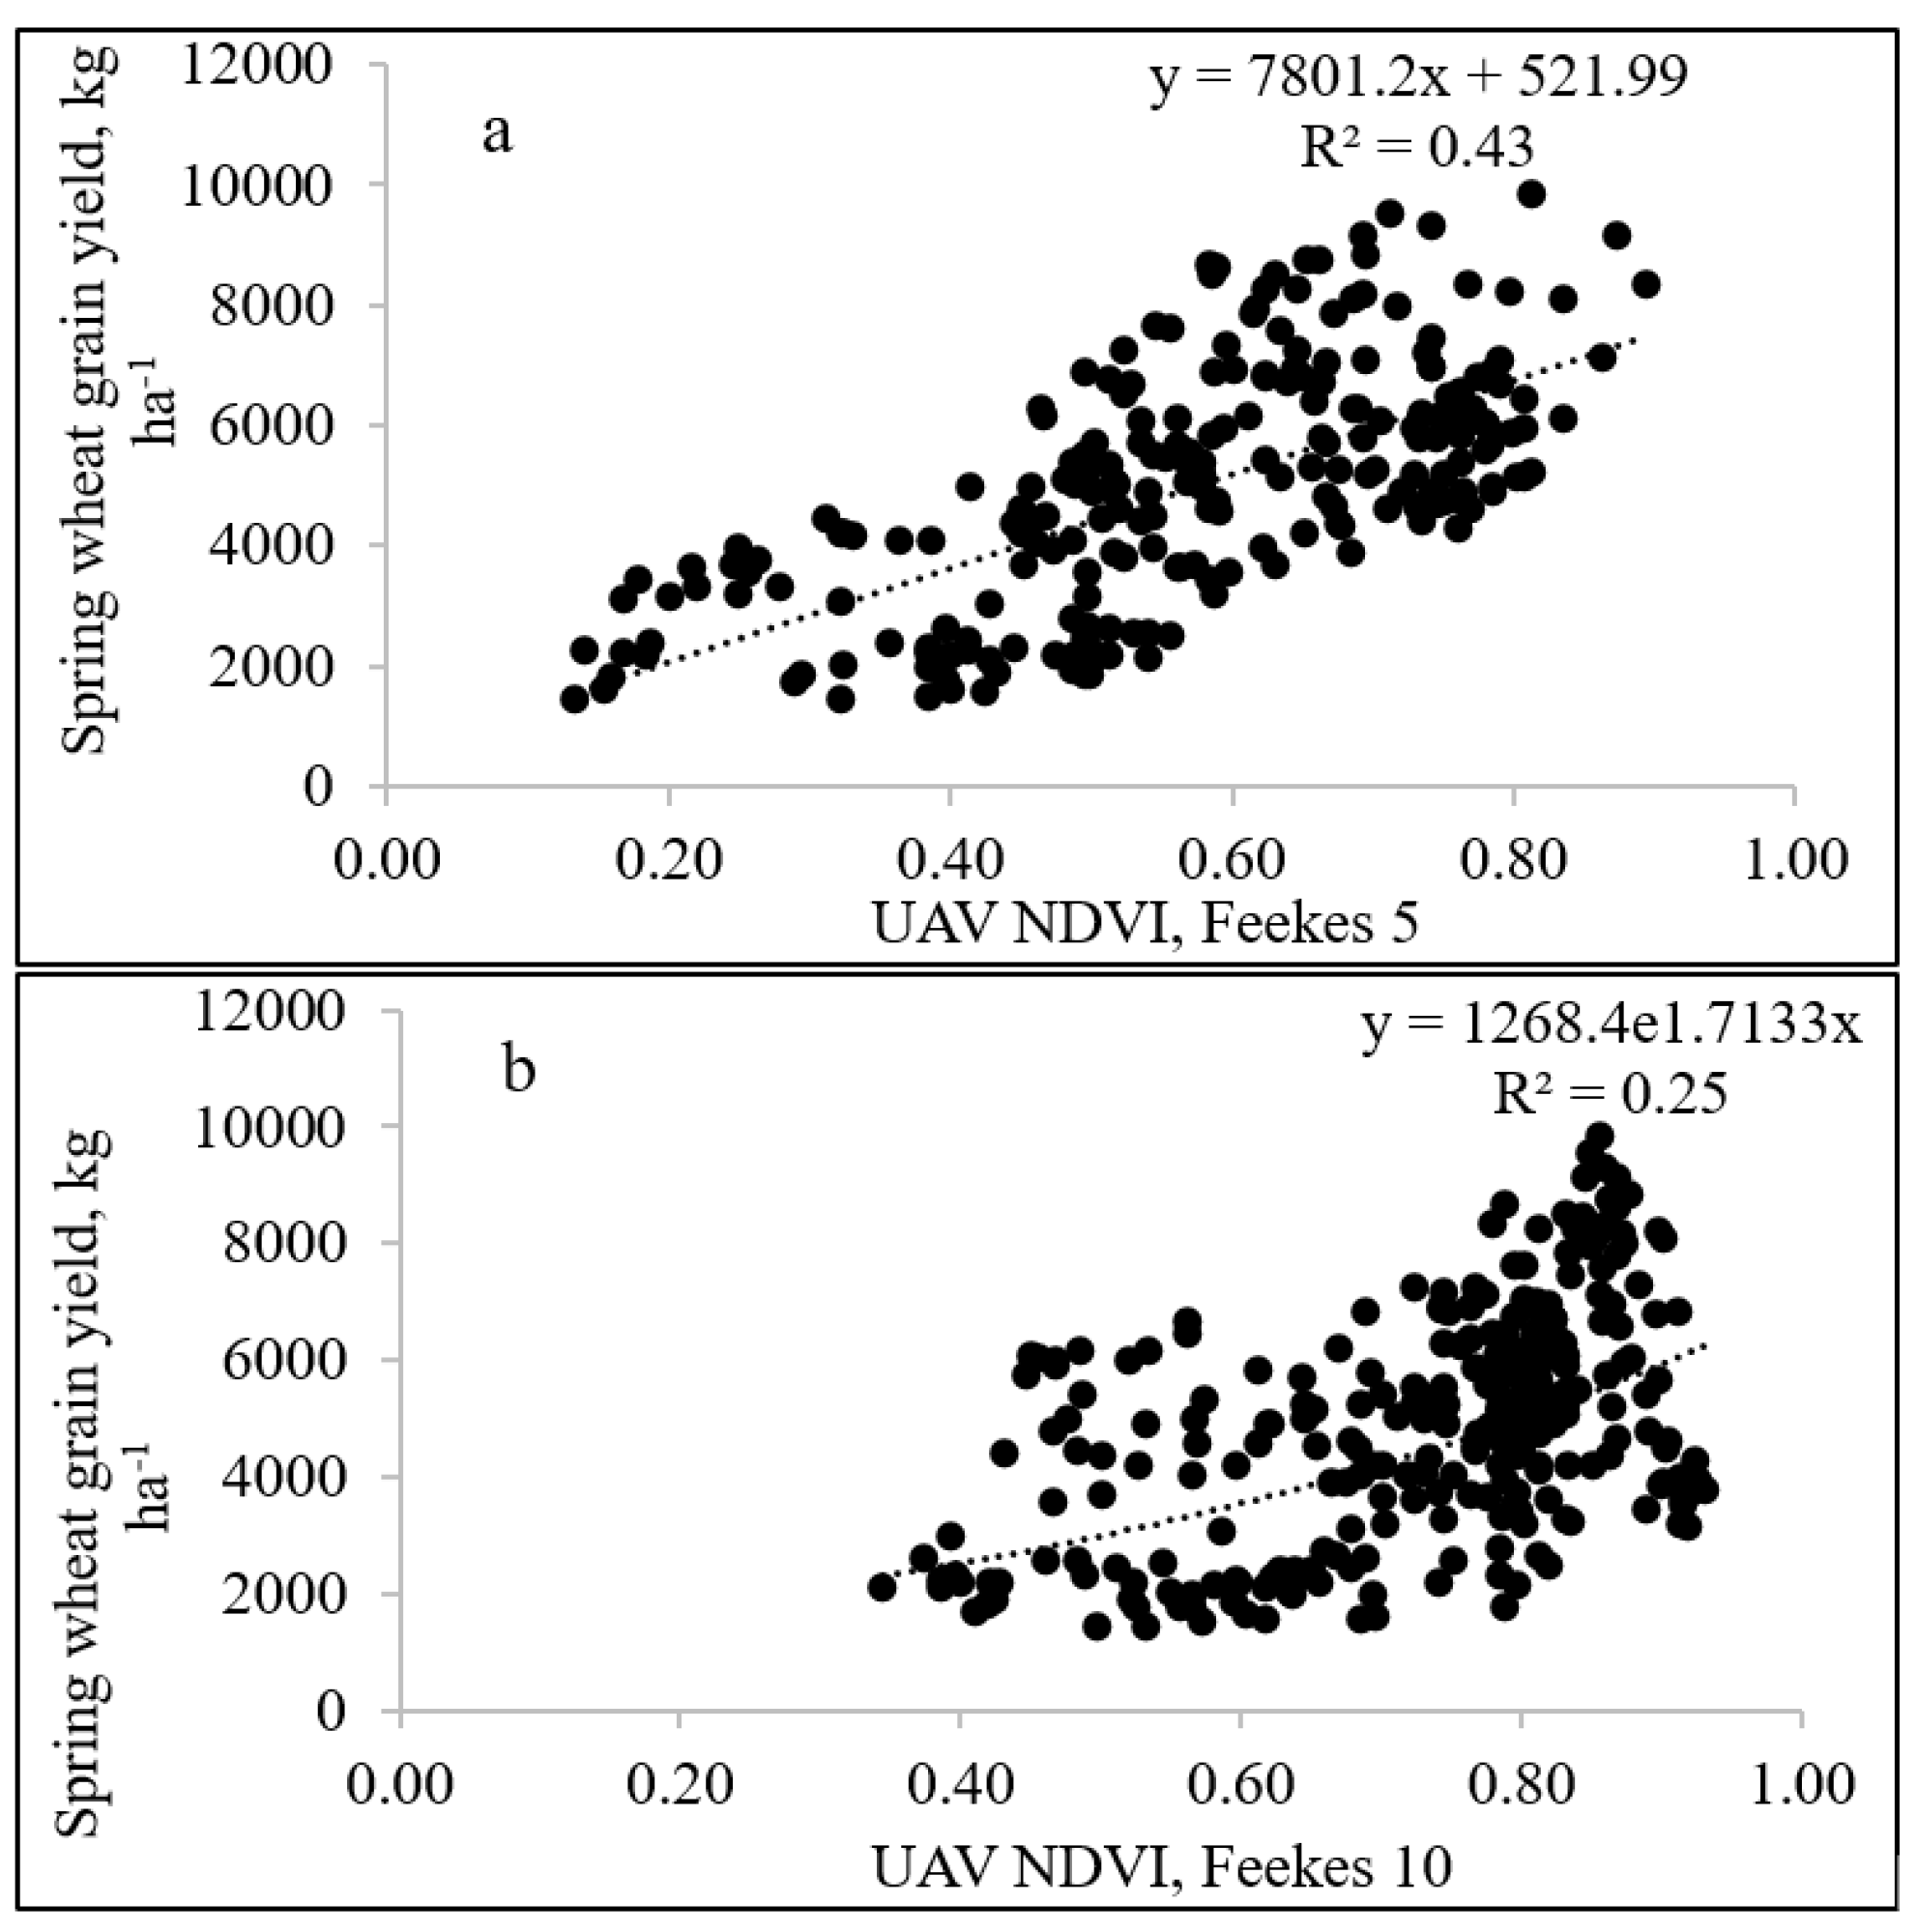
3.2. Relationship between GS NDVI and UAV NDVI and Grain Yield

Tillering—the increase in the number of stems developed from a single plant—is the most critical component for wheat yield potential [24]. In fact, up to 70% of wheat grain yield is directly linked to successful tiller production [25]. Tillering begins with the emergence of the fourth leaf from the main stem. Wheat plants form tillers from Feekes 2 to Feekes 4. Further, from Feekes 5 to Feekes 8, tiller formation is complete. Feekes 4–5 (“the green-up”) is an optimal time for topdress N fertilizer applications. Wheat head size (the number of spikelets per spike) is determined at this time, and any additional tillers formed after Feekes 5 do not typically contribute to grain yield [26]. By the beginning of Feekes 9, the plants are fully developed and flag leaves emerge [27]. Wheat anthesis is initiated at the Feekes 10 growth stage and pollination is typically complete in approximately five days; then ripening follows [26]. This explains why NDVI values increased as wheat growth progressed, biomass accumulation continued, and canopy closure has occurred. Lush, green biomass is expected to reflect greater amounts of NIR light than in the visible range.
Measuring plant canopy reflectance, GS is primarily a biomass sensor, and can be utilized to index basic nutrient responses, crop conditions, and yield potential in a quantitative manner [28]. GS NDVI was significantly correlated with spring wheat N concentration, N uptake, and grain yield [29]. Osborne [30] found that GS NDVI can be used to accurately estimate grain yield in season and to guide topdress N fertilization. Several studies [29,31,32] proposed the use of vegetation indices such as NDVI for monitoring crop growth and development throughout the growing season. The study of Feng and Yang [31] reported that the correlation coefficient between NDVI and wheat grain yield was in the range of 0.31 to 0.82 from jointing (Feekes 6) to the grain filling stage (Feekes 11). Zhang et al. [29] found that yield was most reliably estimated using the NDVI value at Feekes 10.
In this study, wheat grain yield was positively linearly correlated with GS NDVI at Feekes 5 (R2 = 0.42) (Figure 3a). The analysis of data from long-term field experiments revealed that NDVI at Feekes 5 was correlated with wheat grain yield (R2 = 0.44) [28]. At Feekes 10, a polynomial relationship between GS NDVI and grain yield was observed, with NDVI explaining 34% of variation in yield (Figure 3b). This indicates that NDVI was a better predictor of grain yield at Feekes 5 compared to Feekes 10. This agrees with findings by Girma et al. [33] that NDVI at Feekes 5 to Feekes 7 were found to be more strongly associated with wheat grain yield, compared to NDVI measured both earlier and later in the growing season. Indeed, in this study, correlation between NDVI and yield decreased at Feekes 10, compared to Feekes 5. This agrees with work by Moges et al. [34] who found the correlation between NDVI and wheat yield to be highest at Feekes 5 and decreasing with increasing Feekes growth stages. The NDVI is well correlated with leaf area index (LAI) and is more sensitive to changes in the crop canopy when the LAI is low (during the earlier growth stages), with the data becoming saturated after the crop canopy closure [35].
In this study, wheat grain yield was positively linearly correlated with UAV NDVI at Feekes 5 (R2 = 0.43) (Figure 4a). At Feekes 10, an exponential relationship between UAV NDVI and grain yield was observed, with NDVI explaining only 25% of variation in yield (Figure 4b). These trends are the same as for GS NDVI and show that NDVI was a better predictor of grain yield at Feekes 5, compared to Feekes 10. Work by Stone et al. [36] has also shown that NDVI measurements in wheat at tillering can provide a reliable prediction of N uptake and biomass production. Similar work by Reeves et al. [37] used direct in-season measurements of total N uptake at Feekes 5 growth stage to estimate wheat grain yield. When moisture was incorporated in the in-season prediction of wheat yield, Walsh et al. [28] found a strong relationship between grain yield and GS NDVI at Feekes 5. Raun et al. [38] found a significant relationship between in-season estimated yield and final wheat grain yield, using GS NDVI obtained at tillering. Hassan et al. [9] concluded that a multispectral sensor mounted on a UAV is a reliable platform for NDVI measurement to predict wheat biomass and grain yield.

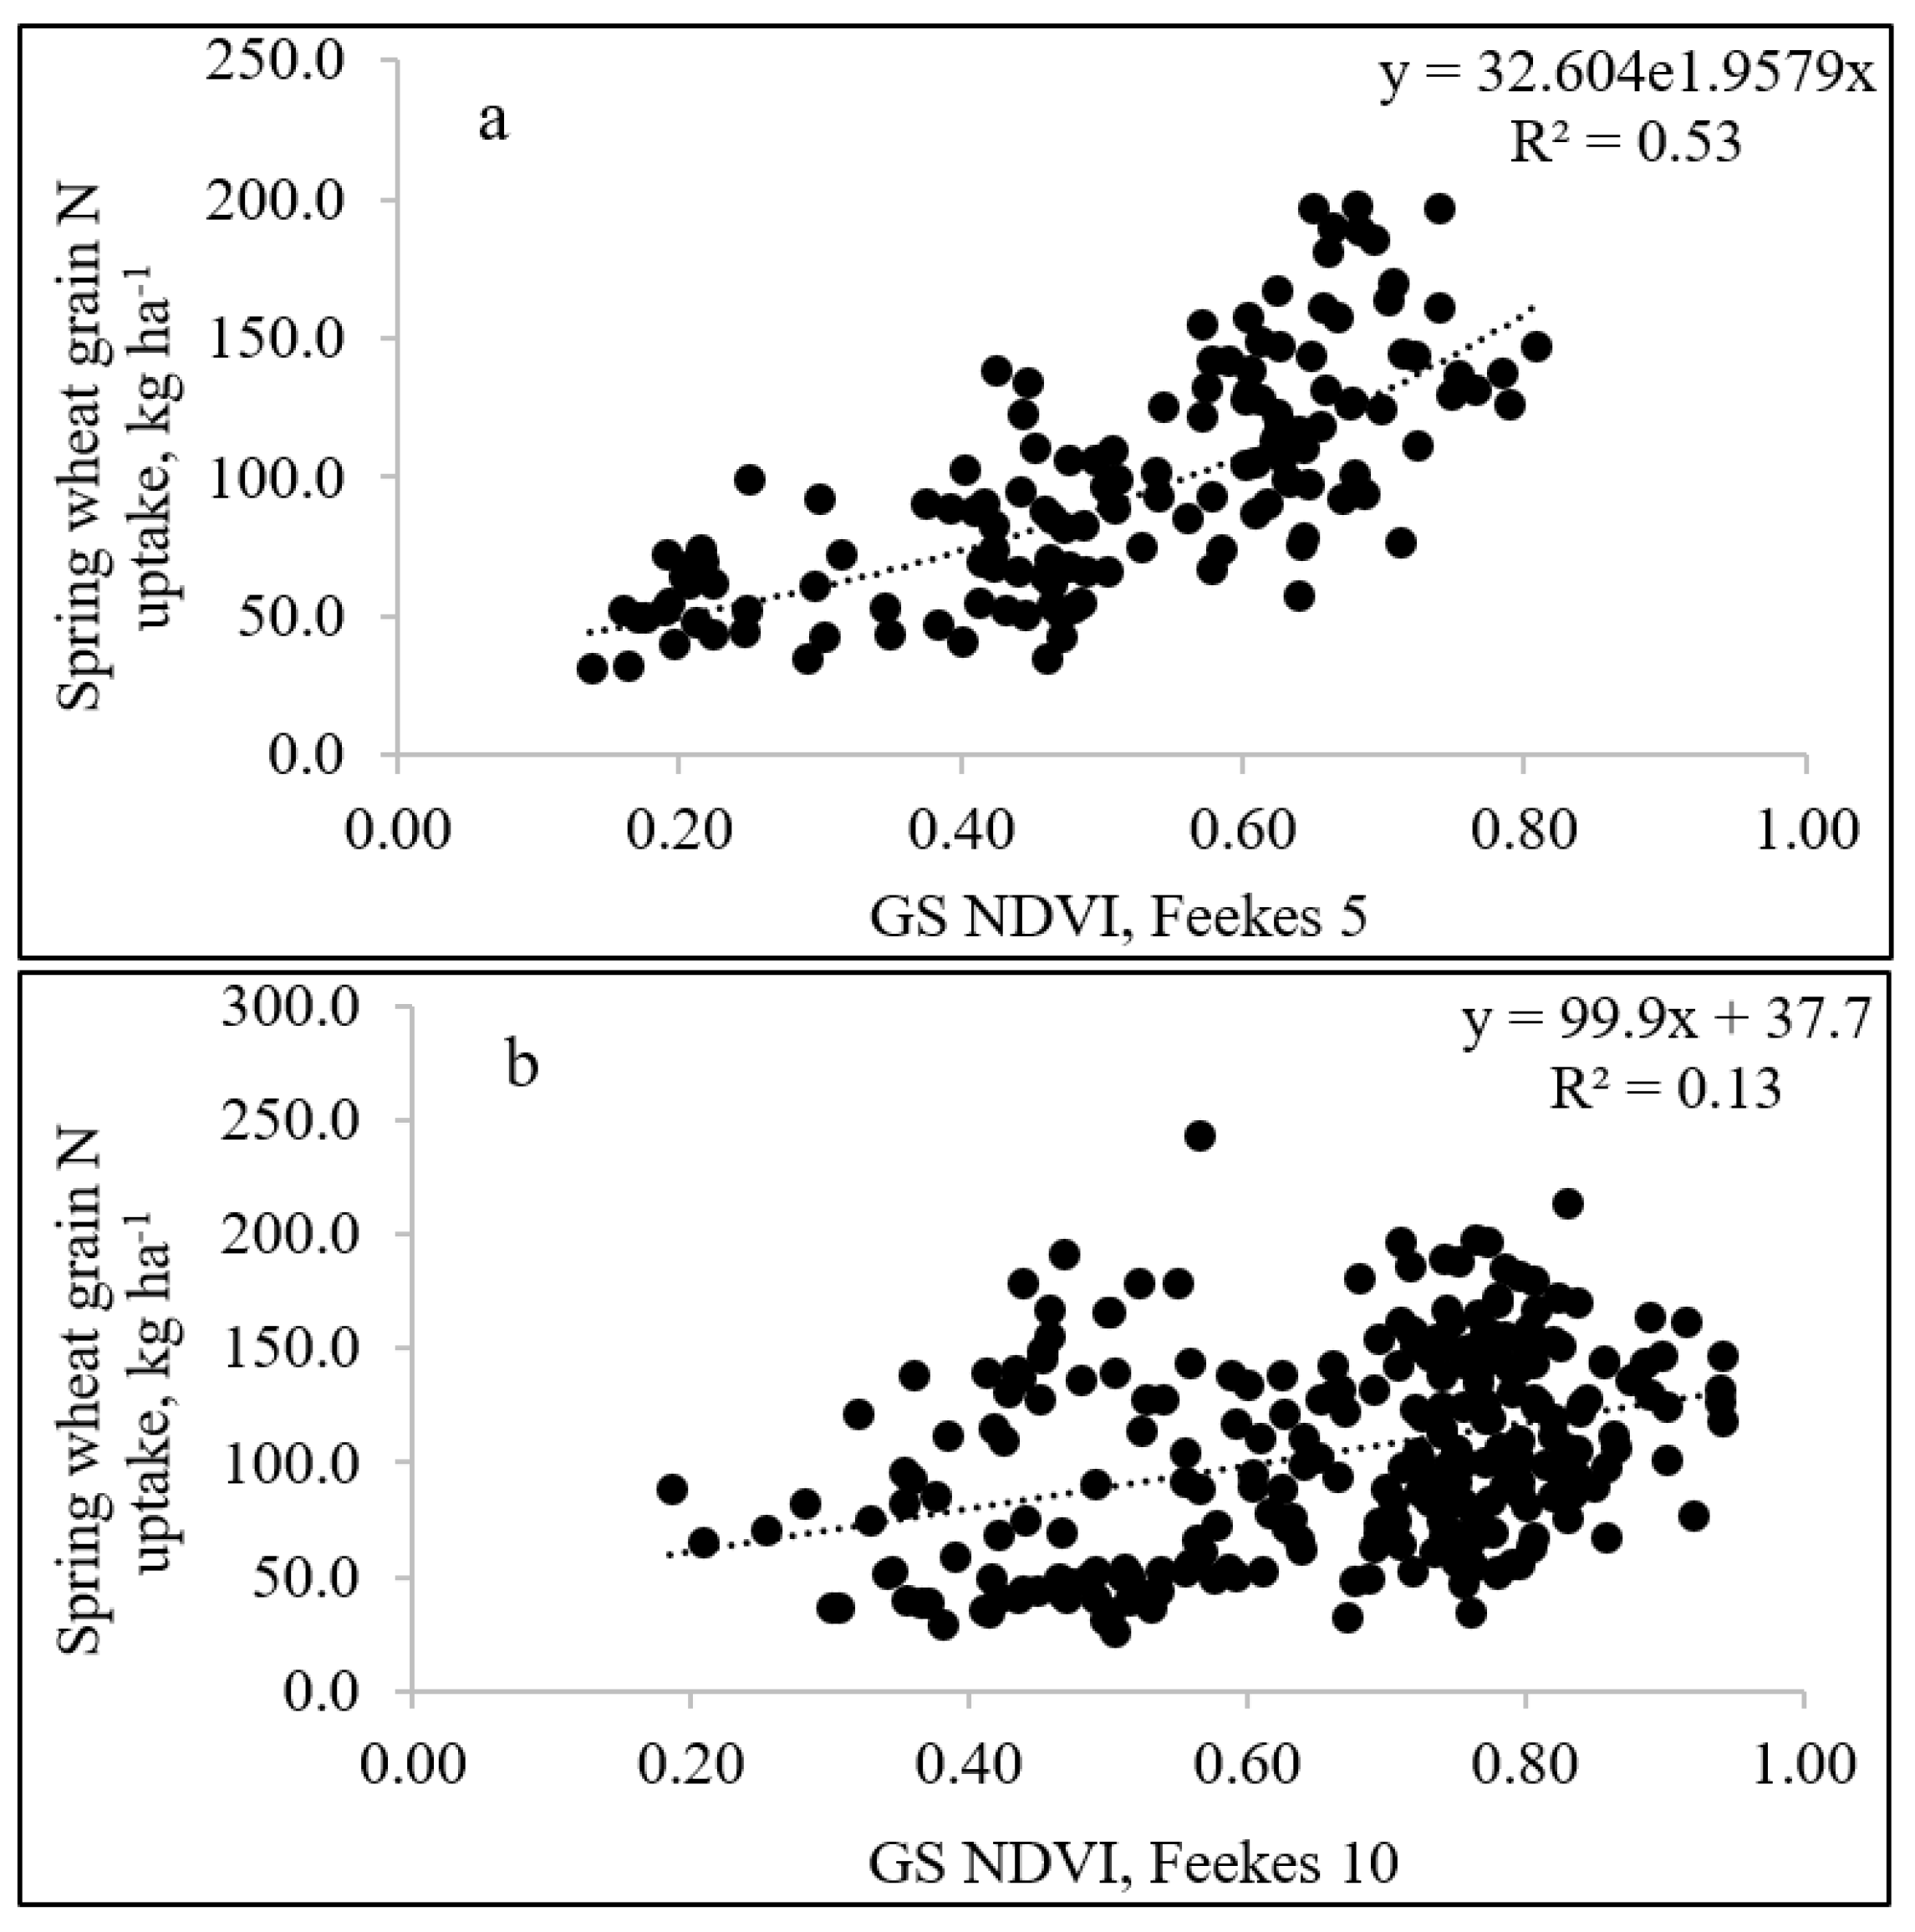
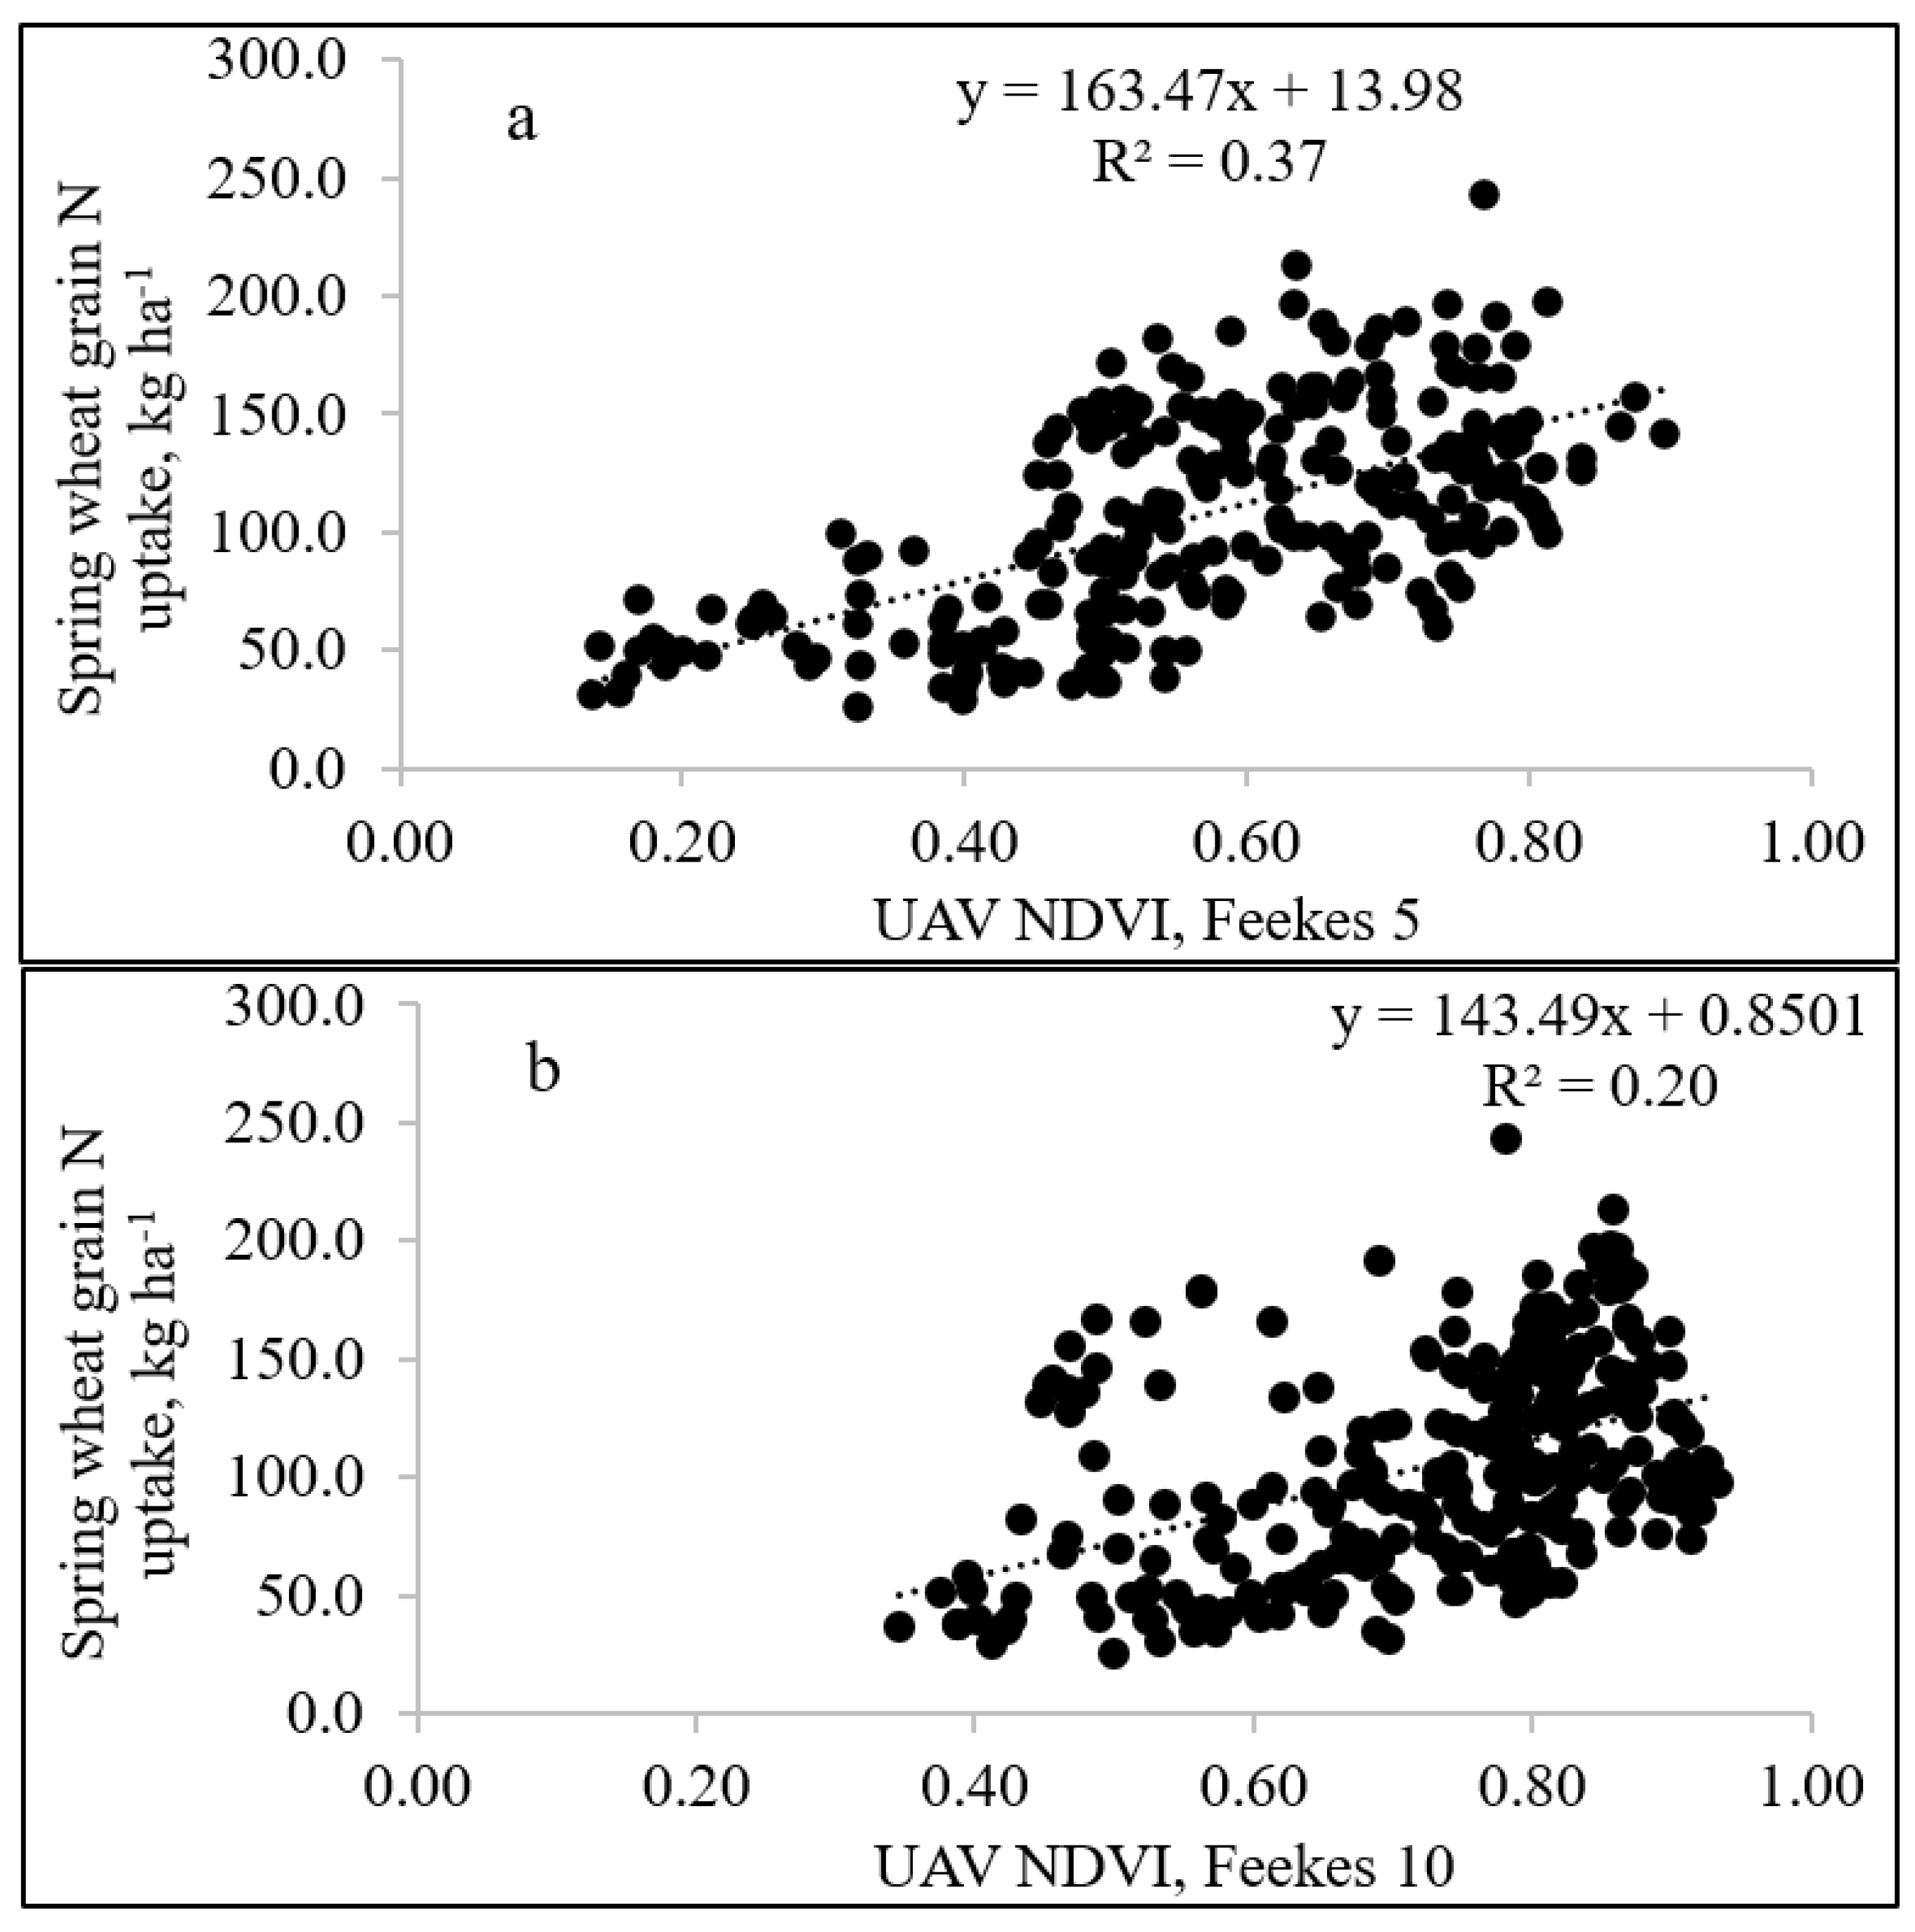
3.3. Relationship between GS NDVI and UAV NDVI and Grain N Uptake

At Feekes 5, there was a positive correlation between GS NDVI and grain N uptake (R2 = 0.53) (Figure 5a). At Feekes 10, only about 13% of the variation in N uptake could be explained by GS NDVI (Figure 5b). This indicates that the grain N uptake was more accurately predicted at Feekes 5 compared to Feekes 10.
At Feekes 5, there was a positive linear relationship between UAV NDVI and grain N uptake (R2 = 0.37) (Figure 6a). At Feekes 10, only about 20% of the variation in N uptake was explained by UAV NDVI (Figure 6b). Thus, as with GS NDVI, grain N uptake was more accurately predicted with UAV NDVI at Feekes 5 compared to Feekes 10. Sembiring et al. [38] found a positive relationship between NDVI and N uptake; this relationship grew stronger from Feekes 5 to Feekes 8. Cao et al. [39] found a higher correlation between NDVI and wheat grain N uptake at Feekes 4 to Feekes 7, compared to later growth stages. On the contrary, Stone et al. [36] found a very high correlation between a plant N spectral index and wheat N uptake at all locations and stages of growth. Lukina, Stone, and Raun [40] found a positive relationship between NDVI and N uptake. They pointed out that this strong correlation is due to NDVI being highly sensitive to factors such as volume of produced plant biomass and N concentration of that biomass.

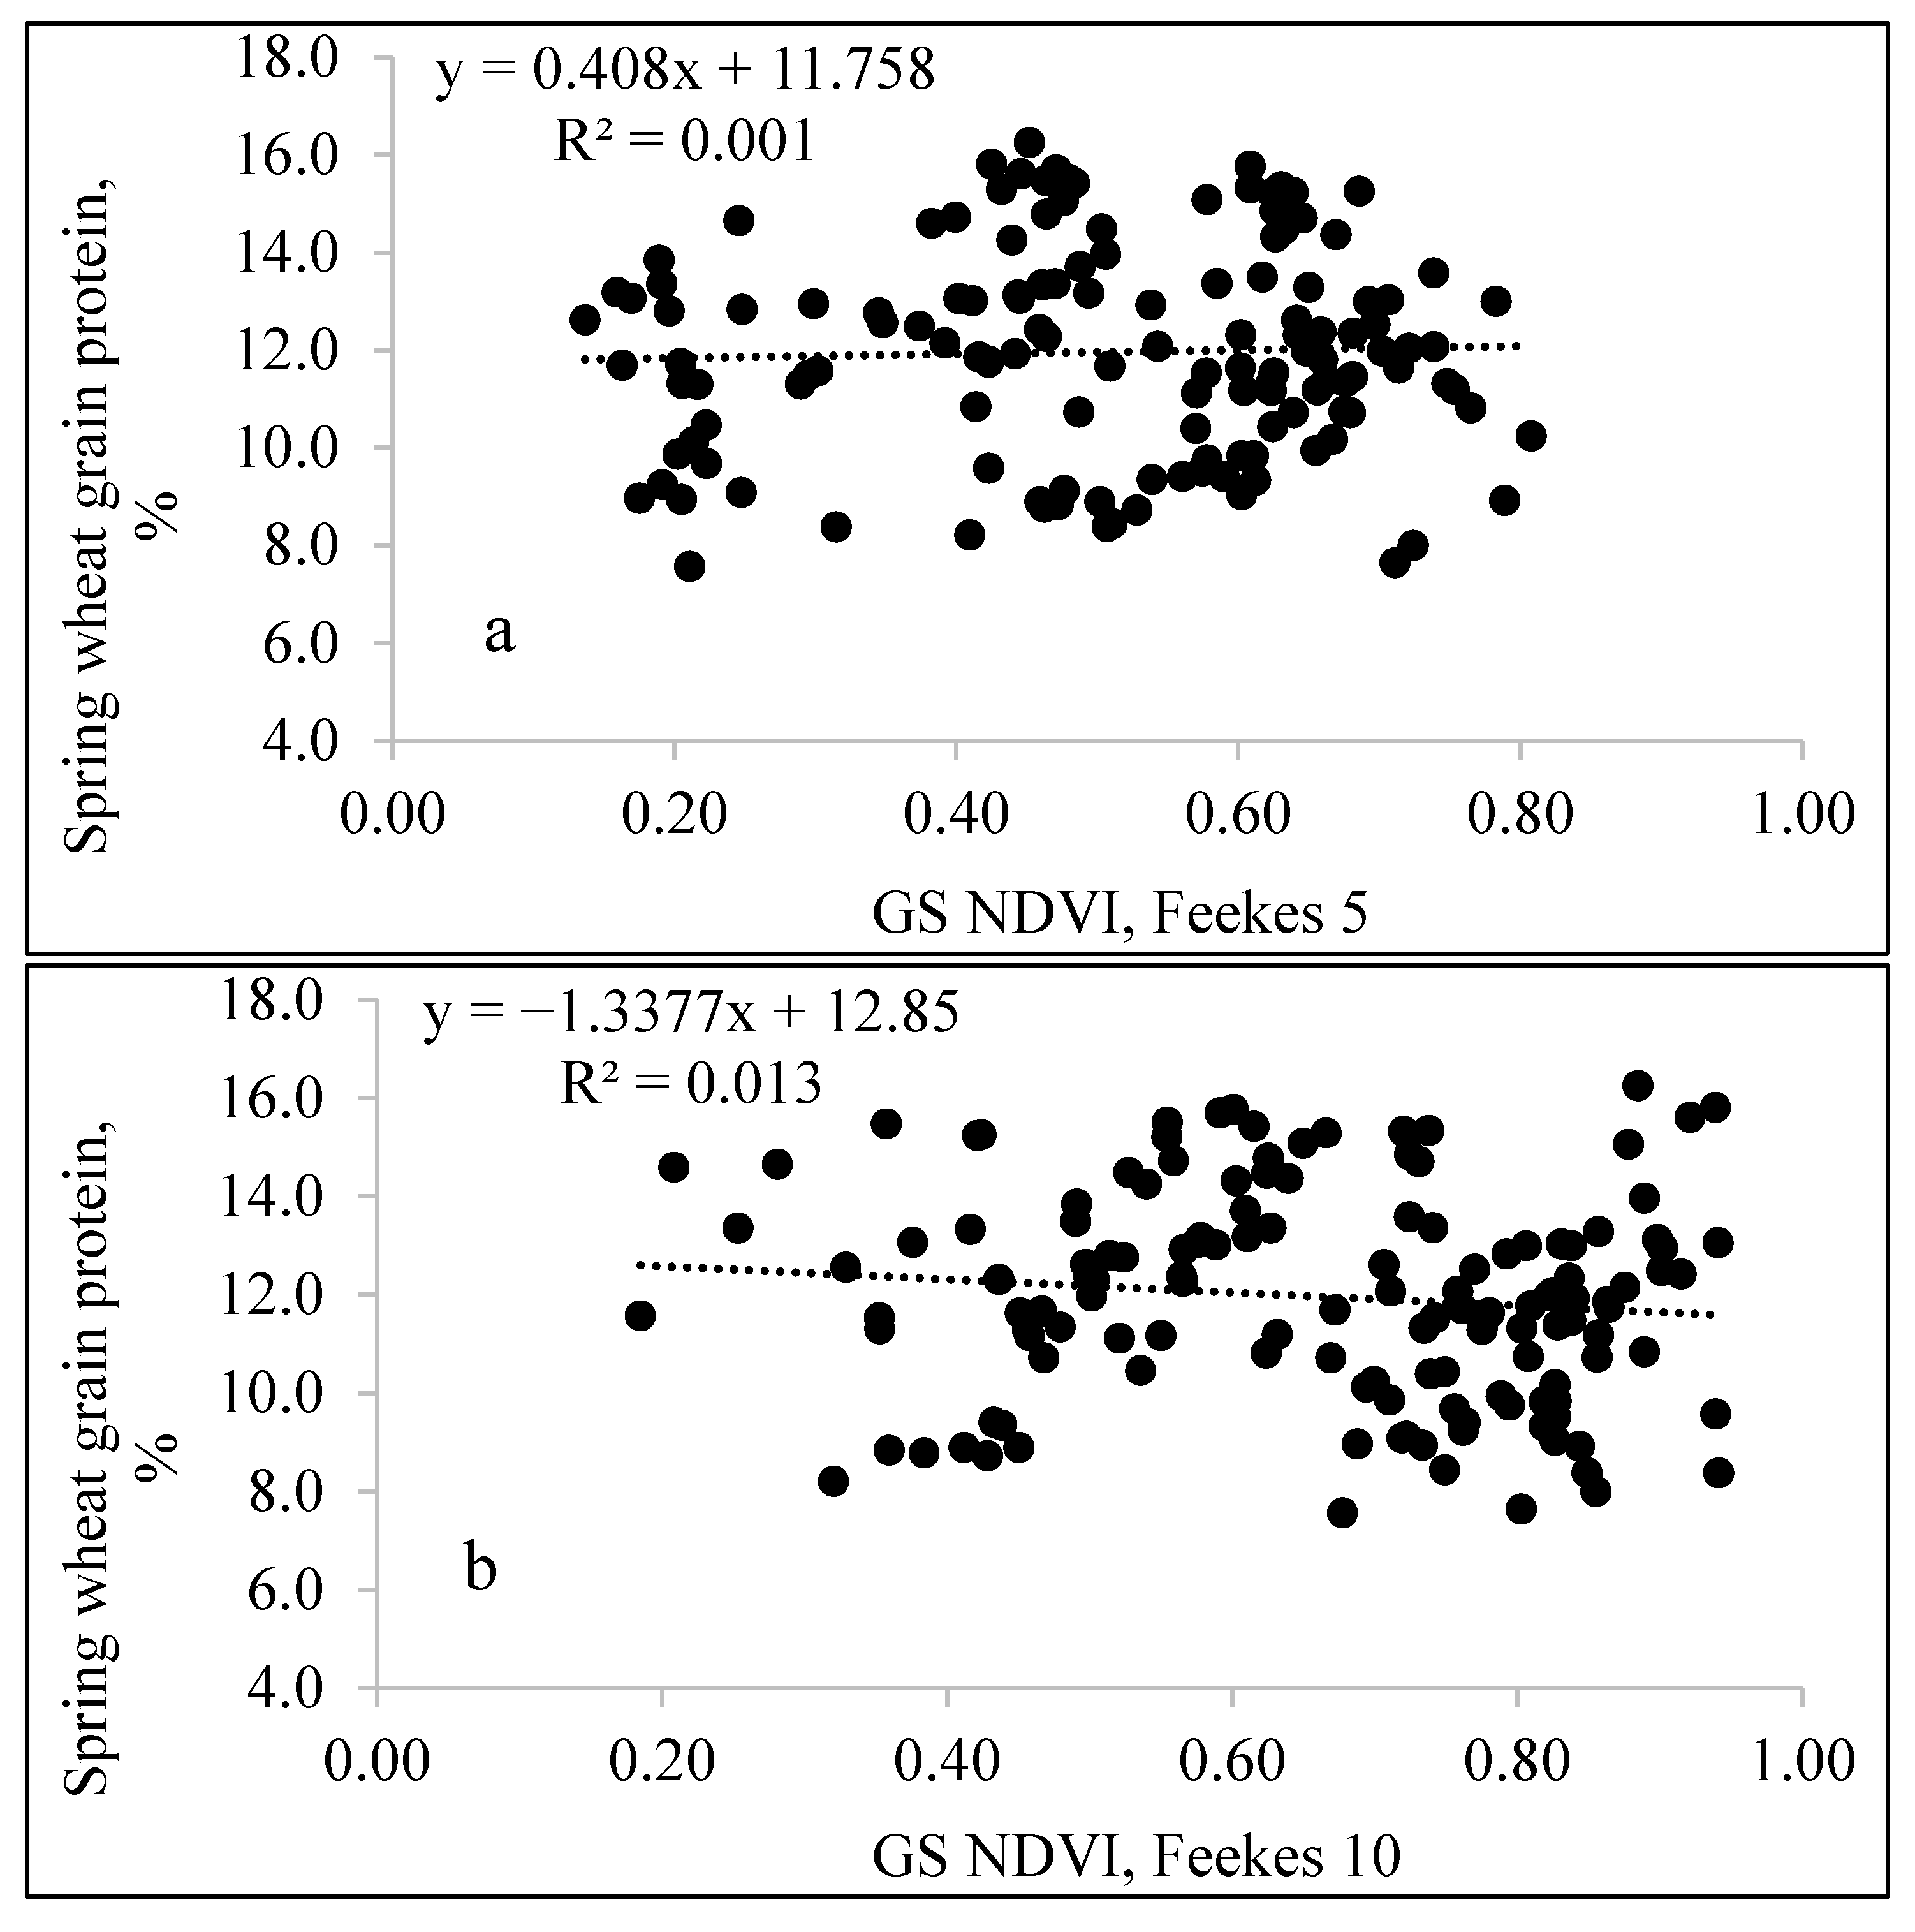
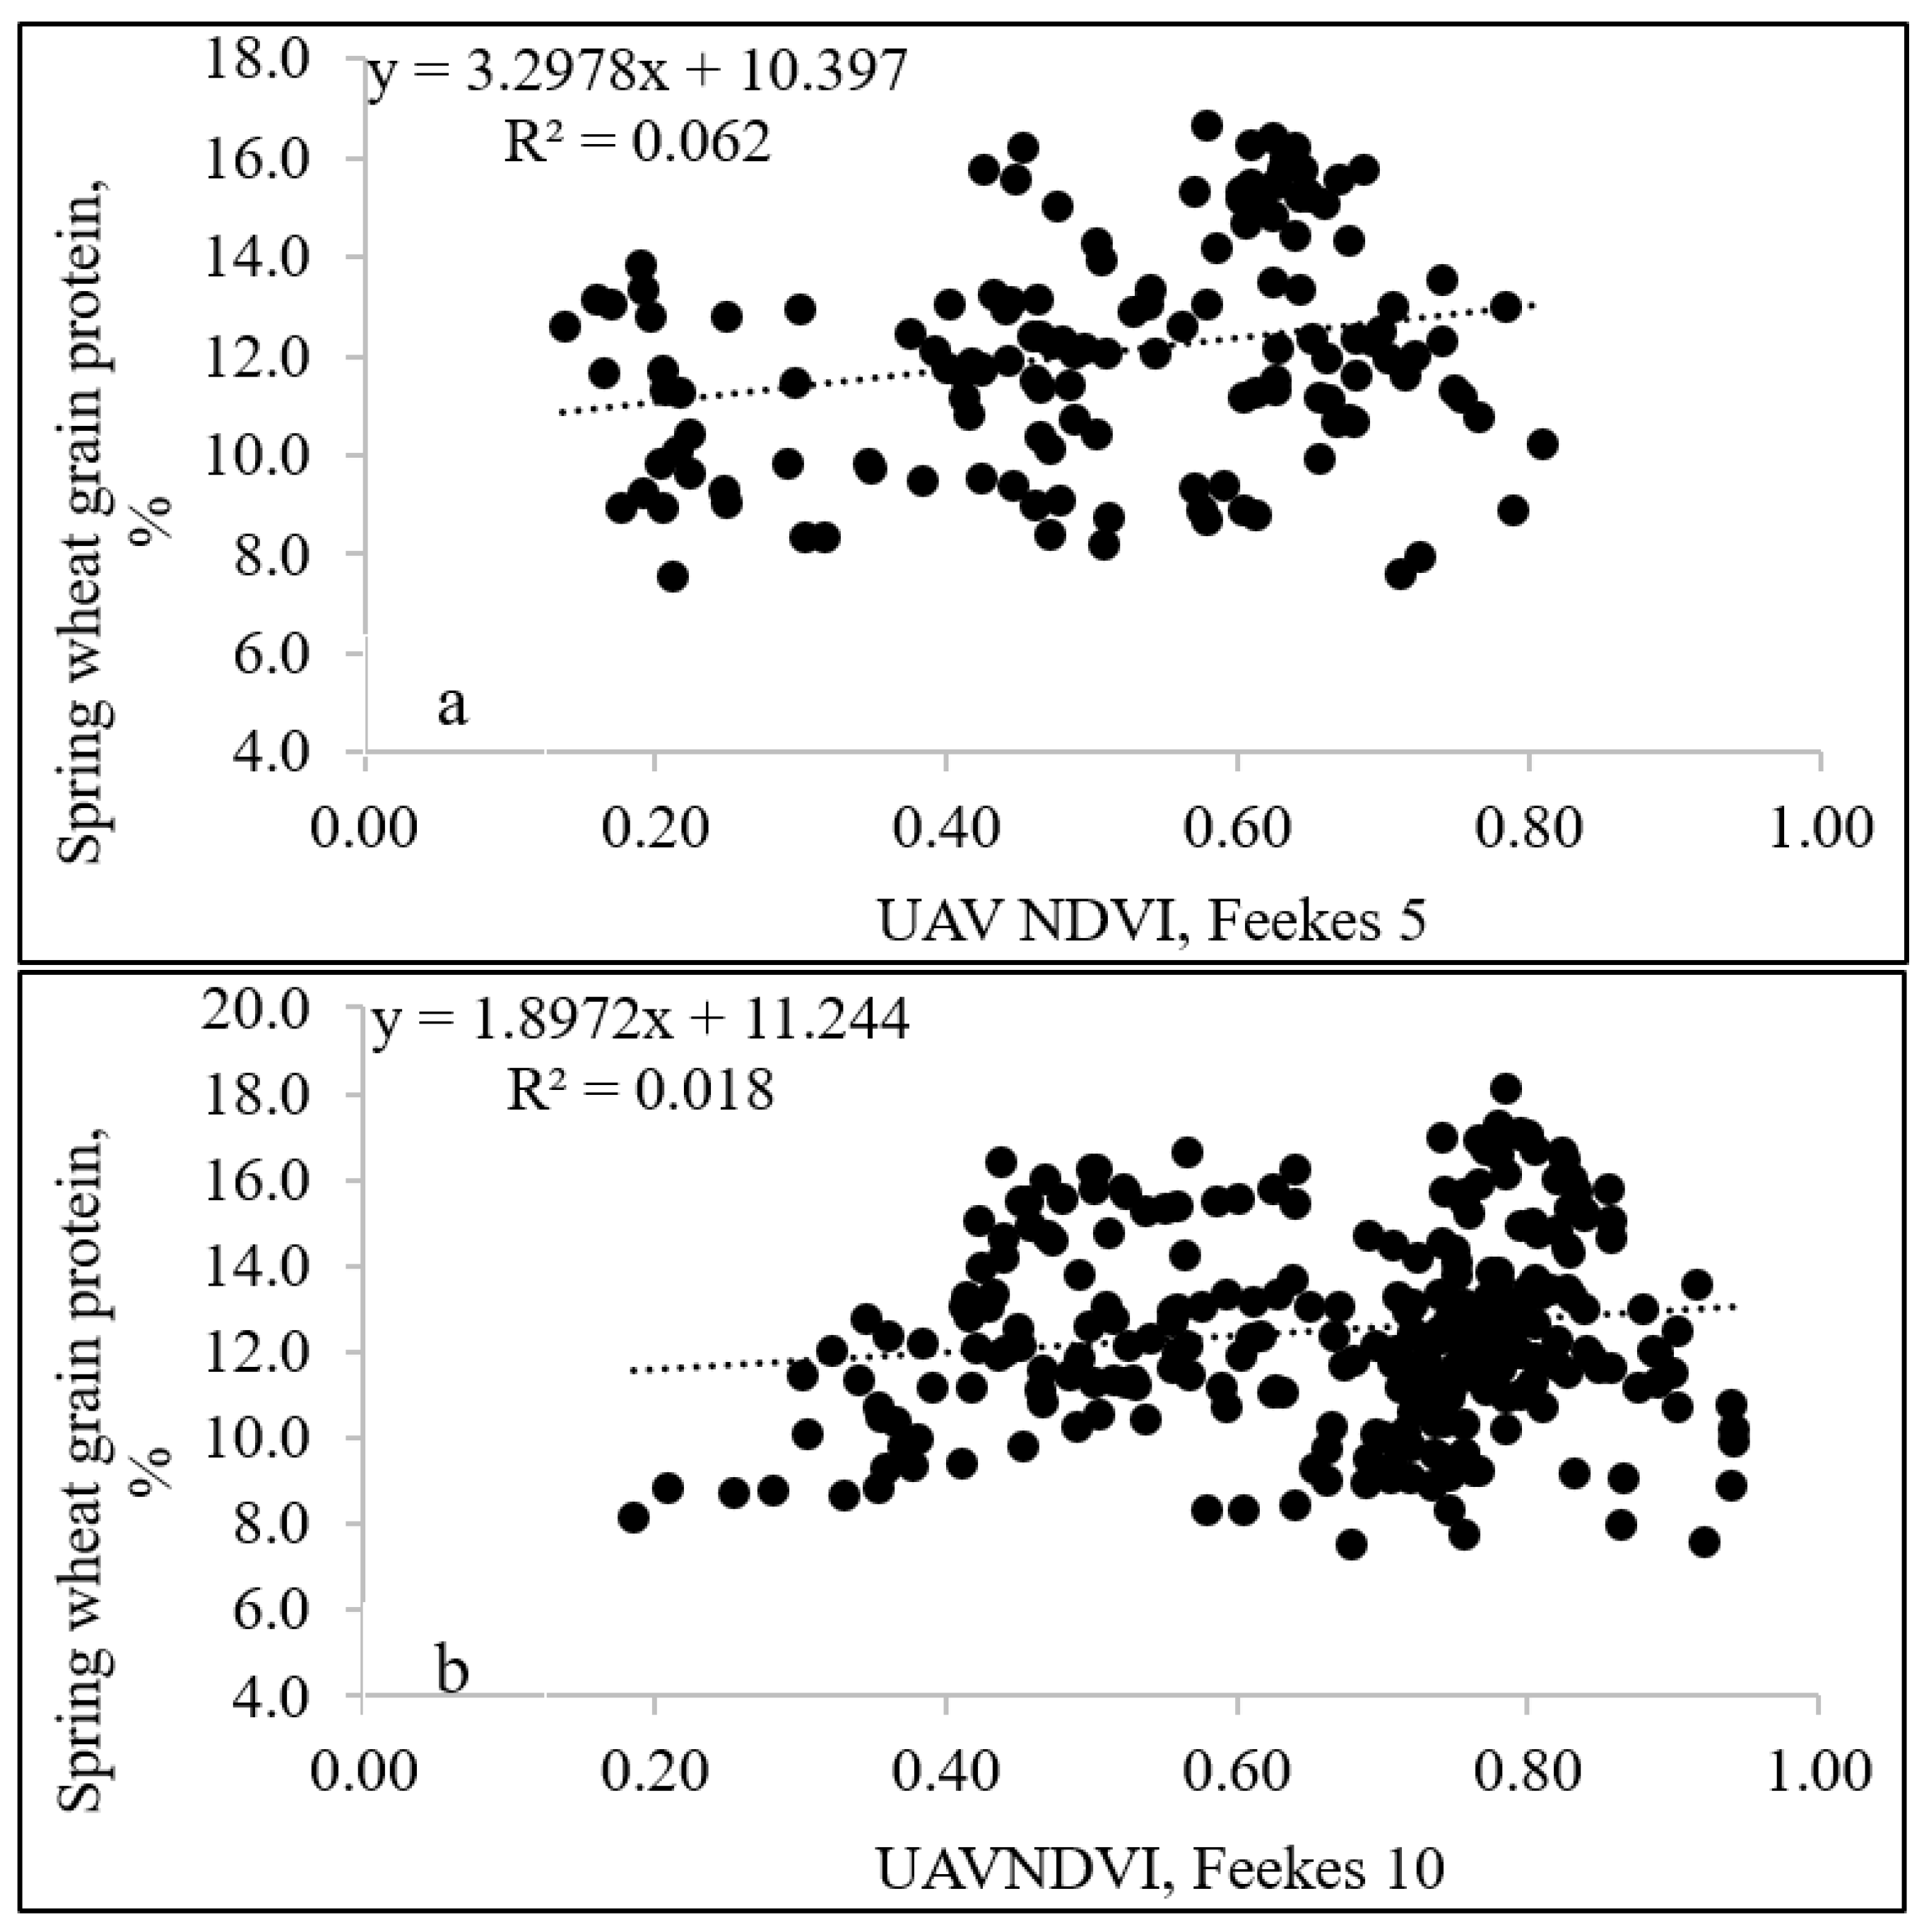
3.4. Relationship between GS NDVI and UAV NDVI and Grain Protein Content

In this study, GS NDVI values ranged from 0.14 to 0.81 (with an average of 0.51) and from 0.19 to 0.94 (with an average of 0.67) at Feekes 5 and Feekes 10, respectively (Figure 7a,b). At both assessed growth stages, the relationship between GS NDVI and grain protein was linear but weak. At Feekes 5, the weak positive correlation between GS NDVI and grain protein was observed, while the relationship was weak negative at Feekes 10 (Figure 7a,b).
In a study that evaluated the effect of N rates on production of wheat grown under varied irrigation, [41] observed comparable grain protein values for all N rates at Parma for soft white spring wheat Alturas. They showed a negative linear correlation between NDVI and wheat grain protein content: higher NDVI measurements corresponded to lower protein values.
Walsh and Christiaens [42] reported that wheat grain protein content was not strongly correlated (at 3 of 8 site-years) with GS NDVI, which is typical for NDVI vs. protein in cereal crops. Freeman et al. [32] observed no consistent relationship between NDVI and wheat grain N at any growth stage. They concluded that wheat grain protein content could not be accurately predicted with NDVI. Indeed, the results of this study also showed that while NDVI can be utilized in estimating wheat grain yield in-season, the prediction of grain protein content remains a challenge.
In our trial, the strength of correlations between both GS UAV and UAV NDVI and yield and grain protein (Figure 8) was comparable to that reported by others [39]. The decrease in accuracy of GS NDVI and UAV NDVI later in the season (Feekes 10) can be partially explained by saturation of NDVI values. The saturation issue associated with the use of NDVI for crop parameter estimation is well known at the denser vegetation levels expected as crops mature [43].
The NDVI is an expression of the overall vegetative status rather than solely the N status of the crop. The GS sensor is marketed mainly as a biomass sensor, not an N-sensor [28]. The relationship between NDVI and crop N uptake is primarily driven by the correlation of NDVI with biomass production rather than with the N content of that biomass [44]. The ability of NDVI to screen for an N deficiency in a crop is constrained by environmental conditions such as stress due to water limitation and/or excess, or low temperatures [43]. This is because the NDVI sensitivity depends not only on the crop’s red/infrared ratio associated with canopy greenness but also on the fraction of ground covered by that canopy. Further, N deficiencies do not always result in detectable changes in N concentrations per unit of plant biomass [45].
Our results demonstrate that both GS NDVI and UAV NDVIs are comparable regarding the accuracy of detecting differences in wheat yield. The GS NDVI and UAV NDVI were strongly correlated to each other, thus they can be used interchangeably for the assessment of crop N status, depending on the need and grower-specific situation, including the cost, field size, and weather conditions. Our findings support previous reports by Benincasa et al. [46] that both GS NDVI and UAV NDVI can be used to estimate N status and potential yield of a wheat crop early in-season (tillering), when the additional N can still be applied in a timely manner to optimize yields. The UAVs provide an opportunity for growers to improve nutrient management at a farm scale by scouting fields rapidly and adjusting N fertilization based on UAV NDVI while simultaneously accounting for spatial variability. This work allows growers to accurately predict crop yield in season and to adjust N fertilizer management for optimized production.
One of the challenges with the in-season yield estimation is the potential difficulty in synchronizing the ground-based and aerial data collection. While the UAV flights could be delayed due to windy conditions, the handheld sensor data collection may be postponed due to excessive soil moisture. However, our previous trials have shown the GS NDVI and UAV NDVI values from the same plots collected within the same week to be strongly correlated and can successfully be used for in-season predictions of wheat yield.

4. Conclusions

We hypothesized that the in-season NDVI from handheld (GS) and aerial (UAV) sensors can be used to accurately estimate wheat yield, grain N uptake, and protein content. Our results have confirmed that wheat yield and grain N uptake can be estimated with GS NDVI and UAV NDVI. We observed a strong linear relationship between GS NDVI and UAV NDVI (0.78), especially at tillering. The GS NDVI and UAV NDVI relationship with wheat yield and N uptake was stronger at tillering compared to flowering (Table 1). This makes sense because at tillering the plant vigor is high and most of N uptake is channeled towards biomass production. In contrast, at the flowering stage, the N uptake direction is shifted towards grain production. The GS NDVI and UAV NDVI correlation with wheat yield and grain N uptake were comparable. We found that neither GS NDVI nor UAV NDVI in-season data were particularly useful in the prediction of wheat grain protein content.

Author Contributions

Conceptualization, O.S.W. and J.M.M.; Methodology, O.S.W. and J.M.-C.; Investigation, J.M.-C. and C.A.J.; Data curation, O.S.W., E.N., R.L., E.O.A. and F.B.; Writing—original draft, E.N.; Writing—review and editing, O.S.W. and E.N.; Visualization, O.S.W.; Supervision, O.S.W. and J.M.-C.; Project administration, O.S.W. and J.M.M.; Funding acquisition, O.S.W. and J.M.M. All authors have read and agreed to the published version of the manuscript.

Funding

This work was funded in part by the Idaho Wheat Commission and the Idaho wheat producers.

Data Availability Statement

Not applicable.

Conflicts of Interest

The authors declare no conflict of interest.

References

  1. Walsh, O.S.; Belmont, K.M. Improving Nitrogen-Use Efficiency in Idaho Crop Production; University of Idaho Extension: Moscow, ID, USA, 2015. [Google Scholar]
  2. Walsh, O.S.; Girma, K. Environmentally smart nitrogen performance in Northern Great Plains’ spring wheat production systems. Int. J. Agron. 2016, 2016, 8969513. [Google Scholar] [CrossRef] [Green Version]
  3. Aula, L.; Omara, P.; Nambi, E.; Oyebiyi, F.B.; Raun, W.R. Review of active optical sensors for improving winter wheat nitrogen use efficiency. Agronomy 2020, 10, 1157. [Google Scholar] [CrossRef]
  4. Ondoua, R.N.; Walsh, O. Precision agriculture advances and limitations: Lessons to the stakeholders. Crops Soils. 2017, 50, 40–47. [Google Scholar] [CrossRef]
  5. Radoglou-Grammatikis, P.; Sarigiannidis, P.; Lagkas, T.; Moscholios, I. A compilation of UAV applications for precision agriculture. Comp. Net. 2020, 172, 107–148. [Google Scholar] [CrossRef]
  6. Walsh, O.S.; Shafian, S.; Marshall, J.M.; Jackson, C.; McClintick-Chess, J.R.; Blanscet, S.M.; Swoboda, K.; Thompson, C.; Belmont, K.M.; Walsh, W.L. Assessment of UAV based vegetation indices for nitrogen concentration estimation in spring wheat. Adv. Rem. Sens. 2018, 7, 71–90. [Google Scholar] [CrossRef] [Green Version]
  7. Reza, M.N.; Na, I.S.; Baek, S.W.; Lee, K.-H. Rice yield estimation based on K-means clustering with graph-cut segmentation using low-altitude UAV images. Biosyst. Eng. 2019, 177, 109–121. [Google Scholar] [CrossRef]
  8. Hassan, M.A.; Yang, M.; Rasheed, A.; Yang, G.; Reynolds, M.; Xia, X.; Xiao, Y.; He, Z. A rapid monitoring of NDVI across the wheat growth cycle for grain yield prediction using a multi-spectral UAV platform. Plant Sci. 2019, 282, 95–103. [Google Scholar] [CrossRef] [PubMed]
  9. Duan, T.; Chapman, S.; Guo, Y.; Zheng, B. Dynamic monitoring of NDVI in wheat agronomy and breeding trials using an Unmanned Aerial Vehicle. Field Crop. Res. 2017, 210, 71–80. [Google Scholar] [CrossRef]
  10. Zeng, L.; Peng, G.; Meng, R.; Man, J.; Li, W.; Xu, B.; Lv, Z.; Sun, R. Wheat yield prediction based on unmanned aerial vehicles-collected red–green–blue imagery. Rem. Sens. 2021, 13, 2937. [Google Scholar] [CrossRef]
  11. Veverka, D.; Chatterjee, A.; Carlson, M. Comparisons of sensors to predict spring wheat grain yield and protein content. Agron. J. 2021, 113, 2091–2101. [Google Scholar] [CrossRef]
  12. Zhou, X.; Kono, Y.; Win, A.; Matsui, T.; Tanaka, T.S. Predicting within-field variability in grain yield and protein content of winter wheat using UAV-based multispectral imagery and machine learning approaches. Plant Prod. Sci. 2021, 24, 137–151. [Google Scholar] [CrossRef]
  13. Wang, L.; Tian, Y.; Yao, X.; Zhu, Y.; Cao, W. Predicting grain yield and protein content in wheat by fusing multi-sensor and multi-temporal remote-sensing images. Field Crop. Res. 2014, 164, 178–188. [Google Scholar] [CrossRef]
  14. Ogaya, R.; Peñuelas, J. Experimental drought in a holm oak forest: Different photosynthetic response of the two dominant species, Quercus ilex and Phillyrea latifolia. Env. Exp. Bot. 2003, 50, 137–148. [Google Scholar] [CrossRef]
  15. Teixeira, A.A.; Mendes Júnior, C.W.; Bredemeier, C.; Negreiros, M.; Aquino, R.d.S. Evaluation of the radiometric accuracy of images obtained by a Sequoia multispectral camera. Engen. Agríc. 2020, 40, 759–768. [Google Scholar] [CrossRef]
  16. Naser, M.A.; Khosla, R.; Longchamps, L.; Dahal, S. Using NDVI to differentiate wheat genotypes productivity under dryland and irrigated conditions. Rem. Sens. 2020, 12, 824. [Google Scholar] [CrossRef] [Green Version]
  17. Walsh, O.S.; Marshall, J.; Nambi, E.; Shafian, S.; Jayawardena, D.; Jackson, C.; Lamichhane, R.; Owusu Ansah, E.; McClintick-Chess, J. Spring wheat yield and grain quality response to nitrogen rate. Agron. J. 2022, 114, 2562–2572. [Google Scholar] [CrossRef]
  18. Raun, W.R.; Solie, J.B.; Johnson, G.V.; Stone, M.L.; Lukina, E.V.; Thomason, W.E.; Schepers, J.S. In-season prediction of potential grain yield in winter wheat using canopy reflectance. Agron. J. 2001, 93, 131–138. [Google Scholar] [CrossRef] [Green Version]
  19. Walsh, O.S.; Marshall, J.; Jackson, C.; Nambi, E.; Shafian, S.; Jayawardena, D.M.; Lamichhane, R.; Ansah, O.E.; McClintick-Chess, J.R. Wheat yield and protein estimation with handheld-and UAV-based reflectance measurements. Agrosyst. Geosci. Environ. 2022, 5, e20309. [Google Scholar] [CrossRef]
  20. Fowler, D.; Brydon, J.; Darroch, B.; Entz, M.; Johnston, A. Environment, and genotype influence on grain protein concentration of wheat and rye. Agron. J. 1990, 82, 655–664. [Google Scholar] [CrossRef]
  21. Littell, R.; Milliken, G.; Stroup, W.; Wolfinger, R. SAS System for Mixed Models; SAS Institute. Inc.: Cary, NC, USA, 1996. [Google Scholar]
  22. Ya, N.N.C.; Lee, L.S.; Ismail, M.R.; Razali, S.M.; Roslin, N.A.; Omar, M.H. Development of rice growth map using the advanced remote sensing techniques. In Proceedings of the International Conference on Computer and Drone Applications (IConDA), Kuching, Malaysia, 19–21 December 2019. [Google Scholar]
  23. Caturegli, L.; Gaetani, M.; Volterrani, M.; Magni, S.; Minelli, A.; Baldi, A.; Brandani, G.; Mancini, M.; Lenzi, A.; Orlandini, S. Normalized Difference Vegetation Index versus Dark Green Colour Index to estimate nitrogen status on bermudagrass hybrid and tall fescue. Int. J. Rem. Sens. 2020, 41, 455–470. [Google Scholar] [CrossRef]
  24. Brown, B.; Walsh, O.S. Planting Dates in Wheat Production; University of Idaho Extension: Moscow, ID, USA, 2016. [Google Scholar]
  25. Thiry, D.; Sears, R.G.; Shroyer, J.P.; Paulsen, G.M. Planting date effects on tiller development and productivity of wheat. Kans. Agric. Exp. St. Res. Rep. 2002, 12, 96. [Google Scholar]
  26. Kiersten Wise, B.J.; Mansfield, C.; Krupke, C. Managing Wheat by Growth Stage; ID 422. Purdue Extension; Purdue University: West Lafayette, IN, USA, 2011. [Google Scholar]
  27. Miller, T.D. Growth stages of wheat. Better crops with plant food. Potash Phosphate Inst. 1992, 76, 12. [Google Scholar]
  28. Walsh, O.S.; Klatt, A.; Solie, J.; Godsey, C.; Raun, W. Use of soil moisture data for refined GreenSeeker sensor-based nitrogen recommendations in winter wheat (Triticum aestivum L.). Precis. Agric. 2013, 14, 343–356. [Google Scholar] [CrossRef] [Green Version]
  29. Zhang, J.; Liu, X.; Liang, Y.; Cao, Q.; Tian, Y.; Zhu, Y.; Cao, W.; Liu, X. Using a portable active sensor to monitor growth parameters and predict grain yield of winter wheat. Sensors 2019, 19, 1108. [Google Scholar] [CrossRef] [Green Version]
  30. Osborne, S.L. Utilization of existing technology to evaluate spring wheat growth and nitrogen nutrition in South Dakota. Commun. Soil Sci. Plant. Anal. 2007, 38, 949–958. [Google Scholar] [CrossRef]
  31. Feng, M.; Yang, W. Changes in NDVI and yield of winter wheat cultivars with different plant types. Zhongguo Shengtai Nongye Xuebao/Chinese J. Eco-Agric. 2011, 19, 87–92. [Google Scholar] [CrossRef]
  32. Freeman, K.; Raun, W.; Johnson, G.; Mullen, R.; Stone, M.; Solie, J. Late-season prediction of wheat grain yield and grain protein. Commun. Soil Sci. Plant. Anal. 2003, 34, 1837–1852. [Google Scholar] [CrossRef]
  33. Girma, K.; Martin, K.; Anderson, R.; Arnall, D.; Brixey, K.; Casillas, M.; Chung, B.; Dobey, B.; Kamenidou, S.; Kariuki, S. Mid-season prediction of wheat-grain yield potential using plant, soil, and sensor measurements. J. Plant Nutr. 2006, 29, 873–897. [Google Scholar] [CrossRef] [Green Version]
  34. Moges, S.; Raun, W.; Mullen, R.; Freeman, K.; Johnson, G.; Solie, J. Evaluation of green, red, and near infrared bands for predicting winter wheat biomass, nitrogen uptake, and final grain yield. J. Plant Nutr. 2005, 27, 1431–1441. [Google Scholar] [CrossRef]
  35. Inman, D.; Khosla, R.; Reich, R.; Westfall, D. Normalized difference vegetation index and soil color-based management zones in irrigated maize. Agron. J. 2008, 100, 60–66. [Google Scholar] [CrossRef]
  36. Stone, M.; Solie, J.; Raun, W.; Whitney, R.; Taylor, S.; Ringer, J. Use of spectral radiance for correcting in-season fertilizer nitrogen deficiencies in winter wheat. Transact. Amer. Soc. Agric. Eng. 1996, 39, 1623–1631. [Google Scholar] [CrossRef]
  37. Reeves, D.; Mask, P.; Wood, C.; Delaney, D. Determination of wheat nitrogen status with a hand-held chlorophyll meter: Influence of management practices. J. Plant Nutr. 1993, 16, 781–796. [Google Scholar] [CrossRef]
  38. Sembiring, H.; Lees, H.; Raun, W.; Johnson, G.; Solie, J.; Stone, M.; DeLeon, M.; Lukina, E.; Cossey, D.; LaRuffa, J.; et al. Effect of growth stage and variety on spectral radiance in winter wheat. J. Plant Nutr. 2000, 23, 141–149. [Google Scholar] [CrossRef]
  39. Cao, Q.; Miao, Y.; Feng, G.; Gao, X.; Li, F.; Liu, B.; Yue, S.; Cheng, S.; Ustin, S.L.; Khosla, R.J. Active canopy sensing of winter wheat nitrogen status: An evaluation of two sensor systems. Comp. Electron. Agric. 2015, 112, 54–67. [Google Scholar] [CrossRef]
  40. Lukina, E.; Stone, M.; Raun, W. Estimating vegetation coverage in wheat using digital images. J. Plant Nutr. 1999, 22, 341–350. [Google Scholar] [CrossRef]
  41. Walsh, O.S.; Torrion, J.A.; Liang, X.; Shafian, S.; Yang, R.; Belmont, K.M.; McClintick-Chess, J.R. Grain yield, quality, and spectral characteristics of wheat grown under varied nitrogen and irrigation. Agrosyst. Geosci. Environ. 2020, 3, e20104. [Google Scholar] [CrossRef]
  42. Walsh, O.S.; Christiaens, R. Urea, ESN, and urea–ESN blends performed equally well as nitrogen sources for spring wheat. Crops Soils. 2014, 47, 36–41. [Google Scholar] [CrossRef]
  43. Wang, C.; Feng, M.-C.; Yang, W.-D.; Ding, G.-W.; Sun, H.; Liang, Z.-Y.; Xie, Y.-K.; Qiao, X.-X. Impact of spectral saturation on leaf area index and aboveground biomass estimation of winter wheat. Spectro. Let. 2016, 49, 241–248. [Google Scholar] [CrossRef]
  44. Jia, L.; Yu, Z.; Li, F.; Gnyp, M.; Koppe, W.; Bareth, G.; Miao, Y.; Chen, X.; Zhang, F. Nitrogen status estimation of winter wheat by using an Ikonos satellite image in the north China plain. In Computer and Computing Technologies in Agriculture; Li, D.V., Chen, Y., Eds.; Springer: Berlin/Heidelberg, Germany, 2012; Volume 369, pp. 174–184. [Google Scholar]
  45. Ren, J.; Chen, Z.; Zhou, Q.; Tang, H. Regional yield estimation for winter wheat with MODIS-NDVI data in Shandong, China. Int. J. Appl. Earth Observ. Geoinform. 2008, 10, 403–413. [Google Scholar] [CrossRef]
  46. Benincasa, P.; Antognelli, S.; Brunetti, L.; Fabbri, C.A.; Natale, A.; Sartoretti, V.; Modeo, G.; Guiducci, M.; Tei, F.; Vizzari, M. Reliability of NDVI derived by high resolution satellite and UAV compared to in-field methods for the evaluation of early crop N status and grain yield in wheat. Exper. Agric. 2018, 54, 604–622. [Google Scholar] [CrossRef]
Figure 1. 3D Robotics 8X+ octocopter equipped with MicaSense Red Edge™ 3 Multispectral Camera.
Agronomy 13 00207 g001
Figure 2. Relationship between Normalized Difference Vegetative Index (NDVI) at Feekes 5 (a) and Feekes 10 (b) growth stages collected using the GreenSeeker (GS) sensor and the Unmanned Aerial Vehicle (UAV) 3D Robotics 8X+ octocopter equipped with MicaSense Red Edge™ 3 Multispectral Camera for 14 site-years in Idaho, 2015–2017.
Agronomy 13 00207 g002
Figure 3. Relationship between Normalized Difference Vegetative Index (NDVI) at Feekes 5 (a) and Feekes 10 (b) growth stages collected using the GreenSeeker (GS) sensor and spring wheat grain yield (kg ha−1) for fourteen site-years in Idaho, 2015–2017.
Agronomy 13 00207 g003
Figure 4. Relationship between Normalized Difference Vegetative Index (NDVI) at Feekes 5 (a) and Feekes 10 (b) growth stages collected using the Unmanned Aerial Vehicle (UAV) 3D Robotics 8X+ octocopter equipped with MicaSense Red Edge™ 3 Multispectral Camera and spring wheat grain yield (kg ha−1) for 14 site-years in Idaho, 2015–2017.
Agronomy 13 00207 g004
Figure 5. Relationship between Normalized Difference Vegetative Index (NDVI) at Feekes 5 (a) and Feekes 10 (b) growth stages collected using the GreenSeeker (GS) sensor and spring wheat grain N uptake (kg ha−1), for fourteen site-years in Idaho, 2015–2017.
Agronomy 13 00207 g005
Figure 6. Relationship between Normalized Difference Vegetative Index (NDVI) at Feekes 5 (a) and Feekes 10 (b) growth stages collected using the Unmanned Aerial Vehicle (UAV) 3D Robotics 8X+ octocopter equipped with MicaSense Red Edge™ 3 Multispectral Camera and spring wheat grain N uptake (kg ha−1) for 14 site-years in Idaho, 2015–2017.
Agronomy 13 00207 g006
Figure 7. Relationship between Normalized Difference Vegetative Index (NDVI) at Feekes 5 (a) and Feekes 10 (b) growth stages collected using the GreenSeeker (GS) sensor and spring wheat grain protein content (%), for fourteen site-years in Idaho, 2015–2017.
Agronomy 13 00207 g007
Figure 8. Relationship between Normalized Difference Vegetative Index (NDVI) at Feekes 5 (a) and Feekes 10 (b) growth stages collected using the Unmanned Aerial Vehicle (UAV) 3D Robotics 8X+ octocopter equipped with MicaSense Red Edge™ 3 Multispectral Camera and spring wheat grain protein content (%) for 14 site-years in Idaho, 2015–2017.
Agronomy 13 00207 g008
Table 1. Pearson correlation coefficients and probability > |r| for spring wheat grain yield, grain N uptake, and grain protein content with GS NDVI and UAV NDVI at Feekes 5 and Feekes 10 for 14 site-years in Idaho, 2015–2017.
ParameterGS NDVI,
Feekes 5
GS NDVI,
Feekes 10
UAV NDVI,
Feekes 5
UAV NDVI,
Feekes 10
Grain yield0.56 *
<0.0001
0.34 *
<0.0001
0.66 *
<0.0001
0.52 *
<0.0001
Grain N uptake0.51 *
<0.0001
0.36 *
<0.0001
0.61 *
<0.0001
0.47 *
<0.0001
Grain protein−0.03
0.68
0.14
0.02
0.001
0.99
0.04
0.47
*—significant at 0.05 level, GS NDVI and UAV NDVI stand for Normalized Vegetative Index obtained with GreenSeeker and the Unmanned Aerial Vehicle, respectively.
Disclaimer/Publisher’s Note: The statements, opinions and data contained in all publications are solely those of the individual author(s) and contributor(s) and not of MDPI and/or the editor(s). MDPI and/or the editor(s) disclaim responsibility for any injury to people or property resulting from any ideas, methods, instructions or products referred to in the content.

