Abstract
A groundwater mound (or pressure mound) is defined as a volume of fluid dominated by viscous flow contained within a sediment volume where the dominant fluid flow is by Knudsen Diffusion. High permeability self-sealing groundwater mounds can be created as part of a sustainable urban drainage scheme (SUDS) using infiltration devices. This study considers how they form, and models their expansion and growth as a function of infiltration device recharge. The mounds grow through lateral macropore propagation within a Dupuit envelope. Excess pressure relief is through propagating vertical surge shafts. These surge shafts can, when they intersect the ground surface result, in high volume overland flow. The study considers that the creation of self-sealing groundwater mounds in matrix supported (clayey) sediments (intrinsic permeability = 10–8 to 10–30 m3 m–2 s–1 Pa–1) is a low cost, sustainable method which can be used to dispose of large volumes of storm runoff (<20→2,000 m3/24 hr storm/infiltration device) and raise groundwater levels. However, the inappropriate location of pressure mounds can result in repeated seepage and ephemeral spring formation associated with substantial volumes of uncontrolled overland flow. The flow rate and flood volume associated with each overland flow event may be substantially larger than the associated recharge to the pressure mound. In some instances, the volume discharged as overland flow in a few hours may exceed the total storm water recharge to the groundwater mound over the previous three weeks. Macropore modeling is used within the context of a pressure mound poro-elastic fluid expulsion model in order to analyze this phenomena and determine (i) how this phenomena can be used to extract large volumes of stored filtered storm water (at high flow rates) from within a self-sealing high permeability pressure mound and (ii) how self-sealing pressure mounds (created using storm water infiltration) can be used to provide a sustainable low cost source of treated water for agricultural, drinking, and other water abstraction purposes.
Contents
- 1.0
- Introduction
- 2.0
- Calculation Methodology used to Interpret Field Observations
- 2.1
- Overland Flow Rates
- 2.2
- Calculation of Recharge Volumes
- 2.3
- Design Storms
- 2.4
- Pressure Loading
- 2.5
- Intrinsic Permeability
- 2.5.1
- Vertical and Horizontal Permeability
- 2.6
- Anisotropy
- 3.0
- Fluid Migration within a Groundwater Mound
- 3.1
- Analysis of Standing Water within a groundwater Mound
- 3.1.1
- Field Observations
- 3.1.2
- Interpreted Pore Throat Radii
- 3.2
- Pore Throat Reduction Mechanisms within the Groundwater Mound
- 3.2.1
- Pore Throat Reduction Associated with Bridging
- 3.2.2
- Flow Cessation Associated with Toroidal Bridges
- 3.2.2.1
- Toroidal Bridges in Unconsolidated Sand
- 3.2.2.2
- Toroidal Bridges in Winnowed Sand within a “natural pipe” derived from Greenloaning Till
- 3.2.2.3
- Toroidal Bridge Formation in Propagating Macropores within Greenloaning Lodgment Till
- 3.2.3
- Flow Cessation Associated with Hydration of Inter-Layer Porosity
- 3.2.4
- Other Flow Cessation Factors
- 3.2.5
- Standing Water-Model Summary
- 3.3
- Macropore Formation
- 3.3.1
- Sand Accumulations within Macropores/Natural Pipes
- 3.3.2
- Intrinsic Permeability within Macropores/Natural Pipes
- 3.3.3
- Flow Regimes around a Macropore
- 3.3.4
- Flow from the Macropore into the Surrounding Formation
- 4.0
- Groundwater Mound Envelope
- 4.1
- Pore Tortuosity at the Mound Boundary
- 4.2
- Equilibrium Mound Widths
- 4.3
- Groundwater Mound Growth as a Function of Time
- 4.4
- Impact of Pressure Losses on Groundwater Mound Diameter
- 4.5
- Seepage Volumes Associated with Groundwater Mounds
- 4.5.1
- Groundwater Mound Storage Volumes
- 4.5.2
- Seepage Volumes
- 5.0
- Modeling a Groundwater Mound for Storage
- 5.1
- Upper Surface of the Groundwater Mound: Dupuit Model
- 5.2
- Upper Surface of the Groundwater Mound: Macropore Propagation Model
- 5.3
- Lower Surface of the Groundwater Mound: Dupuit Model
- 5.4
- Macropore Analysis of the Lower Surface of the Groundwater Mound
- 5.5
- 3D Mound Volume and Assessment of Potential Resource
- 5.6
- Net Storage Volume
- 5.6.1
- Changes in Storage Capacity with Time
- 5.7
- Potential Resource
- 6.0
- Extraction of Water from a Groundwater Mound
- 6.1
- Water Quality
- 7.0
- Comparison of Observed Results with a Traditional Groundwater Mound Model
- 7.1
- Expected Groundwater Mound Behavior: Arid Environment
- 7.2
- Expected Groundwater Mound Behavior: Modeling
- 8.0
- Conclusions
- Acknowledgements
- Appendix 1
- A.1
- Sustainable Urban Drainage Systems
- A.2
- Location Map and Details of the Greenloaning Study Area
- References
- List of Principal Abbreviations
1. Introduction
Studies [1,2] of drainage failure associated with a Sustainable Urban Drainage Scheme (SUDS (Appendix 1, Appendix A.1)) at Greenloaning, Perthshire, Scotland, UK (Appendix 1, Appendix A.2), have identified that the infiltrating water is held in a sealed groundwater mound which does not dissipate over time into the underlying water table. Drainage failure events result [1,2,3] in high volume, high flow rate, overland flow (Figure 1), and can lead to down slope flooding. These failure events partially drain the groundwater mounds. High volume, high flow rate, overland flow discharging from a groundwater mound indicates that the groundwater mound can both store water and act as a high permeability reservoir or aquifer [1,2,3]. The infiltration devices at Greenloaning were placed in boulder clay (lodgment till) [2,3].
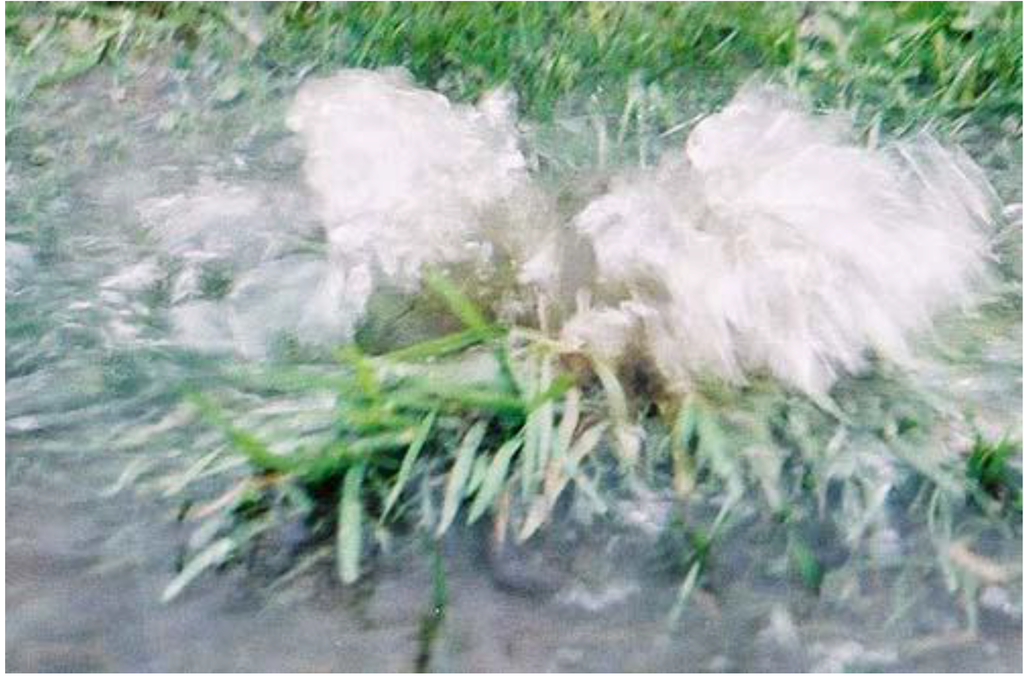
Figure 1.
Water discharging through a vertical surge shaft from a groundwater mound (Zone R1, Greenloaning, Scotland, UK, 24/9/06).
Groundwater mounds in impermeable sediments (clays and sandy clays) are poro-elastic pressure mounds [3,4]. Changes in the water level in the groundwater mound are associated with variations in the flow regimes at the mound’s boundary. The flow regime across the mounds boundary cyclically changes from viscous flow (during recharge) to Knudsen diffusion. The flow regime defines the size and shape of the groundwater mound [2,3,4]. The pressurizing fluid (water) migrates into the sediment pores by displacing the dominant fluid in the sediment pores (air) [2,5,6]. The rate of water infiltration into the groundwater mound is controlled by the rate of air displacement, both within the mound and at the mound’s boundaries [2,5,6]. In the Greenloaning example, the permeability (and flow rate) across the mound boundary drops by between five and nine orders of magnitude [2,3].
Groundwater mounds (associated with infiltration devices) in impermeable sediments follow a cyclic three stage pattern of growth [3,4]. In the initial recharge period, the mound grows slowly by viscous flow through the sediment matrix [3]. Once the water levels in the infiltration device reach a critical level, a rapid dispersion of the infiltrating fluid occurs through macropores/natural pipes [3]. Following the cessation of recharge the water body within the groundwater mound is held in place by the change in flow regime at the mounds boundaries [2]. This results in a flow rate for the descending groundwater mound which is controlled by Knudsen diffusion [3,4]. This poro-elastic cycle frequently results in high levels (<0.5→3.0 m) of static (standing) water in infiltration devices placed in glacial clays [1,2] or in “made soils” constructed from glacial clays [7]. The standing water represents part of the upper surface of the groundwater mound. Standing water is associated with infiltration into low permeability/impermeable sediments [2].
Artificial pressure mounds can have water or gas as the pressurizing fluid [3,8,9,10,11,12]. In a pressure mound formed by infiltration the pressurizing fluid is water and the dominant fluid in the adjacent sediments is air. This study analyses: (i) how the groundwater mounds form; (ii) how clayey sediments can be used to accommodate large volumes of storm water runoff; and (iii) how this stored water may be abstracted. The field observations from Greenloaning (Appendix 1, Appendix A.2) are used to develop a model, which can be used in two situations: (i) the disposal of large volumes of storm water runoff into an impermeable clay sequence; and (ii) the storage and recovery of large volumes of water from groundwater mounds contained within a clay sequence.
2. Calculation Methodology Used to Interpret Field Observations
2.1. Overland Flow Rates
The Manning Equation [13] was used to calibrate the Manning Roughness (Figure 2) at a down slope road drainage gully (surrounded by an asphalt tarmac surface, G1 (Figure A1)) with a surveyed, designed and constructed capacity of 0.079 m3 s–1 [1]. The flow rate, QD (m3 s–1) was estimated [13] as:
where A1 = cross sectional area of flow (m2); S = longitudinal gradient of the flow (m m–1); Nm = the Manning Roughness (calibrated at 0.15: QD = 0.079 m3 s–1); RH = the hydraulic radius (m) = [A1]/[Pw]; and Pw = wetted perimeter of flow, m. QD was calibrated (Figure 2) during a storm event where the overland flow overtopped the road gully [1]. The overland flow volume, V, is the time integral of QD.
QD = [A1RH(2/3)S0.5]/[Nm]
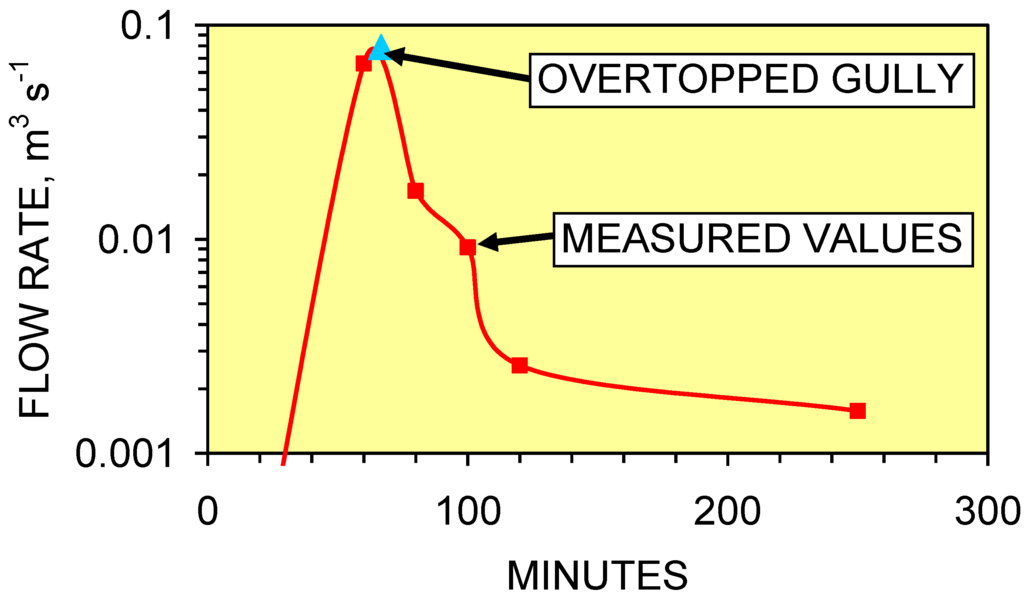
Figure 2.
Hydrograph (m3 s–1) for seepage event. Water flow to gully, G1 (Figure A1), Date: 24/10/05.
2.2. Calculation of Recharge Volumes
The recharge volumes, Vr (m3) were calculated using the Rational Method [1,14] as:
where Ai = surface area of a surface type, i, whose runoff feeds the drains leading to the soakaway (m2); Fi = surface runoff factor for the surface type, i, 0 ≤ Fi ≤ 1.0; R = rainfall during storm (m3/time interval (e.g., 24 hrs)). Surface runoff factors vary with surface type, temperature (evaporation), and degree of water saturation [14]. They provide an estimate of recharge volumes arriving in the soakaway. The surface runoff factors used [1] are: roads and asphalt surfaces = 88%; house roofs = 88%; public gardens = 53%; house gardens = 53%; play areas = 63%. Rainfall is recorded at the Strathallan weather station [1]. The runoff surface areas associated with each soakaway (Figure A1) are: (i) D1, roads = 607 m2; public gardens = 2,952 m2; play areas = 150 m2; (ii) D2, roads = 167 m2; roofs = 178 m2; gardens = 867 m2; and (iii) D3, roads = 1,480 m2; roofs = 1,571 m2; gardens = 2,747 m2 [1].
Vr = Σ[AiFiR]
2.3. Design Storms
The design storm rainfall for the region is defined by the Institute of Hydrology [15,16]. The 24 hour design storms with a return period of: 1 year = 47 mm; 5 years = 62 mm; 10 years = 71 mm; 30 years = 3 mm; 50 years = 92 mm and 100 years = 104 mm [1].
2.4. Pressure Loading
The total pressure load (PLoad, Pa) associated with an infiltrating water body can be estimated [3] as:
where g = acceleration due to gravity, m s–2; dw = density of water, kg m–3. A linkage between the volume of overland flow discharged through the seepage zones (R1 to R3 (Figure A1)) and the total pressure load associated with accreting groundwater mounds has been established [3].
PLoad = Vr g dw
2.5. Intrinsic Permeability
The falling head method is used to calculate permeability measurements for infiltration device design [15,17]. This involves digging a pit (e.g., 1 m × 1 m × 1 m to 3 m × 3 m × 3 m), or drilling/augering a borehole (e.g., 0.15 m diameter × 1 to 5 m), or digging an inspection hole 0.3 m × 0.3 m × 0.3 m [15,17]. The pit/hole/borehole is then filled with water [15,17]. A record of water depth vs. time is collected [15,17]. These tests allow a vertical permeability (kv) and a horizontal permeability (kh) to be defined [18]. The infiltration rate through a surface, Q (m3 m–2 s–1) is calculated [2,3,4,19] as:
where k = intrinsic permeability (m3 m–2 s–1 Pa–1) and P = driving force (Pa). The equation can be rewritten [20] as:
where K = hydraulic conductivity (m3 m–2 s–1 h–1) and h = the water depth (m); h of 1 m approximates to (gdw) Pa. In this study intrinsic permeability is used in preference to hydraulic conductivity, though as demonstrated by Equations 4 and 5 the two terms can be readily translated from one to the other, e.g., K = kP/h. Permeability values obtained by this method from saturated soil during the winter may be lower than permeability values obtained during dry summer periods.
Q = kP
Q = Kh
2.5.1. Vertical and horizontal permeability
The water depth decline rate within an infiltration device (or test pit) during infiltration is a function of both vertical permeability (kv) and horizontal permeability (kh) [18]. The intrinsic permeabilities associated with a drop in water level in the test pit from an elevation (m), E1, to an elevation (m), E2, during a time interval, t (s), can be estimated by solving:
where E1 and E2 are measured relative to the base of the test pit, and the base of the test pit has an elevation of 0 m; Vt = the volume of water (m3) infiltrated through the sides and base of the test pit during the time interval, t; Ab = the area of the base of the test pit (m2); As = average area (m2) of the sides of the test pit between the base of the pit and an elevation (E3) calculated as E3 = [0.5(E1 + E2)]; Pb = E3gdw; Ps = 0.5(E3gdw). dw varies with temperature, salinity and water composition [21]. Equation 6 applies to both an infiltration test pit and the physical operation of an infiltration device.
Qt (m3 s–1) = Vt/t = kvPbAb + khPsAs
2.6. Anisotropy
The anisotropy of the infiltration device (AD) is a dimensionless ratio where:
AD = kh/kv
Conventional infiltration device design [15,17] assumes that AD = 1.0 and does not change with time. Figure 3 illustrates the effect of keeping kv constant and varying AD by varying kh. The anisotropy affects the shape of the groundwater mound. The width of the groundwater mound increases as the anisotropy increases.
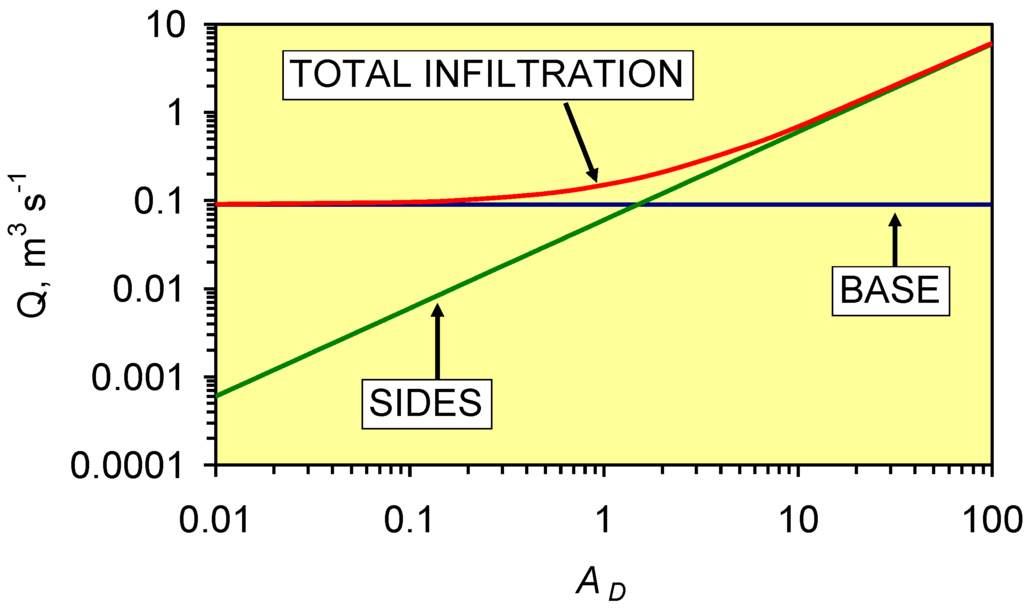
Figure 3.
Impact of anisotropy of the infiltration device (AD) on the infiltration rate (Q). Base Case: kh = 10–6 m3 s–1 m–2 Pa–1; kv = 10–6 m3 s–1 m–2 Pa–1, AD = 1.0; Water Depth: 1 m (constant); Device dimensions = 3 m × 3 m × 3 m; Basal Surface Area = 9 m2; Area of side of the infiltration device which is in contact with the water = 12 m2. kv remains constant; Base = flow rate through the device base; Sides = flow rate through device’s side.
3. Fluid Migration within a Groundwater Mound
The groundwater mound migrates both downwards and laterally by being able to displace air from the pore volume [2,5,6]. Along the upper margin of a laterally accreting wetting front, air is displaced by water migrating in the same direction (Figure 4). Water can only move into a pore volume along the base of the groundwater mound, if it can displace an equivalent volume of air. The water is migrating downwards, while the displaced air migrates upwards through the groundwater mound (Figure 4). The principal control on the downward migration of the groundwater mound (and fluid migration within the groundwater mound) is the ability of the displaced air to migrate up through the mound.
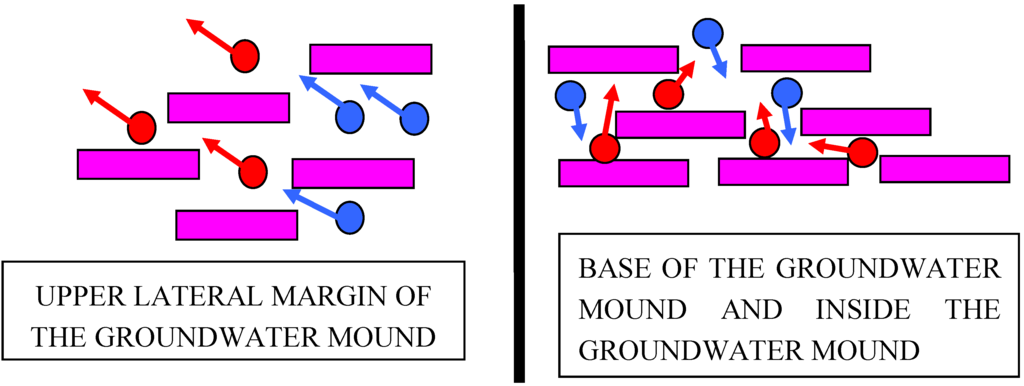
Figure 4.
Molecular flow through inter-particle porosity between clay platelets (purple) [2,5,6]. Water molecules/bubbles/drops (blue) and air molecules/bubbles (red). Arrows indicate flow direction.
In permeable sediment, kh and kv control the water depth within an infiltration device as a function of time. Figure 5 illustrates the decline in water depth, where (i) kh = kv and (ii) [kh = 0, kv > 0] and [kh > 0, kv = 0]. A decline in kv to 0 with time will result in the rate of water depth decline decreasing with time. The water depth will (given sufficient time) fall below the base of the infiltration device as the groundwater mound descends [15,17,22,23,24,25,26,27,28,29,30].
In clays, pore blockage by occluded air bubbles (or another mechanism) [5] commonly results in a rapid initial decline in water levels within the infiltration device, followed by a relatively abrupt termination in flow from the device. This results in the presence of standing water (static water) within the infiltration devices (Figure 6) [2,7]. The inset photograph (Figure 6) shows standing water in an inspection chamber. A thin capillary fringe has developed above the standing water. The section of the chamber above the air-water contact (AWC) is dry demonstrating that the water level is static. This water level is the upper surface of a static groundwater mound.
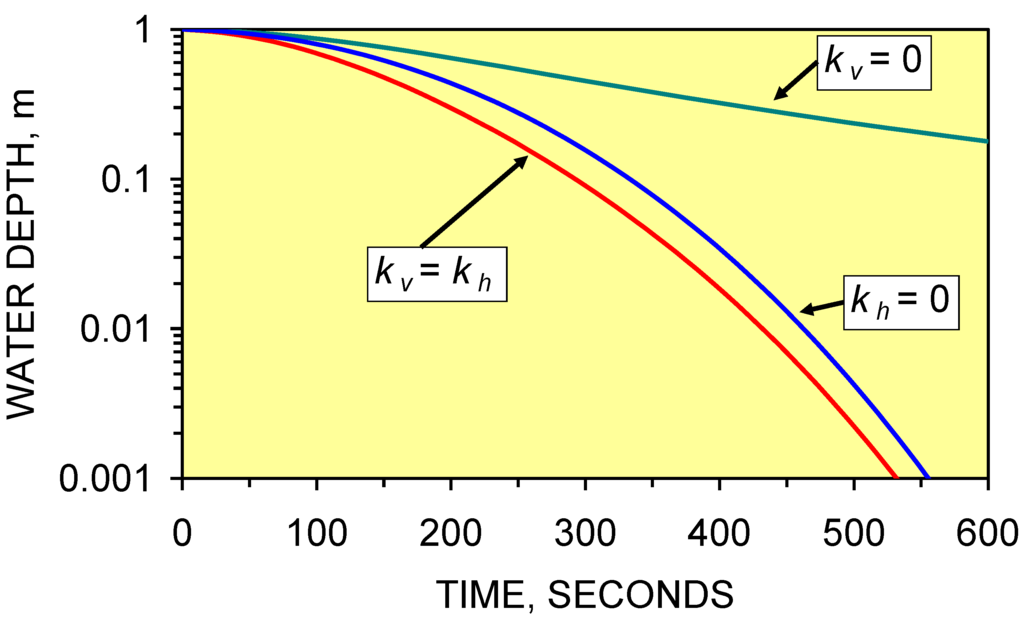
Figure 5.
Impact of Permeability on Infiltration Device Water Depth as a Function of Time. Base Case: kh = 10–7 m3 s–1 m–2 Pa–1; kv = 10–7 m3 s–1 m–2 Pa–1, AD = 1.0; Water Depth (at t = 0) = 1 m; Device dimensions = 3 m × 3 m × 3 m.
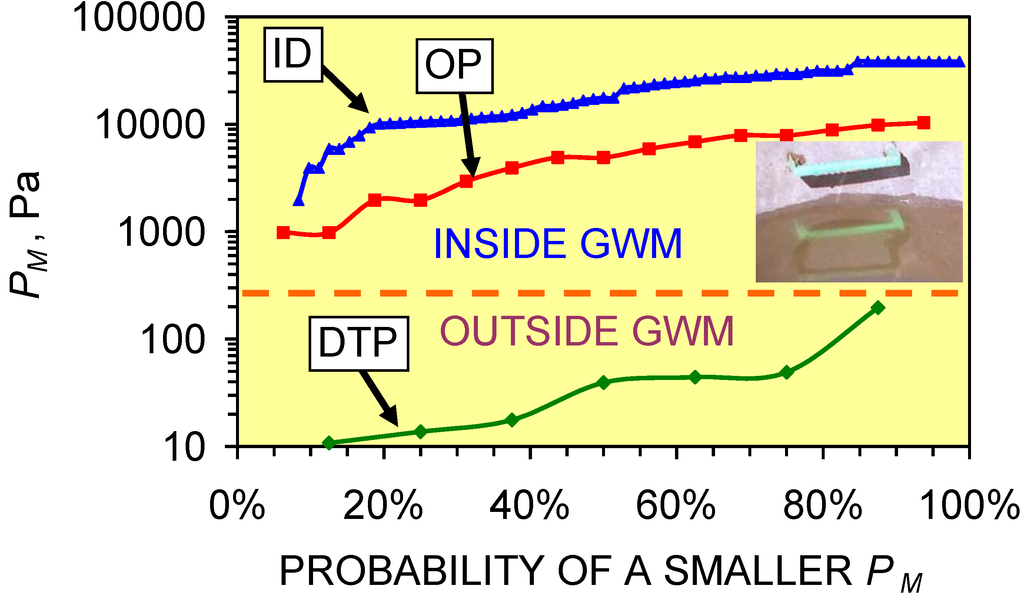
Figure 6.
Greenloaning: Probability distribution for PM. ID = infiltration device (n = 56); OP = observation pit within the GWM; DTP = dry test pit, clay (n = 7); GWM = groundwater mound; Measurement Dates: 24/6/04–25/1/08. Green bars in the inset photograph are 300 mm long.
3.1. Analysis of Standing Water within a Groundwater Mound
The presence of static water (standing water) in an infiltration device (placed in clayey soils) can provide information about the pore throat radii within the sediment. Membrane studies have established that a minimum driving force (Pa), or pressure, PM, is required to initiate viscous flow [19]. When the driving force, P, is less than PM the sediment is effectively impermeable [19] and the flow type switches from viscous flow to Knudsen diffusion, or to another form of diffusion [19]. PM is defined [1,2,3,4,14,19] as:
where σ = surface tension of water-air interface, Nm–1 [21]; σ varies with temperature [21]; r = pore throat radii, microns (10–6 m) when PM is expressed in bar (1 bar = 105 Pa)[19]; θa = contact angle of the advancing meniscus; θb = contact angle of the receding meniscus; and θ = contact angle of the meniscus. The wetting angle between water and mineral matter is small and cos θ may be approximated as 1.0 [14]. Low concentrations of flocculated, or suspended, or colloidal clay, or surfactant, in an advancing water front can reduce θ [31,32].
PM = 2 σ/r (cos θa – cos θb) or 2 σ/r (cos θ)
PM represents a critical switch, which can abruptly increase, or decrease, the flow rate through a sediment by many orders of magnitude [3,4], by adjusting the sediments intrinsic permeability (Equation 4) when the driving force, P, (e.g., water depth in the infiltration device) falls below PM. At Greenloaning, the switch changes the intrinsic permeability from between 10–5 and 10–9 m3 m–2 s–1 Pa–1 to about 10–14 m3 m–2 s–1 Pa–1 [3] or vice versa. The switch is sometimes termed a snap-off point [33].
3.1.1. Field observations
The static water levels (in the soakaways at Greenloaning) vary between <0.5 and 3 m (Figure 6) and vary between storms. The static AWC represents the top of the groundwater mound in the infiltration device (between recharge events). Its presence signifies an elevated groundwater mound in the surrounding sediment [1,2]; where PM = dwgh; h = [zj – z0]; z0 = elevation of the base of the infiltration device, mamsl; zj = elevation of the AWC in the infiltration device, mamsl. Field observations were made of h in test pits (located outside the groundwater mound), observation pits located within a groundwater mound, and static water levels within soakaways. Each datum value was used to calculate a value of PM. The data values were ranked in ascending order. A probability of a smaller value occurring was assigned to each observation as (Rank Number)/(total number of samples + 1) [1]. This data (Figure 6) indicates that PM associated with a groundwater mound is higher than PM in the sediment outside the groundwater mound.
3.1.2. Interpreted pore throat radii
A pore radius of 10–5 m represents a first approximation for the boundary (PM) between viscous flow and Knudsen Diffusion [21]. The change in PM inside and outside the groundwater mounds (Figure 5) is either due to a change in pore throat radii, or a change in the contact angle of the advancing meniscus (Equation 8). An advancing surfactant front has a net contact angle of about 80o [31]. The difference between: (i) the median PM in the test pits of 100 Pa (water depth = 0.01 m) and (ii) the median PM in the infiltration devices of 14846 Pa (water depth = 1.5 m), is too large to be accounted for (Equation 8) by a change in θ from about 80o to 0o (where r = 10–4 m, σ = 74.23 10–3 Nm–1 at a temperature of 10 °C). This change can occur if r is reduced to 10–7 m. Therefore, the static AWC is interpreted (Figure 7) as representing a reduction in r, within the groundwater mound. The presence of the static AWC, results from a switching of the flow type, along the boundaries of the mound, from viscous flow to Knudsen diffusion (or another form of diffusion).
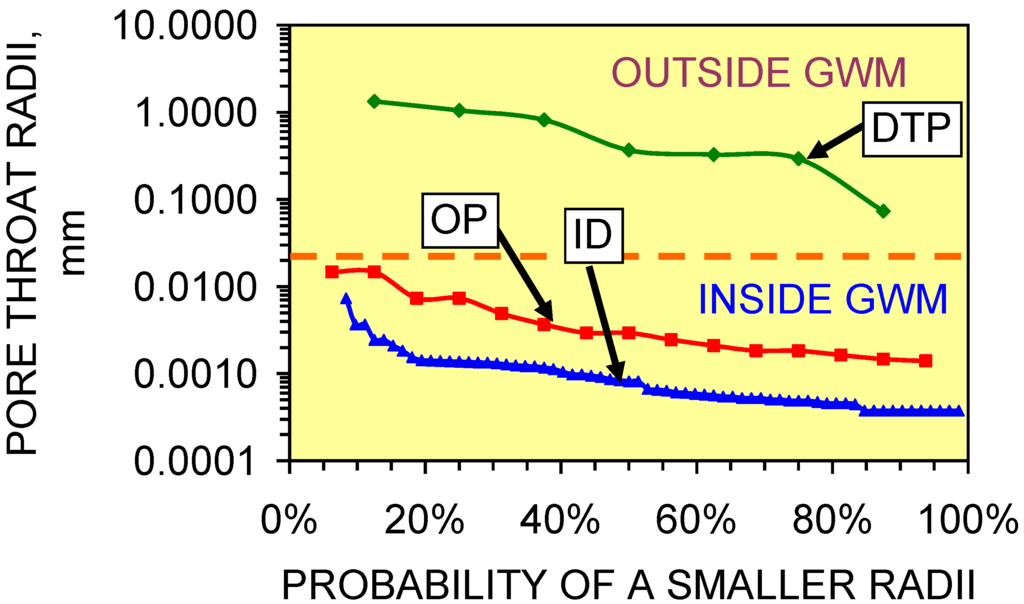
Figure 7.
Measured pore throat radii (mm) in the groundwater mounds at Greenloaning. ID = infiltration device; OP = observation pit; DTP = dry test pit; GWM = groundwater mound; Measurement Dates: 24/6/04–25/1/08; Data Source: Figure 5; Calculation Method: Equation 8; cos θ = 1.0; Temperature = 25 °C (298 K); surface tension = 71.99 mN m–1 [39]. Greenloaning annual temperature range = <258 K–>308 K.
3.2. Pore Throat Reduction Mechanisms within the Groundwater Mound
Lodgment Till forms immediately below a debris-laden glacier [34,35]. The constituent trimorphic and tetramorphic (swelling) clay particles are composed of nano-plates (7–1.5 nm thick; <2,000 nm diameter [36]) separated by inter-layer spaces ((inter-layer porosity, φe), typically <0.5–2.1 nm thick) containing exchangeable cations [37,38]. Inter-particle porosity (φ), separating the clay particles has been classified [39] into: (i) micropores–diameter = <2 nm; (ii) mesopores–diameter = 2–50 nm; and (iii) macropores–diameter = >50 nm.
3.2.1. Pore throat reduction associated with bridging
In permeable sediment, the pore throat radii are sufficiently large to allow a counter flow of air and water (Figure 8a). The reduced radii (Figure 7) associated with a static AWC may be a result of pore bridging (Figure 8c), or partial blockage (Figure 8b) by air (or water).
Figure 8a illustrates the design assumptions for an infiltration device placed in permeable sediment [15,17]. Figure 8b illustrates the situation where the pore throat diameters are sufficient to allow the unimpeded vertical flow of air by viscous flow but are insufficient to allow a downward migration of water by viscous flow. Downward water flow rates are controlled by the upward flow rates of air. The upward flow of air is by Knudsen diffusion or diffusion [5,6,19,33]. Pendular rings form by air bubbles, or water droplets, adhering to the side of grains. Figure 8c illustrates the situation where the reduction in pore throat diameters prevents viscous flow by, either, air, or water, (or clay expansion) and all flow is by Knudsen diffusion or diffusion [5,6,11,33].
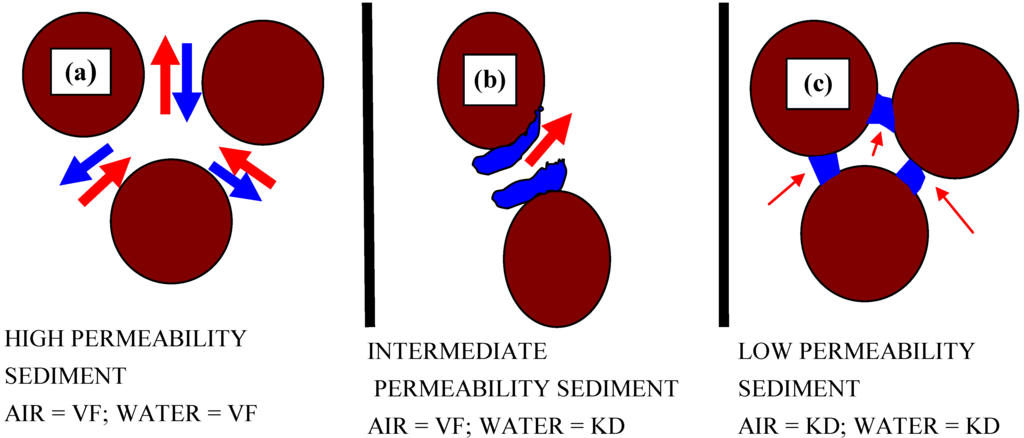
Figure 8.
Molecular and bubble flow patterns through the base of a descending groundwater mound. (a) Viscous flow through inter-particle porosity. (b) Impact of the effect of water absorption on the grain boundaries creating pendular rings of water around the pore throats. (c) Impact of the development of toroidal liquid bridges of the wetting phase on pore throats. VF = Viscous flow; KD = Knudsen diffusion or diffusion. Fluid 1 (blue), Fluid 2 (red).
3.2.2. Flow cessation associated with toroidal bridges
Toroidal bridges form within the inter-particle porosity. In this section experimental observations of flow through sand, sand derived from winnowed lodgment till and lodgment till are used to investigate the role of toroidal bridges in creating pressure loses within the flow pathways. The first part of this section examines the formation of toroidal bridges by micro-air bubbles in sand, and then applies these observations to explain the development of nodular or beaded macropore structures at the end of a propagating macropore/natural pipe in the lodgment till. The end of a propagating macropore defines the lateral limit or boundary of a groundwater mound in a clay sequence [2].
The development of toroidal fluid bridges was experimentally examined in clay (Greenloaning lodgment till) and sand. A vertical 12 mm clear tube (containing a basal retaining membrane) was filled with (0.3–0.6 m of) compacted sediment and a measured driving force (head) applied. Three different experiments were undertaken:
- (i)
- an unconsolidated sand was placed in a water saturated tube and a driving force applied across the sand body. This experiment simulates the reactivation of flow within a sand filled natural pipe within the groundwater mound (Section 3.2.2.1);
- (ii)
- a sample of lodgment till was placed in a tube and fluidized. Clay particles were elutriated to create a simulated sand filled natural pipe. The tube was drained in order to simulate the lowering of the upper surface of the groundwater mound. The tube was then refilled with water and a driving force applied across the residual “winnowed sand” body to simulate the reactivation of a natural pipe during recharge (Section 3.2.2.2);
- (iii)
- a sample of lodgment till was placed in a tube and a gradually increasing driving force applied across the clay body in order to examine how macropores and natural pipes form (Section 3.2.2.3).
3.2.2.1. Toroidal bridges in unconsolidated sand
Following the cessation of soakaway recharge, the vertical and inclined natural pipes (within the groundwater mound) will contain a well graded, porous, unconsolidated sand. During recharge, fluid flow within the natural pipe will restart and a number of features will develop:
- (i)
- In Figure 9a the initial recharge has separated the sand body to form two sand bodies separated by a water body. Fluid flow in the lower sand body is by fluidized flow within a zone of stationary particulates (expanded porosity) [40]. Stationary particulates are continuously moving particles in expanded porosity, where the upward force associated with the flowing water matches the downward gravitational force exerted by the particles [3,40]. Fluid flow in the upper sand body is within unexpanded inter-particle porosity. Rising air bubbles moving in the same direction as the water molecules coalesce (within the water body) and block the pores into the overlying sand body (i.e., create toroidal fluid bridges (Figure 8c)). The water flow leaving the upper sand body has a lower velocity than the water flow leaving the lower sand body. Over time the gap between the upper and lower sand bodies increases, as the upper sand body is pushed along the conduit by the force contained within the expanding water body.
- (ii)
- Figure 9b demonstrates that the water flow rate is sufficient to carry a few of the fluidized sand grains from the lower sand body into the overlying water column. This results in a counter flow of small sand particles rising in the main flow channel and descending in the adjacent slack water. The flow into the water body from the lower sand body will result in a loss of energy and a conversion of kinetic energy to potential energy. Continuing expansion of the water body volume with time, reflects an increase in potential energy pressure loading (Equation 3).
- (iii)
- Figure 9c shows that air has coalesced to form bubbles, which form toroidal bridges (Figure 8c). These toroidal bridges block entry to the pores in the overlying sand body. This results in:
- a reduction in the water flow rate through the upper sand body.
- a buildup of potential energy in the water body immediately downstream of the upper sand body.
- the rate of flow through the upper sand body decreasing as the volume of air bubbles along the infiltrating surface increases.
When a critical potential energy (Equation 3) develops in the water body, the overlying sand body will collapse as the gas bubbles (and water) flow through, and fluidize the upper sand body. This suggests that when natural pipes reopen, there will be a series of successive pressure losses along the pipe length (associated with separating sand bodies) as the stable fluidized flow within the pipe (containing stationary particulates) becomes established.
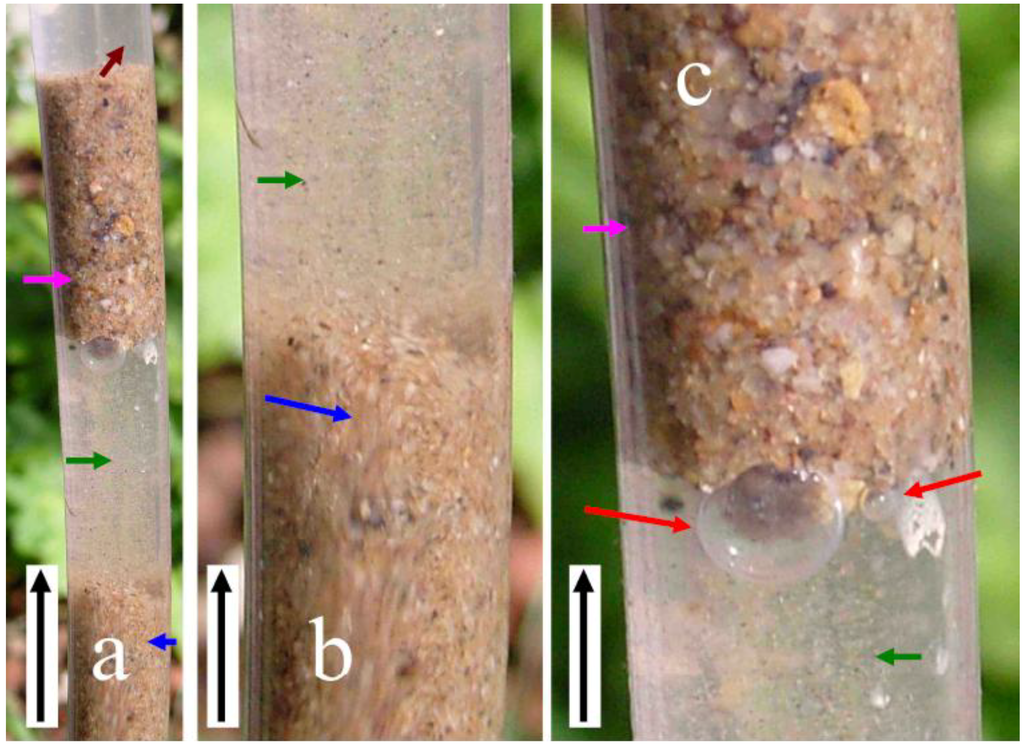
Figure 9.
Example of water flow through an unconsolidated sand. (a) Example of separation, where an upper sand body (purple arrow) is separated from the lower sand body (blue arrow) by an expanding water body (green arrow). The overlying water (brown arrow) is free of suspended particles. (b) Detail of the upper surface of the lower sand body showing a central fluidized sand channel (blue arrow) containing stationary particulates. (c) Detail of the base of the upper sand body showing air bubble (red arrow). Black arrows indicate flow direction of both air and water in a vertically orientated tube. Tube diameter is 12 mm.
3.2.2.2. Toroidal bridges in winnowed sand within a “natural pipe” derived from Greenloaning till
A sample of Greenloaning lodgment till was fluidized and allowed to settle in a 12 mm vertical tube. The tube was drained, and flow restarted, in order to simulate the behavior of fluids within a natural pipe located above the static groundwater mound following recharge. This experiment illustrated a number of features:
- (i)
- Figure 10 demonstrates that the sediment column first breaks into a number of segments separated by expanding water bodies.
- (ii)
- After the water body reaches a critical size, the overlying sediment fluidizes and collapses into the water body (Figure 11).
- (iii)
- (iv)
- Within the lower sediment body, nodular, irregular pores develop (white arrow (Figure 12)) which contain small discrete air bubbles. These expand over time (as they receive more air and water) to form discrete water bodies. The downstream surface of these enlarging pores is lined with air bubbles.
- (v)
- The main water body (Figure 10) is fed by a series of micro-tubes (yellow arrow (Figure 10 and Figure 12)), which are formed as a lining of nano-air bubbles. These water filled micro-tubes (<30 mm long) are fed with nano air bubbles through their base and sides. The nano bubbles coalesce towards the tube end to discharge a string of uniform sized air bubbles into the water body (Figure 12).
- (vi)
- The junction of the upper sediment body and the water body is marked (brown arrow) by a rim of nano and micro air bubbles (Figure 13). This is an analogous situation to that observed in Figure 9a,c. It indicates that the downstream surface of enlarging pores can be lined with air. These air bubbles reduce the sediment permeability at the junction of the pore and the sediment.
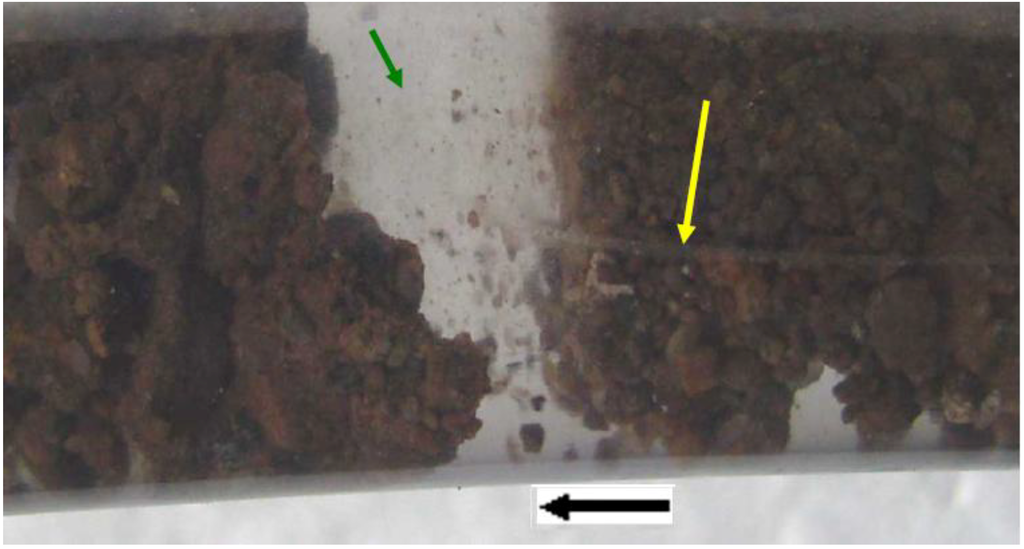
Figure 10.
Sand body separation occurring within graded sand retained within a relict flow conduit in lodgment till following reactivation of flow. Yellow arrow indicates a vertical water lined tube containing small air bubbles, which migrate into the expanding water body. Green arrow indicates expanding water body. Black arrow indicates water flow direction. Tube diameter = 12 mm. Lodgment till from Greenloaning, Scotland.

Figure 11.
Fluidised flow in graded lodgment till sand. Orange arrow indicates main water current. Blue arrow indicates presence of descending sand grains in slack water. Black arrow indicates water flow direction. Tube diameter = 12 mm. Tube orientation = vertical. Lodgment till from Greenloaning, Scotland.
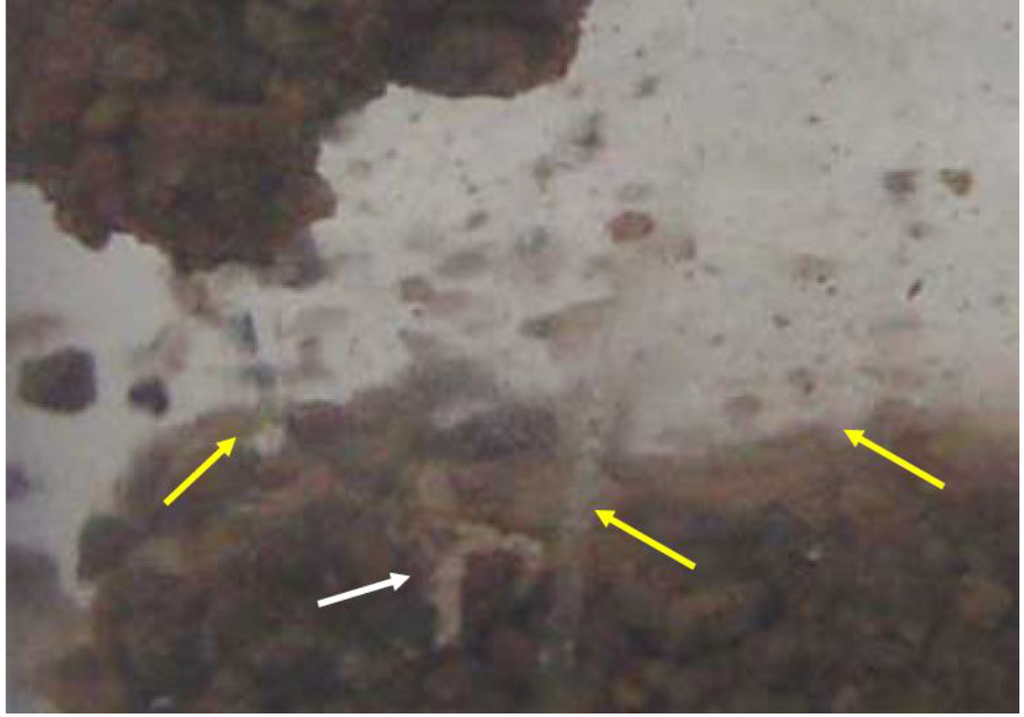
Figure 12.
Detail of air bubble trains in Figure 10. Yellow arrow indicates a vertical water lined tube containing small air bubbles, which migrate into the expanding water body. White arrow indicates pore filled with air bubbles.
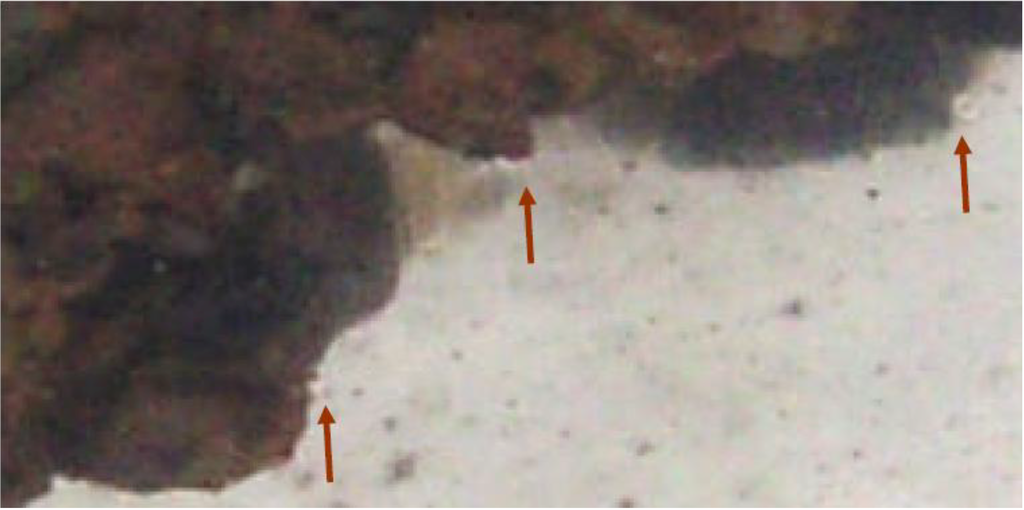
Figure 13.
Detail of junction of the upper sediment body and the water body in Figure 10. The brown arrows highlight a film of nano and micro air bubbles separating the upper sediment body from the water body.
3.2.2.3. Toroidal bridge formation in propagating macropores within Greenloaning lodgment till
Lodgment till containing clear actively flowing water (Figure 14) shows the development of interconnected clay clods (Figure 14 and Figure 15) [41]. The clods separate an interconnected three dimensional braided series of flow channels (macropores) [41] whose permeability increases as the clay clod size increases [41].
The macropores develop as a braided network of thin conduits containing a number of larger pores arranged in series. This creates a nodular, or beaded, appearance for each flow pathway. Air bubbles collect and coalesce in the larger more open pores (Figure 14 and Figure 16). These air bubbles obstruct the downstream flow of water (i.e., create toroidal bridges Figure 9c). The shape of the nodular pores (Figure 16) is similar to the shape of the nodular pores created by trapped air bubbles in the sandy till (Figure 12, white arrow).
At the end of a macropore flow conduit the density of the nodular pores increases and their size decreases (Figure 15 and Figure 17). This morphology is consistent with the hypothesis that the nodular pores form as potential energy stores at the end of a principal flow conduit and are linked by narrow conduits. The general energy flow through these conduits is summarized in Figure 18.
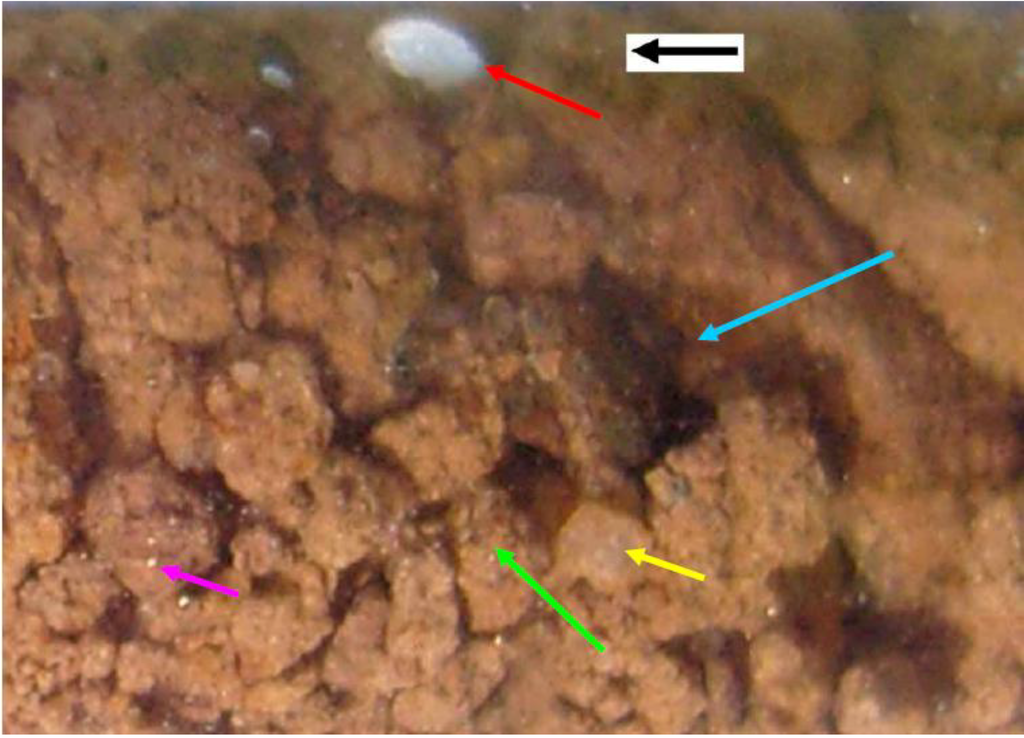
Figure 14.
Lodgment Till from Greenloaning. Water is actively flowing through the clay. Flow direction arrowed (black arrow); macropores (flow channels (blue arrow)), clay clods (green arrow), air bubbles (red arrow). White scale bar = 1 mm. Example mineral grains (quartz grain = yellow arrow, feldspar grain = purple arrow). Photograph prepared by flowing water through compressed lodgment till held in a 12 mm diameter clear tube. The flowing water is clear.

Figure 15.
Distal end of a propagating flow conduit in Greenloaning lodgment till: Gradated junction between an area where the dominant flow is within the inter-particle porosity (green arrow) and the dominant flow is within macropores (red arrow). Macropores containing clear flowing water. Arrow indicates the water flow direction. Scale bar (white) = 1 mm.
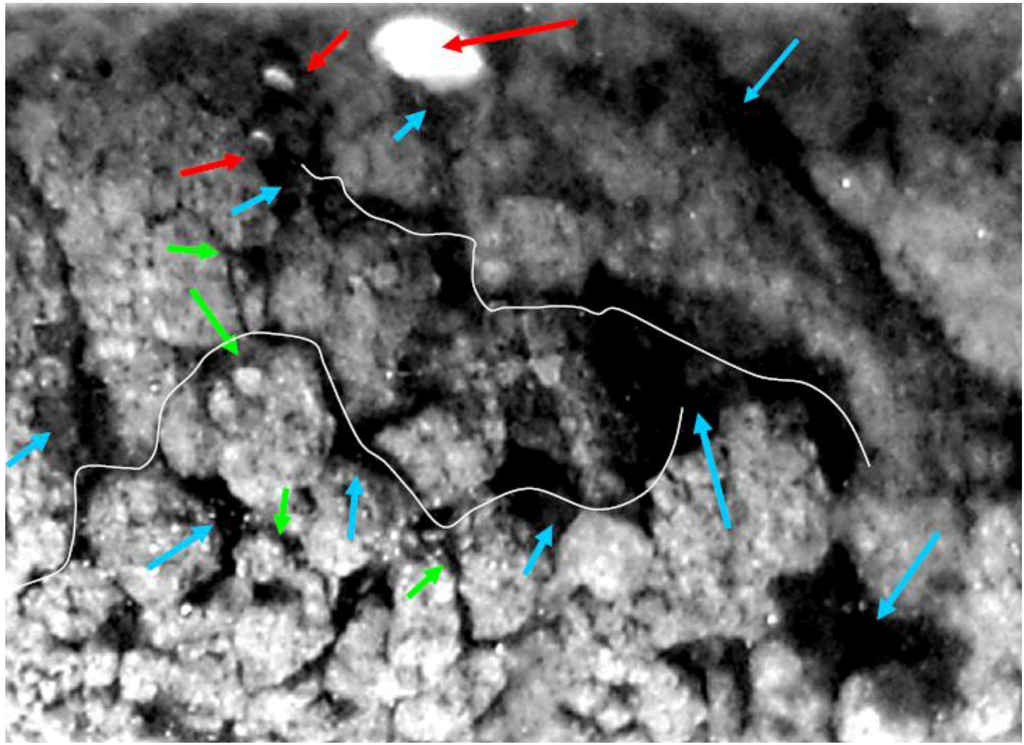
Figure 16.
High contrast black and white image of Lodgment Till from Greenloaning. Water is actively flowing through the clay. Figure 14 provides the same photograph in color. Air bubbles (red arrows). Narrow pore conduits (green arrows) connect large macropore chambers (blue arrows) some of which contain air bubbles. White lines identify illustrative flow pathways within the porosity.

Figure 17.
High contrast black and white photograph of the distal end of a propagating macropore. Figure 15 provides the same photograph in color. Macropores (black) are separated by clay clods (white). Arrow indicates the water flow direction. Scale bar (white) = 1 mm. Red arrow indicates the clay into which the macropore network is propagating.
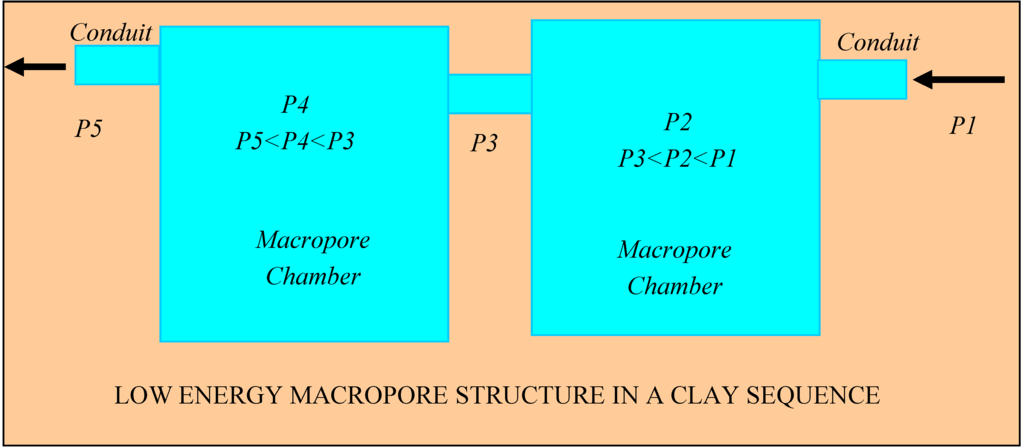
Figure 18.
Schematic representation of flow between the clay clods within the macropores. P1 to P5 represent total pressure or driving force at different points in the macropore.
There is an implied loss of driving force (P) when kinetic energy converts to potential energy and vice versa (Figure 18):
where PD = pressure at the discharge location (Pa); PU = the pressure (or head) behind the flowing water (Pa); and PL = pressure losses affecting the flowing water resulting from the transfer of kinetic energy to potential energy (Pa).
P = PU – PD – PL
3.2.3. Flow cessation associated with hydration of the inter-layer porosity
The lodgment till contains smectite. Smectite comprises a 2:1 dioctahedral structure where an octahedral layer is sandwiched between two tetrahedral layers [38]. The octahedral layer contains substitutable cations and contains the inter-layer porosity (Figure 19) [37,38]. Common cations are Li, Na, K, Rb, Cs, Mg, Ca, Sr and Ba [38]. Two types of swelling of the inter-layer porosity are recognized [38]. They are crystalline swelling where the water bonds with the cations to form one, two, or three layer hydrates [38] (Figure 19) and osmotic swelling [42]. The unhydrated cations occupy an inter-layer spacing of around <0.9–1.1 nm [38]. A single hydration shell increases the spacing to between 1.0 and 1.2 nm [38]. A double hydration shell increases the inter-layer spacing to between 1.3 and 1.5 nm [38] (Figure 19). When a triple hydration shell is present, the bivalent cations (Mg, Ca, Sr, Ba) show a greater inter-layer spacing (1.9–2.1 nm) than the monovalent cations (Li, Na, K, Rb, Cs) (1.3–1.7 nm) [38]. Toroidal bridging can occur (Figure 19) when the hydrated cations are at the edge of the clay plates.
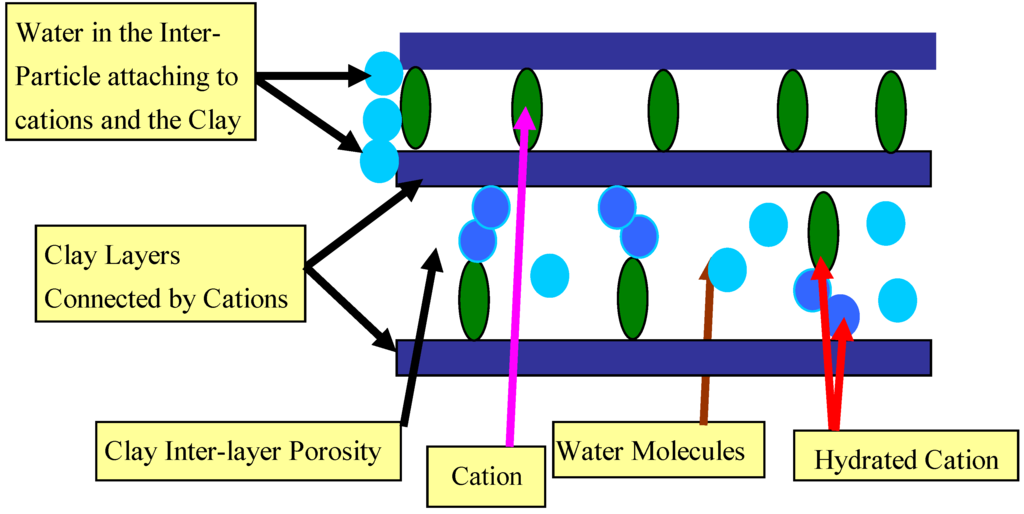
Figure 19.
Cross section through a clay platelet showing the end of the platelet where it abuts the inter-particle porosity, the clay layers, and the inter-layer porosity containing structural (and substitutable cations).
The basal tills in the region contain (median composition (ppm), n = 546) Au = 2 ppb, Hg = 70 ppb, Ca = 3950, Ti = 5305, V = 106, Cr = 83, Mn = 1350, Fe = 48000, Ni = 29, Cu = 23, Zn = 88, As = 22, Rb = 57, Sr = 266, Y = 16, Nb = 10, Mo = 3, Ag = 1, Ba = 535, La = 31, Ce = 40, W = 2, Pb = 28, Bi = 1, Th = 6, U = 3 [43]. This analysis [43] indicates that the dominant hydrated cations in the Greenloaning clay are Ca, Ba and Sr.
The static AWC analysis (Figure 7) indicates that the median pore radii reduces from 0.36 mm (outside the groundwater mound) to 0.00086 mm beside the infiltration device (within the groundwater mound). This is equivalent to a 99.76% decrease in pore throat radii.
Two structural arrangements (of clay platelets) can produce a 99.76% reduction in pore throat radii associated with the inter-particle porosity. They are (i) the formation of a compact platy arrangement of clay particles (Figure 20a) and (ii) a chaotic formation resulting from the presence of trapped air and water within the inter-particle porosity of the clay structure (Figure 20b).
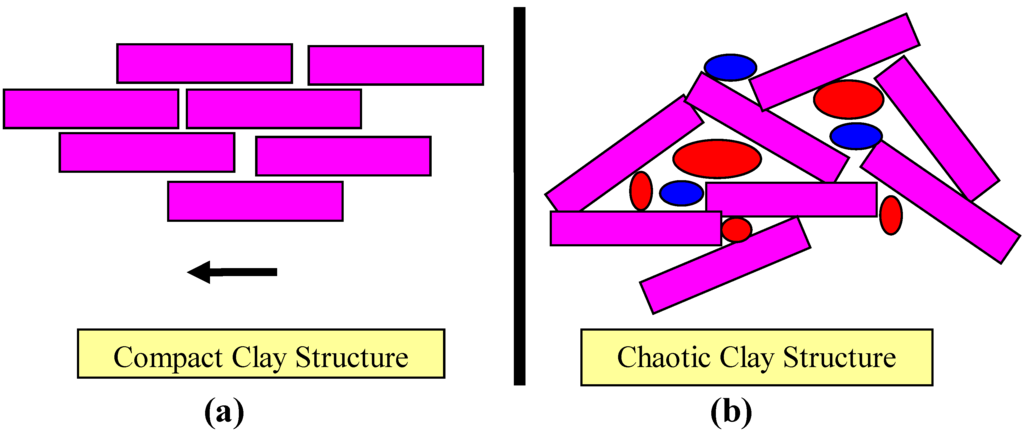
Figure 20.
(a) Compact clay structure. (b) chaotic clay structure containing trapped air (red) and water (blue) in the inter-particle porosity.
3.2.4. Other flow cessation factors
The pore throat radii can be reduced by an expansion of the clay inter-layer space associated with osmotic flows [42]. A collapse of the inter-layer space (and expansion of the pore throat radii) can be triggered by a reduction in the inter-layer monovalent electrolyte concentration (e.g., salinity) [4,42]. Pore throat bridging associated with siltation can reduce pore throat radii adjacent to the infiltration device [44].
3.2.5. Standing water–model summary
In high permeability grain supported sediments, the water will infiltrate through the sides and base of the soakaway to create a wedge shaped groundwater mound, which descends with time, and expands laterally with time (Figure 21) [7,15,17,45]. Following recharge (Figure 22), the water level drops to below the base of the soakaway. The groundwater mound continues to descend with time and expand laterally until it reaches the underlying water table (Figure 23).
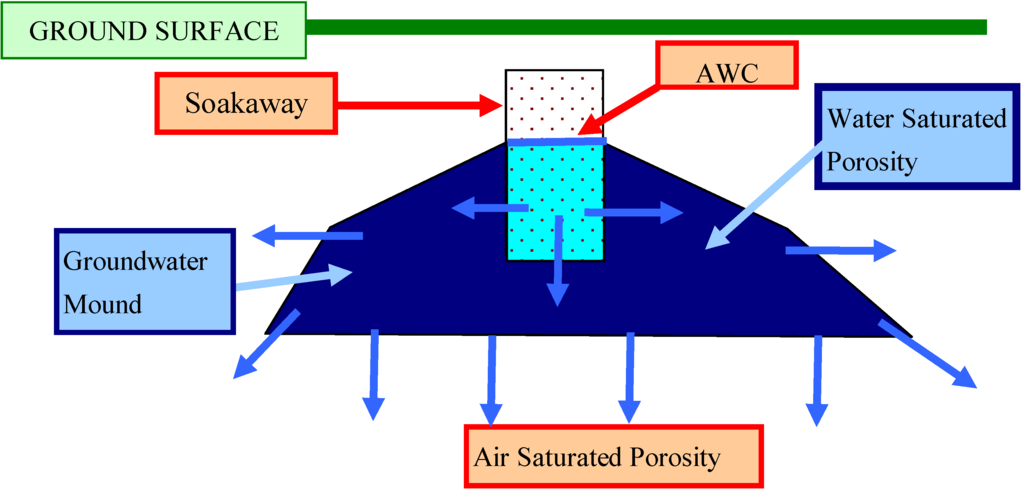
Figure 21.
Expected groundwater mound associated with a soakaway placed in permeable sediment immediately following the cessation of recharge. Blue arrows indicate direction of water flow.
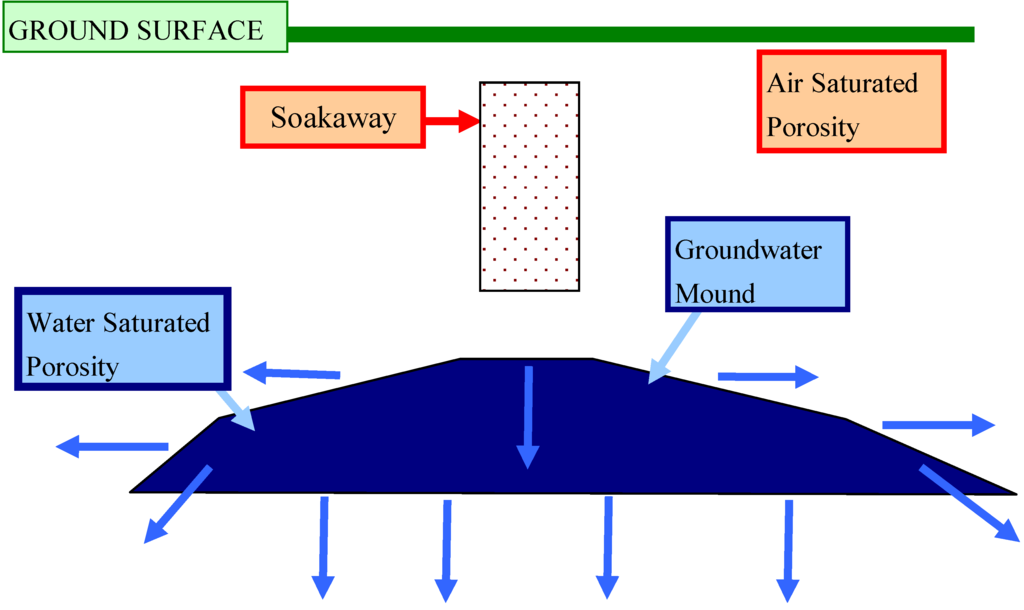
Figure 22.
Expected groundwater mound associated with a soakaway placed in permeable sediment after the cessation of recharge.
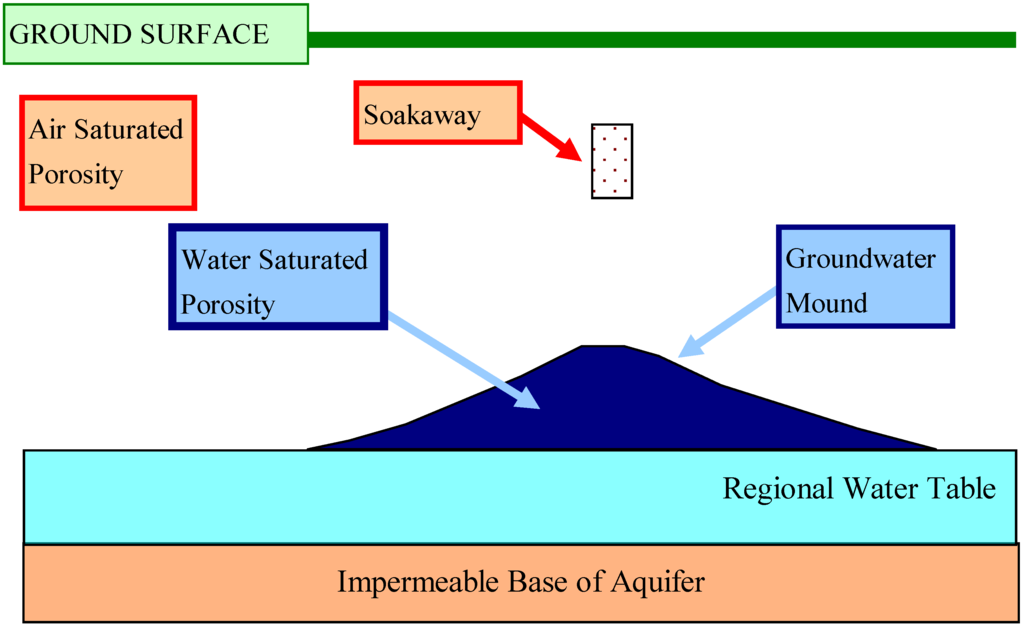
Figure 23.
Expected groundwater mound associated with a soakaway placed in permeable sediment, illustrating a descending mound accreting onto the regional water table.
In matrix supported clays the maximum lateral extent of the mound occurs at the base of the soakaway [2,35] (Figure 24). The geometric morphology of groundwater mounds containing horizontal macropores can be described by a Dupuit envelope [1,2] (Figure 25).
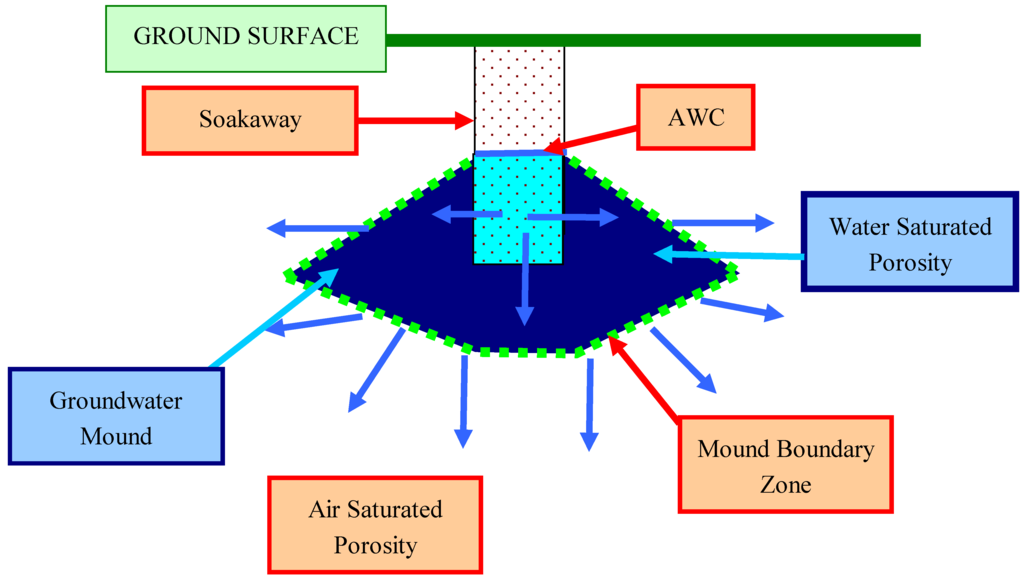
Figure 24.
Expected groundwater mound associated with a soakaway placed in impermeable sediment (e.g., clay) immediately following the cessation of recharge, when macropores do not develop.
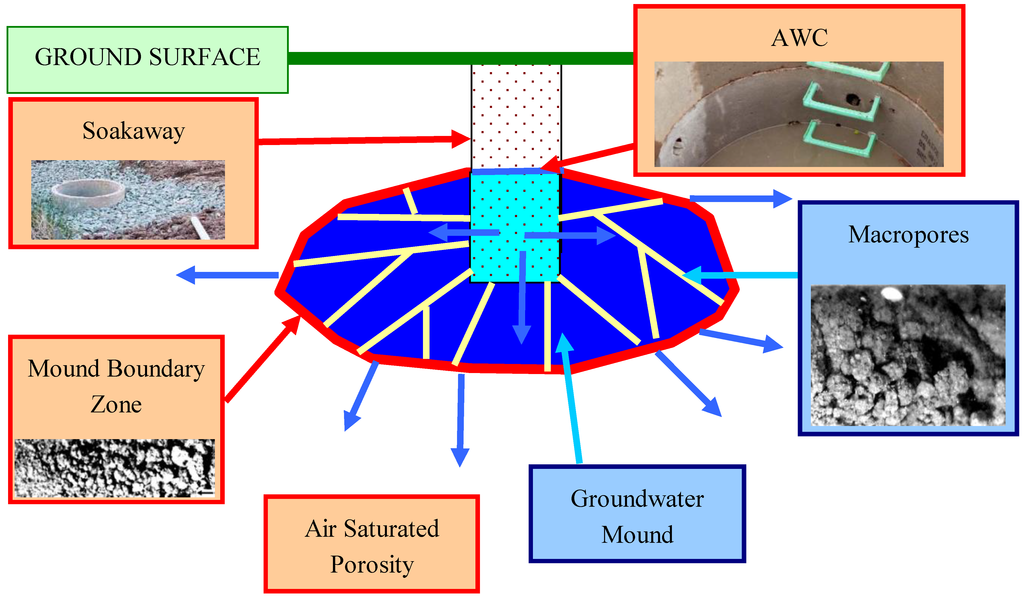
Figure 25.
Expected groundwater mound associated with a soakaway placed in impermeable sediment (e.g., clay) immediately following the cessation of recharge, when macropores develop.
Following the cessation of recharge, the elevation of the AWC (in the soakaway) decreases as the mound migrates downwards and expands laterally, until water flow from the soakaway into the surrounding sediment ceases. A static AWC forms in the infiltration device, after water infiltration into the surrounding sediment ceases. The groundwater mound, at this point (Figure 26) is static [1,2]. It contains a network of natural pipes and macropores containing static water [2]. Some of these macropores and pipes may require a positive hydrostatic pressure, or flowing water, to remain open. The macropore network will fragment with wall collapses and blockages occurring between recharge events. Within the drained sediment above the groundwater mound, the macropores/natural pipes will also remain open or partially open (due to wall collapses and blockages). The boundary of the mound (Figure 15 and Figure 17) marks a transition from viscous flow to Knudsen diffusion. This transition is aided by pressure losses associated with the entrapment of air and the pressure losses associated with the formation of nodular pore networks at the boundary.
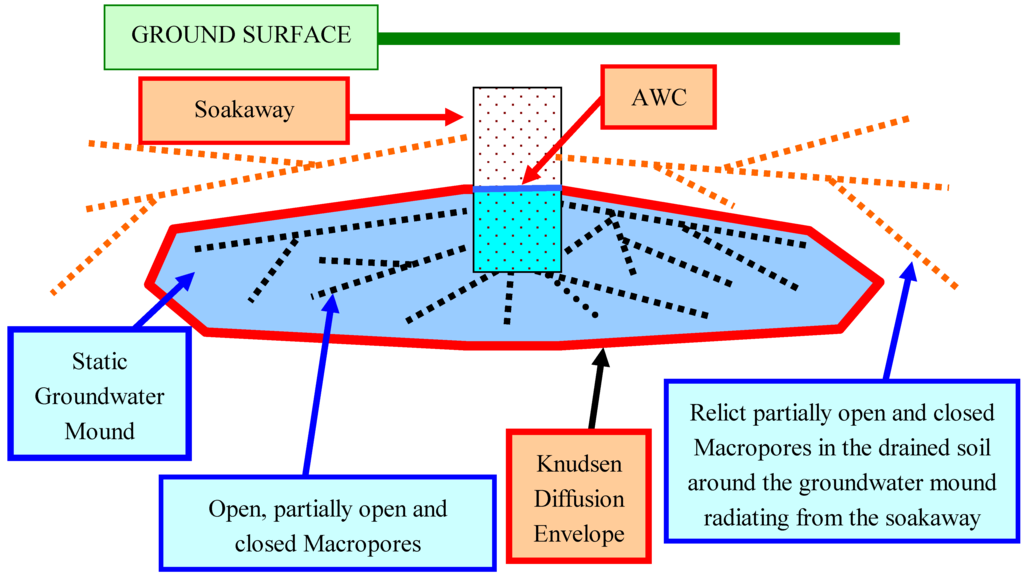
Figure 26.
Expected groundwater mound associated with a soakaway placed in impermeable sediment (e.g., clay) following the cessation of recharge and after a static groundwater mound has formed.
3.3. Macropore Formation
The primary method of fluid distribution within the groundwater mounds at Greenloaning is through macropores and natural pipes [2]. The toroidal bridge analysis has established that:
- (i)
- the nodular or beaded macropore development at the end of the flow conduit is associated with pressure losses where each nodular pore represents an expanding store of energy, where kinetic energy is transferred to potential energy, and
- (ii)
- energy losses are accentuated along the downstream margins of the nodular pores by the formation of toroidal bridges associated with migrating air bubbles.
The experimental analysis established that the nodular pores increase in volume as the stored potential energy increases. When a critical level of stored energy accumulates, the downstream margin of the pore fluidizes allowing rapid pore growth and natural pipe formation, and water flow within the enlarged pore with reduced pressure losses. This section considers the formation of the macropore/natural pipe flow conduits, the associated pressure losses and the migration of infiltrating water from the macropores into the surrounding sediment pores.
The stages in natural pipe formation in the till as a function of increasing driving force are:
- (i)
- Low Driving Force: Inter-particle viscous flow through the clay. This results in the discharged water containing a high proportion of colloidal material (Figure 27). The presence of this colloidal material in the water moving ahead of the wetting front may have a surfactant effect and reduce θ (Equation 8).
- (ii)
- Medium Driving Force: Formation of beaded macropore pathways (containing clear water) separated by clay clods (Figure 28).
- (iii)
- (iv)
- Higher Driving Force: Formation of high permeability natural pipes (Figure 31).

Figure 27.
Water-clay interface, where Greenloaning lodgment till is overlain by water. Arrow indicates the water flow direction. Scale bar (white) = 1 mm. Q = 0.0004–0.005 m3 m–2 s–1; h = <0.2–1.1 m. Figure 27, Figure 28, Figure 29, Figure 30, Figure 31 and Figure 32 are formed by flowing water through a 12 mm diameter clear tube.
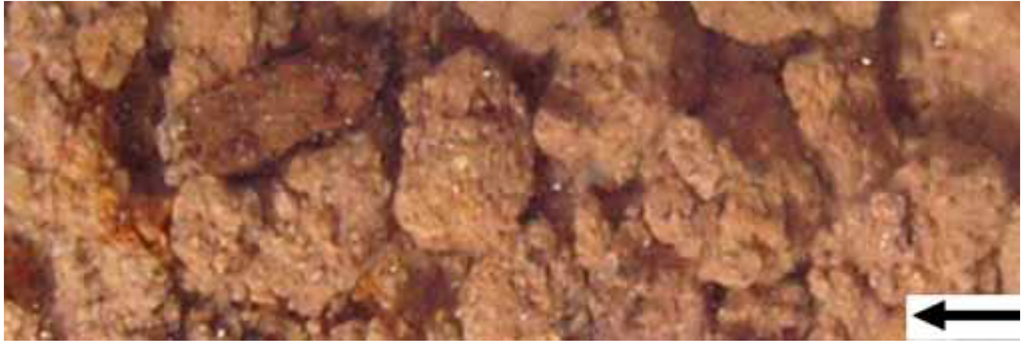
Figure 28.
Macropores separated by clay clods containing clear flowing water within Greenloaning lodgment till. Arrow indicates the water flow direction. Scale bar (white) = 1 mm. Q = 0.04 m3 m–2 s–1; h1 = 1.0–1.4 m.
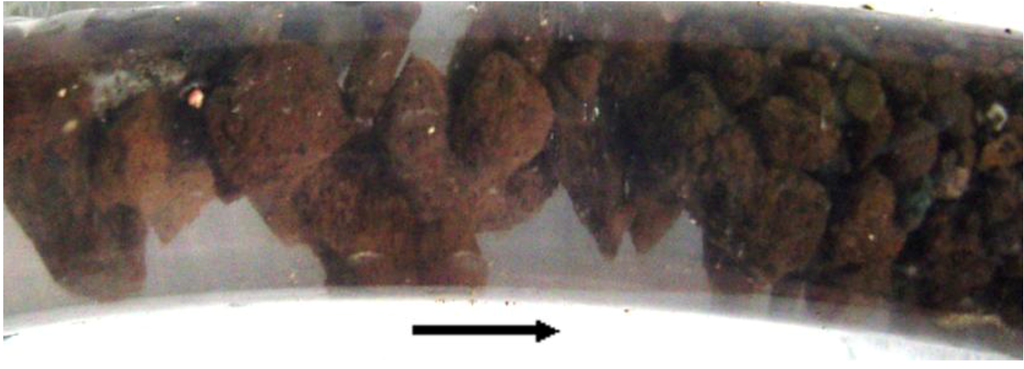
Figure 29.
Distal end of a propagating natural pipe showing the transition (as pressure losses increase) into a zone of macropores separated by clay clods. 12 mm diameter tube containing clear flowing water within Greenloaning lodgment till. Arrow indicates the water flow direction.
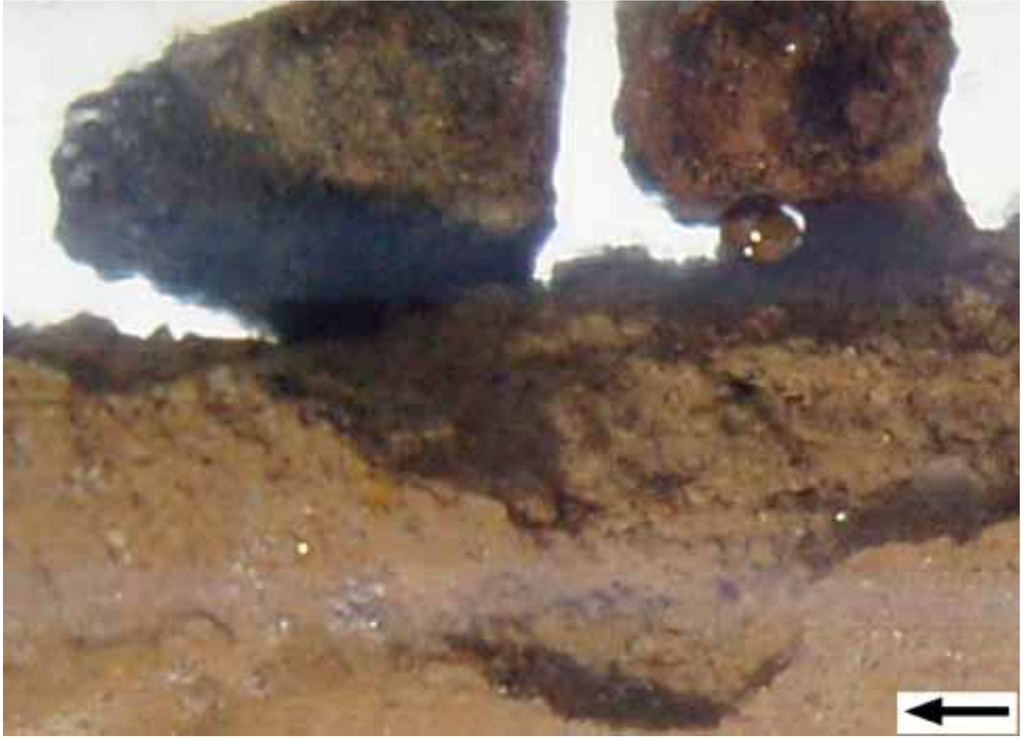
Figure 30.
Natural pipe forming in the Geenloaning lodgment till between clay clods. Arrow indicates the water flow direction. Scale bar (white) = 1 mm.
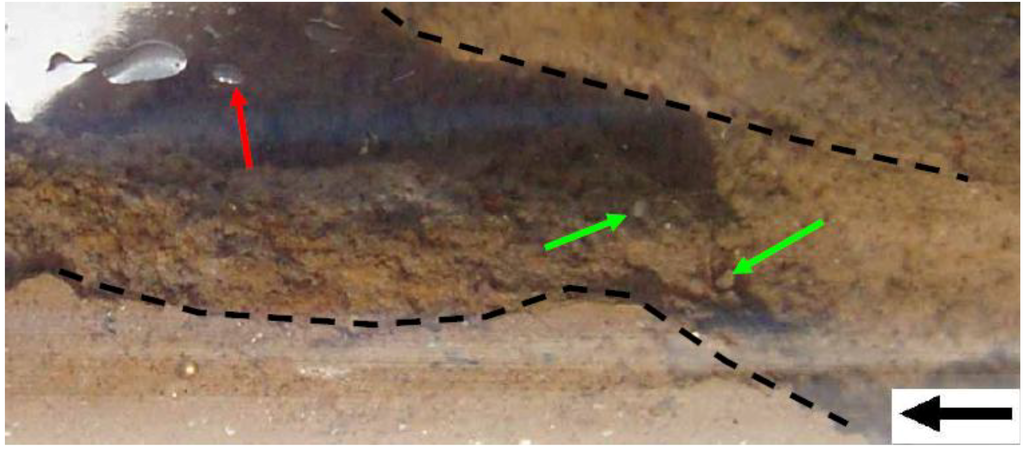
Figure 31.
Natural pipe formed in the Greenloaning lodgment till containing clear flowing water. Air bubble (red arrow); Sand grains, green arrow; Black arrow indicates the water flow direction. Dashed lines mark the macropore boundary. Scale bar (white) = 2 mm. Q = 0.06 m3 m–2 s–1; h1 = 1.3–>1.5 m.
3.3.1. Sand accumulations within macropores/natural pipes
Sand within the natural pipes (Figure 15 and Figure 31) may accumulate (e.g., Figure 10) and may become fluidized (Figure 11) as the flow rate increases during recharge. As the flow rates decrease within the pipes, the fluidized sand (Figure 11) will settle to produce sharply graded winnowed sand within the natural pipes (Figure 32). The example in Figure 32 illustrates the gap-graded nature of the Greenloaning lodgment till where the clay contains a multimodal sand size distribution (Figure 33).
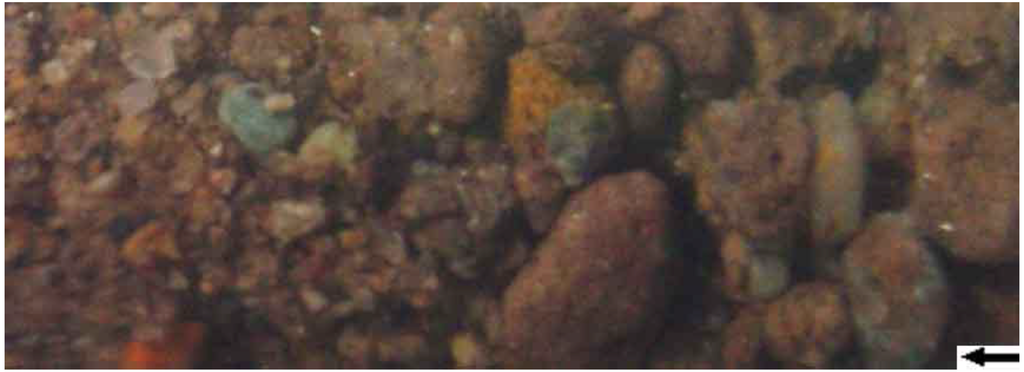
Figure 32.
Example of high porosity sharply graded sand within a natural pipe (lodgment till, Greenloaning). Arrow indicates flow direction. White scale bar is 1 mm.
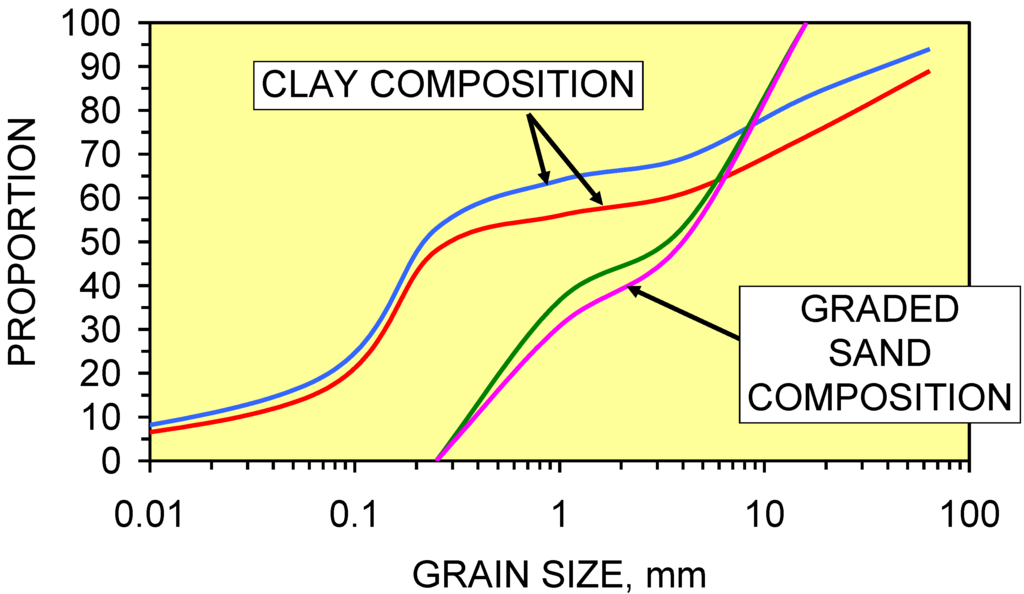
Figure 33.
Clay composition, lodgment till, Greenloaning. The graded sand composition in the natural pipes based on grains between 0.25 and 16 mm. Data: [1].
3.3.2. Intrinsic permeability within macropores/natural pipes
The intrinsic permeability of the macropores/natural pipes was measured (Equation 4) from the flow rate (at known driving forces) through a 12 mm tube containing lodgment till with macropores (Figure 34). The intrinsic permeability increased with driving force. In compacted clay (at Greenloaning) a driving force of about 12000 Pa is required to form macropores [4]. Once a zone containing macropores has formed, it will be reused by succeeding recharge events.
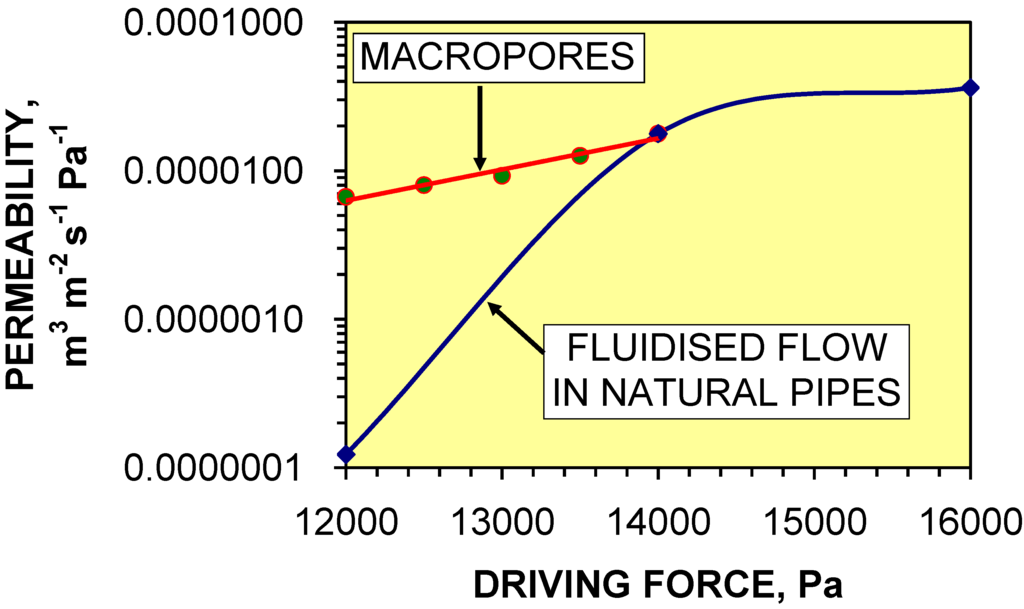
Figure 34.
Relationship between intrinsic permeability and potential (driving force) through Greenloaning lodgment till [4]. Lodgment till placed in 12 mm diameter tube.
3.3.3. Flow regimes around a macropore
A macropore can be viewed (Figure 35) as a cylindrical zone (or pipe, or conduit) containing water, surrounded by clay. The driving force (Ppipe) within a macropore/natural pipe is:
where zm = elevation of the macropore (m); PML = pressure loss between the soakaway and the macropore location (Pa). Fluid can only flow out of the macropore into the surrounding formation (by viscous flow) while Pp2 > PM. This driving force, Pp2 (Pa), is:
Ppipe = [gdw (zj – zm )] – PML
Pp2 = Ppipe – PFL
PFL = pressure loss between the macropore and the formation at a distance of x m from the edge of the macropore. At a distance of y m from the edge of the macropore Pp2 = PM and viscous flow from the macropore into the formation will cease (Figure 35). The distance y will be a function of Ppipe and the elevation of the air-water contact in the infiltration device. The intrinsic permeabilities within each flow regime differ by several orders of magnitude (Figure 35).
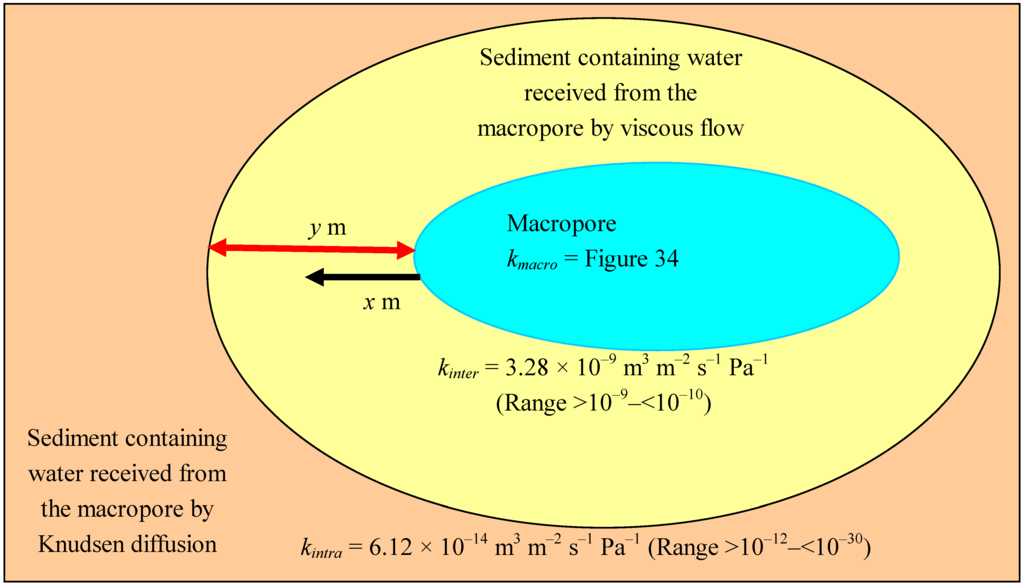
Figure 35.
Schematic drawing illustrating the flow regimes around a macropore.
3.3.4. Flow from the macropore into the surrounding formation
The pressure transmission from the macropore to the surrounding formation (associated with viscous flow) can be approximated [2,46]: (i) Pp2 = 0.5Ppipe at a distance 5j mm; (ii) Pp2 = 0.1Ppipe at a distance 10j mm; and (iii) for Pp2 = 0 Ppipe at a distance 30j mm. j = Ppipe (Pa)/1000. Figure 36 illustrates the expected pressure (driving force) profile cross section through a 10 mm diameter macropore located at 0.5 m, 1 m, 2 m and 3 m below the air-water contact in the infiltration device. The infiltration rate from the macropore into the surrounding sediment decreases as the elevation of the macropore rises (Figure 37) and the width of the zone of infiltration decreases as the elevation of the macropore decreases (Figure 37). The deeper macropores will store a substantially larger water volume than the shallower macropores (Figure 38). However, the time taken for the macropore to saturate the adjacent sediment increases with macropore depth (Figure 39). Following recharge, the proportion of stored water held within the macropores is small, but increases as the macropore depth decreases (Figure 40).
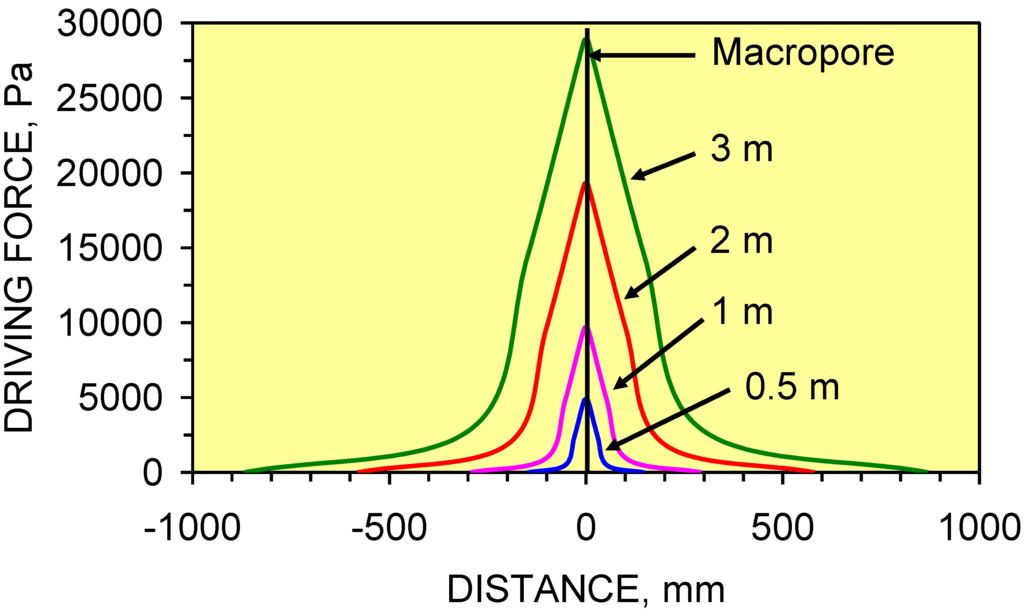
Figure 36.
Indicative relationship between depth (m) of the macropore (relative to the AWC in the infiltration device), driving force in the surrounding sediment (for viscous flow) and distance from the centre of a 10 mm diameter macropore.
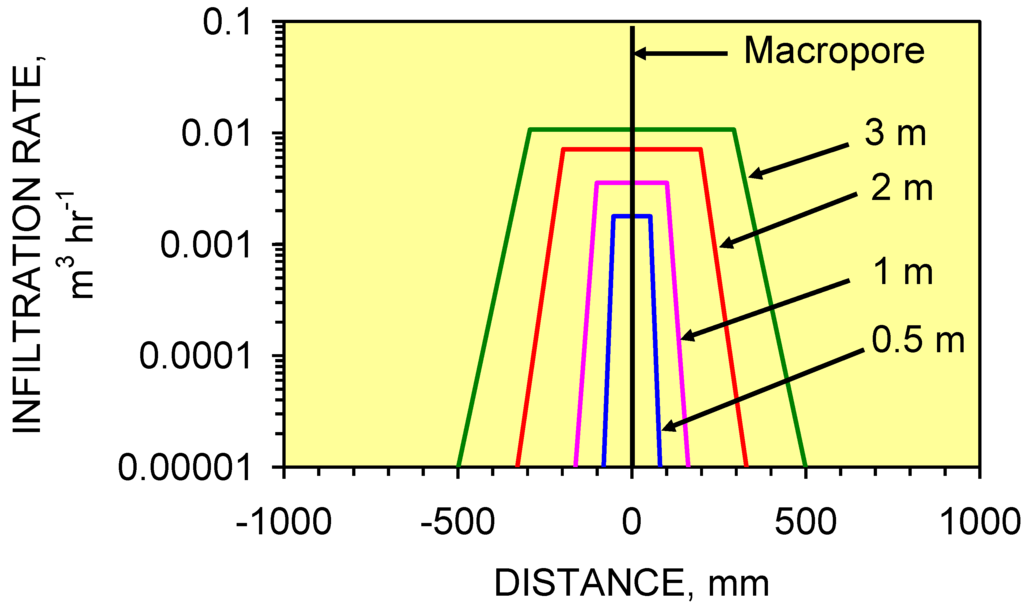
Figure 37.
Indicative relationship between depth of the macropore (relative to the air-water contact in the infiltration device), infiltration rate (m3 hr–1 per m length of macropore) into the surrounding sediment (for viscous flow) and distance from the centre of a 10 mm diameter cylindrical macropore.
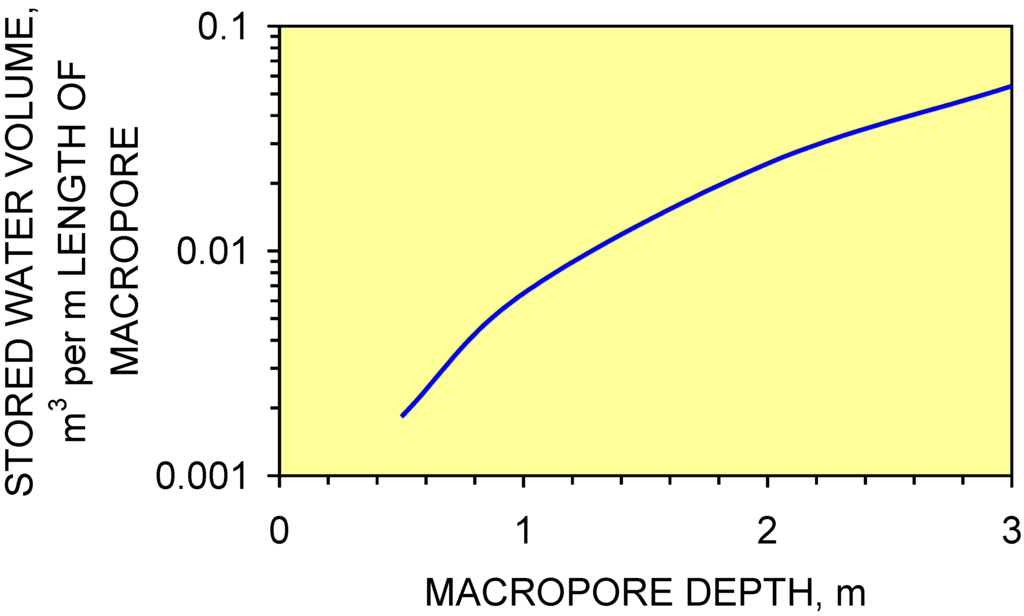
Figure 38.
Indicative relationship between depth of the macropore (relative to the air-water contact in the infiltration device) and the water storage capacity of the sediment (macropore + sediment). Sediment porosity = 20%, macropore porosity = 100%.
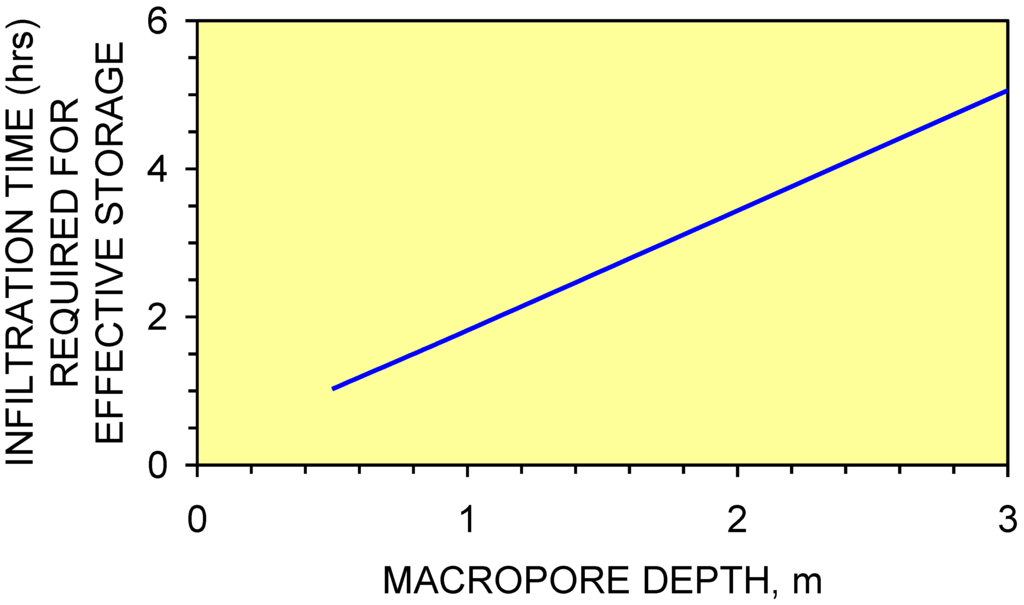
Figure 39.
Indicative relationship between depth of the macropore (relative to the AWC) and the time taken (hrs) for the macropores to fill the surrounding sediment with water.
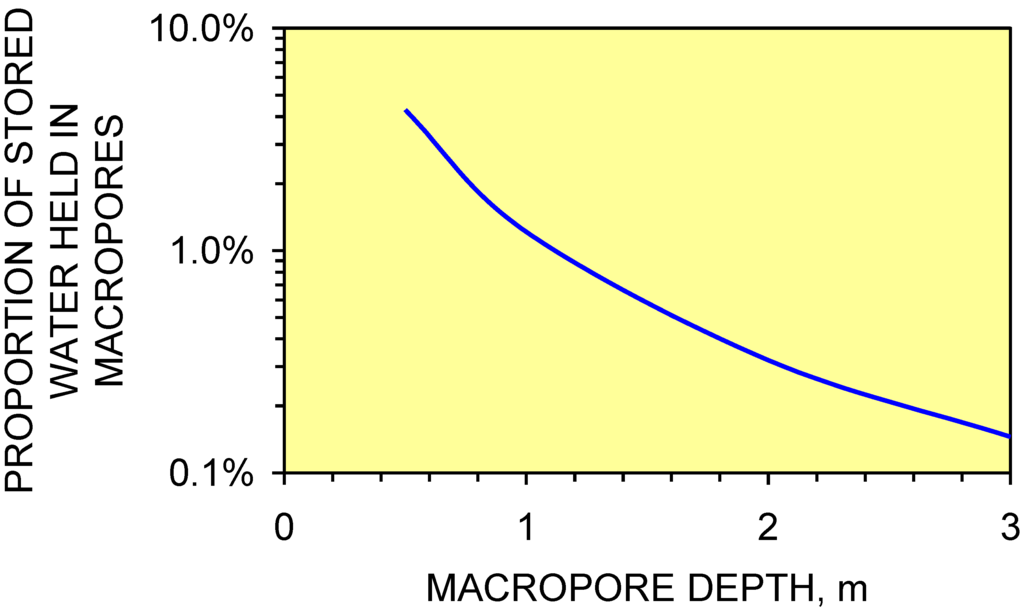
Figure 40.
Indicative relationship between depth of the macropore (relative to the AWC in the infiltration device) and the proportion of reservoired water stored in the macropores.
4. Groundwater Mound Envelope
Water is distributed (Figure 41) from the infiltration device into the groundwater mound through macropores/natural pipes/natural conduits [1,2]. The groundwater mound is encased by a boundary envelope (which may be <0.1 m across) which contains a transition from viscous flow (within the mound) to Knudsen diffusion (or another form of diffusion). An example of the boundary zone is illustrated in Figure 15 and Figure 17.
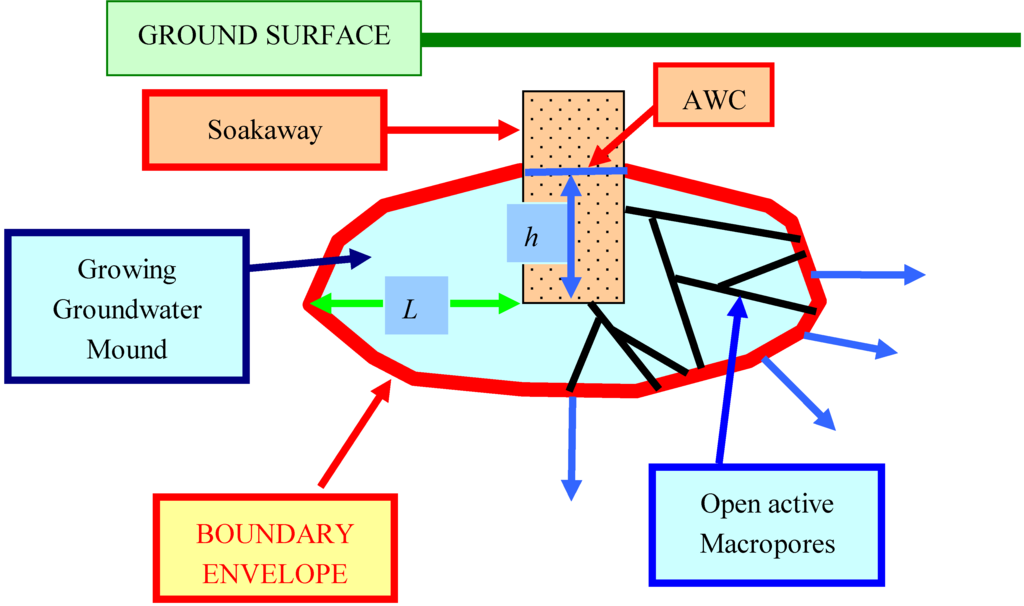
Figure 41.
Groundwater mound in impermeable sediment during recharge.
The end of the propagating macropore network (mound boundary) is characterized by increased pressure losses and increased pore tortuosity (Figure 14, Figure 15, Figure 16 and Figure 17). Section 3 has identified that increased pore tortuosity is associated with increased pressure losses. This section integrates the observed pore tortuosities with the definition of Knudsen diffusion in order to establish a linkage between groundwater mound radii and tortuosity. The linkage between the length of the propagating macropores (groundwater mound radii), sediment permeability, water depth and pressure losses is used to develop a predictive model. This model defines the size and morphology of a groundwater mound.
The equilibrium width (L) of the groundwater mound is a function of h (expressed as P) and the pore tortuosity within the boundary envelope zone. The intrinsic permeability of the boundary envelope is represented by the Knudsen diffusion (kintra) permeability of the sediment [2,3,4]. In Figure 41 the maximum width (L) is at the base of the infiltration device [2] and the maximum water depth in the device (h) defines the upper surface of the groundwater mound [1,2].
The maximum flow rate, Qb (m3 m–2 s–1), of the advancing boundary envelope (Figure 17) under equilibrium conditions is [19]:
where nm = number of moles of air, [when Qb is expressed in moles m–2 s–1; when Qb is expressed in m3 m–2 s–1, nm is expressed in m3]. T = Temperature, K; RC = gas constant [21]; Dk = Knudsen diffusion coefficient = 0.66 r ([8RCT]/[π MW])0.5 [19]; MW = weight of air (g mol–1 [21] or g m–3); τ = pore tortuosity; τ is a measure of [Ld/Lc]. Ld is the direct distance between the two ends of a pore conduit and Lc is the actual flow distance between the two ends of a flow path (e.g., Figure 16).
Qb = [π nmr2Dk]/[RCT τ] P/L = [kintraP] = [kintrahgdw]
4.1. Pore Tortuosity at the Mound Boundary
The experimental analysis, indicate that: (i) in the major conduits (natural pipes (e.g., Figure 31)), τ = 1.0–1.1; (ii) Within the zones containing coarse clay clods (e.g., Figure 16), τ = 1.1 to 2.5; and (iii) at the end of the propagating macropores (Figure 17), τ = 1.5–>10. The observed increase in τ at the end of the macropore network may reduce the permeability across the boundary envelope by an order of magnitude. However, the biggest impact on permeability (Equation 12) is the observed reduction in r (Figure 7).
4.2. Equilibrium Mound Widths
At the groundwater mound boundary (Figure 41), the driving force (for viscous flow), P, reduces to zero [1]. Integrating r (Figure 7) with τ (Equation 12) indicates that as τ increases, L increases (Figure 42). Anisotropy associated with flow pathways can result in τ varying in x, y, and z directions (e.g., Figure 43).
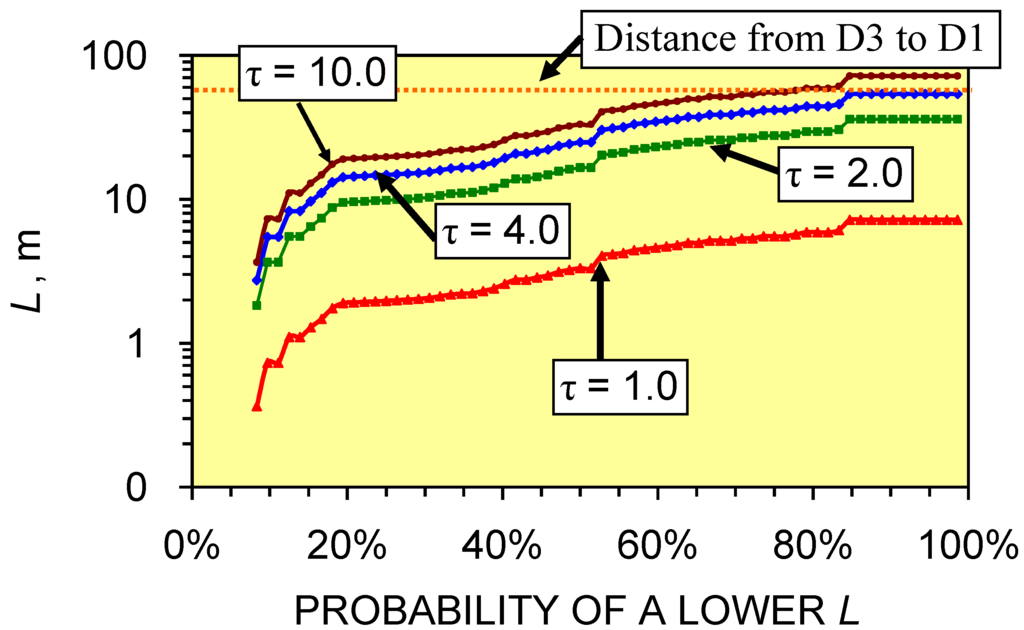
Figure 42.
Probability distribution for the lateral extent, L, (m) of the static groundwater mound either side of the soakaway as a function of pore tortuosity (τ).
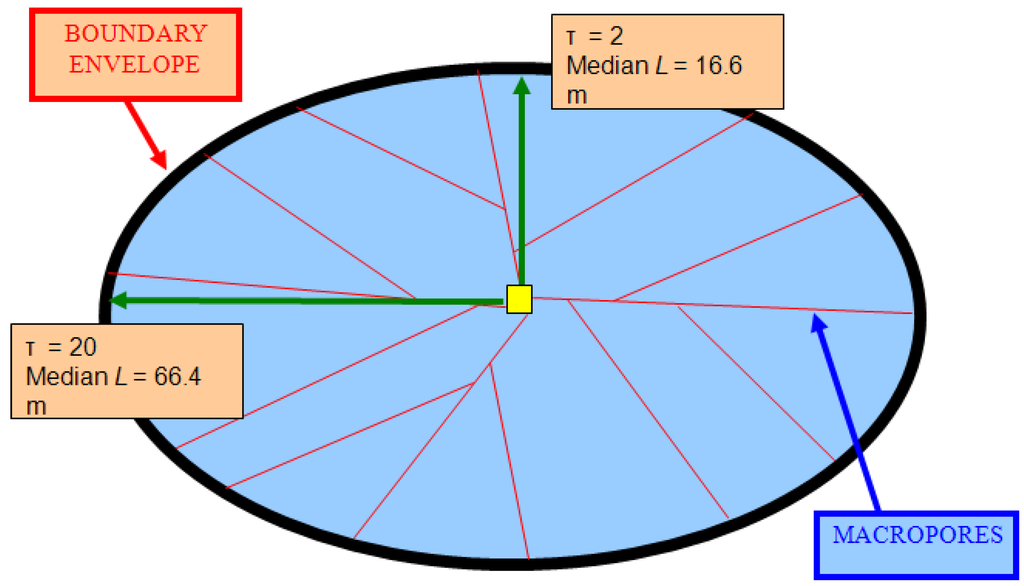
Figure 43.
Plan cross section through a groundwater mound showing macropores radiating from a central infiltration device. Mound anisotropy is a result of variation in pore tortuosity in the x and y flow directions.
Flow lines within a groundwater mound, which are directed towards a seepage location, or another infiltration device (or borehole, or drainage conduit, or permeable sediment layer) may create anisotropy in the groundwater mound (Figure 43). These features are schematically illustrated (Figure 44) for the groundwater mound associated with soakaway D3 (Appendix 1). Mound anisotropy is a result of variation in pore tortuosity in the x and y flow directions. In Figure 44, the maximum anisotropy is towards D1 and the area R1 where the mound rises above the ground surface to produce overland flow. A vertical vent (V) discharges high volumes of water into R1 from the macropore network (Figure 44).
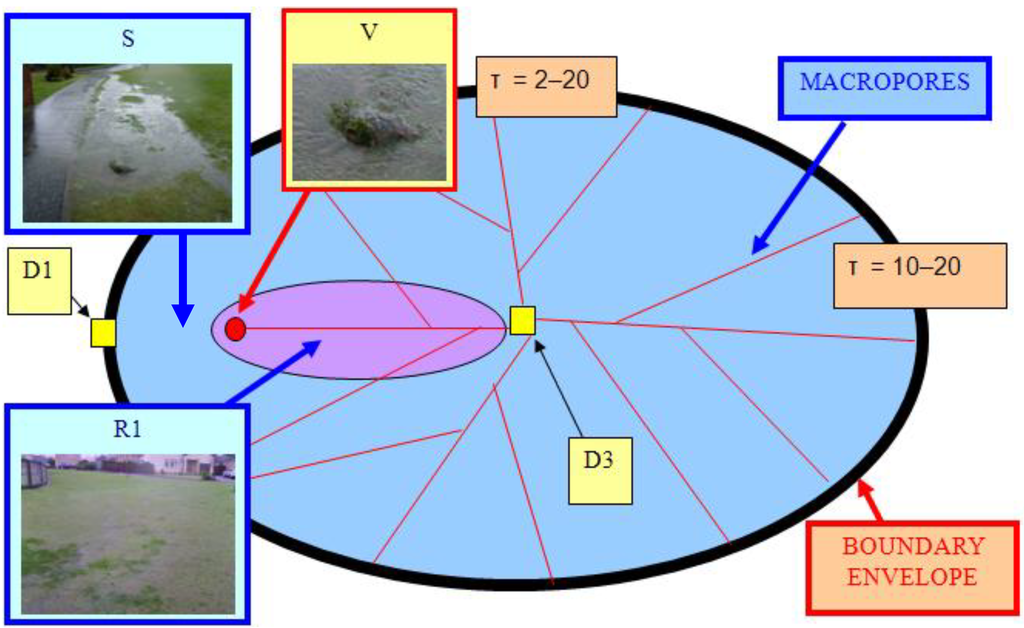
Figure 44.
Plan cross section through the D3 groundwater mound showing macropores radiating from a central infiltration device (D3). V = vertical vent. R1 = seepage zone; S = Seepage from V; Photographs: 25/1/2008. Geographic location is shown in Figure A1.
4.3. Groundwater Mound Growth as a Function of Time
The critical driving force for macropore initiation, PC, applies at the propagating end of the macropore, i.e., the effective groundwater mound boundary, (Figure 43 and Figure 44) [2]. The rate of macropore propagation (QM, m s–1) is:
where PpM (Pa) = Ppipe–PPL; PpM = driving force associated with the propagating macropore (Pa); PPL = pressure losses in the macropore network at the propagating end of the macropore (Pa). PPL will vary with clay structure, cohesiveness, saturation, porosity, mineralogy and compaction. Ppipe (Equation 10) will decrease with increasing distance from the infiltration device. AMP = macropore propagation rate (m s–1Pa–1). A simple model allows PpM (Pa) to be approximated as P(1-PL)d, where PL = pressure loss x%(fraction) per metre (PL < 1.0), d = distance from the infiltration device. When (Ppipe – PPL) < PC, then PpM is 0 Pa. PC defines the maximum (equilibrium) macropore length (i.e., effective mound boundary), while QM defines the length of time it takes for a macropore to propagate to its maximum length.
QM = AMPPpM
The macropores at each depth level (below the air-water contact) will propagate with time until PpM (Pa) = 0. The rate of propagation declines with distance from the infiltration device. At each depth level (below the air-water contact), there is an equilibrium distance for macropore growth from the infiltration device. The time taken for macropores to propagate up to 40 m is illustrated in Figure 45. This analysis (Figure 45) shows that the length of time required for a macropore to propagate to a specific length decreases with increasing water column, and is faster in the construction fill than in the underlying till. However, the larger water column affecting the till sequence allows the macropores to propagate for a greater lateral distance.
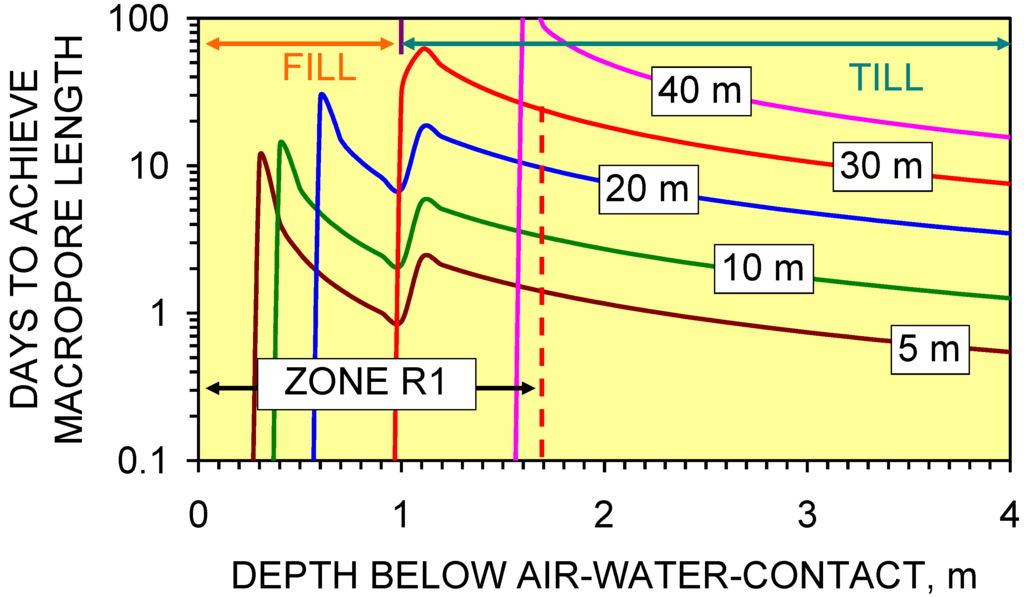
Figure 45.
Modeled length of time taken for the macropores to grow to a specific length as a function of soil type (construction fill, lodgment till) and air-water contact. PL = 5% m–1; PC = 2000 Pa; The infiltration device has a constant water depth of 4 m; The sediment comprises 1 m construction fill overlying 3 m of lodgment till; AMP (lodgment till) = 3.28 × 10⁻⁹ m s–1Pa–1, e.g., kinter [3]; AMP (Construction Fill) = 10–7 m s–1Pa–1.
4.4. Impact of Pressure Losses on Groundwater Mound Diameter
Pressure losses increase along a macropores length with increasing distance from the infiltration device. The pressure loss (PL) controls both the pressure in a macropore at a distance x m from the infiltration device and the maximum length of macropore which can be associated with a specific water depth in the infiltration device. Figure 46, Figure 47, Figure 48 and Figure 49 consider an infiltration device containing 6 m of water. A minimum driving force (PC) is required to form a macropore. Macropores of length Lm will only be present at the specified depth if the driving force within the macropore at a distance x from the infiltration device exceeds the minimum driving force (PC).
The length of the macropores, when PC = 0 Pa, decreases with increasing PL, but increases with water depth (Figure 46, Figure 47, Figure 48 and Figure 49). Setting PC as 2000 Pa, allows an indication of the groundwater mound shape to be ascertained as a function of PL and water depth (Figure 46, Figure 47, Figure 48 and Figure 49) by defining the maximum macropore length. This analysis (Figure 46, Figure 47, Figure 48 and Figure 49) can be used to determine the maximum macropore length as a function of depth below the air-water contact (Figure 50). Figure 50 illustrates the relationship between the groundwater mound boundary as a function of depth below the AWC, and distance from the infiltration device for PL = 5% to 20% m–1. This analysis indicates that any contour that dips up to 1.7 m below the AWC within 43 m of the infiltration device is likely to encounter the upper surface of the groundwater mound.
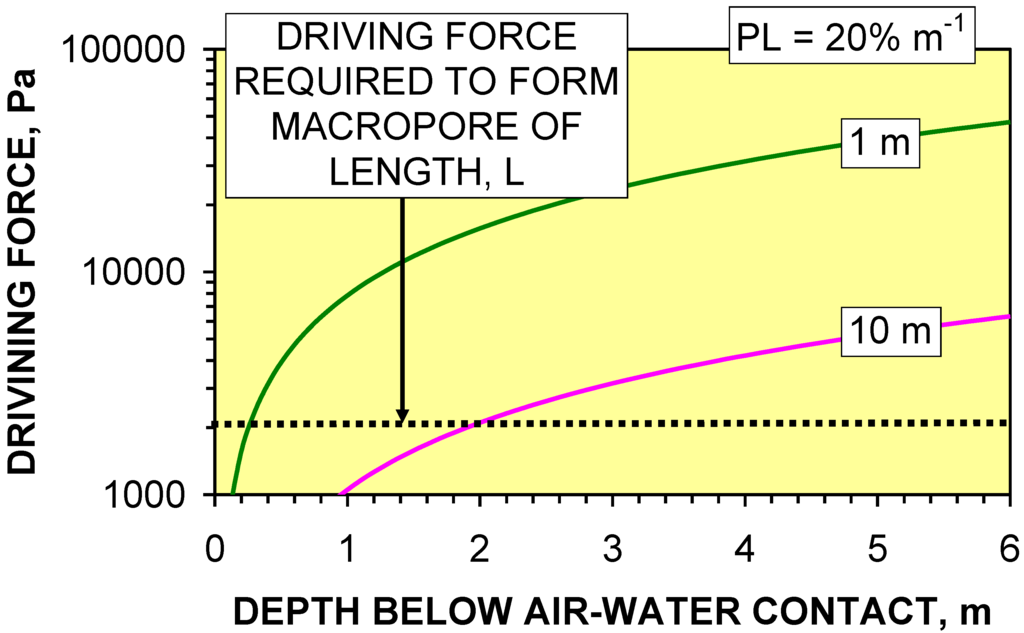
Figure 46.
Driving force (Pa) in macropores at a distance of 1, 10 m from the infiltration device as a function of their elevation below the air-water contact in the infiltration device: PL = 20% m–1.
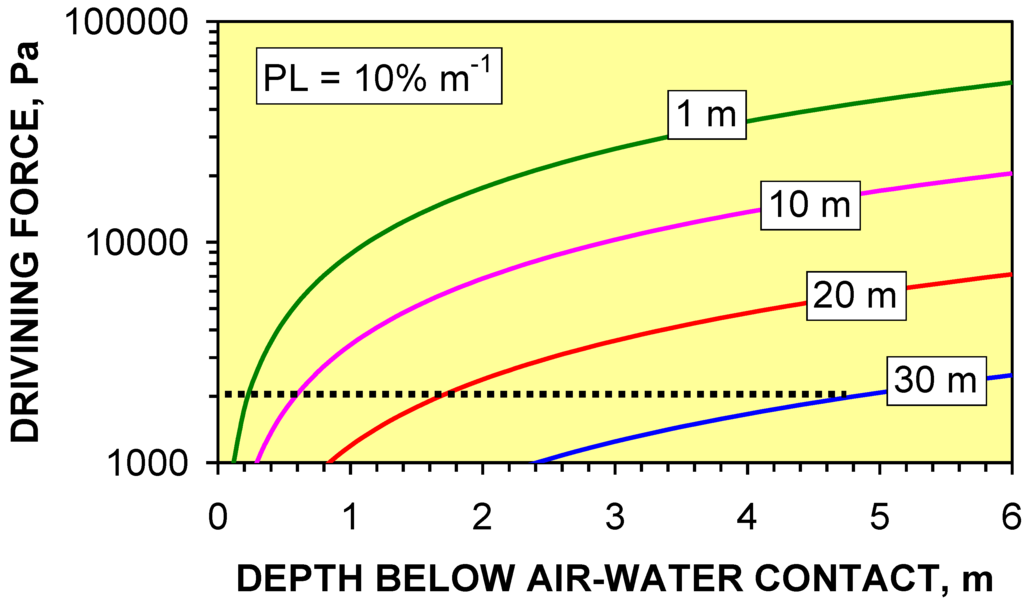
Figure 47.
Driving force (Pa) in macropores at a distance of 1, 10, 20, 30 m from the infiltration device as a function of their elevation below the air-water contact in the infiltration device: PL = 10% m–1.
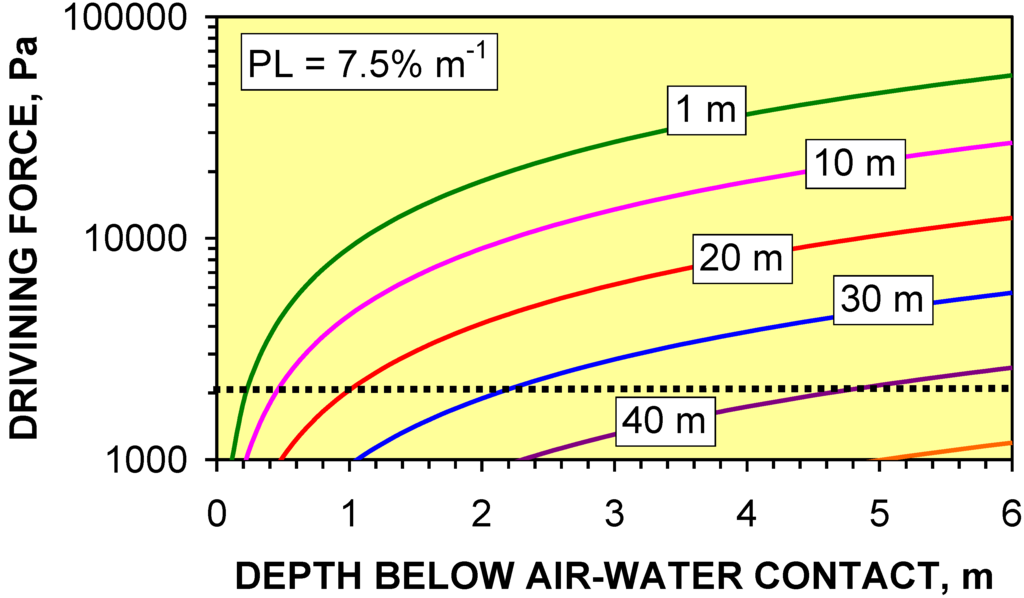
Figure 48.
Driving force (Pa) in macropores at a distance of 1, 10, 20, 30, 40, and 50 m from the infiltration device as a function of their elevation below the air-water contact in the infiltration device PL = 7.5% m–1.
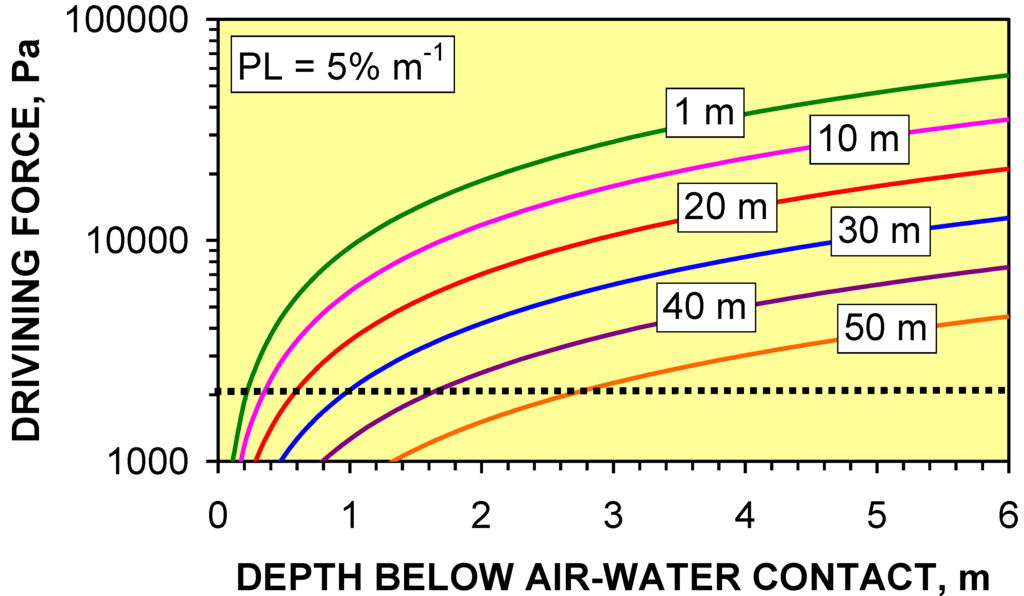
Figure 49.
Driving force (Pa) in macropores at a distance of 1, 10, 20, 30, 40, and 50 m from the infiltration device as a function of their elevation below the air-water contact in the infiltration device PL = 5% m–1.
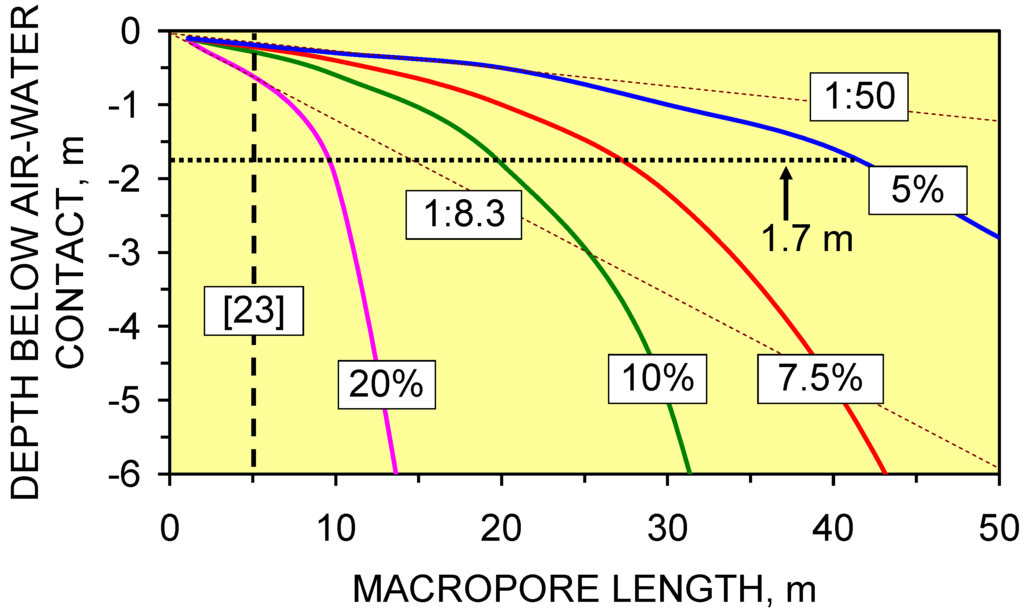
Figure 50.
Equilibrium macropore lengths (measured from the infiltration device) as a function of depth below the AWC in the infiltration device, and pressure losses [PL, % m–1] within the macropores. 1:8.3 and 1:50 (brown dash lines) indicate different contour gradients. [23] marks the design assumption for infiltration devices enshrined in the UK construction regulations [7,15,17,28,29,30,47,48,49,50].
Figure 50 demonstrates that:
- (i)
- Macropore length (at a specific depth below the AWC) increases with decreasing PL.
- (ii)
- Shallow macropores at a depth of <1.7 m below the AWC may extend for >40 m from the infiltration device. UK SUDS guidance [7,22,23,29,47] indicates that the groundwater mound associated with an infiltration device in permeable sediment will not extend more than 5 m from the device. This analysis demonstrates that a groundwater mound in impermeable sediment will have a substantially larger (and shallower) radial footprint.
- (iii)
- Infiltration devices placed on sloping sites where the gradient is steeper than 1:50 may experience overland flow due to the groundwater mound rising above the ground surface creating seepage zones.
The use of borehole infiltration devices [2] allows water column lengths to be increased. For example, an infiltration device with a 40 m water column will have a groundwater mound with a lateral extent of >100 m at the base of the infiltration device (Figure 51). The replacement of conventional shallow pits (typically <6 m deep) [7,15,17,22,23] with borehole soakaways (typically 40–100 m deep) in clayey sediments allows the storage capacity of the groundwater mound to be substantially increased. This, in turn, allows storm drainage from a substantially larger catchment area (and water volume) to be focused into the infiltration device.
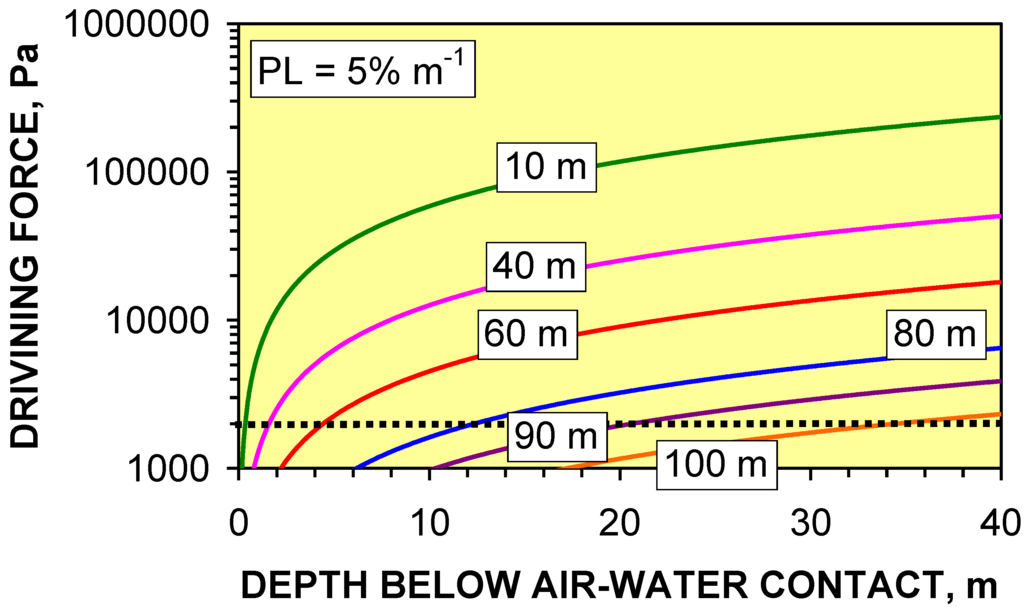
Figure 51.
Driving forces in the propagating macropores at distances between 10 and 100 m from the infiltration device. Minimum driving force (PC) required for macropore propagation is 2000 Pa. Macropores extend >100 m beyond the infiltration device when the water column exceeds 34 m.
4.5. Seepage Volumes Associated with Groundwater Mounds
At Greenloaning (Appendix 1, Appendix A.2), the groundwater mound for D3 intersects the ground surface creating a high volume of overland flow (Figure 44). This overland flow overloads the down slope soakaways D1 (Figure 52) and D2 (Figure 53) resulting in an extensive down slope overland flow discharge. Figure 44, Figure 52 and Figure 53 provide examples (25/1/2008) illustrating that overland flow associated with an upslope infiltration device can overload down slope infiltration devices. This can transfer flooding problems from a developed site to a neighboring area, or can create a flooding problem on the developed site, which also results in overland flow on a neighboring area [1,2]. Figure 54 illustrates an example of overland flow on a neighboring property resulting from the overloading of D2 (Figure 53). Figure A1 provides a location map for each soakaway (D1, D2, and D3).
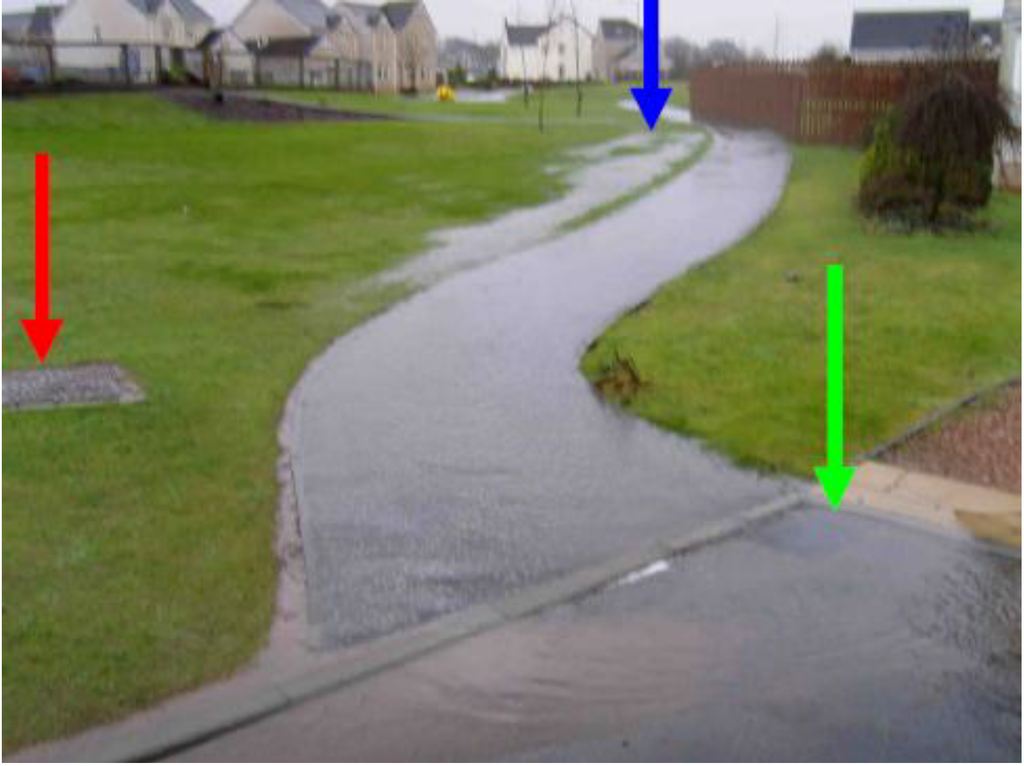
Figure 52.
Seepage from R1 (blue arrow) flowing to the terminal gullies (green arrow) of D1 (red arrow) and overtopping them. Date: 25/1/08.
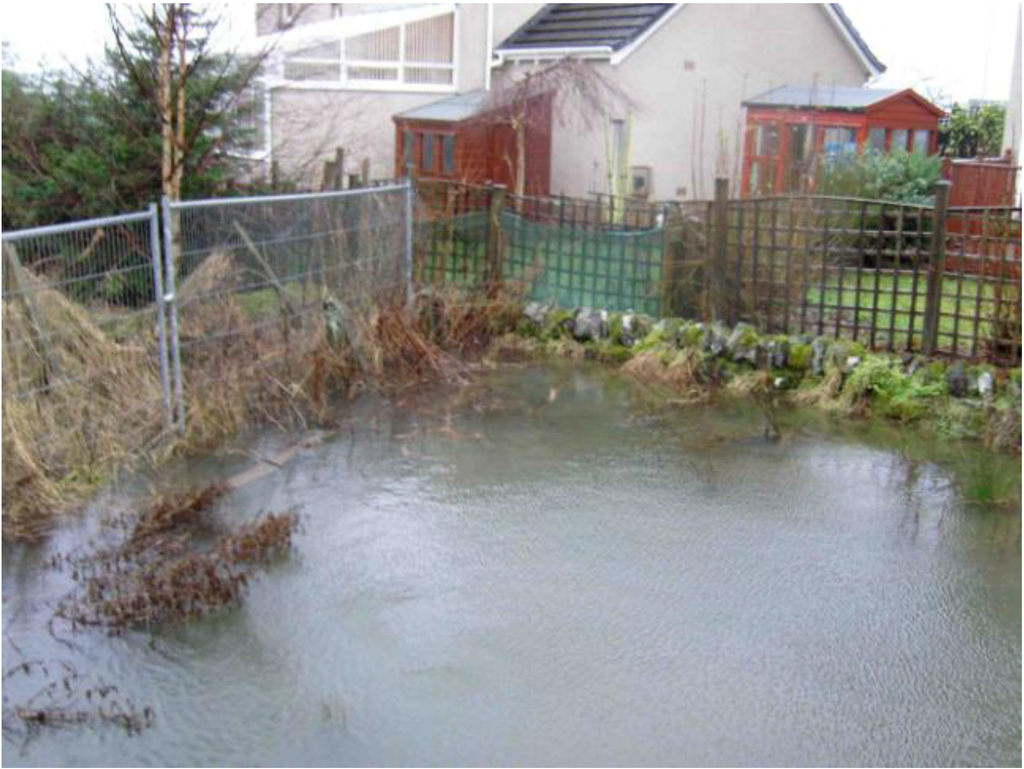
Figure 53.
Overland flow from R1 and D1 ponding over D2. Date: 25/1/08.
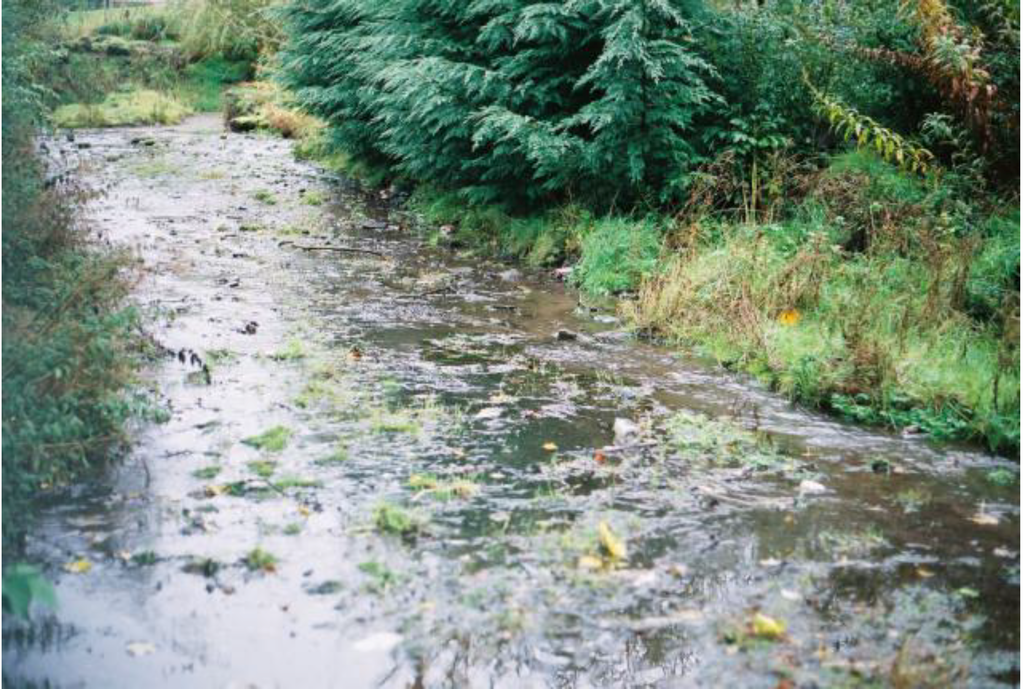
Figure 54.
Overland flow from D2 flowing across a down slope property. Date: 12/10/05.
The D3 groundwater mound (Figure 44) has a high anisotropy indicating that pressure losses associated with horizontal macropore formation may be less than 5% (Figure 51). This high anisotropy is the principal reason why the overland flow occurs, and why high volume vertical vents (vertical pipes/macropores) are present (Figure 44).
The observed high anisotropy confirms the presence of a high tortuosity in the groundwater mounds boundary envelope (Figure 15, Figure 17). At Greenloaning there is a relationship between pressure loading of the groundwater mound (Equation 3) and seepage volumes [3]. This relationship indicates that the seepage volumes will be related to:
- (i)
- τ,
- (ii)
- the volume of water stored in the groundwater mound prior to the recharge event, and
- (iii)
- recharge volumes over a longer period, rather than a shorter period.
4.5.1. Groundwater mound storage volume
The volume, VRW, of relict water within the groundwater mound between zj and zy at the storm onset is:
where B = radius of the soakaway, (m); zj = elevation of the air-water contact in the soakaway (m); zy = elevation of the observed seepage zone (m); c = a shape factor to account for the upper surface of the groundwater mound, 0 < c < 1; N = net to gross ratio (i.e., proportion of the sediment within the mound that acts as a water store) 0 < N < 1; φ = inter particle/macropore porosity; Sw = water saturation in the porosity; SR = proportion of Sw which is mobile. [N φ SwSR] is assumed to be 20%, c = 0.35, and B = 1 m. Figure 56 illustrates the estimated storage volumes, as a function of (zj-zy) and τ. This analysis is consistent with τ = 10–20 and implies that the groundwater mound for D3 has a radius of between 30 and 66 m. Figure 44 and Figure 52 show that the groundwater mound rises to the ground surface 30–40 m downslope of D3, indicating (Figure 50) that the minimum pressure loss (PL) in the propagating macropores is 5%–7.5% m–1.
VRW(m3) = [c π(L+B)2(zj-zy)N φ SwSR]
4.5.2. Seepage volumes
The vertical macropores (Figure 44) have a surface elevation, which is about 1.7 m below the ground surface over D3. This allows the bulk of the overland flow (Figure 55) to be a through flow, i.e., recharge water flows directly from the infiltration device to the seepage location. The observed relationship between relict overland flow (calculated as [observed flow volume–24 hr recharge]) vs. (zj-zy) (Figure 56) and [observed flow volume–360 hr recharge] vs. (zj-zy) (Figure 57) demonstrate that relict water volumes (in the overland flow) are most likely to be present when (zj-zy) > 0.5m. The relict water volume approximates to τ = 10 (Figure 56).
This analysis indicates that (i) the seepage discharges can access stored relict water held in the groundwater mound at elevations, which are located above the seepage zone; and (ii) the seepage discharge can include relict water, which was placed in the groundwater mound over a period of >360 hrs. Analysis of total seepage volumes vs. recharge volumes (Figure 58, Figure 59 and Figure 60) confirm that (i) the overland flow contains a substantial volume of relict water, and (ii) some of the relict water can be attributed to recharge to the groundwater mound over a period of more than 3 weeks (504 hrs).
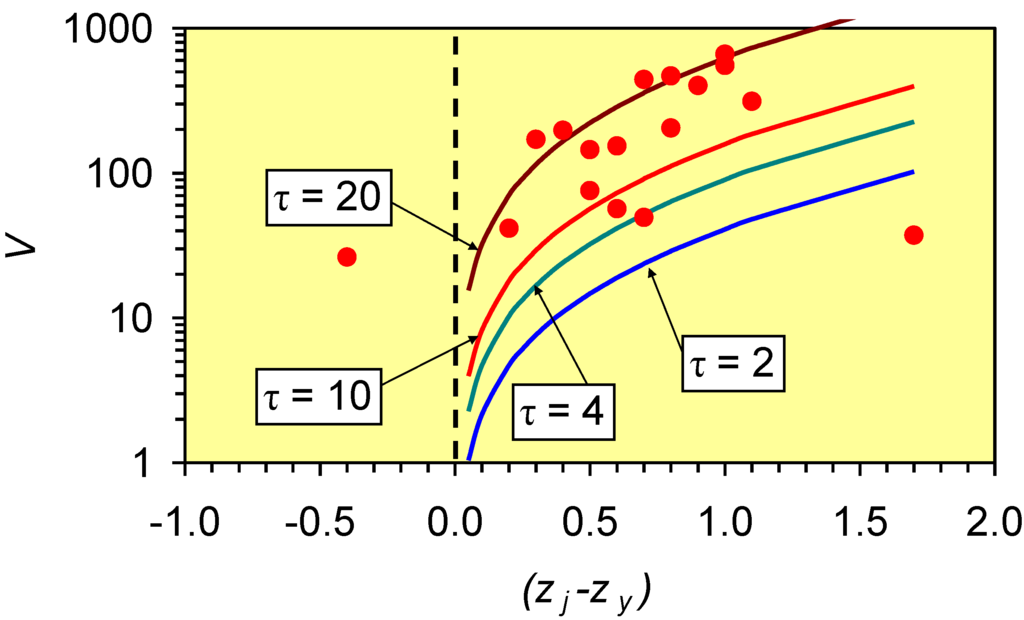
Figure 55.
Relationship between static water levels (D3) at storm onset (relative to the seepage zone elevation) and overland flow volume (V, m3). Dates: 24/6/04–25/1/08 (n = 17).
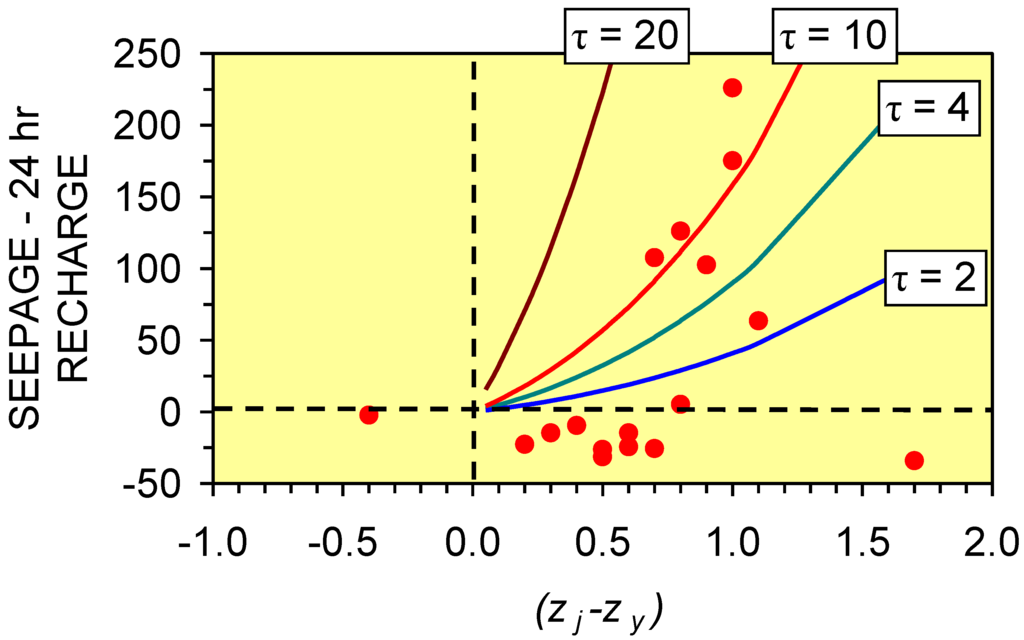
Figure 56.
[Observed seepage volume–the 24 hour storm recharge] (V, m3) vs static water level (D3) at storm onset. Dates: 24/6/04–25/1/08 (n = 17).
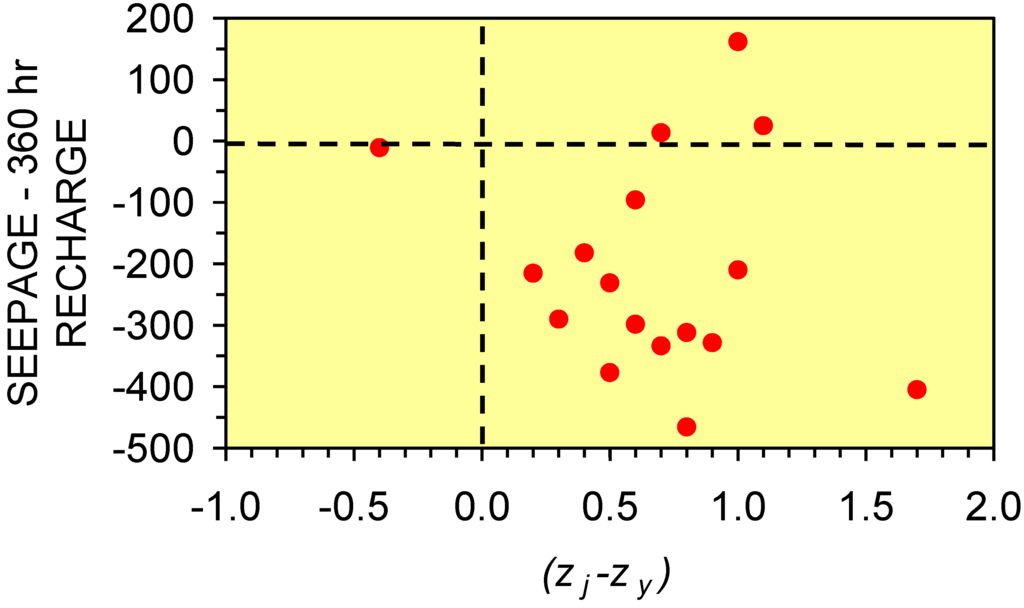
Figure 57.
[Observed seepage volume – the 360 hour storm recharge] (V, m3) vs static water level (D3) at storm onset. Dates: 24/6/04 – 25/1/08 (n = 17).
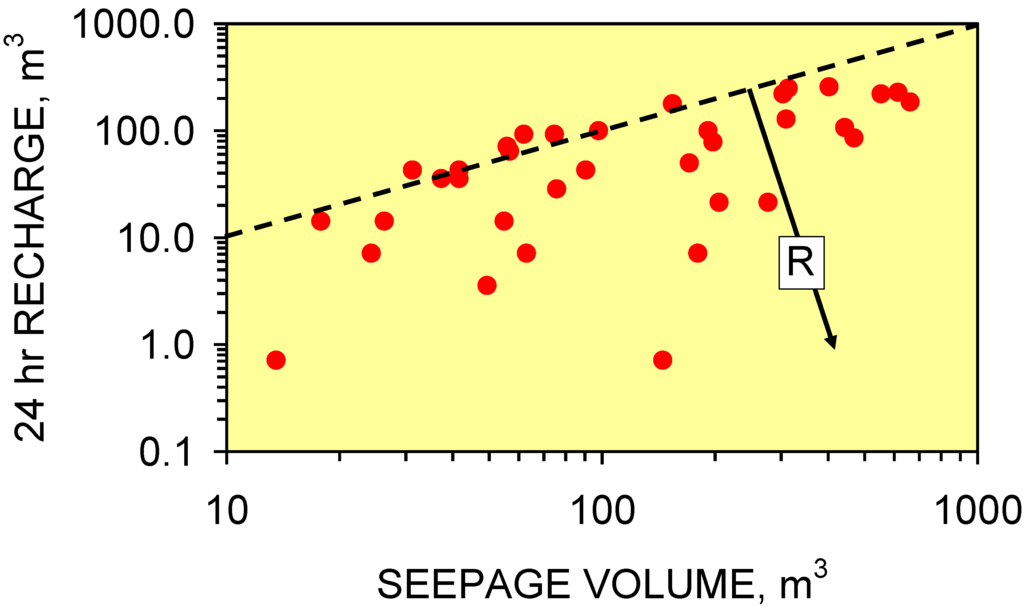
Figure 58.
Relationship between 24 hour recharge and seepage volume: R = Seepage includes relict water. A small storm can trigger a high volume seepage event. Data from 30/11/01 to 25/1/08.
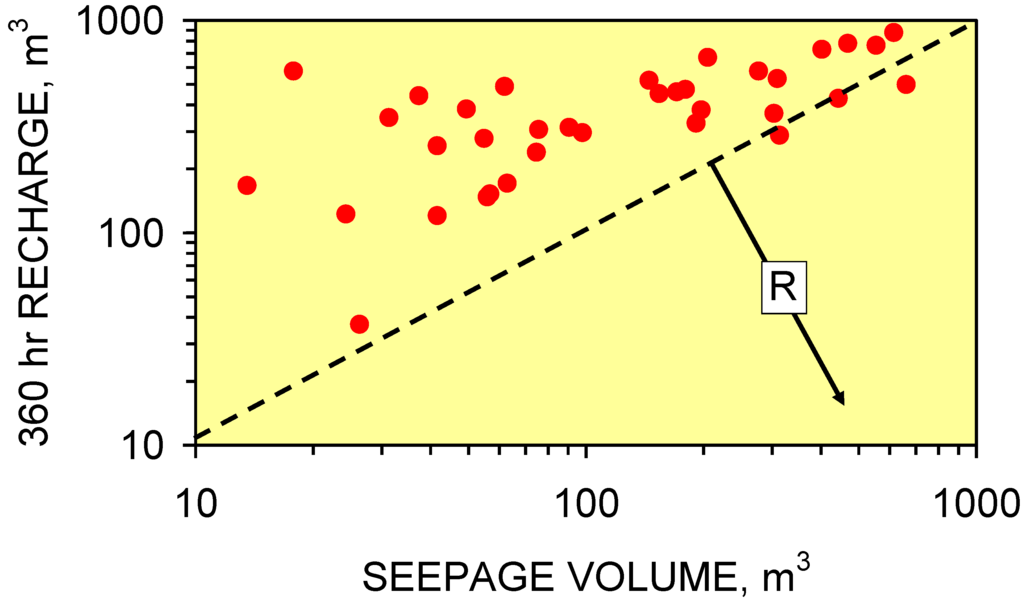
Figure 59.
Relationship between 360 hour recharge and seepage volume. R = Seepage includes relict water. Data from 30/11/01 to 25/1/08.
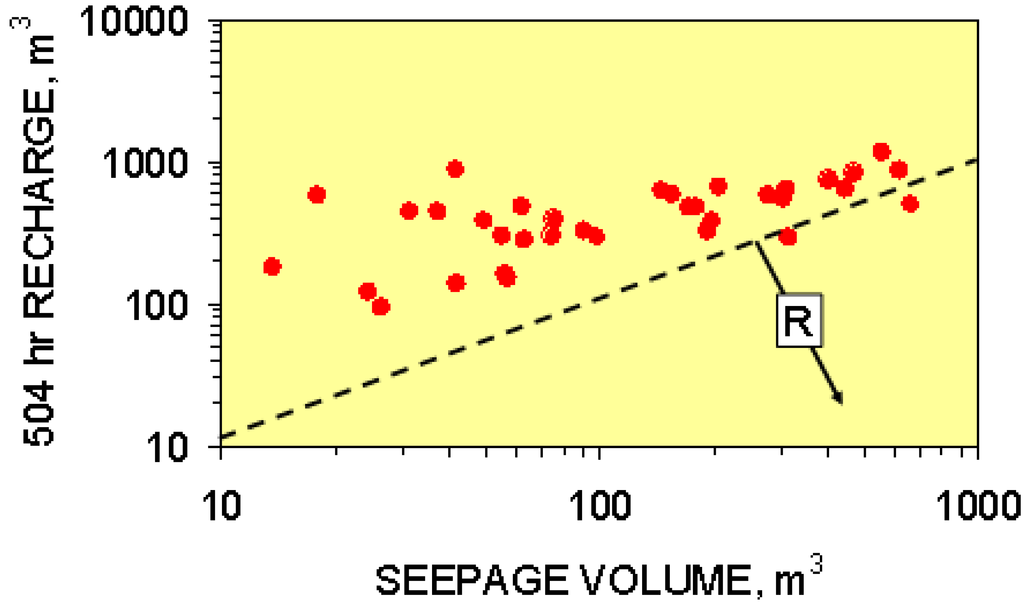
Figure 60.
Relationship between 504 hour recharge and seepage volume. R = Seepage includes relict water. Data from 30/11/01 to 25/1/08.
5. Modeling a Groundwater Mound for Storage
This analysis has identified that:
- (i)
- macropores are used to disperse water from the infiltration device into the surrounding sediments to form a groundwater mound;
- (ii)
- storage volumes associated with the macropores increase with depth within the mound;
- (iii)
- major conduit or carrier macropores are used to carry large volumes of water within the mound. Where these carrier conduits intersect the ground surface, high volume, high flow rate, discharges occur.
Seepage analysis (at Greenloaning) indicates that the maximum overland flow rates can be in the order of 0.16–0.7 m3 s–1 [1] and the maximum volumes associated with a seepage event may exceed 700 m3 (Figure 58, Figure 59 and Figure 60). These observations suggest that: (i) the interior of a groundwater mound created in a clay soil (by infiltration) is highly permeable; and (ii) abstraction of reservoired water can be at high rates and involve substantial volumes.
The standing water analysis has established that: (i) the groundwater mounds do not descend with time, and (ii) their maximum lateral extent coincides with the base of the infiltration device. This study uses two approaches to model the morphology of the groundwater mound. They are the Dupuit Model [1] and the macropore propagation model (Figure 46, Figure 47, Figure 48, Figure 49, Figure 50 and Figure 51). The two models are used to establish the volume of water, which can be held within a groundwater mound and how this storage volume may alter with time.
5.1. Upper Surface of the Groundwater Mound: Dupuit Model
The upper surface elevation (zx) of the groundwater mound at a distance x from the infiltration device using the Dupuit Equation approximates to [1,51]:
where zD = the elevation (m) of the groundwater mound at a distance D from the infiltration device where x<D; zj = the elevation (m) of the groundwater mound in the infiltration device. The maximum width (m) of the groundwater mound during recharge (D) will approximate the base of the device [2]. i.e., zD = the elevation of the base of the infiltration device.
zx = (zj2 – [zj2 –zD2](x/D))0.5
D is not observed. However zj is known, and the elevation of the intersection of the base of the seepage zone with the ground surface is known. This intercept point, (elevation zx1; distance from soakaway, xx1) marks a defined point on the upper surface of the groundwater mound, which allows the location of D (and the upper surface of the groundwater mound) to be graphically solved.
Figure 61 illustrates the principal points required to define the upper surface of the groundwater mound on a 2D Dupuit cross-section (of elevation vs. distance relative to a defined location) when seepage (overland flow) occurs. They are:
- (i)
- The elevation (m) of the ground surface (GS) relative to the base of the soakaway.
- (ii)
- Distance relative to G1 (m) (or another reference location).
- (iii)
- The location of the soakaway, D3. The D3 soakaway is shown as being 3 m wide and 1.2 m high [1,2]. It consists of a central pre-formed perforated concrete ring, surrounded by coarse gravel. The perforated concrete ring is overlain by a storage chamber made of pre-formed (non-perforated) concrete storage rings [1].
- (iv)
- The groundwater mound can only rise above the ground surface when the air-water contact (zj) in the storage chamber is located above the elevation of the down slope ground surface.
- (v)
- The location of the vertical macropores (V) marks an intersection point between the groundwater mound and the ground surface (elevation zx1; distance from soakaway, x1).
- (vi)
- Integrating these observations with Equation 15 allows the upper surface of the groundwater mound to be defined as a Dupuit envelope (Figure 61).
- (vii)
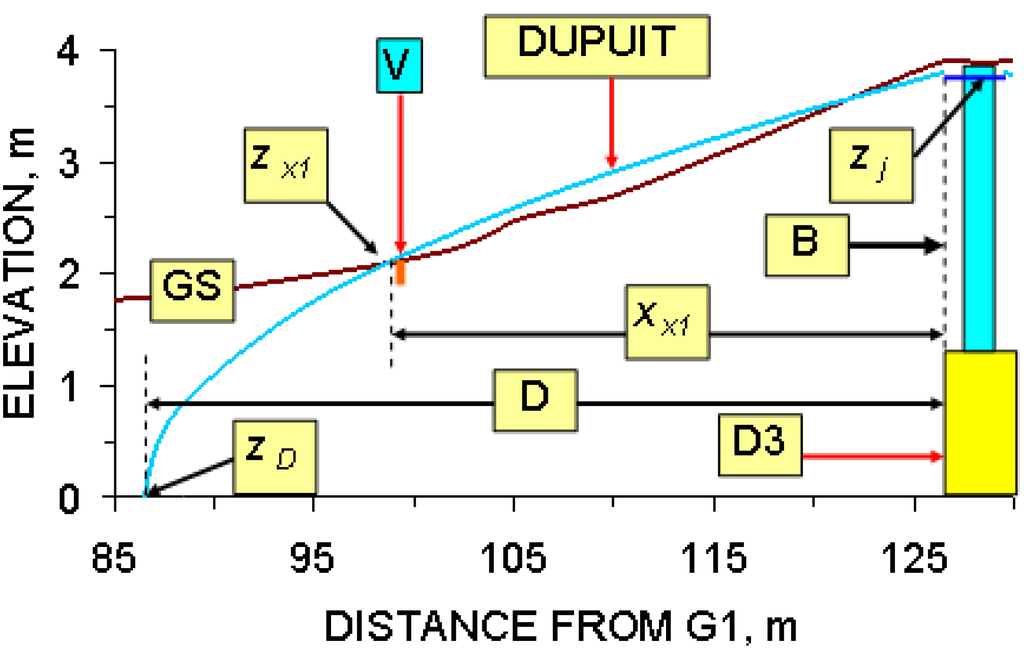
Figure 61.
Dupuit Cross-Section showing the upper surface of the groundwater mound for D3. Seepage Event: 25/1/08. V = vertical macropore location. GS = ground surface. B marks the edge of the soakaway, where the soakaway is overlain by a storage chamber with an impermeable wall.
5.2. Upper Surface of the Groundwater Mound: Macropore Propagation Model
The macropore modeling (Equation 10, Figure 50) established that the upper surface of the groundwater mound is a function of:
- (i)
- the macropore propagation rate (m s–1 Pa–1),
- (ii)
- driving force (Pa) exerted by the infiltration device,
- (iii)
- the critical driving force (Pa) required to initiate macropore propagation, and
- (iv)
- pressure losses (Pa) within the macropore network as a function of distance from the infiltration device (Figure 50).
The principal control on the shape of the upper surface of the groundwater mound for a known zj, is the pressure losses (PL) within the macropore network (Figure 50). The vertical macropore discharge location (Figure 44) indicates a minimum pressure loss within the macropore network of 7.5% m–1 (Figure 62).
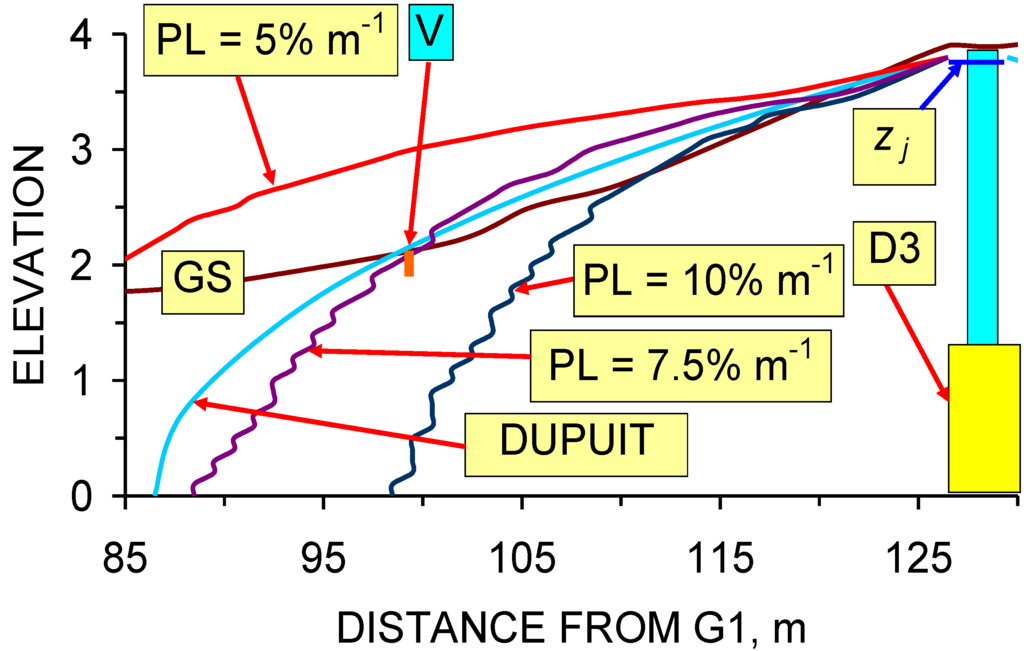
Figure 62.
Dupuit Cross-Section and Macropore Modeling Cross-Sections showing the upper surface of the groundwater mound for D3 at time, t = a: PL = pressure loss; Date: 25/1/08.
5.3. Lower Surface of the Groundwater Mound: Dupuit Model
The Dupuit analysis (Figure 61) has established the maximum lateral extent (D) of the mound is around 40 m. The anisotropic ratio (kh/kv) and associated compaction values for clays indicate (Figure 63) that at the Greenloaning site (D3) the overall anisotropy may be in the order of 20–40. This ratio indicates that the groundwater mound will extend a maximum of between 1 m and 2 m below the base of the infiltration device (median 1.5 m). Equation 15 defines the base of the groundwater mound (Figure 64).
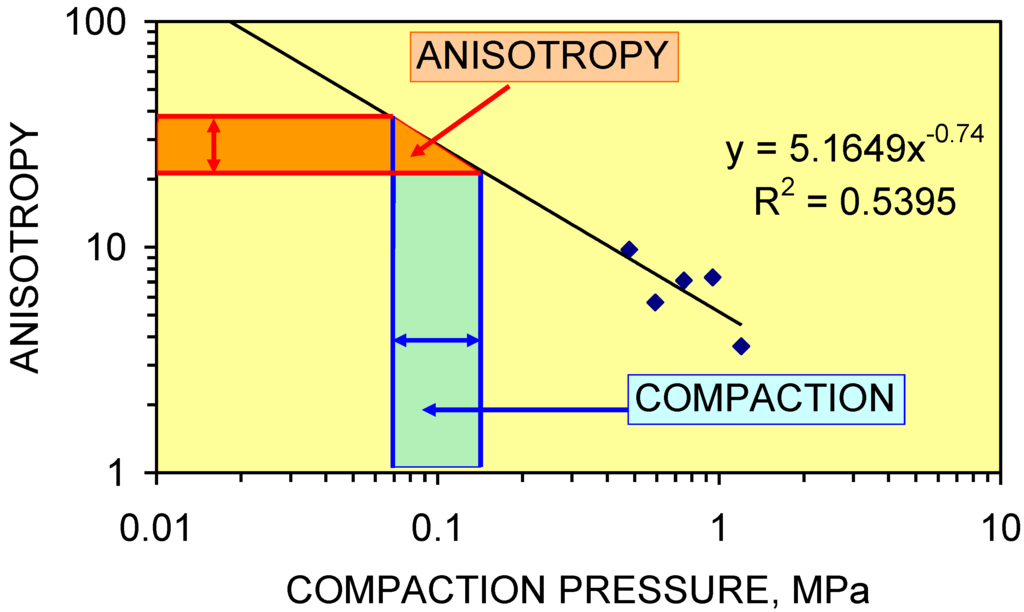
Figure 63.
Relationship between anisotropy and compaction in clay. Data: [18]. The area marked in blue represents the maximum overburden compaction in the lodgment till at Greenloaning (calculated as 9806.65 × clay density (t m3) × clay thickness).
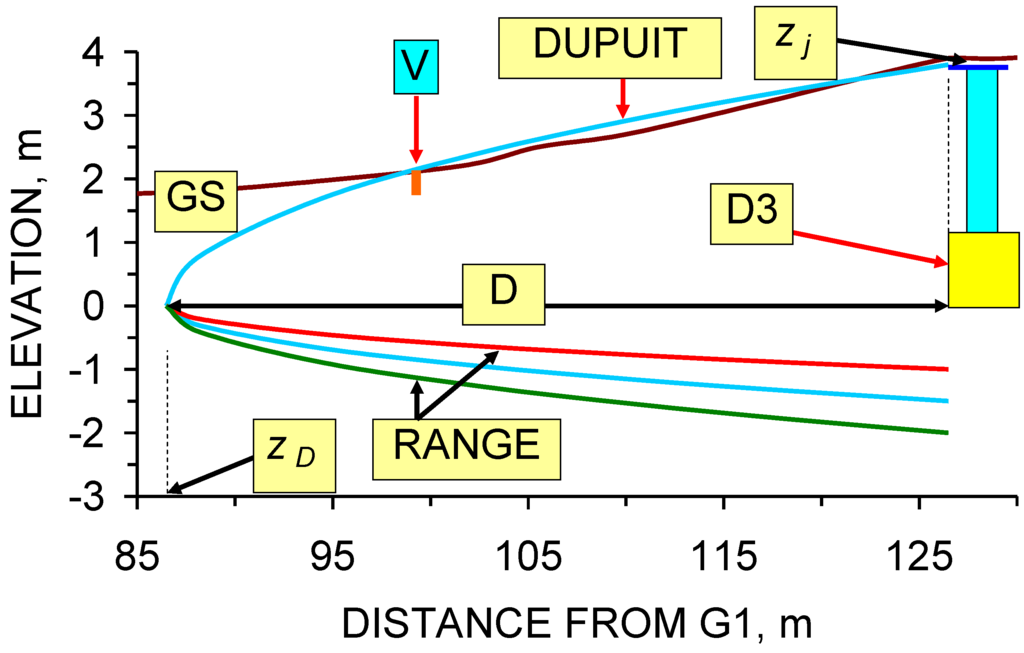
Figure 64.
Dupuit cross section showing the top and base of the static groundwater mound for D3. Date: 25/1/09.
5.4. Macropore Analysis of the Lower Surface of the Groundwater Mound
The maximum lateral extent (D) of the mound varies with pressure loss (Figure 62). The consideration of anisotropy (Figure 63) allows the base of the groundwater mound to be defined (Figure 65) where the maximum depth of the mound is calculated as the maximum width (at the device base) × kv/kh.
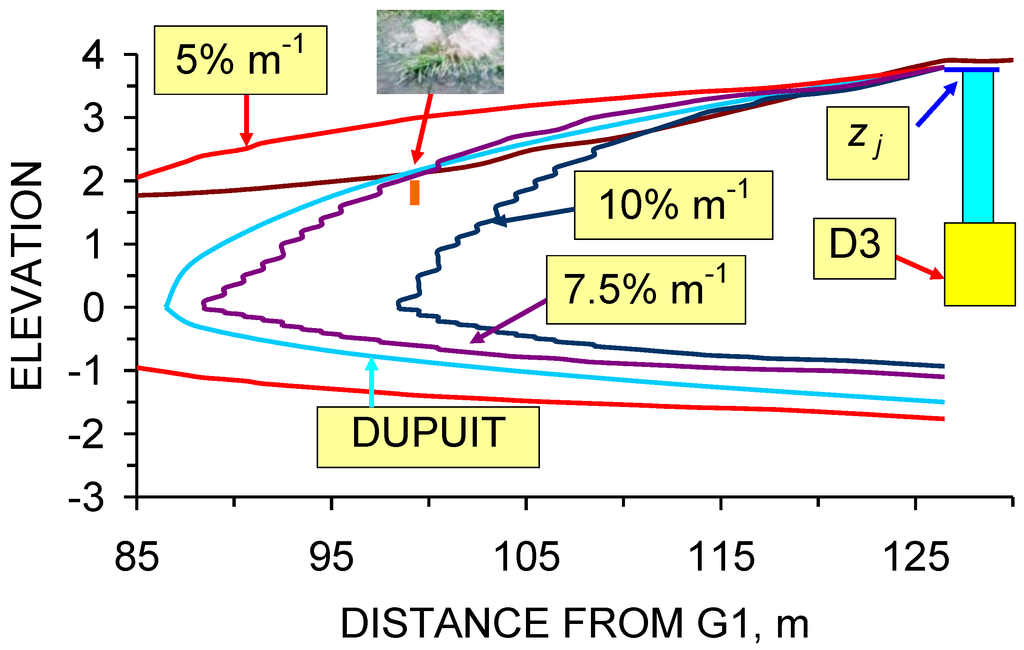
Figure 65.
Dupuit Cross-Section and Macropore Modeling Cross-Sections showing the upper and lower surfaces of the groundwater mound for D3 at time, t = a: The mounds are shown for pressure losses of 10% m–1, 7.5% m–1 and 5% m–1 within the macropores.
5.5. 3D Mound Volume and Assessment of Potential Resource
The groundwater mound has a circular/ellipsoid plan section containing a network of high permeability macropores radiating from the infiltration device to its boundaries (Figure 43 and Figure 44). The volume of the ellipsoid defines the storage capacity. The mound gross rock volume (GRV(m)) is calculated by integrating the surface contours of the mound as a function of depth, or by using a simple approximation of the form:
GRV(m) (m3) = Area (m2) × Height (m) × Shape Factor
The shape factors for the groundwater mounds (Figure 65) increase with decreasing pressure loss (Figure 66). The Shape Factor (Figure 66) is calculated for a circular groundwater mound as
where Lmax = the radius of the groundwater mound at the base of the infiltration device (m); a+b = difference in elevation between the top and base of the groundwater mound at the infiltration device (Figure 67).
Shape Factor = GRV(m)/((a+b)π(Lmax)2)
GRV(m) = GRV(u)+GRV(l)
GRV(u) = Σ GRV(s) (upper))
GRV(u) = Σ GRV(s) (lower))
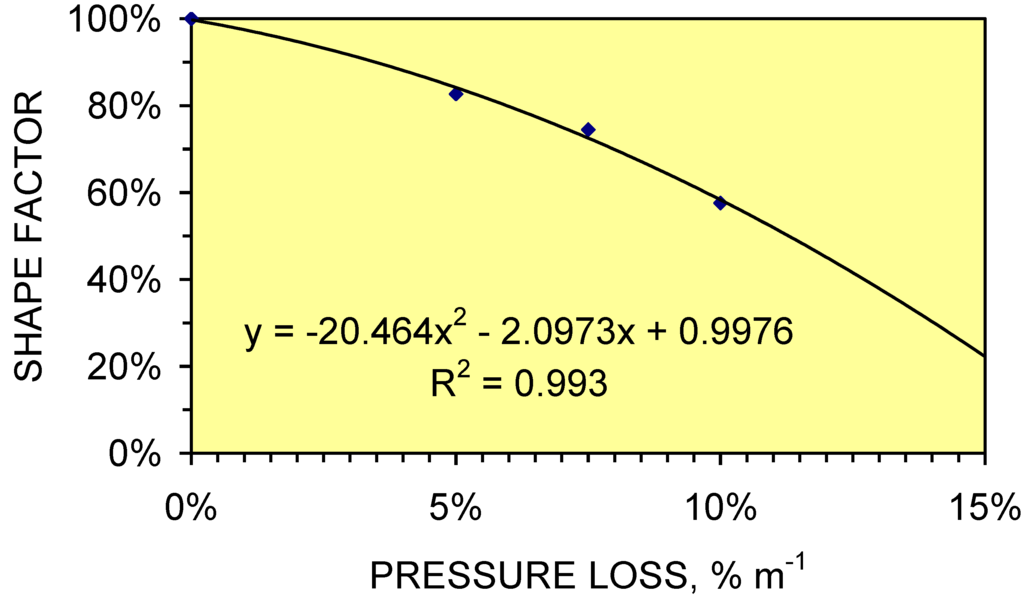
Figure 66.
Relationship between shape factor and pressure loss in the macropores within the groundwater mound (% m–1); w = 0.1 m; s = 0.5.
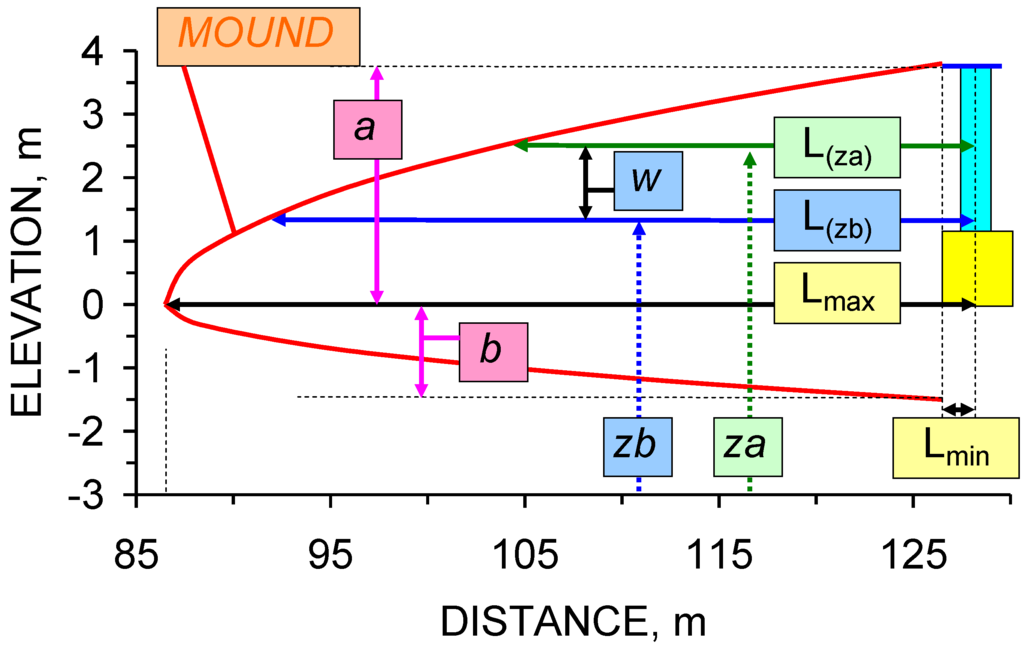
Figure 67.
Identification of measurements used in Equations 17 to 23 to determine the mound GRV.
The gross rock volume contained within the groundwater mound GRV(m) can be calculated (Figure 67) by assuming that the mound has a circular form with a maximum radius (Lmax) at the base of the infiltration device, and a minimum radius (Lmin) at the air-water contact (within the infiltration device). The GRV can be modeled as a number of horizontal slices. Each horizontal slice equates to a depth increment of w, m (e.g., 0.1 m). The gross rock volume (GRV(s)) associated with each depth increment is calculated as:
where L(za) = radius of groundwater mound at elevation za; L(zb) = radius of groundwater mound at elevation zb; za is above zb; s = an increment shape factor where 0 ≤ s ≤ 1.
GRV(s (upper)) = (w π (L(za))2)+(ws ((π (L(zb))2)–(π (L(za))2))
GRV(s (lower)) = (w π (L(zb))2)+(ws ((π (L(za))2)–(π (L(zb))2))
5.6. Net Storage Volume
The net storage volume (NSV) can be estimated as:
where φ = porosity (20%–40% in lodgment till [52,53,54]); 0 ≤ φ ≤ 1; N = net to gross ratio (i.e., proportion of sediment within the groundwater mound which is able to store water) 0 ≤ N ≤ 1; Sw = water saturation of the porosity; 0 ≤ Sw ≤ 1. There is also porosity in a lodgment till which is associated with sub-horizontal Riedel shears [2,53] and inter-layer porosity [37,38]. The total net porosity, which may be available for water storage is in the general range <30–>60% of the gross rock volume. For the purposes of this study it is assumed that [φ N Sw] approximates to 40%. This relationship (Figure 68) indicates that a single infiltration device, with a maximum water depth of 3.8 m has the potential to store <3,000 to >16,000 m3.
NSV(m3) = GRV(m) φ N Sw
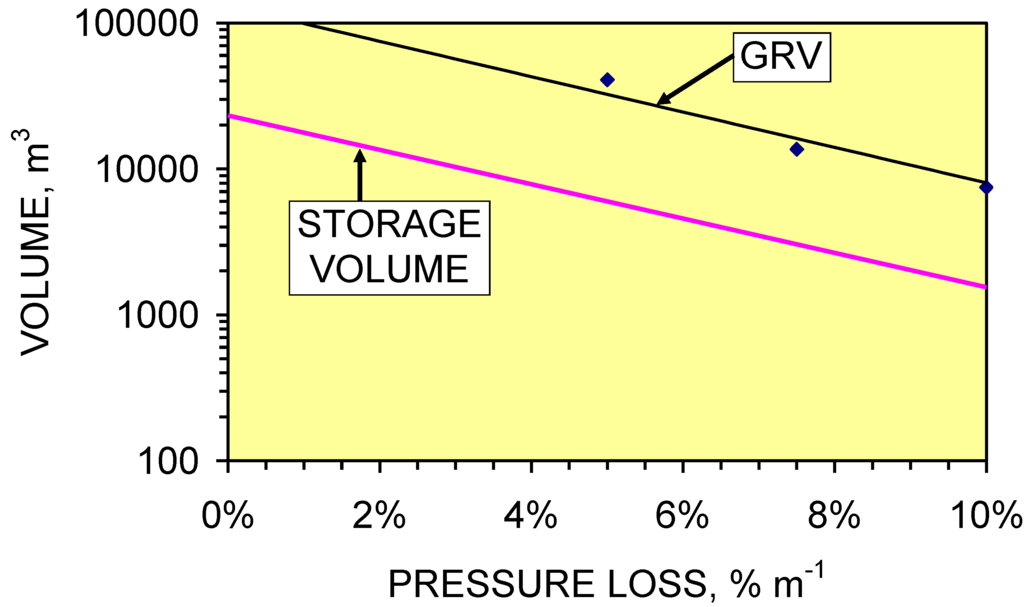
Figure 68.
Gross rock volume (GRV) and net storage volume of the groundwater mound for D3 as a function of pressure loss in the propagating macropores within the mound. Net storage is estimated at 40% of GRV.
A static groundwater mound will lose water through the base and sides of the groundwater mound via:
- (i)
- Knudsen diffusion within the sediment matrix,
- (ii)
- macropores extending the groundwater mound into down slope (or adjacent) groundwater mounds,
- (iii)
- fractures allowing infiltration into deeper horizons,
- (iv)
- overland flow when the groundwater mound rises above the ground surface.
The volumetric analyses indicate that the bulk of the water entering a groundwater mound is retained within the upper part of the mound in a recoverable form (by high flow rate viscous flow) for >24–>360 hrs. The mound mass balance is:
Stored Volume (m3) = Recharge Volume–Losses
At Greenloaning, the annual rainfall is 0.8–1.2 m. The recharge to D3 associated with a 100 mm storm is 416 m3. D3 receives between 3,328 and 4,992 m3 per year. The D3 mound is associated with a pressure loss of <5% m–1. Its estimated net storage capacity (Figure 68) is 6,500 m3 (assuming 40% net). The expected leakage through the Knudsen diffusion boundary envelope (Equation 4) of the groundwater mound is estimated at 0.023 m3 yr–1. The average stored volume within the mound, after 1 year of storage operation is between 3,328 and 4,992 m3 (before leakages are considered).
5.6.1. Changes in storage capacity with time
The maximum pressure in a vertically propagating macropore decreases with increasing depth (Figure 69). As the vertical macropore flow conduits become established, the pressure losses associated with vertical macropore propagation will decline with time. A maximum mound depth below the infiltration device of 1.8 m (Figure 65) equates (where PC = 2000 Pa) to a vertical pressure loss of about 47%–50% 0.1 m–1. In the example (Figure 69), the driving force at the base of the device is [3.8 m × 9806.65 Pa = 37265 Pa]. The driving force at –0.1 m depth and 30% pressure loss is [((1 – 0.3) + 37265 Pa) + (0.1 m × 9806.65) = 27066 Pa]. The driving force at –0.2 m depth and 30% pressure loss is [((1 – 0.3) × 27066 Pa)+(0.1 m × 9806.65) = 19927 Pa].
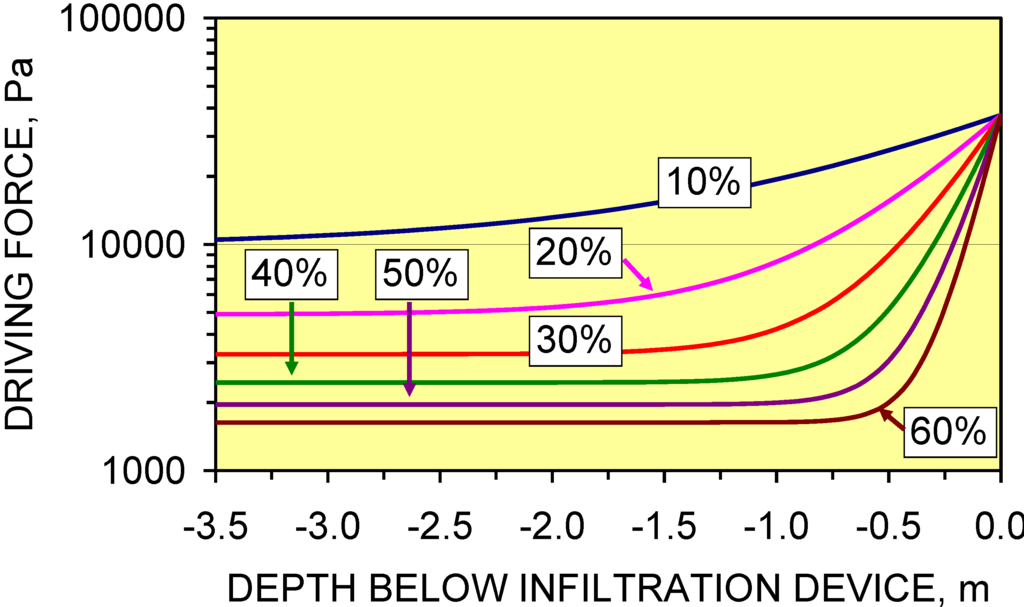
Figure 69.
Driving force as a function of depth below the infiltration device, where the device has a water column of 3.8 m and pressure losses are between 10% 0.1 m–1 and 60% 0.1 m–1.
Reducing the pressure losses associated with vertical macropore propagation (with time), allows the base of the groundwater mound to descend with time (Figure 70). This increases the storage volume of the mound located below the base of the infiltration device (Figure 70).
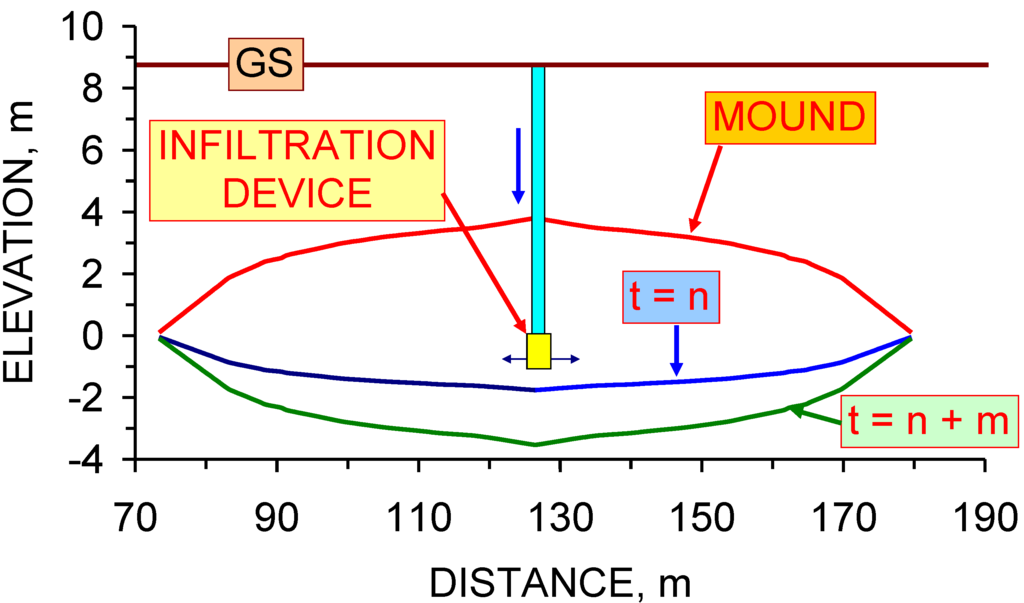
Figure 70.
Groundwater mound morphology as a function of time, t. GS = ground surface.
Infiltration forming part of a SUDS scheme in a lodgment till (or clayey soil) will result in the formation of an anisotropic pressure mound. The mound anisotropy will decrease with time as the basal envelope of the mound descends. As the base of the mound descends, the height of the static water column held in the mound (between the AWC and mound base) increases. When the pressure (Equation 4) exceeds a critical level (PCR), a vertical zone of macropore/natural pipe/fluidization flow will develop (through either the base, or the upper surface of the mound) to discharge water to a point of low potential [3,4].
The vertical zone of high volume flow drains the section of mound with an elevation above its discharge point. In any groundwater mound, two critical pressures are present. They are PCR(upper surface) and PCR(lower surface). Figure 44 and Figure 52 illustrate an example where PCR(upper surface) has been exceeded. This allows the sediment volume located above the seepage discharge elevation to be drained. Exceedence of PCR(lower surface) will result in a vertical discharge through the base of the mound. This situation allows the entire mound to be drained.
Groundwater mound management, requires that the pressure in the mound (Equation 4) is less than PCR(upper surface) to prevent overland flow occurring (Figure 71), and less than PCR(lower surface) to prevent the contents of the mound discharging to an underlying aquifer (Figure 72). Maintaining a groundwater mound within these pressure limits allows the water stored in the mound to be available for abstraction, while at the same time preventing the contents of the mound discharging as overland flow.
PCR(lower surface) decreases as proximity to the underlying aquifer increases (Figure 72). PCR(upper surface) decreases as proximity to the ground surface increases (Figure 71) or proximity to an overlying aquifer increases (Figure 73). Exceedence of PCR(upper surface) where the clay is overlain by an aquifer (or more permeable sediment) (Figure 73) may affect slope/soil stability.
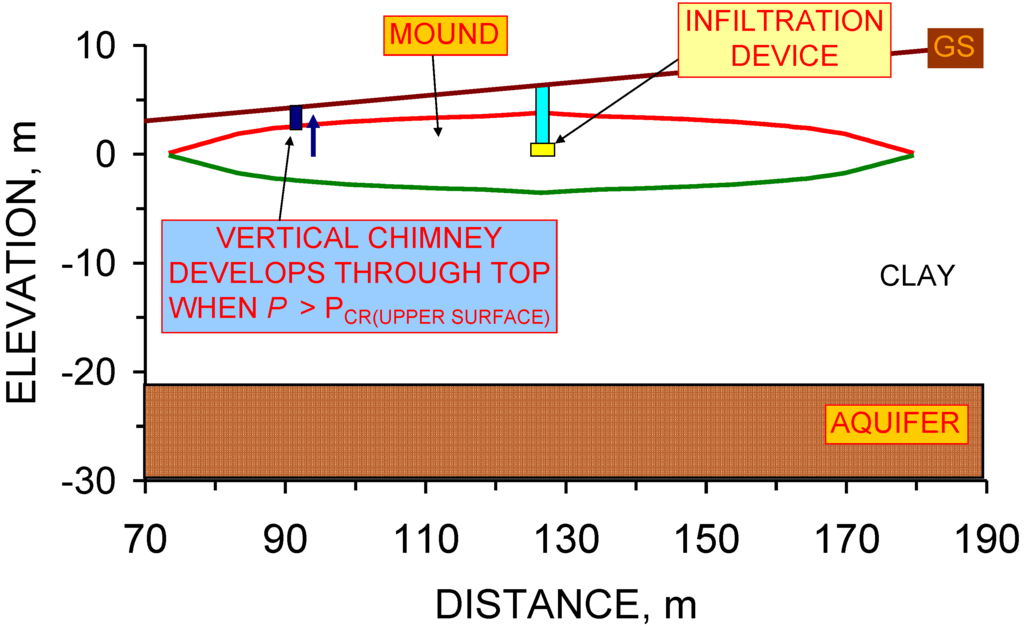
Figure 71.
Vertical chimney development through the upper surface of the groundwater mound. GS = ground surface.
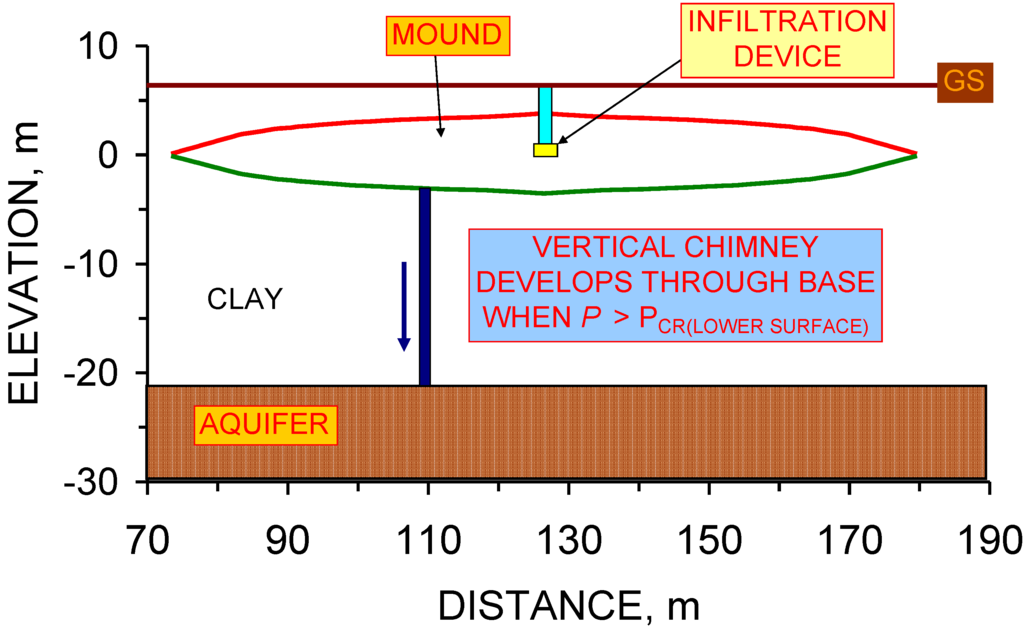
Figure 72.
Development of a vertical chimney through the lower surface of the groundwater mound. GS = ground surface.
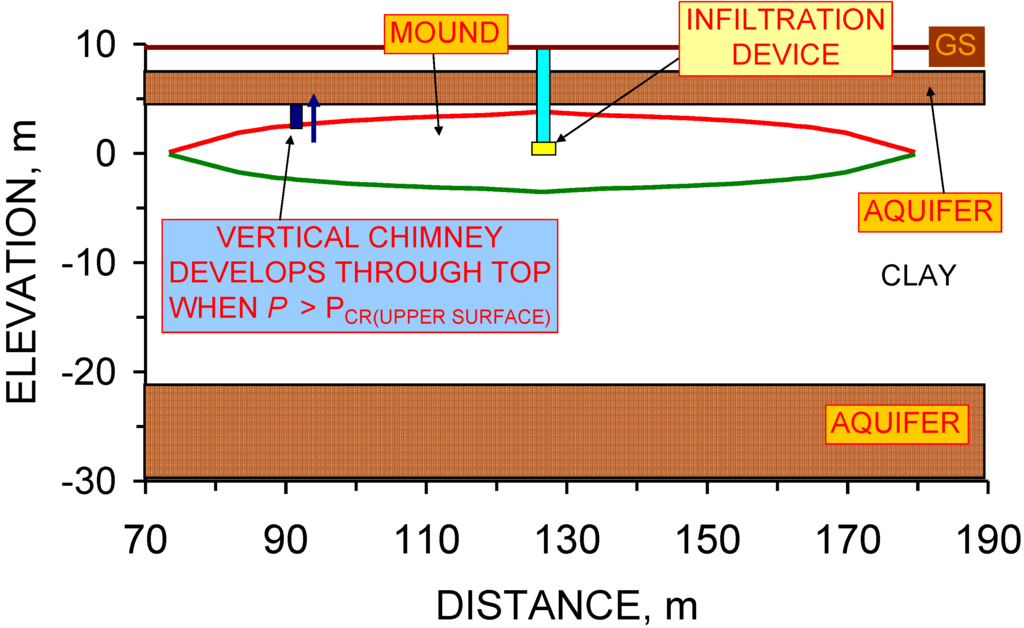
Figure 73.
Development of a vertical chimney through the upper surface of the groundwater mound, resulting in charging of a shallower aquifer. GS = ground surface.
5.7. Potential Resource
Figure 71, Figure 72 and Figure 73, define the operating limits for the groundwater mound storage unit. The mound storage volume will increase with time (Figure 70). A typical SUDS infiltration device will be designed to have a maximum water column of between 1 and 6 m [7,15,17]. The example data set has established that a 3.8 m water column could create a stored resource (NSV) of >6,500 m3. The aerial extent, and NSV, of the groundwater mound increases with the height of the water column. For example, increasing the water column height to 40 m increases (Figure 51) the radius of the groundwater mound to >100 m (PL = 5% m–1) and the GRV (m) to >1,125,719 (m3). This analysis assumes an anisotropy of 30, and a base of the mound 3.3 m below the base of the infiltration device; NSV (40% porosity) = 450,257 m3.
6. Extraction of Water from a Groundwater Mound
Section 5 has modeled the groundwater mound morphology and the volumes of stored water, which may be available for abstraction. The principal controls on the storage capacity are the pressure losses associated with macropore propagation, PCR(upper surface) and PCR(lower surface). These parameters may change with time and vary laterally. Exceeding either of PCR(upper surface) or PCR(lower surface) results in the entire mound (located above the elevation of the associated vertical chimney and below the mounds upper surface being rapidly drained). This situation has been confirmed by field observation and field measurements.
These observations allow the groundwater mound to be visualized as a very high permeability reservoir (located in impermeable sediment), which can be used for abstraction. The abstraction borehole can be structured to mimic a vertical chimney through the upper surface of the mound (Figure 71). The negative pressure exerted by the borehole pump is defined as the difference between the elevation of the upper surface of the mound and the water level in the borehole (Figure 74).
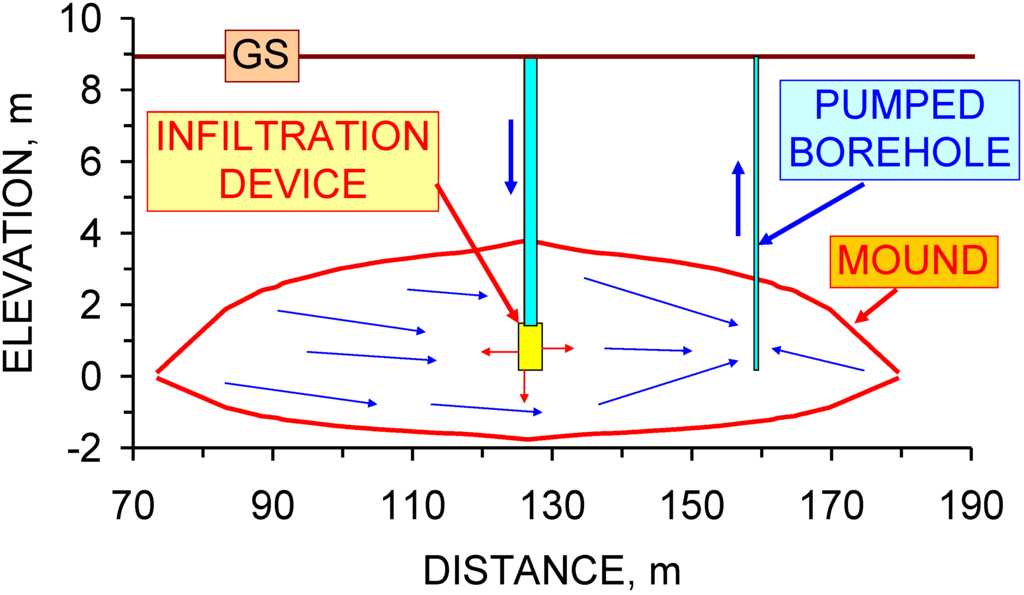
Figure 74.
Example of a groundwater mound placed in clay, which is used to both dispose of storm water by infiltration and for water abstraction. GS = ground surface. Maximum water column in the device is 3.8 m. Infiltration zone = 1.2 m high. Mound storage capacity = 6,500 m3. Macropore pressure loss is 5% m–1.
In some applications, it may be desirable to increase the storage capacity of a limited capacity aquifer by suspending self-sealing groundwater mounds in an overlying clay sequence (Figure 72). The mound can be recharged by the aquifer, and used to store excess water entering the aquifer (Figure 75). Alternatively, the mound can be used to store storm water by infiltration, and the borehole can be used to episodically drain the groundwater mound into the underlying aquifer (Figure 75). When the groundwater mound is located under a sloping ground surface, it may be possible to abstract stored water using a gravity feed (Figure 76) or a well.
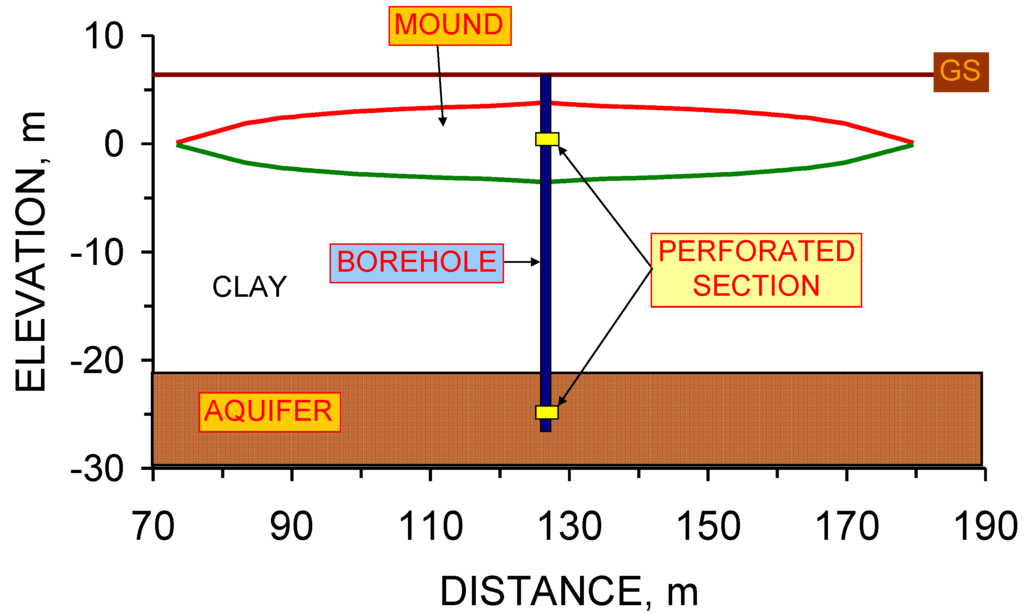
Figure 75.
Example application where a borehole is used link the groundwater mound to an underlying aquifer.
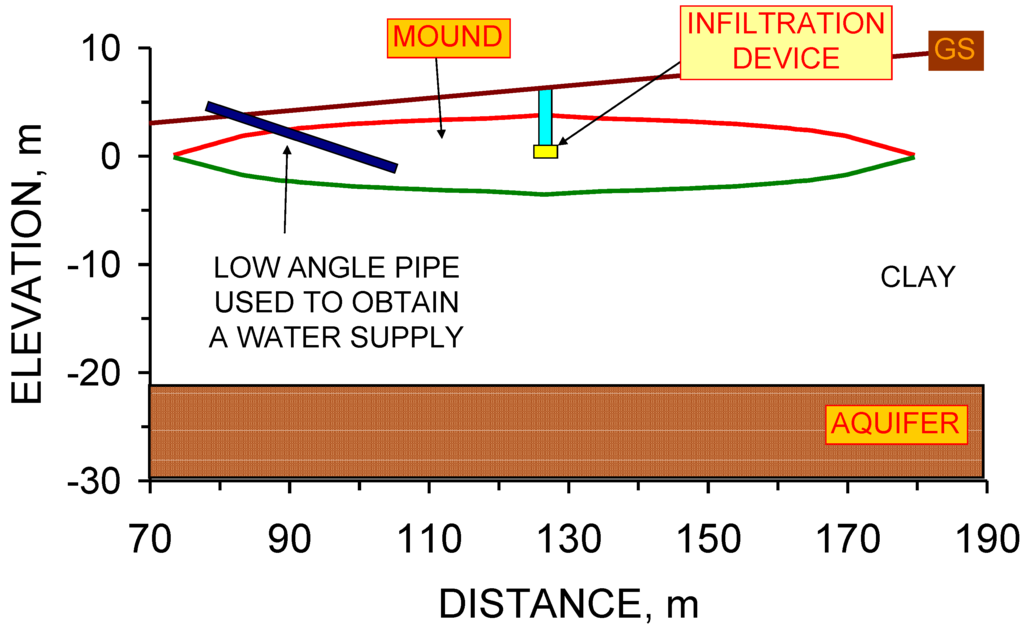
Figure 76.
Example application where a pipe is used to provide water from a groundwater mound by gravity feed.
Water Quality
The storage of storm water in clay will result in the adsorption of organic chemicals (e.g., fuel oils, humic acids, etc.) in the storm water (CxHy, CxHyOz, CxHyNz, CxHyOzNw) by the clays [7,55] within the groundwater mound. Mineral salts (e.g., NaCl) and heavy metals will also be removed by the clays and incorporated into their inter-layer space [7,37]. Bacteria and other micro-organisms will be able to survive in the macropore-network. The clays may act as an effective membrane as many of the pore throats associated with the macropore network will be smaller than the bacteria and other microorganisms.
The use of a clay sequence as a reservoir for abstracted water will allow (depending on the water quality required) the storm water to be treated, or partially treated, within the groundwater mound prior to abstraction. This study has focused on using storm water as the recharge source. Alternative water sources could be grey water, foul water, process water, tailings water (associated with mineral extraction or quarrying) and/or water from another source.
7. Comparison of Observed Results with a Traditional Groundwater Mound Model
Hydrological theory suggests that infiltration into high permeability sediments overlying a water table (Figure 20 and Figure 21), results in the mounding of the underlying water table (Figure 22) [56,57,58,59,60,61,62,63]. The mounding results from the accretion of the descending infiltrating water body (Figure 20 and Figure 21) onto the surface of the water table (Figure 22), prior to its eventual absorption into the underlying water body [45]. The shape and height of this type of mound is a function of the shape of the recharge area, recharge rate, intrinsic permeability (or hydraulic conductivity) of the sediment and the thickness of the aquifer [45,56,57,58,59,60,61,62,63]. The infiltrating water body (Figure 20) will only extend to the water table during recharge, if the recharge interval is of sufficiently long duration. An extensive set of mathematical models have been developed (e.g., [58,61,62,64]) to allow these groundwater mounds to be determined under conditions of constant recharge or variable recharge. These groundwater mound models apply to a variety of infiltration environments, including disposal of storm water (e.g., [65]) and the analysis of mires [66].
7.1. Expected Groundwater Mound Behavior: Arid Environment
Infiltration into soil associated with irrigation (and other infiltration devices) can result in the development of descending shallow perched water tables (Figure 21). These shallow water bodies may leach salts from the formation as they descend (particularly in arid areas and areas associated with irrigation schemes). Infiltration drainage is responsible [67] for observed salinity increases in public and private groundwater wells in the Shepparton Irrigation area (Victoria, Australia). These salinity increases have an adverse impact on the sustainability of irrigation water and drinking water in these areas [67]. This study (Figure 74 and Figure 76) suggests that establishing a negative pressure source in the descending shallow mound (within a low permeability soil) may allow this water to be recovered (desalinated and reused) before it is able to contaminate the underlying regional water table. The observations made in this study may assist in developing sustainable water management strategies to prevent the salinity of regional aquifers underlying some irrigation and infiltration schemes increasing. These strategies may increase the sustainability of agriculture in these areas and other areas containing high concentrations of leached salts in the subsoil.
7.2. Expected Groundwater Mound Behavior: Modeling
Modeling [68] (using SUTRA) in the Western Murray Darling Basin (Australia) has suggested that in a low permeability clayey sequence, a static and laterally expanding perched groundwater mound will develop in the central part of the clay layers. The modeling [68] suggests that (i) the infiltrating water seeps through to the saturated zone (water table) and raises the regional water table and (ii) a groundwater mound (with a high anisotropy) will form and rise above the water table towards the saturated central part of the clay layer. The conventional model assumptions [68] were (i) horizontal hydraulic conductivities of 1 m d–1 (1.15 × 10⁻⁹ m3 m2 s–1 Pa–1) and vertical hydraulic conductivities of 0.1 m d–1 (anisotropy = 10) in the more permeable layers and (ii) hydraulic conductivities of 0.0001 m d–1 (1.15 × 10⁻¹³ m3 m2 s–1 Pa–1) in more clayey layers (anisotropy = 1). The sediment overlying the groundwater mound contains a saturation of between 40%–90%. This study has suggested an alternative method of forming groundwater mounds in clay, which does not require a contribution from, or interaction with, the regional water table.
Conventional modeling [68] establishes that initially, following infiltration, a shallow anisotropic perched water table (c. 160 m diameter × 0.8–1.6 m thickness) develops at a depth <7 m (after 1.2 yrs). This study has established that the D3 groundwater mound has a diameter of >80 m and a maximum thickness of 5.8 m when formed during infiltration (e.g., Figure 64 and Figure 65). The analysis of seepage volumes established that the bulk of the moveable water within the upper part of the groundwater mound had infiltrated to lower horizons (either laterally or vertically) after 3 weeks (Figure 60). This observation implies a continuing lateral expansion of the mound or a gradual deepening of its lower surface (Figure 70). The result is a highly anisotropic groundwater mound, which is effectively static between recharge events (Figure 26).
The conventional model assumed [68] that the sediment permeability remained constant and that the fluid counter flow (air, water) adopted the pattern illustrated in Figure 8a. This allowed the modeled groundwater mound to intersect the regional water table within 7.8 years (at a depth of 25–30 m).
This study suggests that the conventional modeling [68] may be an over-simplification of the actual fluid flow behavior in clayey sediments, which exhibit poro-elastic behavior. The permeability of a clay exhibiting poro-elastic behavior changes as a function of hydraulic head [3,4]. The field and experimental observations (from Greenloaning) suggest that in this environment the rate of groundwater mound descent (following recharge) may be 10–14 m3 m2 s–1 Pa–1 while the lateral growth rate may be many orders of magnitude higher (e.g., 10–9 m3 m2 s–1 Pa–1). This situation results in mound growth by accretion associated with successive recharge events [2].
The principal differences between the conventional modeling [68] and the observed mound behavior are the conclusions that:
- (i)
- interactions with the regional water table are not required to produce an effectively static, highly anisotropic, large, perched, groundwater mound in a clayey soil. The mound descends towards the regional water table at a rate dictated by the Knudsen Diffusion permeability of the mound’s boundary layer (e.g., 10–14 m3 m–2 s–1 Pa–1). In the Greenloaning example, a groundwater mound containing a 5 m water column would descend at a maximum rate of <0.16 m yr–1 toward the regional water table. The higher permeability assumptions (relating to the descending wetting front) in the conventional modeling analyses (e.g., 10–9 to 10–13 m3 m–2 s–1 Pa–1) result in a groundwater mound descent of >3.2 m yr–1. The difference in vertical descent rates between the conventional model and Greenloaning observations can be attributed to the observed development of a boundary layer for the groundwater mound, (which is dominated by Knudsen Diffusion (e.g., Figure 17)) and the observed increasing pressure losses within the groundwater mound towards its boundary (e.g., Figure 17 and Figure 18).
- (ii)
- the static groundwater mound will have a very high internal permeability due to the development of macropores and natural pipes (e.g., Figure 16 and Figure 17). This observation allows the static groundwater mound (within a clayey sequence) to act as a very high permeability reservoir. The conventional groundwater mound model assumes a uniform low permeability within the groundwater mound. The conventional model does not recognize the presence of macropores and natural pipes within the mound.
8. Conclusions
This study has analyzed a groundwater mound constructed by storm water infiltration into clay (intrinsic permeability = 10–8 to 10–30 m3 m–2 s–1 Pa–1). This analysis has demonstrated that the resultant groundwater mounds are perched, very high permeability (e.g., 105 m3 m–2 s–1 Pa–1), self-sealing static water bodies centered on the infiltration device. The mounds do not migrate with time into the underlying water table, and can be created as part of a sustainable urban drainage scheme (SUDS) using infiltration devices collecting <20 to >2000 m3/24 hr storm/device.
Modeling has demonstrated that the mounds can be used to store <6,500–>450,000 m3 and can be produced by digging shallow (<6 m depth) infiltration devices (gravel filled pits), or shallow boreholes (<100 m depth). In the study area, gravity feed discharges of up to 0.7 m3 s–1 of clear water have been recorded [1].
The study has identified that self-sealing groundwater mounds placed in clayey soils form a low cost, sustainable, method of disposing of large volumes of storm water (or water from another source). This reservoired water can be abstracted using a gravity feed, or a pump, to provide a renewable, sustainable, low cost source of water for a variety of applications.
Self-sealing groundwater mounds in clayey sediments have application in any global area. The self-sealing groundwater mounds have particular application in areas where the majority of the rainfall is concentrated into a short time period, or, in areas, which episodically receive flash floods that do not percolate into the soil. Climate change is predicted to increase the intensity of storms, increase soil moisture deficits and increase aridity. The self-sealing groundwater mounds can be used to alleviate flooding, store water and combat the adverse effects of climate change by providing a sustainable mechanism, which can be used to reduce the soil moisture deficits and increase water security.
Acknowledgements
The two reviewers and the Sustainability editorial team are thanked for their helpful and constructive comments on an earlier draft.
Appendix 1
A.1. Sustainable Urban Drainage Systems
Sustainable urban drainage schemes (SUDS) are designed to dispose of storm water in a manner, which either prevents the storm water entering a riparian system, or attenuates the arrival of the storm water in the riparian system [22,23]. SUDS use a variety of drainage devices including ponds, retention ponds and infiltration devices (soakaways, infiltration basins, permeable pavements, swales and infiltration trenches [22,23]).
It is a regulatory requirement in the UK [48,49,50] that the storm water drainage associated with new housing developments (including road drainage) is disposed of using a Sustainable Urban Drainage Scheme (SUDS) [15,17,22,23,24,25,26,27,28,29,30]. The objective is to mimic natural drainage by encouraging storm water disposal by infiltration [48]. The construction regulations require that every building (and the ground within the curtilage of the building) is designed and constructed with a surface water drainage system that will ensure the disposal of surface water without threatening the building and the health and safety of the people in and around the building [47]. The building regulations [47] state “Surface water discharge should be a SUDS system designed and constructed in accordance with Clause 3.6.4 or a soakaway.” Clause 3.6.4 defines [47] suitable water disposal methods as soakaways, permeable surfaces, and infiltration systems (e.g., detention basins, swales, filter strips, or ponds). The regulations recognize that infiltration may result in damage to a building and therefore require every part of a soakaway to be located more than 5 m from a building [47]. Soakaways are a type of infiltration device [15,22]. An infiltration device disposes of storm water by infiltration into the soil [15]. The underlying design assumption requires that the infiltration device will always empty (or partially empty) over a specific period of time [15,17,22,23,24,25,26,27,28,29,30]. Soakaways have the lowest construction cost (expressed as [Installation cost + life time maintenance costs]/[Volume of recharge (m3 yr–1) × Life Expectancy (yrs)]. In the UK there is no legal requirement for a privately owned infiltration device to be maintained or replaced following failure.
Infiltration devices dispose of water by infiltrating it into the soil over a period of time [22,23]. An extensive literature on infiltration devices exists [22,23,24,25]. This literature focuses on either (i) the construction of a device in order to comply with appropriate government drainage construction legislation and regulations [15,17,26,27,28,29,30], or (ii) how to use a device for bioretention [56,69,70,71,72,73,74].
When an infiltration device is placed in sloping ground, it is possible that the infiltrating water will discharge through the ground surface at a down slope location [1,2,15]. The primary assumption, when designing infiltration drainage is that the dominant direction of infiltration flow is vertical [15,17,22,23,24,25,26,27,28,29,30]. Consequently, it is considered highly unlikely by the regulatory authorities that seepage (and surface flooding) will result from infiltration at distances of >5 m from the soakaway [15,17,22,23,24,25,26,27,28,29,30,47].
Inappropriately located, or inappropriately sized infiltration devices, may result in overland flow [7,15,17]. This overland flow may create problems for the property owner and down slope proprietors [2,7,15,17,22,23]. Limited systematic research has been published on the performance of infiltration devices [1,2,7,24,75]. Infiltration is associated with (i) the development of horizontal macropores/natural pipes [2,14,76] and (ii) extensive overland flow when the groundwater mounds (and associated macropores) reach the ground surface [1,2,3,15].
A.2. Location Map and Details of the Greenloaning Study Area
Figure A1 provides a location map for the study area. The map highlights the principal soakaways (D1, D2, D3) and seepage zones (R1, R2, R3) studied. The site elevation reduces from about 122.7 mamsl at D3 to about 117.2 mamsl at G1. The soakaways (D1–D3) were constructed (in lodgment till (boulder clay)) during the period 1997–2001 (Figure A1) within a housing estate (60 houses) completed in 2001 and constructed on a greenfield site [1,2]. The soakaways are constructed from pre-formed concrete rings where the basal ring is perforated and surrounded by coarse gravel [1,2]. The overlying concrete rings are not perforated and are surrounded by soil (reconstituted clay backfill) [1,2]. They provide additional storage and act as inspection points [1,2]. The details of soakaway construction, elevations, drainage areas, surface water runoff parameters, design storm volumes, rainfall, grain size, permeability, site photographs, examples of seepage, borehole logs, till composition data, contour maps (pre-development and post development), construction fill isopache, geological (drift) map and geological cross section are provided elsewhere [1,2,77]. Data used in this study was collected between 2001–2008.
D1, D2, and D3 (Figure A1), interact such that the failure of D3 leads to the overloading and failure of D1 and D2 [1,2] and the development of down slope seepage zones, R1, R2, and R3 (Figure A1) [1,2]. In 20% of observed failure events, the seepage volumes exceeded the recharge volume over the previous 120 hours [3]. This indicates: (i) substantial volumes of water flowing from the soakaways into the surrounding till are stored in a static groundwater mound located above the elevation of the seepage point; and (ii) the gathering, remobilisation and discharge of this stored water is triggered by the recharge of the upslope soakaway.
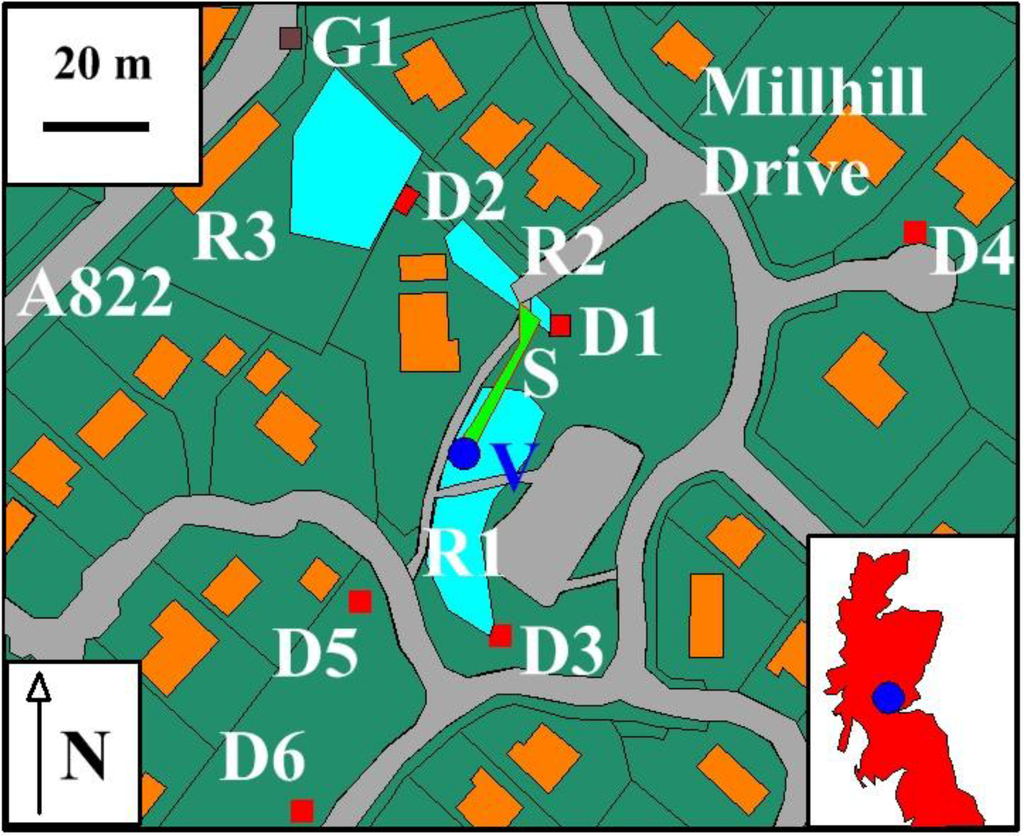
Figure A1.
Location map for the soakaways at Greenloaning, Perthshire, Scotland, UK. The principal soakaways (red) are labeled D1 to D6 [1]. The principal seepage zones (blue) associated with these soakaways are labeled R1 to R3 [1]. G1 = Reference Gully on A822 (brown). House gardens and public areas are shown in green. Roads and asphalt covered surfaces (footpaths and play area) (grey); house/building (orange). Plot boundaries are indicative. Top left co-ordinate of the map is 51°20’ N, 8°50’ E. Mean runoff (m3) received from (houses and roads) for a 50 mm storm are: D1 = 110 (SD = 5.7); D2 = 38 (SD = 3.1); D3 = 208 (SD = 6.2); V = location of vertical vent (Figure 44); S = location of overland flow illustrated in Figure 44.
References
- Antia, D.D.J. Prediction of overland flow and seepage zones associated with the interaction of multiple Infiltration Devices (Cascading Infiltration Devices). Hydrol. Process. 2008, 22, 2595–2614. [Google Scholar] [CrossRef]
- Antia, D.D.J. Interacting infiltration devices (field analysis, experimental observation and numerical modeling): Prediction of seepage (overland flow) locations, mechanisms and volumes—Implications for SUDS, groundwater raising projects and carbon sequestration projects. In Hydraulic Engineering: Structural Applications, Numerical Modeling and Environmental Impacts, 1st ed.; Hirsch, G., Kappel, B., Eds.; Nova Science Publishers: Hauppauge, NY, USA, 2010. [Google Scholar]
- Antia, D.D.J. Oil polymerisation and fluid expulsion from low temperature, low maturity, over pressured sediments. J. Petrol. Geol. 2008, 31, 263–282. [Google Scholar] [CrossRef]
- Antia, D.D.J. Low temperature oil polymerisation and hydrocarbon expulsion from continental shelf and continental slope sediments. Indian J. Petrol. Geol. 2009, 16, 1–30. [Google Scholar]
- Vaughan, P.R. Observations on the behaviour of clay fill containing occluded air bubbles. Geotechnique 2003, 53, 265–272. [Google Scholar] [CrossRef]
- Smoltczyk, V. Geotechnical Engineering Handbook: Fundamentals; Wiley: Chichester, UK, 2002; Volume 1. [Google Scholar]
- Wilson, S.; Bray, R.; Cooper, P. Sustainable Drainage Systems: Hydraulic, Structural and Water Quality Advice, CIRIA Report No. C609; CIRIA: London, UK, 2004. [Google Scholar]
- Bowers, G.L. Detecting high overpressure. Lead. Ed. 2002, 21, 174–177. [Google Scholar] [CrossRef]
- Wolf, L.W.; Lee, M.-K.; Browning, S.; Tuttle, M.P. Numerical analysis of overpressure development in the New Madrid Seismic Zone. Bull. Seism. Soc. Am. 2005, 95, 135–144. [Google Scholar] [CrossRef]
- Antia, D.D.J. Polymerisation Theory–Formation of hydrocarbons in sedimentary strata (hydrates, clays, sandstones, carbonates, evaporites, volcanoclastics) from CH4 and CO2: Part I, Polymerisation concept, kinetics, sources of hydrogen and redox environment. Indian J. Petrol. Geol. 2009, 17(1), 49–86. [Google Scholar]
- Antia, D.D.J. Polymerisation Theory–Formation of hydrocarbons in sedimentary strata (hydrates, clays, sandstones, carbonates, evaporites, volcanoclastics) from CH4 and CO2: Part III: Hydrocarbon expulsion from the hydrodynamic flow regimes contained within a generating pressure mound. Indian J. Petrol. Geol. 2009, 18, 1. (in press). [Google Scholar]
- Opseth, T.L.; Ribsen, B.T.; Syrstad, B.; Huse, A.; Bolstad, L.; Saasen, A. Curing shallow water flow in a North Sea Exploration well exposed to shallow gas. SPE Pap. 2009, SPE 124607. [Google Scholar]
- Highways Agency. Design Manual for Roads and Bridges, Volume 4: Geotechnics and Drainage; Section 2: Drainage: HA 37/97. Hydraulic Design of Road Edge Surface Water Channels; Stationary Office Ltd.: London, UK, 1997. [Google Scholar]
- Brutsaert, W. Hydrology an Introduction; Cambridge University Press: Cambridge, UK, 2005. [Google Scholar]
- BRE. Soakaway Design, Digest 365; HIS BRE Press: Garston, UK, 1991. [Google Scholar]
- Flood Studies Report in Five Volumes, Volume II, Meteorological Studies; Institute of Hydrology: Wallingford, UK, 1993.
- Bettess, R. Infiltration Drainage–Manual of Good Practice, CIRIA Report No. C156; CIRIA: London, UK, 1996. [Google Scholar]
- Kim, H. Anisotropic Properties of Compacted Silty Clay. MSc. Thesis, Ohio University, Athens, OH, USA, 1996. [Google Scholar]
- Mulder, M. Basic Principles of Membrane Technology; Kluwer Academic Publishers: Dordrecht, The Netherlands, 1996. [Google Scholar]
- Misstear, B.; Banks, D.; Clark, L. Water Wells and Boreholes; Wiley: Chichester, UK, 2006. [Google Scholar]
- Lide, D.R. CRC Handbook of Chemistry and Physics, 89th ed.; CRC Press: London, UK, 2008. [Google Scholar]
- Martin, P.; Turner, B.; Waddington, K.; Pratt, C.; Campbell, N.; Payne, J.; Reed, B. Sustainable Urban Drainage Systems: Design Manual for Scotland and Northern Ireland, CIRIA Report No. C521; CIRIA: London, UK, 2000. [Google Scholar]
- Martin, P.; Turner, B.; Waddington, K.; Pratt, C.; Campbell, N.; Payne, J.; Reed, B. Sustainable Urban Drainage Systems: Design Manual for England and Wales, CIRIA Report No. C522; CIRIA: London, UK, 2000. [Google Scholar]
- Pratt, C.J. Sustainable drainage: A review of published material on the performance of various SUDS components. Prepared for the Environment Agency. SUDS Science Group /99705.015. 2004. Available online: http://ciria.org/suds/pdf/suds_lit_review_04.pdf (accessed May 2009).
- Campbell, N.S.; D’Arcy, B.; Frost, A.; Novotny, V.; Sansom, A. Diffuse Pollution; IWA Publishing: London, UK, 2005. [Google Scholar]
- Pratt, C.J. Research and development in methods of soakaway design. Water Environ. J. 1996, 10, 47–51. [Google Scholar] [CrossRef]
- Butler, D.; Davis, J. Urban Drainage; Spon Press: London, UK, 2004. [Google Scholar]
- Highways Agency. Design Manual for Roads and Bridges; Volume 4: Geotechnics and Drainage; Section 2: Drainage: Part 8, HA 118/06, Design of soakaways; Stationary Office Ltd.: London, UK, 2006. [Google Scholar]
- Woods Ballard, B.; Kellagher, R.; Martin, P.; Jefferies, C.; Bray, R.; Shaffer, P. The SUDS Manual, CIRIA Report No. C697; CIRIA: London, UK, 2007. [Google Scholar]
- Woods Ballard, B.; Kellagher, R.; Martin, P.; Jefferies, C.; Bray, R.; Shaffer, P. Site Handbook for the Construction of SUDS, CIRIA Report No. C698; CIRIA: London, UK, 2007. [Google Scholar]
- Cipriano, B.H.; Raghaven, S.R.; McGuiggan, P.M. Surface tension and contact angle measurements of a hexadecylimidazolium surfactant adsorbed on a clay surface. Colloids Surf. A 2005, 262, 8–13. [Google Scholar] [CrossRef]
- Schramm, L.L.; Hepler, L.G. Surface and interfacial tensions of aqueous dispersions of charged colloidal (clay) particles. Can. J. Chem. 1994, 72, 1915–1920. [Google Scholar] [CrossRef]
- Motealleh, S.; Bryant, S.L. Quantitative mechanism for permeability reduction by small water saturation in tight-gas sandstones. SPE J. 2009, 14, 252–258. [Google Scholar] [CrossRef]
- Easterbrook, D.J. Glacial sediments. In Sandstone Depositional Environments; Scholle, P.A., Spearing, D., Eds.; American Association of Petroleum Geologists: Tulsa, OK, USA, 1982; pp. 1–10. [Google Scholar]
- Trenter, N.A. Engineering in Glacial Tills, CIRIA Report C504; CIRIA: London, UK.
- Murray, H.H. Applied Clay Mineralogy: Occurrences, Processing and Applications for Kaolins, Bentonites, Palygorskitesepiolite and Common Clays; Elsevier: Amsterdam, The Netherlands, 2007. [Google Scholar]
- Zhu, H.Y.; Yamanaka, S. Molecular recognition of Na-loaded alumina pillared clay. J. Chem. Soc., Faraday Trans. 1997, 93, 477–480. [Google Scholar] [CrossRef]
- Chatterjee, A. Application of localized reactivity index in combination with periodic DFT calculation to rationalise the swelling mechanism of clay type in organic matter. J. Chem. Sci. 2005, 117, 533–539. [Google Scholar] [CrossRef]
- Alcover, J.-F.; Al-Mukhtar, Y.; Qi, M.; Bonnamy, S.; Bergaya, F. Hydromechanical effects on the Na-smectite microtexture. Clay Miner. 2000, 35, 525–536. [Google Scholar] [CrossRef]
- Jena, H.M.; Roy, G.K.; Meikap, B.C. Hydrodynamics of a gas-liquid-solid fluidised bed with hollow cylindrical particles. J. Chem. Eng. Process. 2009, 48, 279–287. [Google Scholar] [CrossRef]
- Benson, C.H.; Daniel, D.E. Influence of clods on the hydraulic conductivity of compacted clay. J. Geotech. Eng. 1990, 116, 1231–1248. [Google Scholar] [CrossRef]
- Keijzer, Th.J.S.; Kleingeld, P.J.; Loch, J.P.G. Chemical osmosis in compacted clayey material and the prediction of water transport. Engrg. Geol. 1999, 53, 151–159. [Google Scholar] [CrossRef]
- Coats, J.S.; Shaw, M.H.; Gallagher, M.J.; Armstrong, M.; Greenwood, P.G.; Chacksfield, B.C.; Williamson, J.P.; Fortey, N.J. Gold in the Ochil Hills. British Geological Survey Technical Report WF/91/1, Mineral Reconnaissance Programme Report 116; NERC: London, UK, 1991. [Google Scholar]
- Valdes, J.R.; Santamarina, J.C. Particle clogging in radial flow: microscale mechanisms. SPE J. 2006, 11, 193–198. [Google Scholar] [CrossRef]
- Youngs, E.G. The analysis of groundwater seepage in heterogenous aquifers. Hydrol. Sci. 1980, 25, 155–165. [Google Scholar]
- Patzek, T.W.; Silin, D.B. Water injection into a low-permeability rock- 1: hydrofracture growth. Trans. Porous Media 2001, 43, 537–555. [Google Scholar] [CrossRef]
- Domestic Handbook 2009. Section 3; Scottish Government Building Standards: Livingston, UK, 2009.
- Planning Advice Note, PAN 79, Water and Drainage; Scottish Government: Edinburgh, UK, 2006.
- Planning Advice Note, PAN 61, Planning and Sustainable Urban Drainage System; Scottish Government: Edinburgh, UK, 2001.
- Scottish Planning Policy, SPP 7, Planning and Flooding; Scottish Government: Edinburgh, UK, 2004.
- Harr, M.E. Groundwater & Seepage; Dover: New York, NY, USA, 1991. [Google Scholar]
- Rinnert, L.; Mickelson, D.M. High porosity of basal till at Burroughs glacier, southeastern Alaska. Geology 1992, 20, 849–852. [Google Scholar] [CrossRef]
- Ruszczynska-Szenajch, H.; Trzcinski, J.; Jarosinska, U. Lodgment till deposition and deformation investigated by macroscopic observation, thin-section analysis and electron microscope study at site Dcbe, central Poland. Boreas 2009, 32, 399–415. [Google Scholar] [CrossRef]
- Mortensen, A.P.; Jensen, K.H.; Nilsson, B.; Juhler, R.K. Multiple tracing experiments in unsaturated fractured clayey till. Vadose Zone J. 2004, 3, 634–644. [Google Scholar] [CrossRef]
- Bandosz, T.J.; Jagiello, J.; Andersen, B.; Schwarz, J.A. Inverse gas chromatography study of modified smectite surfaces. Clays Clay Miner. 1992, 40, 306–310. [Google Scholar] [CrossRef]
- Endreny, T.; Collins, V. Implications of bioretention basin spatial arrangements on storm water recharge and groundwater mounding. Ecol. Engrg. 2008, 35, 670–677. [Google Scholar] [CrossRef]
- Griffin, D.M.; Warrington, R.O. Examination of 2-D groundwater recharge solution. J. Irrig. Drain. Eng. 1988, 114, 691–704. [Google Scholar] [CrossRef]
- Rai, S.N.; Singh, R.N. On the prediction of groundwater mound formation due to transient recharge from a rectangular area. Water Resour. Manage. 1996, 10, 189–198. [Google Scholar] [CrossRef]
- Reider, R.G.; Huss, J.M.; Miller, T.W. A groundwater vortex hypothesis for mima-like mounds, Laramie Basin, Wyoming. Geomorphology 1996, 16, 295–317. [Google Scholar] [CrossRef]
- Bouwer, H.; Black, J.T.; Oliver, J.M. Predicting infiltration and ground-water mounds for artificial recharge. J. Hydrol. Eng. 1999, 4, 350–357. [Google Scholar] [CrossRef]
- Aish, A.; De Smedt, F. Modeling of a groundwater mound resulting from artificial recharge in the Gaza Strip, Palestine. In Water for Life in the Middle East, Proceedings of the 2nd Israeli-Palestinian International Conference, Antalya, Turkey, 10–14 October 2004; Israel/Palestine Center for Research and Information: Jerusalem, Israel, 2004. Available online: www.ipcri.org (accessed 1 July 2009). [Google Scholar]
- Onder, H.; Korkmaz, S. Groundwater mound due to constant recharge from a strip basin. J. Hydrol. Engrg. 2007, 12, 237–245. [Google Scholar] [CrossRef]
- Kacimov, A.; Al-Jabri, S.; Sherif, M.; Al-Shidi, A. Slumping of groundwater mounds: revisiting the Polubarinova-Kochina theory. Hydrol. Sci. J. 2009, 54, 174–188. [Google Scholar] [CrossRef]
- Rai, S.N.; Ramana, D.V.; Thiagarajan, S.; Manglik, A. Modelling of groundwater mound formation resulting from transient recharge. Hydrol. Process. 2001, 15, 1507–1514. [Google Scholar] [CrossRef]
- Zomorodi, K. Simplified solutions for groundwater mounding under storm water infiltration facilities. AWRA 2005 Ann. Water Res. Conf. Pap. 7–10 November 2005. Available online: www.dewberry.com (accessed 20 September 2009).
- Kneale, P.E. Sensitivity of the groundwater mound model for predicting mire topography. Nordic. Hydrol. 1987, 18, 193–202. [Google Scholar]
- Thayalakumaran, T.; Selle, B.; Duncan, R.; Gill, B. Is groundwater disposal necessary to preserve groundwater resource quality. In 2nd Int. Salinity Forum, Adelaide, Australia, 30 March–3 April 2008; Available online: http://www.internationalsalinityforum.org (accessed 20 September 2009).
- Woods, J.A.; Telfer, A.L. Modelling groundwater flow in regions with clay layers above the water table. In 2nd Int. Salinity Forum, Adelaide, Australia, 30 March–3 April 2008; Available online: http://www.internationalsalinityforum.org (accessed 20 September 2009).
- Davis, A.P.; Hunt, W.F.; Traver, R.G.; Clar, M. Bioretention technology: Overview of current practice and future needs. J. Environ. Eng. 2009, 135, 109–117. [Google Scholar] [CrossRef]
- Mays, L.W. Storm Water Collection Systems Design Handbook; McGraw Hill: London, UK, 2001; Volume 1. [Google Scholar]
- Hsieh, C.-H.; Davis, A.P. Engineering bioretention for treatment of urban storm water runoff. In Proc. Water Environ. Fed., Watershed 2002; Water Environ. Fed.: London, UK, 2002; pp. 1629–1638. [Google Scholar]
- Allison, R.; Francey, M. WSUD Engineering Procedures; CSIRO: Canberra, Australia, 2005. [Google Scholar]
- Davis, A.P.; Shokouhian, M.; Sharma, H.; Minami, C.; Winogradoff, D. Water quality improvement through bioretention: lead, copper, and zinc removal. Water Environ. Res. 2003, 75, 73–82. [Google Scholar] [CrossRef] [PubMed]
- Li, H.; Davis, A.P. Heavy metal capture and accumulation in bioretention media. Environ. Sci. Technol. 2008, 42, 5247–5253. [Google Scholar] [CrossRef] [PubMed]
- Chen, H.-P.; Stevenson, M.W.; Li, C.-Q. Assessment of existing soakaways for reuse. Water Manage. 2008, 161, 141–149. [Google Scholar]
- Sarkar, R.; Dutta, S.; Panigrahy, S. Effect of scale on infiltration in a macropore-dominated hillside. Curr. Sci. 2008, 94, 490–494. [Google Scholar]
- Aitkin, A.M.; Shaw, A.J. The Sand and Gravel Resources of Strathallan, Tayside Region, Mineral Assessment Report 132; Institute of Geological Sciences: Keyworth, UK, 1983. [Google Scholar]
List of Principal Abbreviations
Abbreviations without units are dimensionless
| a | Maximum groundwater mound height above the base of the infiltration device (m) |
| AWC | Air water contact |
| A1 | Cross sectional area of overland flow (m2) |
| Ab | Area of the base of the infiltration device (m2) |
| AD | Anisotropy |
| Ai | Surface area of a surface type, i, (m2) |
| AMP | Macropore propagation rate (m s−1Pa−1) |
| As | Average area (m2) of the sides of the infiltration device between the base of the device and an elevation (E3) |
| b | Maximum groundwater mound depth below the base of the infiltration device (m) |
| B | Radius of the soakaway (m) |
| c | Shape factor |
| D1-D3 | Greenloaning soakaways identified in Figure A1 |
| d | Distance from the infiltration device (m) |
| D | Maximum width of the groundwater mound during recharge (m) |
| Dk | Knudsen diffusion coefficient |
| dw | Density of water (kg m-3) [21] |
| E1 | Elevation (m) (also E2 and E3) |
| Fi | Surface runoff factor for the surface type, i, 0 ≤ Fi ≤ 1.0 |
| G1 | Gully (Figure A1) |
| GRV(m) | Mound gross rock volume (m3) |
| g | Acceleration due to gravity (m s−2) [21] |
| h | Water depth relative to a reference (m) |
| K | Hydraulic conductivity (m3 m−2 s−1 h−1) |
| k | Intrinsic permeability (m3 m−2 s−1 Pa−1) |
| kh | Horizontal permeability (m3 m−2 s−1 Pa−1) |
| kv | Vertical permeability (m3 m−2 s−1 Pa−1) |
| kintra | Inter-particle viscous flow permeability (m3 m−2 s−1 Pa−1) |
| kintra | Knudsen diffusion permeability (m3 m−2 s−1 Pa−1) |
| kmacro | Macropore permeability (m3 m−2 s−1 Pa−1) |
| L | Equilibrium width of the groundwater mound measured from the edge of the infiltration device (m) |
| Lc | Actual flow path distance between two ends of a pore conduit/flow pathway (m) |
| Lc | Direct distance between two ends of a pore conduit/flow pathway (m) |
| Lmax | Radius of the groundwater mound at the base of the infiltration device (m) |
| MW | Molecular weight of air (g mol−1) |
| N | Net to gross ratio |
| NSV | Net storage volume (m3) in the groundwater mound |
| Nm | Manning Roughness |
| nm | number of moles of air, [when Qb is expressed in moles m−2 s−1; when Qb is expressed in m3 m−2 s−1, nm is expressed in m3]. |
| P | Driving force (Pa) |
| Pb | Driving force on the base of an infiltration device (Pa) |
| PC | Minimum driving force for macropore propagation (Pa) |
| PCR | Minimum driving force required for the formation of vertical chimneys (Pa) |
| PFL | Pressure loss between the macropore and the formation at a distance of x m from the edge of the macropore (Pa) |
| PLoad | Total pressure load (Pa) |
| PM | Minimum driving force required to initiate viscous flow (Pa) |
| PML | Pressure loss between the soakaway and the macropore location (Pa) |
| Ppipe | Driving force within a macropore/natural pipe (Pa) |
| PPL | Pressure losses in the macropore network at the propagating end of the macropore (Pa) |
| PpM | Driving force associated with the propagating macropore (Pa) |
| Pp2 | Driving force in the sediment adjacent to a macropore at a distance x from the edge of the macropore (Pa) |
| Ps | Average driving force on the sides of an infiltration device (Pa) |
| Pw | Wetted perimeter of overland flow (m) |
| PD | Pressure at the discharge location (Pa) |
| PL | Pressure losses affecting the flowing water resulting from the transfer of kinetic energy to potential energy (Pa) |
| PU | Pressure (or head) behind the flowing water (Pa) |
| PL | Pressure loss x% (fraction) per metre within a macropore |
| Q | Infiltration rate through a surface (m3 m−2 s−1) |
| Qb | Maximum flow rate associated with a boundary envelope (m3 m−2 s−1) |
| Qt | Infiltration from an infiltration device (m3 s−1) |
| QD | Overland flow volume (m3 s−1) |
| QM | Rate of macropore propagation (m s−1) |
| r | Pore throat radii (10-6 m, when PM is expressed in bar (1 bar = 105 Pa)) |
| R1-R3 | Seepage zones (Figure A1) |
| R | Rainfall during storm (m3/time interval) |
| RC | Gas constant. Units vary with pressure and volume units selected [21] |
| RH | Hydraulic radius (m) |
| S | Overland flow associated with V |
| S | Longitudinal gradient of overland flow (m m−1) |
| SR | Proportion of Sw which is mobile |
| Sw | Water saturation in the porosity |
| T | Temperature (K) |
| t | Time (s) |
| V | Vertical surge shaft |
| V | Overland flow volume (m3) |
| VRW | Volume of relict water within the groundwater mound between zj and zy (m3) |
| Vr | Recharge volumes (m3) |
| Vt | Volume of water infiltrated through the sides and base of an infiltration device (m3) |
| z0 | Elevation of the base of the infiltration device (mamsl) |
| zD | Elevation of the groundwater mound at a distance D from the infiltration device (mamsl) |
| zj | Elevation of the AWC in the infiltration device (mamsl) |
| zm | Elevation of the macropore (mamsl) |
| zx | Elevation of the groundwater mound at a distance x from the infiltration device (mamsl) |
| zy | Elevation of the observed seepage zone (mamsl) |
| zx1 | Elevation of the intercept of the groundwater mound with the ground surface (mamsl) |
| θ | Contact angle of the meniscus |
| θa | Contact angle of the advancing meniscus |
| θb | Contact angle of the receding meniscus |
| σ | Surface tension of water-air interface (Nm−1) |
| τ | Pore tortuosity |
| φ | Inter particle/macropore porosity |
© 2009 by the authors; licensee Molecular Diversity Preservation International, Basel, Switzerland. This article is an open-access article distributed under the terms and conditions of the Creative Commons Attribution license (http://creativecommons.org/licenses/by/3.0/).