Abstract
We examine the driving effects of various factors on technological innovation to renewables (TIRES), focusing on a set of 29 provinces in China, and apply a dynamic panel approach. China has become a leading player in research and development spending in renewables, and the dynamic panel estimators we use prove themselves to be suitable in handling the persistent effect on TIRES. The level of TIRES in the previous periods is positively and highly correlated with that in the current period and confirmed the need for a stable and consistent policy support for renewables. Electricity consumption is the most important driver for all renewables and wind energy, but the driving effect was weaker for solar energy and biomass. Research and development intensity is the most important driver for biomass, but is only the second most important driver for all renewables, solar energy and wind energy. Unexpectedly, electricity price has had significant negative impacts on TIRES, which reveals that lowering electricity prices will lead to higher innovation in renewables. The driving effect of renewable energy tariff surcharge subsidy is not significant, which means that Chinese subsidy policy has not played the desired role. The driving effect of installed renewable energy capacity is also minimal, which may be due to the fact that overcapacity will hinder TIRES in China. This paper may help policy-makers and the industry understand how to promote TIRES in China effectively based on these above influential factors.
1. Introduction
The Paris Agreement on the climate change came into effect on 4 November 2016. As the global institutional arrangement to reduce greenhouse gas emissions significantly in response to climate change action after 2020, the Paris Agreement will become the watershed in the development of global energy development [1]. More than 90% of the parties to the Paris Agreement have set their own renewable energy targets in their Intended Nationally Determined Contributions (INDC) in response to climate change. It is generally agreed that the establishment of renewable energy based energy system is an effective way to the global long-term energy transformation. Meanwhile, the reports issued by Renewable Energy Policy Network for the 21st Century (REN 21), International Energy Agency (IEA) and United Nations Environmental Programme (UNEP) have pointed out that no targets in response to climate change can be realized without the development of renewable energy, and the basic trend of the global energy transformation is realizing the transition from fossil-based energy system to low carbon and sustainable energy systems, and eventually entering the era of sustainable energy based on renewable energy sources [1,2,3].
With the continuous decline in costs and the accelerated progress of promotion, actively promoting TIRES has become a mature solution to deal with climate change. TIRES is of great importance for realizing the win-win strategy of environmental protection and economical sustainability; meanwhile, the increased proportion of renewable energy in the global energy mix can contribute to a series of public policy targets, such as greater energy security, environmental benefits, jobs and economic benefits etc. Since renewable energy projects have much higher up-front costs than fossil fuel projects, the decision to promote TIRES implies substantial up-front investments and cannot be a short-term decision, that is to say, the process of promoting TIRES should be a persistent and dynamic one. We can understand the persistency of the process from Figure 1. As Figure 1 indicates, the annual growth rate of global research and development (R&D) spending in renewable energy is positive in most of time period from 2004 to 2015, which implies that there is a persistence effect in TIRES. This paper intends to apply the dynamic panel approach to analyze the process of TIRES, which should be a persistent one. We are aimed at examining the factors that drive or hinder that process.

Figure 1.
Research and development (R&D) spending in renewable energy, 2004–2015, $BN. Source: Bloomberg, Bloomberg New Energy Finance, IEA, IMF, various government agencies.
Additionally, as Figure 2 indicates, China became the second biggest contributor to R&D spending in renewable energy in 2015, reaching 2.8 billion USD. Europe continued to be the biggest contributor to R&D investment in renewable energy, but it encountered a severe challenge from China. It implied that the focus of the total renewable energy investment shifted from developed economies to developing countries in 2015: the proportion of global investment by developing countries rose from 49% in 2014 to 55% in 2015, with the dollar commitment reaching $155.9 billion in 2015. Meanwhile, developed countries only invested $130.1 billion in 2015. Remarkably, except large hydro, China became the largest investing country for renewables, reaching $102.9 billion in 2015 and occupying more than a third of the global total [3]. Therefore, exploring the factors influencing TIRES in China is bound to attract the attention from the global policy makers and the industry and of great significance for proposing the relevant policy implications.
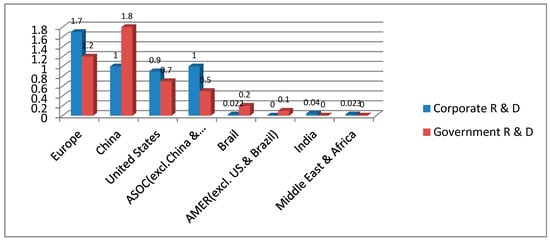
Figure 2.
Corporate and government R&D renewable energy investment by region, 2015 $BN. Source: Bloomberg, Bloomberg New Energy Finance, IEA, IMF, various government agencies.
We have contributed to the research in this field in three aspects: (i) we add empirical research on driving factors towards TIRES, emphasizing the difference for separate sources of renewable energy; (ii) we show the relative importance of different factors; and (iii) Employing a dynamic panel approach to analyze the persistent TIRES process is new in literature.
The other parts of this paper are arranged as follows. Section 2 makes a literature review. Section 3 presents the methodology, which includes research design, model specification, data sources, data description, etc. Section 4 shows the main results. Section 5 discusses the results. Finally, Section 6 concludes and provides policy implications.
2. Literature Review
There are vast numbers of recent literature on factors promoting renewable energy development and use. The vast majority of this literature are normative and includes descriptive analysis in some countries, such as USA [4,5], the Netherlands [6,7], Denmark [8], Finland [9], Germany [10,11,12], Kazakhstan [13], Europe [14], and UK [15]. However, there is a lack of empirical literature in this field. Further, much of the empirical adopt case studies [16,17,18], field studies [19,20], static panel analysis [21,22,23], there are also a few literature that adopt dynamic panel approach [24,25], but none of those was focused on the case of China. The scarce empirical literature which adopted panel approach is focused on European countries [22,25], Organization for Economic Co-operation and Development countries [23], and advanced countries in wind power development [21]. In this sense, examining the driving effect of various factors on TIRES in China will be meaningful.
A great deal of literature have focused on the research about the drivers of TIRES. Five such research streams could be identified in the literature.
2.1. Renewable Energy Policies
The first research stream shows broad evidence that renewable energy policy makes a primary driving effect on TIRES, but that the choice and design of policies should also be the focus of research [26,27,28]. In general, renewable energy policies can be divided into technology push and market-pull. Market-pull policies aim at creating demand for renewable technologies and at stimulating their diffusion. Technology-push policies advocates increasing the incentives to supply new knowledge. This dichotomy has gained support from literature in recent decades [29,30].
Many literature sources have confirmed the important effects of technology-push approaches, mainly referring to R&D support mechanism together with fiscal policies that motivate private R&D, on promoting TIRES [31,32,33]. In comparison, market-pull approaches still play a small role in the related literature until now [34]. However, there is still some literature which do not confirm the statistically significant effect of R&D investment [23,35].
Specifically, Watanabe et al. (2000) indicate that public R&D investment has a positive effect on technological innovation in the Japanese PV sector. They argue that this investment helps to realize a virtuous cycle between technological innovation, price reduction, market growth, and supplementary industry R&D spending [36]. If R&D investment is regarded as an exogenous technology-push mechanism, it was tested to exert a driving effect on renewable energy diffusion together with renewable energy support policies (an exogenous demand-pull measures) and per capita income (an endogenous demand-pull measure), whereas economic growth is a stronger driver since it is endogenous element [30]. According to the interaction effect with other policy instruments in different country and region, Klaassen et al. (2005) [37] examined the effect of public R&D investment on cost reduction innovation for wind turbine farms in Denmark, Germany and the United Kingdom(UK) and concluded that R&D support policy, in conjunction with investment subsidies, were most successful in Denmark in driving innovation, and capacity promoting subsidies were most effective in motivating innovation in Denmark and Germany. Further, compared with RD&D expenditure, RD&D intensity (e.g., spending per unit of GDP), which is more suitable for comparison among different regions with significantly different resource endowment and scientific capacity, may be a better indicator measuring RD&D performance on innovation [38]. Employing patent counts to measure innovative output, Johnstone et al. (2010) [39] revealed that public R&D funding was positively correlated with renewable energy technological innovation. Furthermore, policy instrument is also necessary to stimulate private R&D, as this is a complementary factor for public R&D funding.
Some recent literature have suggested that the best policy is keeping a balance between technology-push and market-pull approaches and emphasizing enhancing the interface between technology suppliers and users [40,41], as R&D may have greater innovation effects on less mature technologies [36].
2.2. Persistent Innovation and Policy Stability
The second research stream suggest that the process of innovations is typically incremental, cumulative and persistent [42,43]. Innovation can bring revolutionary results with the persistent and accumulation effect of past innovation, or with the radical performance characteristics that it introduces. In view of the persistent character of innovation, policies promoting investment in renewables should maintain long-term stability because the risk of policy change will cause financing difficulties, increase the premiums of financing risk, and thus reduce the effectiveness of the overall policy [44]. Barradale (2010) demonstrated that it is not the absence of the production tax credit (PTC) that leads to the investment downturn during “off” years, but rather the uncertainty over the investment periods [45]. With time-series cross-sectional analyses, Liang and Fiorino (2013) made empirical research on the driving effects of the stability of federal R&D spending on innovation (measured by patent counts) in different renewable energy sources (i.e., solar, wind, hydropower, geothermal, and bioenergy). They suggest that stability effect has greater explanatory power on innovation activities in renewables [46].
2.3. Market Demand and Renewable Energy Innovation
The earlier studies of innovation have made the conclusion that the dominant driving factor on the innovation process is market demand, that is, innovations are in some sense “called forth” or “triggered” in response to demands for the satisfaction of certain classes of “needs” [47,48,49]. Specifically, compared with the level of technological abilities, market demand incentives are also of great importance when providing investment incentives for firms since great investments are urgently needed in the processes of innovation [50]. In this respect, the extent of market demand and the level of prices have been regarded as two important drivers for renewable energy innovation [51,52,53,54].
Though some literature has widely acknowledged the stimulating effect of the market demand for innovation, such as Rehfeld et al. (2007) for Germanny and Veugelers (2012) for Flanders [55,56], the most recent literature indicates that different factors trigger different stages of innovation. Specifically, market demand and regulations have greater driving effects on the early stages of innovation, while firm size, technology push (R&D) and the company’s green capabilities have greater effect on either development or implementation stages of innovation [57].
2.4. Renewable Energy Subsidies
Renewable energy subsidy support mechanisms are necessary instruments to promote the application and innovation of most renewable technologies until they become mature and can compete with existing energy technology options [57]. For immature technologies, including renewable energy ones, demand subsidies are not so effective as R&D in contributing to cost reductions in renewables [58,59]. Many European countries usually provides subsidies on clean electricity through feed-in tariffs rather than subsidizing renewable energy equipment directly, however, feed-in tariffs adjusted optimally is far less effective than a first-best policy, causing substantial welfare losses in the case of too low emission tax or large market power in the fossil-fuel sector [60]. Further, compared with a carbon price policy, employing permanently renewable energy subsidies as effective instruments to achieve mitigation generates much higher welfare losses. Permanent renewable energy subsidies are not only an expensive choice to realize mitigation targets, but also a very risky instrument because even a small deviation from the optimal value will lead to a rapid rise in emissions or a loss of welfare [61]. Therefore, subsidy policy should not been regarded as an optimal choice for the long term. In order to promote the low-carbon transformation of the global economy successfully, governments will need to create fair competing environments for clean energy investment through carbon pricing, enhancing stable and predictable regulatory and investment environments, instead of relying on subsidies to renewable energy industry [62].
For the case of China, since the Renewable Energy Act came into effect, a series of specific incentive measures, especially subsidy policies have promoted great developments in TIRES and market application. However, the subsidy for renewable energy power from 2006 to April 2011 amounted to 33,448.84 million CNY and the subsidy cost reached 0.248 CNY/kWh, which was distributed among different renewable energy power categories (including electricity price, accessing-grid projects, and public independent renewable energy power system). Specifically, the vast majority of subsidies were used for electricity price category, occupying as much as 95.6% [63]. However, the reality is that the subsidy collection for China’s renewable energy development is not satisfactory, by the end of 2015, delays in subsidy collection and problems with solar panel quality were still the biggest concerns and doubts for investors in solar PV markets [64]. As a matter of fact, China has encountered difficulties in the implementation of subsidy policies. For example, the centralized subsidy system is always with problems like corruption, the subsidy is likely to be embezzled in each level of the system [65]. Additionally, due to vague guidance, China’s subsidy policies lead to a variety of problems such as overcapacity, excessively fierce competition, and lack of funds, and so on [65]. Therefore, in view of the welfare losses, discounted mitigation performance and a series of unintended effects resulted from the implementation of the subsidy policy, carbon pricing can be regarded as one of the most effective measures to stimulate private investment for the long run. A strong price signal in all major economies will guide financial resources away from fossil fuels and advance technology innovation for renewable energy [66].
2.5. Scale and Innovation
The viewpoint that scale has a positive effect on innovation actually stems from Joseph Schumpeter, who put forward the term “creative destruction” and indicated that large-scale firms were “the most powerful engine of progress” [67]. Drawing lessons from his work, some economists developed “Schumpeterian Hypothesis”, which proposed the argument that bigger firms have stronger incentives to spend on innovation than a smaller one. The recent empirical literature in industrial organization suggested that the effect of scale on innovation is pivotal, especially in relation to the Schumpeterian idea concerning whether large firms have more innovative power than smaller ones [68]. Further, developing an endogenous growth framework, Akcigit and Kerr (2010) show that incremental innovation scales much stronger with firm size than novel innovation [69]. In reality, many large organizations have strong abilities to innovate and can capture the benefits of having the scale of deploying innovative solutions across a broader market. To capture this benefit, they must understand and plan for resistance to major change. That is to say, large organizations usually have the patience to let an idea breathe and can finally achieve the greatest advantage of scale [70].
As far as we know, many previous studies focused on the influence of limited factors on TIRES and ignored the mechanism of the combined effects of various factors by applying dynamic panel estimators. Though a few studies have indeed examined the impacts of various factors on TIRES applying static or dynamic panel approach, they have focused only on the case of European countries or OECD(Organization for Economic Co-operation and Development) countries [22,23,25], instead of China, and they also do not consider this issue for different sources of renewable energy. However, in recent years, China has begun to play a leading role with rapidly increasing investment in renewable energy [3]. The relative importance of different factors for different renewable energy sources (wind, solar, geothermal, ocean and biomass) may be significantly different. Thus, empirical studies focusing on the effects of various factors on TIRES for overall renewables or different sources in China and using a dynamic panel approach will be more meaningful in the future.
Therefore, compared with the existing literature, we tried to gain new insight and make contributions to the following three aspects. (1) We add empirical knowledge about drivers towards TIRES, emphasizing the difference for separate sources of renewable energy (wind, solar, biomass, etc.). (2) Our study was based on an integrated theoretical framework that considers different factors for TIRES (including TIRES in previous period, renewable energy subsidy, renewable energy policies, scale and market demand); most of the other studies only provided a partial consideration of those factors. (3) Applying a dynamic panel approach to analyze the persistent process of TIRES in China is new in the literature.
3. Methodology
3.1. Research Design
This paper employs a dynamic panel approach to examine the driving effect of various factors on TIRES. Such a dynamic panel analysis allowed us to identify and compare the impact of various factors on TIRES for different regions of China, especially the persistent effect of TIRES in previous period on that in current period. As noted earlier, prior studies employed static panel analysis [23,71], systematic dynamic model [72], and case study [73,74] to explore the factors influencing TIRES and found that their effects are not consistent. We argue that such methods are restricted to static analysis or just aimed at overall renewables; in contrast, dynamic panel analysis is more suitable for the research on persistence effects [25,33]; accordingly, dynamic panel studies in the case of different renewable energy sources aimed at different regions of China are also urgently needed. Therefore, we adopted the dynamic panel method to examine the driving effect of various factors on TIRES based on the dynamic panel data of 29 provinces in China from 2006 to 2013.
3.2. Panel Model
To demonstrate the technology innovation status of the total renewables and separate sources of renewable energy respectively, we represented the dependent variable using a series of variables respectively: technological innovation to renewables (TIRES), technological innovation to wind (TIW), technological innovation to solar (TIS), technological innovation to geothermal (TIG), technological innovation to ocean (TIO), and technological innovation to biomass (TIB).
We considered a number of explanatory variables that are likely to generate incentives for innovation and put forward the principal hypotheses as follows: Continuous technological innovation to renewables ()TIRESt−1. The innovation process is characterized by incremental, cumulative, and assimilative. Innovation may lead to revolutionary results through the accumulation of small steps [42]. Accordingly, the decision for promoting TIRES should be a continuous process and cannot be a choice for short term. It implies long term great investments and it makes sense to persist in technological innovation in renewables. We tested the following hypothesis: H1—There is a persistence effect in TIRES. We expected to verify the existence of continuous and persistent TIRES, or rather, TIRES in the current period is positively correlated with that in previous periods.
Renewable energy tariff surcharge subsidy (RETSS). According to the 2006 Renewable Energy Law, the additional cost of integrating electricity from renewable energy sources should be shared among the entire electricity system. The 2006 Law put forward the Renewable Energy Surcharge, which was a fixed tariff added to the price of each kWh of electricity sold through the grid. The revenue generated by this premium is then to be shared among power distributors and utilities to balance the higher price they have to pay for electricity from renewable energy sources [75]. The introduction of renewable energy tariff surcharge in China is an effective policy to mobilize the whole society forces to support the development of renewables [75,76]. As one of China’s typical financial incentives, RETSS should play a significantly positive role in promoting TIRES. We tested the hypothesis: H2—Renewable energy tariff surcharge subsidy has significant positive impacts on TIRES. RETSS should be positively correlated with TIRES, since higher levels of RETSS would make electricity from renewable sources competitive with that from traditional fossil sources.
Research and Development intensity (hereafter called RDI). From the supply-side, there are great chances that general scientific inputs (scientific personnel, Research and Development expenditures, Research and Development intensity etc.) have a significant and positive effect on inventive activity in general. Among these, Research and Development intensity may be an appropriate indicator to capture and compare the driving effects of general scientific inputs on inventive activity in different provinces of China since it is suitable for comparison among different regions with significantly different scientific resources and capacity [77,78,79]. Therefore, we tested the hypothesis: H3—Research and Development intensity has significant positive impacts on TIRES. RDI should be positively correlated with TIRES, since higher levels of RDI in a specific region indicate that this region put more emphasis on resource and personnel inputs into innovation, which lead to greater innovation.
Renewable Energy Installed Capacity (hereafter called REIC). Some recent studies have indicated that scale had a positive effect on the level and quality of innovation [80,81], some studies selected installed capacity of renewable energy as the proxy for scale, but did not confirm its significantly positive effect [82]. Therefore, we test the hypothesis: H4—Renewable energy installed capacity has significant positive impacts on TIRES. REIC should be positively correlated with TIRES since higher levels of REIC in a specific region indicate that the renewable energy industries in this region take the advantage of the scale benefit to deploy innovative solutions across a broader market.
Electricity Consumption (ECONS). Earlier studies focused on the driving effect of market demand in inducing innovation; innovations are in some sense “called forth” or “triggered” in response to market demand. As with any industry, inventive activities are likely to respond to profit-making opportunities. Therefore, the potential to gain investment profits will significantly increase as the market continues to grow [47,48,49]. Marco Guerzoni (2010) puts forward a model where market demand is regarded as a special integration of two conditions of market size and users’ sophistication, and discusses the basic mechanisms of demand-pull innovation [83]. Thus, we test the hypothesis: H5—Electricity consumption has significant positive impacts on TIRES. The sign of the effect should be positive since fast-growing electricity consumption in a specific region indicates that renewable energy industry in this region face fast-growing demand, which lead to greater innovation.
Electricity Price (EPRICE). In accordance with the “induced innovation” hypothesis [84,85], the commercial feasibility of renewable energy depends on its cost to a large extent, compared with substitute factor inputs. Since the costs of electricity generated from renewable energy sources are generally higher than that generated from fossil fuels, the rationalization of electricity pricing mechanism in the mid- and long-term and an reasonable increase in the price of electricity should make renewable energy more competitive and drive innovation in this area [86]. Therefore, we tested the hypothesis: H6—Electricity price has significant positive impacts on TIRES. EPRICE should be positively correlated with TIRES since higher levels of electricity price would mitigate the cost constraints of renewable energy and make electricity from renewable sources competitive with that from traditional energy sources. The above 6 hypothesis is tabulated in Table 1.

Table 1.
Research hypothesis.
In this paper we cannot control for variables of various policy instruments, such as feed-in-tariffs, investment subsidies, tax credits, support tax policy, tendering systems, renewable energy portfolio standard and tradable green certificates. Additionally, we still cannot include fossil fuel price in the explanatory variables. In fact, we are unable to include these variables due to: (i) lack of data for 29 provinces throughout our time span, such as fossil fuel prices; and (ii) some of these measures have not been adopted yet in all provinces in China, such as, renewable energy portfolio standard and tradable green certificates.
We established a panel model by expanding the renewable energy technological innovation model proposed by Johnstone et al. (2010), who suggested that renewable energy technological innovation can be explained by a number of explanatory variables such as policy variables, specific R&D expenditures, electricity consumption, electricity price and total European Patent Office filings. Drawing upon this model and in view of the above mentioned 6 hypothesis, our panel model includes the following seven variables: TIRES, TIRESt−1, RETSS, RDI, REIC, ECONS and EPRICE. The first hypothesis of persistence in TIRES requires, by its nature, a dynamic approach. Accordingly, we propose the following basic model:
where the subscripts and denote the province and time, respectively, denotes the constant term, denotes the coefficient for TIRESit−1, represents the coefficients for other explanatory variables. Here the disturbance term has two orthogonal components: the non-observable fixed effects (time invariant), , and the idiosyncratic shocks, . That is . Specifically, refers to individual fixed effects, which do not change with time. In our panel model, the non-observed fixed effects should refer to the individual heterogeneity of every provinces (there are 29 provinces in our panel data sets) which is time invariant during our time span (2006–2013). refers to the disturbance term which change with the individuality and time and contains information other than the main variables of this panel model. Moreover, in order to eliminate the dimension of each variable and to overcome the heteroscedasticity to some extent, the model can be expressed in logarithmic form and rewritten as follows:
Moreover, the high correlation coefficient between lnTIRES in the current period and that in the previous period is about 0.92, which confirms the high persistence effect in TIRES and strongly supports the adoption of dynamic estimators in our panel model.
As Table 2 shows, we detected signs of autocorrelation (Wooldridge test for autocorrelation, under H0: no first-order autocorrelation) and presented a highly significant F-statistic for all regressors and dependent variables, which certified the existence of first order autocorrelation and further confirms the adoption of dynamic regression. However, besides the dynamic approach, we also adopted the static fixed-effects panel estimation to cope with autocorrelation, and this method used a disturbance term being first-order autoregressive to eliminate serially correlated errors. It allowed more efficient parameter estimates than the independent and identically distributed (i.i.d.) error model in the standard static fixed effect estimation. The model can be written as:
Table 2.
Wooldridge test for autocorrelation in panel data.
With AR(1) error . Durbin-Watson was the method used to compute autocorrelation, where lnTIRESit technological innovation to renewables in the current period and lnRETSSit, lnRDIit, lnREICit, lnECONSit and lnEPRICEit are explanatory variables.
In comparison, dynamic estimators can test how the dependent variable depends on its values in the previous period. The main advantages of the choice for dynamic estimators are as follows: (i) to eliminate the individual non-observable effects of provinces; (ii) to deal with endogeneity among explanatory variables, since their lagged values are used as instrumental variables; (iii) to address collinearity among variables; and (iv) to evaluate the persistence of technological innovation to renewables, allowing us to test whether TIRES in the current period is significantly positive correlated with previous one [25].
In general, we decided to employ four different panel methods: static fixed effects (FE) with AR(1) error terms, the difference Generalized Method of Moments (GMM-dif), the system Generalized Method of Moments (GMM-system) and Least Squares Dummy Variable Corrected (LSDVC). Initially, by Wooldridge test for autocorrelation, we selected the static FE model with AR (1) to carry out estimations on Equation (3). Then we turned to a dynamic approach to deal with autocorrelation. At first, the difference GMM estimator eliminated fixed effects by first-differencing [87]. This paper estimates Equation (2) by using variables in first-differences and lagged levels of lnTIRES and its determinants. This procedure eliminates correlation between and lnTIRESit−1. However, when the number of sample periods w not large, the first-differencing GMM estimator may be biased by the impact of weak instrumental variables provided by lagged levels of the series [88]. To address these issues, Blundell and Bond [88] propose a system GMM estimator (GMM-system). This estimator considers introducing more instruments, namely instruments in first-differences for the equation in levels, and instruments in levels for the equation in first-differences. The systems of equations both in levels and first-differences lead to more robust instruments and can dramatically improve efficiency. There are two conditions that should be established for GMM-dif and GMM-sys to be considered valid: (i) over-identifying restrictions created as a result of the use of instrumental variables for endogenous variables should be valid; and (ii) there is no second-order autocorrelation.
Employing Monte Carlo simulation, Bruno [89] argued that Least Squares Dummy Variable Corrected (LSDVC) estimator is often superior to GMM estimators, both in terms of bias and root mean squared error. The disadvantage of GMM estimators, which generate a large number of instrumental variables under the background of a small number of cross-sectional units, can cause biased and inaccurate estimated parameters. Taking our sample into consideration, we employ the LSDVC estimator. By employing those three dynamic estimators, we are able to test whether TIRES in the previous period has a robust effect on that in the present period.
3.3. Data Sources
Data from the year 2006 to 2013 for 29 Chinese provinces was used. We focused on the following provinces (Anhui, Fujian, Jiangxi, Beijing, Tianjin, Hebei, Guangdong, Guangxi, Hainan, Hubei, Hunan, Heilongjiang, Jilin, Liaoning, Ningxia, Xinjiang, Shandong, Henan, Shanxi, Inner Mongnia, Shaanxi, Gansu, Qinghai, Shanghai, Jiangsu, Zhejiang). The data were derived from State Intellectual Property Office of the P.R.C. (SIPO) (2006–2013), the Annual Report on Electricity Regulation (2006–2013), China Statistical Yearbook on Science and Technology (2007–2014), China Electric Power Yearbook (2007–2014), China Energy Statistical Yearbook (2007–2014), China Agriculture Yearbook (2007–2014) and China Statistical Yearbook (2007–2014). Then we employed the following appropriate indicators for measuring dependent variable and explanatory variables.
In most economics literature, the number of patents and patent applications are usually considered as the most appropriate indicators to evaluate the companies’ innovative performance in terms of new technologies, new processes and new products [39,90,91]. We selected patent applications as the indicator for TIRES for the following reasons. Firstly, patent applications provide a complete picture of characteristics of the invention and the applicant. Secondly, the patent data is both usable at any time, discrete, timely updated, and covering almost every specific field of technology. It is worth noting that there are very few economically major inventions that have not been patented [92,93]. We use as a dependent variable technological innovation to renewables ()(TIRES), measured as the patent counts of renewables. Relevant patent counts in different areas of technology can be identified employing the International Patent Classification (IPC) codes, developed at the World Intellectual Property Organisation. This classification system is a hierarchy of codes, structured into different levels. Based upon the previous literature review, this paper uses a group of IPC codes to identify the patents counts in specific renewable energy sources (including wind, solar, geothermal, ocean and biomass). Table 3 shows the relevant codes and their definitions completely.
Table 3.
International Patent Classification (IPC) codes used for patent counts of specific renewable energy.
According to “Interim Measures on Renewable Energy Electricity Prices and Cost Sharing Management” (NDRC Price (2006) 7 Document, referred to the seventh Document in the following) issued by the National Development and Reform Committee (NDRC) on 4 January 2006, renewable energy tariff surcharge subsidy should be approved by the price department of the state council and levied in accordance with the actual use of the electric power by the electric power users and by the national unified standard. From 28 June 2006 to 5 January 2016, the levying standard of RETSS has been adjusted for 6 times and increased from 0.001 CNY/KWh to 0.019 CNY/KWh. Since we used total electricity consumption for 29 provinces of China to measure the actual use of the electric power, we obtain the RETSS for 29 provinces of China by multiplying the total electricity consumption with the actual levying standard for each year from 2006 to 2013.
The data for research and development intensity of 29 provinces in China can be obtained from China Statistical Yearbook on Science and Technology (2007–2014). The data for renewable energy installed capacity and electricity consumption can be obtained from China Electric Power Yearbook (2007–2014). Finally, the electricity price variable was calculated by weighting price indices for residential and industrial use by consumption levels and we get the data from the Annual Report on Electricity Regulation of China (2006–2013). Table 4 provides the definition of the variables used in our paper.
Table 4.
Definition of the variables used in the study for the period 2006–2013.
3.4. Data Description
Table 5 shows the descriptive statistics for the main variables. The average TIRES index value for all regions was 69.80603, where the lowest was 0 (Qinghai, 2007) and the highest was 656 (Jiangsu, 2013). The average WIND index value for all regions was 15.23276, where the lowest was 0 (Henan, 2008–2010; Hainan, 2007–2009; 2011–2012; Guizhou, 2012; Yunnan, 2008; Shaanxi, 2006, 2008–2011; Gansu, 2007–2013; Qinghai, 2006–2007, 2011–2013; Ningxia, 2006–2009, 2011) and the highest was 133 (Jiangsu, 2011, 2013). The average RETSS index value was 56,181.05 ten thousand yuan, where the maximum was 431,206.5 ten thousand yuan (Jiangsu, 2013) and the minimum was 461.53 ten thousand yuan (Hainan, 2006). The average RDI index value for all provinces was 1.350733%, where the maximum was 6.08 % (Beijing, 2013) and the minimum was 0.2% (Hainan, 2006). The average REIC index value in all regions was 1141.211 MW, where the maximum was 19,908 MW (Inner Mongolia, 2013) and the minimum was 0 MW (Anhui, 2006–2010; Jiangxi, 2006–2007; Henan, 2006–2007; Hubei, 2006; Hunan, 2006–2008; Guangxi, 2006–2010; Sichuan, 2006–2008; Guizhou, 2006–2010; Yunan, 2006–2007; Shaanxi, 2006–2010; Qinghai, 2006–2010). The average ECONS index value was 136,230.9 MWh, where the maximum was 495,700 MWh (Jiangsu, 2013) and the minimum was 9768 MWh (Hainan, 2006). The average EPRICE index value in all regions was 542.7232 yuan/MWh, where the maximum was 1170.57 yuan/MWh (Sichuan, 2013) and the minimum was 293.98 yuan/MWh (Qinghai, 2006).
Table 5.
Descriptive statistics for all variables.
Figure 3 shows the total number of State Intellectual Property Office of the Peoples’ Republic of China (SIPO) patent applications for five renewable energy sources. The patent applications for the five sources grew dramatically since China promulgated the Renewable Energy Law in 2005, however, the growth rate was very slow from 1985 to 2004. Solar applications were the highest, followed by wind applications, and biomass, ocean and geothermal applications took the third, the fourth and the fifth respectively. Solar applications reached the peak value in 2012, then started to fall off in 2013 and 2014, and rebounded in 2015. By comparison, wind applications reached the peak value in 2014, then decreased in 2015. Meanwhile, biomass and ocean have risen steadily particularly since 2005. The patents for geothermal energy is relatively small, but it has been also increasing.
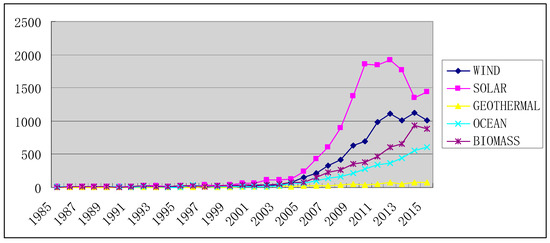
Figure 3.
Number of State Intellectual Property Office of the Peoples’ Republic of China (SIPO) patent applications for renewables by type of technology.
Figure 4 compares total patent applications for a selection of provinces in China which have showed significant levels of innovation. Jiangsu has the highest total number of patents, followed by Beijing and Shandong. Guangdong, Shanghai and Zhejiang have at least 1600 patent applications over the period (2006–2015).
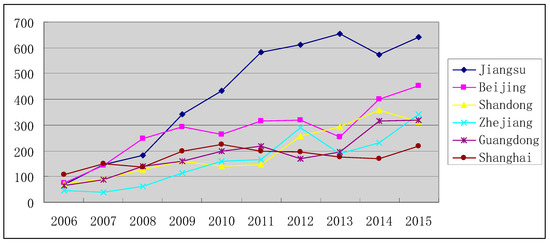
Figure 4.
Number of SIPO patent applications for renewables by province.
In addition to these provinces, there are specific areas in which individual provinces have been important innovators for specific renewables. As shown in Figure 5, Figure 6, Figure 7, Figure 8 and Figure 9, Jiangsu also has the highest number of patents in wind, solar and ocean, Beijing has the highest number of patents in geothermal and biomass, in addition to Jiangsu and Beijing (provinces which have been consistently important innovators for most renewables), other important innovators for specific renewable energy sources have included Shanghai (wind), Shandong (solar, biomass), Guangdong (ocean), Zhejiang (ocean) and Shaanxi (geothermal).
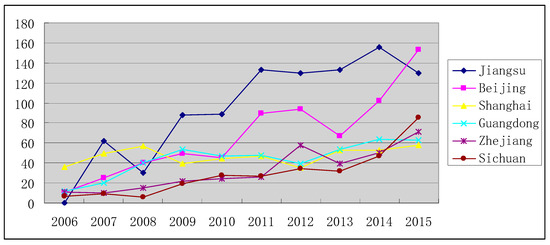
Figure 5.
Number of SIPO patent applications for wind by province.
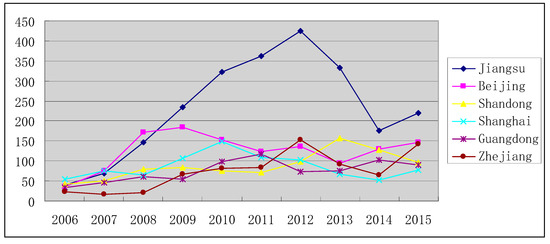
Figure 6.
Number of SIPO patent applications for solar by province.
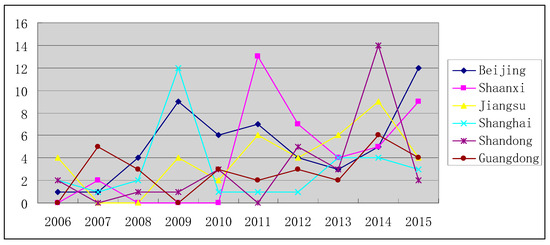
Figure 7.
Number of SIPO patent applications for geothermal by province.
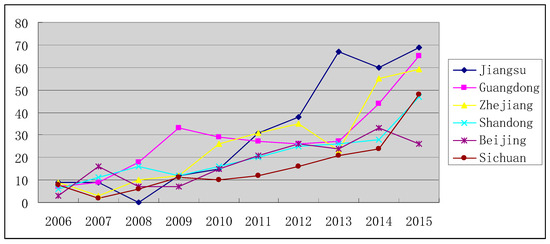
Figure 8.
Number of SIPO patent applications for ocean energy by province.
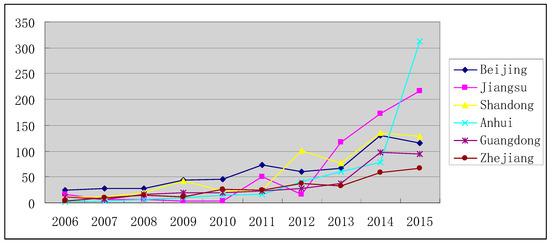
Figure 9.
Number of SIPO patent applications for biomass by province.
4. Results
As Table 2 shows, we detected signs of autocorrelation and present a highly significant F-statistic for all regressors and dependent variables, and therefore we employed four different estimation methods to assess the effects of various factors on TIRES: a static FE panel model with the error term being first order autoregressive (Model I); dynamic estimators include the difference Generalized Method of Moments (GMM-dif), the system Generalized Method of Moments (GMM-system) and Least Squares Dummy Variable Corrected (LSDVC).
Since there are few patent counts for geothermal and ocean, we analyzed the empirical results for all renewables (see Table 6), the empirical results for wind, solar and biomass (as indicated by Table 7, Table 8 and Table 9).
Table 6.
Results from models for all renewables.
Table 7.
Results from models for wind energy.
Table 8.
Results from models for solar energy.
Table 9.
Results from models for biomass energy.
4.1. Estimation for All Renewables
Overall, most of the explanatory variables possessed the desired signs and magnitudes. To test multicollinearity, we provided the Variance Inflation Factor (VIF) test. Both the mean VIF of 3.44 and the highest individual VIF of 5.41 showed that there is no collinearity here.
The results from estimators GMM-dif and GMM-sys are effective. Since the selection of instrumental variables is the most critical in dynamic panel model, we often have multiple instrumental variables to be available for an endogenous variable, and the problem of over-identification will occur in this case. Therefore, Sargan tests () should be used to check the over-identifying restrictions (namely, the rationality of the use of instrumental variables) [87] (Sargan is used to test the over-identifying restrictions, and it is asymptotically distributed as under the null of instrument variable validity, with degree of freedom reported in parentheses [87].). Because the value of for both cases are statistically significant at 5% level, restrictions created as a consequence of the use of instrumental variables are valid, which means condition (i) is established. Secondly, condition (ii) is also checked. We cannot reject the null hypothesis of absence of second-order autocorrelation.
As Table 6 shows, the coefficient of lnECONS was at least positive at the 10% level and it was significantly higher than that of the other variables. Thus, at the present stage in China, ECONS is still the most important factor that drives TIRES. This conclusion is also consistent with many other researchers, who suggested that demand has always been an important driving factor that affects innovation [47,50,51,52,53,54]. It implies that TIRES can be effectively promoted by expanding the demand. According to the most recent literature [57], it also indicates that renewable energy technology in China has been on earlier stage of innovation. The coefficient of lnRDI was at least significantly positive at the 5% level, which indicates that RDI is an important driving factor that is second only to ECONS, where this conclusion also agrees with that of previous studies [32,33,36,37]. It means that TIRES can also be effectively promoted by expanding the general scientific inputs in specific region. On the whole, the coefficient of lnTIRESi,t−1 for all models was statistically positive at 1% level, which shows great consistency and strongly certifies that TIRES in the previous period has a highly significant and positive persistent effect, and the magnitude was merely second only to that of lnECONS and lnRDI. It certifies the significance of maintaining a stable policy system.
The coefficient of lnRETSS was not statistically significant for Model II to Model VI, which indicates that RETSS is not a significant factor. This may due to the following fact that the implementation of Chinese renewable energy subsidy policy is not satisfactory, specifically, a large number of subsidy policies aimed at renewable energy have a certain time lag [94]; further, demand side subsidy may generate substantial welfare losses [60].
The coefficient of lnREIC was significantly positive at the 10% level for all models but the value was negligible, which indicates that at present, the larger scale of installed renewable energy capacity can lead to higher technological innovation in this field. However, the driving effect was very limited, this may be due to the following reason, the excessive subsidies and the swarm of the enterprises have resulted in overcapacity and thus hindered the progress of the technology [82]. Some researchers have further indicated that the effect of subsidy policy in China on renewable energy capacity varied for different sources. That is, subsidies have had the most significant impacts on solar energy, while had the less impacts on wind energy [94,95]. Instead, the coefficient of lnEPRICE was significantly negative at the 10% level (except Model IV), which indicates that electricity price has an inhibitory effect on TIRES.
4.2. Estimation for Specific Sources of Renewables
In order to explore the effects of different factors on technological innovation for specific sources of renewable energy, we divided renewable energy into five sources: wind, solar, geothermal, ocean, and biomass. Since there are few patent counts for geothermal and ocean for 29 provinces of China from 2006 to 2013, we focus on the estimation results for wind, solar and biomass (as shown by Table 6, Table 7 and Table 8). As shown in Table 7, the coefficient of lnECONS for wind energy was positive at 10% significance level (except model I) and it was significantly higher than that of the other variables, which indicates that electricity consumption was the most important factor driving innovation in wind energy. The coefficient of lnRDI was significantly positive, at least at 10% level, and the magnitude was second only to lnECONS, which indicates that research and development intensity was the second most important driving factor for TIW, and the relative importance of these two factors for wind energy are similar to that for all renewables. The coefficient of lnRETSS was negligible and was not significant, which shows that for wind energy, the driving effect of RETSS was not significant. The coefficient of lnTIWi,t−1 was significantly positive at least at 10% level (except Model I), which also reveals great consistency that the technological innovation to wind, in the previous period, has a highly significant and positive persistent effect on that in the current period. For wind energy, the way that REIC and EPRICE drive technological innovation is similar to that for all renewables.
As shown in Table 8, The coefficient of lnTISi,t−1 was significantly positive at 5% level and the magnitude was the highest (except Model I and Model II), which reveals that TIS in the previous period, has the greatest persistent effect. The coefficient of lnRDI for solar energy was positive at 5% level and the magnitude was second only to lnTISi,t−1, which indicates that research and development intensity was the second most important factor driving TIS. The coefficient of lnECONS for solar energy was significantly positive at least at 10% level (except Model VI) and the magnitude was smaller than lnTISi,t−1 and lnRDI, which indicates that electricity consumption has smaller driving effect on TIS compared with all renewables and wind energy. Similar to all renewables and wind energy, it also indicated that the effects of lnRETSS and lnREIC on TIS were not significant. Also similarly, the coefficient of lnEPRICE was also negative and statistically significant at 5% level, which means that lowering electricity price will contribute to higher TIS.
As shown in Table 9, the coefficient of lnTIBi,t−1 was significantly positive at 5% level, which reveals that TIB, in the previous period, has a highly significant and positive persistent effect. The coefficient of lnRDI was positive at 5% level and the magnitude was higher than that of any other variables, which indicates that research and development intensity was the most important driver for TIB. The coefficient of lnECONS was significantly positive at least at 10% level (except Model V and Model VI) and the magnitude was only second to lnRDI, which indicates that electricity consumption is the second most important driver for TIB. Similar to all renewables, wind energy and solar energy, it also showed that the driving effects of lnRETSS and lnREIC on TIB were not obvious. The coefficient of lnEPRICE was also negative but not statistically significant for most of the models, which means that the effect of electricity price on TIB is minimal.
5. Discussion
We find several interesting phenomenon from the above empirical results.
- (1)
- There is a need for consistent and stable policies for renewable energy deployment and innovation [96], since the past knowledge stock based on patents have positive impacts on the existing innovation of renewable energy [53]. Therefore, reducing uncertainty is a crucial component of effective renewable energy policy [45]. It seems appropriate to employ dynamic estimators to analyze the driving factors of TIRES, because they enable us to evaluate the persistence of commitment and investment to renewable energy innovation. Indeed, we verified Hypothesis H1 There is a persistence effect in TIRES, i.e., the current level of TIRES depends positively on TIRES in the previous period. Results confirmed the need for a stable and consistent policy support for renewables, which is in accordance with those suggested by Wiser and Pickle (1998) [44] for the United States, Miguel Mendonca, et al. (2009) [8] for Denmark and the United States, and by van Rooijen and vanWees [7] for the Netherlands. They all pointed out that the persistence effect in TIRES is a very important criteria for assessing the efficiency of renewable energy policies, and the uncertainty risk of renewable energy policies are the main hindrance for longer-term business and investment planning for renewables in these countries.
- (2)
- From the above empirical results, we conclude that RDI is one of the most important drivers for TIRES, since the estimated coefficient for lnRDI is significantly positive, and second only to lnECONS for all renewables and wind energy. This is in consistent with some literature [32,97]. The International Science Panel on Renewable Energies (ISPRE) released a global report on photovoltaic and wind energy in 2009, which stated that Research and Development (R&D) has had important effects in promoting renewable energy innovation, additionally, R&D aimed at different stages of the innovation chain will generate benefits whether for the short-term (up to five years), medium-term (5–15 years); or for the longer term (15 years plus). Regardless of whether R&D is carried out from a long or short-run perspective, it must help enhance performance and reduce costs, otherwise, it will help to strengthen the role of renewable energy in a sustainable energy system (ISPRE, 2009) [97]. Using U.S. patent data from 1970 to 2001, along with historic energy prices and federal R&D spending data, Taylor (2008) examined the effect of energy price and R&D spending on innovation in the non-hydro renewable energy industries and revealed that there was a very strong positive correlation between both R&D spending and energy price and innovation in the non-hydro renewable energy industries [32].For different sources of renewable energy, the relative importance of RDI is slightly different. As model (II) to model (VI) in Table 6 and Table 7 indicated, RDI is the second most important driver for technological innovations in wind energy and all renewables (electricity consumption is the most important driver), but is the most important driver for technological innovation in solar energy (Table 8). This is in accordance with Mario Ragwitz and Apollonia Miola (2005), which showed that RD&D spending had more prominent driving effects on relevant international patents in some research and development intensive technologies such as photovoltaics, therefore, for these technologies learning by searching has the most significant driving effects on technological innovations, while for other technologies like wind energy, the effect of learning by doing and learning by using will be more significant [38]. It means that for solar power, RDI maybe the most important driver for innovation, while for wind power, electricity consumption maybe the most important driver for innovation. Our empirical results have confirmed this point. Since we use electricity consumption as measure for market demand, it actually implies that market demand may be the most important driver for wind power innovation and all renewables innovation, which is in accordance with previous literature [30,98]. In addition, as model (II) to model (VI) in Table 9 indicated, RDI is the most important driver for TIB, and electricity consumption is the second most important driver, which is in agreement with solar power. Biomass energy also belongs to research and development intensive technologies, therefore, R&D spending is of great importance for the development and technological innovation of biomass power in China. Lin, B.Q. and He, J.X. (2016) applied an improved model of learning curves to examine the effect of various factors on cost reduction of biomass and concluded that more R&D expenditure are very necessary and important for the development of biomass power industry in China [99].
- (3)
- For all renewables, the estimated coefficient of lnECONS is the strongest and statistically significant, which implies that ECONS is the most important driver for TIRES. This is in consistent with demand-pull perspectives in innovation studies [50,100,101,102], and most of the research indicated that growing markets will increase the potential to recoup investments and stimulate inventive talents to identify solutions to a given problem. For wind energy, the estimated coefficient of lnECONS is also the greatest and statistically significant at 5% level according to Model (II) and Model (III); while for solar energy and biomass, the relative importance of lnECONS is slightly different, specifically, the estimated coefficients of lnECONS for lnTIS and lnTIB are both strong and statistically significant, but second only to that of lnRDI, which means that ECONS is the second most important driver for solar energy and biomass, and RDI is the most important driver for solar and biomass. This is supported by research made by Wangler (2012) [54], who concluded that the growing demand drives innovation in renewable energy sector of Germany, and additionally, the relationship between demand and innovation was weaker than the whole when innovation levels within the different energy sectors such as solar, wind, water, biogas, and geothermal were separately taken into consideration.
- (4)
- For all renewables, unlike hypothesis H6, electricity price has significant positive impacts on TIRES, the above empirical results indicated that the estimated coefficient of lnEPRICE for lnTIRES is statistically significant and negative, which revealed that lowering electricity prices will lead to higher technological innovation in renewables. In recent years, there has also been literature supporting the negative relationships between electricity prices and renewables [103,104]; more specifically, the literature suggested that the introduction of renewable electricity reduced electricity prices in Germany, Spanish and Central Europe. Our results also confirmed the negative interrelationship between electricity prices and renewables innovation in China, and further revealed that lowering electricity prices would be an effective policy leading to innovation in renewables. This may due to the following fact that, until 2014, thermal power was still dominated in the energy structure of the generating capacity of China’s full caliber, which accounted for 75.4% of the total, while renewables (including wind power, solar power, geothermal, tide, etc.) only accounted for 3.3% [105,106]. Thus, reducing electricity prices are tantamount to compressing the living space of large amounts of thermal power plants in China, which will inevitably have negative effects on their profitability (According to estimation of the analyst of Anxunsi Consulting Co. Ltd., the profitability of thermal power plants in China will be reduced by 5% for every 1% reduction in electricity prices). Therefore, Chinese power plants have had to shift to more renewable generation to survive in the market and meet the heavy demand since Chinese renewables electricity are usually subsidized by the government through the mechanism of fixed feed in tariff (As William Schrider (2011) noted that, feed-in tariffs subsidize renewable energy by forcing utilities to purchase renewable energy at fixed, above-market prices. The extra cost is then passed to the consumers. Feed-in tariffs are simply another subsidy that props up a selected industry and damages the economy, industry, and consumers) [86,107], and reduction on electricity prices only means the gap between the fixed feed-in tariff for renewables and electricity prices is widened, thus power plants focusing on renewables are more heavily subsidized than before but without negative effects on their profitability so long as they can obtain subsidies in time and in full amount. That is to say, many Chinese renewable generation enterprises rely on subsidies to survive [108,109], while electricity prices reduction will merely have a direct negative effect on thermal power plants. In general, this result confirmed that, in the context of subsidizing renewables through fixed feed-in tariff, reducing electricity price would accelerate the generation transformation from fossil fuel to renewables and lead to higher innovation in renewables in China.
- (5)
- Whether for all renewables or for the different sources of renewables (wind, solar and biomass), the above empirical results did not support the hypothesis H2—Renewable energy tariff surcharge subsidy has significant positive impacts on TIRES, since the estimated coefficient for lnRETSS is small and not statistically significant. RETSS is demonstrated to have an insignificant and positive association with TIRES, This means that Chinese subsidy policy has not played the desired role in promoting innovation in renewables. For example, though Chinese solar power companies have been heavily subsidized by the government, few of them showed innovative potential and competitiveness in the global market [110]. This may be due to the following reason, firstly, the Chinese government provided excessive funding for clean energy R&D around the world, furthermore, Chinese government subsidies have a significant crowding out effect on enterprises’ R&D investment [111] and cause a relative lack of private R&D within China, which will have negative effects on innovation in renewables [112]. Secondly, the vague guidance of subsidy policies has caused a series of problems such as overcapacity, excessive competition and shortage of funds and so on [94]. In addition, even if subsidies falls into a relatively effective range, they will still intensify the risk of overcapacity for solar companies [95]. Thirdly, there is a lack of coordination between the power generation side and the power grid side, which causes some parts of renewable energy power generation that have been subsidized cannot be delivered out and cannot also be consumed by local power users. Thus the abandonment of abundant renewable energy power generation will damage efficiency of subsidy policies and violate its original intention [63].
6. Conclusions and Policy Implications
We adopted a dynamic panel approach to examine driving factors on the technological innovation of renewable energies for a set of 29 provinces in China, from the year 2006 to 2013. The dynamic estimators revealed great consistency of results.
Whether for all renewables or specific sources, we confirm the existence of the persistency effect, which means that the technological innovation level of renewable energy in the previous period is significantly positive correlated with the current one. Especially, solar energy has the greatest persistency effect. Electricity consumption is the most important driver for TIRES and TIW, while research and development intensity is the biggest driver for solar and biomass. We cannot provide strong evidence that renewable energy tariff surcharge subsidy is a significant driver for all renewables or specific sources for our time span, which reveals the very limited innovation effect of Chinese subsidy policy. The innovation-promoting effect of renewable energy-installed capacity was negligible for all renewable or specific sources, since excessive renewable installed capacity in China may result in the opposite effect and offset the promoting effect of scale on innovation to a certain extent. Unexpectedly, electricity price has a significantly negative effect on innovation for all renewables or specific sources, which implies that reducing electricity price may be a good policy choice to lead to higher technological innovation for renewables in China.
Our empirical analysis points to the following policy implications.
- (1)
- Maintain a stable policy system and realize persistent innovation. Governments must balance between policy stability, to stimulate investment, and adaptive policymaking, to improve the design of renewable energy policy [113]. According to our empirical results, we have confirmed the persistence effect of TIRES, which also implies that those regions which have been innovating once have a higher probability of innovating again in the future periods. Since the differences in innovation strategies across regions lead to persistent innovation, it is suggested that regions should pursue the strategies “market driven”, “R&D intensive”, and “science based” to become persistent innovators [114]. Through providing revenue certainty, the stable and carefully designed policy design can lead to a dramatic cost reduction in renewable energy development and thus reduce financing risk premiums [44].
- (2)
- Emphasizing the coordination between the R&D supporting policies and market demand promoting policies. Both the potential, evolving knowledge base of science and technology and market demand play core roles in innovation in an interactive way, and ignoring either of them must lead to erroneous conclusions and policies. That is to say, innovation can come from technology push, demand pull, or from the common effect of both technological competences and market-related competences [115]. Neuhoff (2005) also stated that the critical policy response is strategic deployment coupled with increased R&D support to quicken the pace of improvement through market experience [43]. According to our empirical results, both RDI and ECONS are very important drivers for innovation of all renewables and specific sources though their relative importance are slightly different for them, which also implies the importance of realizing the coordination between resource-focused strategy and demand-pull strategy. Specifically, technology development activities in first generation of renewable technologies are mainly driven by demand-pull policies based on quantity and price. On the contrary, the pace of technology development activities in advanced generation of biofuels is certified to respond positively not only to demand-pull policies based on price, but also to technology-push policy [116]. It implies the importance of applying different policy instruments (quantity-based, price-based demand-pull policies or technology push policies) at different stages of maturity of renewable energy technology development.
- (3)
- Improve the innovation effect of subsidy policy in China. According to our empirical results, RETSS is not a significant driving factor for innovation in renewable energy in China; thus, we can take the following strategies to improve the driving effect of the subsidy policy. (1) Specific subsidies directly targeted at TIRES should be designed. In view that innovation is a long-term investment with great uncertainties, government direct innovation subsidy can essentially provide financial support through providing stable revenue expectation, directly reduce the costs and risks faced, and thus provide the incentive for innovation [117,118]. Additionally, it is also pointed out that government direct subsidy to innovation has greater promoting effect on private enterprises instead of state owned enterprises [117]. Therefore, government financial subsidy should slant to private enterprises in the future to enhance its role in stimulating innovation. (2) The government should dynamically down regulate subsidy intensity to the moderate range, which can improve the effectiveness of government direct subsidy. There is some research suggesting that only moderate subsidy stimulates firms’ new product innovation significantly, while high degree subsidy suppresses firms’ new product innovation [94,119]. (3) Reasonably decide the optimal scale of subsidies for specific renewable sources through estimating the levelized cost of electricity (LCOE) of renewable energy based on the data of different power plants in different regions of China. The subsidies granted to solar should be cautious, because subsidies for solar have reduced the utilization of capacity, while current amounts of wind energy subsidies seem to be efficient and will not lead to deterioration of overcapacity [96]. Specifically, it is of great importance to determining the required subsidies scale based on LCOE since subsidies to renewable power generation in the short-term are mainly implemented through the feed-in-tariff (FIT) system [86]. Additionally, the government should also employ the method “subsidies to scales” to avoid the negative effect caused by excessive subsidies.
- (4)
- Deal with the overcapacity in Chinese renewable energy industry. According to our empirical results, renewable installed capacity has negligible effects on innovation, which may be due to the overcapacity in renewables in China in recent years. According to a report by the IEA in 2016, China took the leading position in the world in expanding renewable energy capacity in 2015, and is set to grow by another 60% over the next half decade. However, due to a slowdown in electricity demand in China and the fact that renewables have a cost disadvantage compared with fossil fuels, integrating that capacity could be difficult, which inevitably resulted in electricity overcapacity. Therefore, the IEA have warned that a new challenge of electricity overcapacity is likely to emerge in the medium term given that China still has a large number of coal, nuclear and renewable plants to be developed [119]. Overcapacity is a serious short-term problem; however, the alternative measures to this problem may also open opportunities to accelerate a broader long-term transition to a low-carbon energy system. Specifically, measures both on the demand and on the supply side could be coordinated to deal with overcapacity issue. (1) On the demand side, policy incentives should be implemented to increase domestic electricity demand. In this sense, the overcapacity in the electricity system may be an opportunity to accelerate the electrification of the heat and transport sectors, which is arguably a main trend for the decarbonization of the whole economy [120]; (2) On the supply side, the government should take this opportunity to realize a gradual fossil fuels phase-out in the medium and long term, for example, by establishing the stricter environmental standards for thermal power plants and removing the existing subsidies for the consumption of fossil fuels.
- (5)
- According to our empirical results, lowering terminal electricity price will lead to higher innovation for renewables. Therefore, actively carrying out electricity price reform and lowering the terminal electricity price will be a good choice to stimulate innovation in renewables. At first, the government should implement transmission-distribution electricity price (In a broad sense, the electricity price can be divided into three types: feed-in tariff, sales price, and transmission and distribution price. Feed-in tariff refers to the price at which power generation enterprises sell electricity to the power grid enterprises; sales price refers to the price at which the power grid enterprises sell electricity to the electricity users; and transmission and distribution price means the freight for electricity.) reform since it is the focus of the formation mechanism of electricity price. The active implementation of transmission and distribution electricity price reform will help to urge provinces to reduce unreasonable costs, thus effectively resulting in a reduced terminal electricity price. Secondly, the government should also actively promote the marketization of power generation prices and sales prices of electricity. According to the statistics from the National Development and Reform Commission from 2011 until now, due to the decreased power generation costs (especially the reduction in coal prices in recent years), the average feed-in tariff of power generation enterprises has dropped by 0.0744 yuan/kWh, while the average sales prices of electricity for end users dropped by 0.02–0.03 yuan/kWh; thus the saved fund from the price difference has increased the total sum of the renewable energy surcharge fund, which is supposed to lead to higher innovation in renewables.
Acknowledgments
This study was financially supported by the National Natural Science Foundation of China (Grant No. 71573253) and the Fundamental Research Funds for the Central Universities (Grant No. 2017XKQY100).
Author Contributions
Zheng-Xia He conceived and designed the experiments; Shi-Chun Xu performed the experiments; Bin Zhao analyzed the data; Qin-Bin Li contributed reagents/materials/analysis tools; Zheng-Xia He wrote the paper.
Conflicts of Interest
The authors declare no conflicts of interest.
References
- Renewable Energy Policy Network for the 21st Century (REN 21). Renewables 2016 Global Status Report. Available online: http://www.ren21.net/wp-content/uploads/2016/06/GSR_2016_Full_Report.pdf (accessed on 6 June 2016).
- IEA (International Energy Agency). World Energy Outlook 2015: Executive Summary; OECD/IEA: Paris, France, 2015; Available online: https://www.iea.org/Textbase/npsum/WEO2015SUM.pdf (accessed on 7 June 2015).
- Frankfurt School-UNEP Centre/BNEF, 2016. Global Trends in Renewable Energy Investment 2016. Available online: http://fs-unep-centre.org/sites/default/files/publications/globaltrendsinrenewableenergyinvestment2016lowres_0.pdf (accessed on 8 September 2016).
- Kempton, W.; Tomić, J. Vehicle-to-grid power implementation: From stabilizing the grid to supporting large-scale renewable energy. J. Power Sour. 2005, 144, 280–294. [Google Scholar] [CrossRef]
- Rai, V.; Sigrin, B. Diffusion of environmentally-friendly energy technologies: Buy versus lease differences in residential PV markets. Environ. Res. Lett. 2013, 8, 014022. [Google Scholar] [CrossRef]
- Agnolucci, P. Renewable electricity policies in The Netherlands. Renew. Energy 2007, 32, 868–883. [Google Scholar] [CrossRef]
- Van Rooijen, S.N.; Van Wees, M.T. Green electricity policies in the Netherlands: An analysis of policy decisions. Energy Policy 2006, 34, 60–71. [Google Scholar] [CrossRef]
- Mendonca, M.; Lacey, S.; Hvelplund, F. Stability, participation and transparency in renewable energy policy: Lessons from Denmark and the United States. Policy Soc. 2009, 27, 379–398. [Google Scholar] [CrossRef]
- Moula, M.M.E.; Maula, J.; Hamdy, M.; Fang, T.; Jung, N.; Lahdelma, R. Researching social acceptability of renewable energy technologies in Finland. Int. J. Sustain. Built Environ. 2013, 2, 89–98. [Google Scholar] [CrossRef]
- Wustenhagen, R.; Bilharz, M. Green energy market development in Germany: Effective public policy and emerging customer demand. Energy Policy 2006, 34, 1681–1696. [Google Scholar] [CrossRef]
- Lüdeke-Freund, F.; Loock, M. Debt for brands: Tracking down a bias in financing photovoltaic projects in Germany. J. Clean. Prod. 2011, 19, 1356–1364. [Google Scholar] [CrossRef]
- Yildiz, Ö.; Rommel, J.; Debor, S.; Holstenkamp, L.; Mey, F.; Müller, J.R.; Radtke, J.; Rognli, J. Renewable energy cooperatives as gatekeepers or facilitators? Recent developments in Germany and a multidisciplinary research agenda. Energy Res. Soc. Sci. 2015, 6, 59–73. [Google Scholar] [CrossRef]
- Karatayev, M.; Hall, S.; Kalyuzhnova, Y.; Clarke, M.L. Renewable energy technology uptake in Kazakhstan: Policy drivers and barriers in a transitional economy. Renew. Sustain. Energy Rev. 2016, 66, 120–136. [Google Scholar] [CrossRef]
- Ortega-Izquierdo, M.; Río, P.D. Benefits and costs of renewable electricity in Europe. Renew. Sustain. Energy Rev. 2016, 61, 372–383. [Google Scholar] [CrossRef]
- Cato, M.S.; Arthur, L.; Keenoy, T.; Smith, R. Entrepreneurial energy: Associative entrepreneurship in the renewable energy sector in Wales. Int. J. Entrep. Behav. Res. 2008, 14, 313–329. [Google Scholar] [CrossRef]
- Ince, D.; Vredenburg, H.; Liu, X.Y. Drivers and inhibitors of renewable energy: A qualitative and quantitative study of the Caribbean. Energy Policy 2016, 98, 700–712. [Google Scholar] [CrossRef]
- Bilgen, S.; Keles, S.; Kaygusuz, A.; Sari, A.; Kaygusuz, K. Global warming and renewable energy sources for sustainable development: A case study in Turkey. Renew. Sustain. Energy Rev. 2008, 12, 372–396. [Google Scholar] [CrossRef]
- Duić, N.; da Graça Carvalho, M. Increasing renewable energy sources in island energy supply: Case study Porto Santo. Renew. Sustain. Energy Rev. 2004, 8, 383–399. [Google Scholar] [CrossRef]
- Shahrestani, M.; Yao, R.; Luo, Z.; Turkeyler, E.; Davies, H. A field study of urban microclimates in London. Renew. Energy. 2015, 73, 3–9. [Google Scholar] [CrossRef]
- Divic, V. Wind energy potential in the Adriatic coastal area, Croatia-field study. In International Symposium on Computational Wind Engineering; William and Ida Friday Center for Continuing Education: Chapel Hill, NC, USA, 2010. [Google Scholar]
- Rübbelke, D.T.; Weiss, P. Environmental Regulations, Market Structure and Technological Progress in Renewable Energy Technology—A Panel Data Study on Wind Turbines; SSRN Electronic Journal 2011, April; Social Science Electronic Publishing: Rochester, NY, USA, 2011. [Google Scholar]
- Marques, A.C.; Fuinhas, J.A.; Manso, J.P. Motivations driving renewable energy in European countries: A panel data approach. Energy Policy 2010, 38, 6877–6885. [Google Scholar] [CrossRef]
- Emodi, N.V.; Shagdarsuren, G.; Tiky, A.Y. Influential factors promoting technological innovation in renewable energy. Int. J. Energy Econ. Policy 2015, 5, 889–900. [Google Scholar]
- Scholtens, B.; Veldhuis, R. How does the Development of the Financial Industry Advance Renewable Energy? A Panel Regression Study of 198 Countries over Three Decades. Beiträge zur Jahrestagung des Vereins für Socialpolitik 2015: Ökonomische Entwicklung-Theorie und Politi-Session: Environmental Economics III No. C13-V2. Available online: https://www.econstor.eu/bitstream/10419/113114/1/VfS_2015_pid_177.pdf (accessed on 6 January 2018).
- Marques, A.C.; Fuinhas, J.A. Drivers promoting renewable energy: A dynamic panel approach. Renew. Sustain. Energy Rev. 2011, 15, 1601–1608. [Google Scholar] [CrossRef]
- Gray, W.B.; Shadbegian, R.J. Environmental Regulation, Investment Timing, and Technology Choice. J. Ind. Econ. 1998, 46, 235–256. [Google Scholar] [CrossRef]
- Snyder, L.D.; Miller, N.H.; Stavins, R.N. The effects of environmental regulation on diffusion: The case of chlorine manufacturing. Am. Econ. Rev. 2003, 93, 431–435. [Google Scholar] [CrossRef]
- Popp, D.; Hascic, I.; Medhi, N. Technology and the diffusion of renewable energy. Energy Econ. 2011, 33, 648–662. [Google Scholar] [CrossRef]
- Jaffe, A.B.; Newell, R.G.; Stavins, R.N. A tale of two market failures: Technology and environmental policy. Ecol. Econ. 2005, 54, 164–174. [Google Scholar] [CrossRef]
- Aflaki, S.; Basher, S.A.; Masini, A. Does economic growth matter? Technology-push, demand-pull and endogenous drivers of innovation in the renewable energy industry. SSRN Electron. J. 2014, 5, 6393–6400. [Google Scholar] [CrossRef]
- Groba, F.; Breitchopf, B. Impact of Renewable Energy Policy and use on Innovation—A literature Review. Wirkungen des Ausbaus Erneuerbarer Energien Impact of Renewable Energy Sources. Available online: https://www.diw.de/documents/publikationen/73/diw_01.c.426553.de/dp1318.pdf (accessed on 1 July 2013).
- Taylor IV, R.E. Induced Innovation in Non-Hydro Renewable Technologies: The Effects of Energy Prices and Federal Spending. Undergrad. Econ. Rev. 2008, 4, 13. Available online: http://digitalcommons.iwu.edu/uer/vol4/iss1/13 (accessed on 5 November 2008).
- Sung, B. Public policy supports and export performance of bioenergy technologies: A dynamic panel approach. Renew. Sustain. Energy Rev. 2015, 42, 477–495. [Google Scholar] [CrossRef]
- Edler, J. (Ed.) Nachfrageorientierte Innovationspolitik; Arbeitsbericht Nr. 99; Büro für Technikfolgenabschätzung beim Deutschen Bundestag (TAB): Berlin, Germany, 2006. [Google Scholar]
- Gan, J.; Smith, C.T. Drivers for renewable energy: A comparison among OECD countries. Biomass Bioenergy 2011, 35, 4497–4503. [Google Scholar] [CrossRef]
- Watanabe, C.; Wakabayashi, K.; Miyazawa, T. Industrial dynamism and the creation of a virtuous cycle between R&D, market growth and price reduction-the case of photovoltaic power generation (PV) development in Japan. Technovation 2000, 20, 299–312. [Google Scholar]
- Klaassen, G.; Miketa, A.; Larsen, K.; Sundqvist, T. The impact on R&D on innovation for wind energy in Denmark, Germany and the United Kingsom. Ecol. Econ. 2005, 54, 227–240. [Google Scholar]
- Ragwitz, M.; Miola, A. Evidence from RD&D spending for renewable energy sources in the EU. Renew. Energy 2005, 30, 1635–1647. [Google Scholar]
- Johnstone, N.; Hascic, I.; Popp, D. Renewable energy policies and technological innovation: Evidence based on patent counts. Environ. Resour. Econ. 2010, 45, 133–155. [Google Scholar] [CrossRef]
- Taylor, M. Beyond technology-push and demand-pull: Lessons from California’s solar policy. Energy Econ. 2008, 30, 2829–2854. [Google Scholar] [CrossRef]
- Laleman, R. Albrecht Johan. Comparing push and pull measures for PV and wind in Europe. Renew. Energy 2014, 61, 33–37. [Google Scholar] [CrossRef]
- Fri, R.W. The role of knowledge: Technological innovation in energy systems. Energy J. 2003, 24, 51–74. [Google Scholar] [CrossRef]
- Neuhoff, K. Large-Scale Deployment of Renewables for Electricity Generation. Oxf. Rev. Econ. Policy 2005, 21, 88–110. [Google Scholar] [CrossRef]
- Wiser, R.; Pickle, S. Financing investments in renewable energy: The impacts of policy design. Renew. Sustain. Energy Rev. 1998, 2, 361–386. [Google Scholar] [CrossRef]
- Barradale, M.J. Impact of public policy uncertainty on renewable energy investment: Wind power and the production tax credit. Energy Policy 2010, 38, 7698–7709. [Google Scholar] [CrossRef]
- Liang, J.Q.; Fiorino, D.J. The implications of policy stability for renewable energy innovation in the United States, 1974–2009. Policy Stud. J. 2013, 41, 97–118. [Google Scholar] [CrossRef]
- Meyers, S.; Marquis, D.G. Successful Industrial Innovation: A study of Factors Underlying Innovation in Selected Firms; National Science Foundation: Washington, DC, USA, 1969. [Google Scholar]
- Langrish, J.; Gibbons, M.; Evans, W.G.; Jevons, F.R. Wealth from Knowledge: A Study of Innovation in Industry; Halsted/John Wiley: New York, NY, USA, 1972. [Google Scholar]
- Di Stefano, G.; Gambardella, A.; Verona, G. Technology Push and Demand Pull Perspectives in Innovation Studies: Current Findings and Future Directions. Res. Policy 2012, 41, 1283–1295. [Google Scholar] [CrossRef]
- Schmookler, J. Invention and Economic Growth; Harvard University Press: Cambridge, MA, USA, 1966. [Google Scholar]
- Newell, R.; Jaffe, A.B.; Stavins, R. The effects of economic and policy incentives on carbon mitigation technologies. Energy Econ. 2006, 28, 563–578. [Google Scholar] [CrossRef]
- Newell, R.G.; Jaffe, A.B.; Stavins, R.N. The induced innovation hypothesis and energy-saving technological change. Q. J. Econ. 1999, 114, 941–975. [Google Scholar] [CrossRef]
- Popp, D. Induced innovation and energy prices. Am. Econ. Rev. 2002, 92, 160–180. [Google Scholar] [CrossRef]
- Wangler, L.U. Renewables and innovation: Did policy induced structural change in the energy sector effect innovation in green technologies? J. Environ. Plan. Manag. 2013, 56, 211–237. [Google Scholar] [CrossRef]
- Rehfeld, K.; Rennings, K.; Ziegler, A. Integrated product policy and environmental product innovations: An empirical analysis. Ecol. Econ. 2007, 61, 91–100. [Google Scholar] [CrossRef]
- Veugelers, R. Which policy instruments to induce clean innovating? Res. Policy 2012, 41, 1770–1778. [Google Scholar] [CrossRef]
- Hojnik, J.; Ruzzier, M. What drives eco-innovation? A review of an emerging literature. Environ. Innov. Soc. Transit. 2016, 19, 31–41. [Google Scholar] [CrossRef]
- Keyuraphan, S.; Thanarak, P.; Ketjoy, N.; Rakwichian, W. Subsidy schemes of renewable energy policy for electricity generation in Thailand. Procedia Eng. 2012, 32, 440–448. [Google Scholar] [CrossRef]
- Nemet, G.F.; Baker, E. Demand subsidies versus R&D: Comparing the uncertain impacts of policy on a pre-commercial low-carbon energy technology. Energy J. 2009, 30, 49–80. [Google Scholar]
- Reichenbach, J.; Requate, T. Subsidies for renewable energies in the presence of learning effects and market power. Resour. Energy Econ. 2012, 34, 236–254. [Google Scholar] [CrossRef]
- Kalkuhl, M.; Edenhofer, O.; Lessmann, K. Renewable energy subsidies: Second-best policy or fatal aberration for mitigation? Resour. Energy Econ. 2013, 35, 217–234. [Google Scholar] [CrossRef]
- Frankfurt School FS-UNEP Collaboration Centre for Climate & Sustainable Energy Finance. Global Trends in Renewable Energy Investment 2016. Bloomberg New Energy Finance. Available online: http://fs-unep-centre.org/sites/default/files/publications/globaltrendsinrenewableenergyinvestment2016lowres_0.pdf (accessed on 16 June 2016).
- Zhao, H.R.; Guo, S.; Fu, L.W. Review on the costs and benefits of renewable energy power subsidy in China. Renew. Sustain. Energy Rev. 2014, 37, 538–549. [Google Scholar] [CrossRef]
- Chen, K.; Aizhu, C. China Raises Solar Installation Target for 2015 Reuters, 9 October 2015. Available online: http://planetark.org/wen/73748 (accessed on 9 September 2015).
- Wang, H.F. The status, problems and suggestions of PV Industry in China. Resour. Dev. Mar. 2013, 8, 840–843. [Google Scholar]
- World Bank Group. Climate Leadership in Action Carbon Pricing. Available online: http://www.worldbank.org/content/dam/Worldbank/document/Climate/climate2014-carbon-pricing-brief-091214.pdf (accessed on 9 December 2014).
- Schumpeter, J.A. Capitalism, Socialism and Democracy; Harper and Brothers: New York, NY, USA, 1942. [Google Scholar]
- Cohen, W.M. Fifty Years of Empirical Studies of Innovative Activity and Performance. Handb. Econ. Innov. 2010, 1, 129–213. [Google Scholar]
- Akcigit, U.; Kerr, W.R. Growth through Heterogeneous Innovations; Working Paper 16443; National Bureau of Economic Research: New York, NY, USA, 2010. [Google Scholar]
- Moffatt, J. Editorial: Scale and Innovation. Deloitte Review 15. 2014. Available online: https://dupress.deloitte.com/dup-us-en/deloitte-review/issue-15/scale-innovation.html (accessed on 4 October 2014).
- Jaffe, A.B.; Palmer, K. Environmental regulation and innovation: A panel data study. Rev. Econ. Stat. 1997, 79, 610–619. [Google Scholar] [CrossRef]
- Zhong, J.W.W. Research on the driving factors of renewable energy technology innovation based on SD model. J. Intell. 2012, 31, 32–36. [Google Scholar]
- Do Valle Costa, C.; La Rovere, E.; Assmann, D. Technological innovation policies to promote renewable energies: Lessons from the European experience for the Brazilian case. Renew. Sustain. Energy Rev. 2008, 12, 65–90. [Google Scholar] [CrossRef]
- Darmani, A.; Arvidsson, N.; Hidalgo, A.; Albors, J. What drives the development of renewable energy technologies? Toward a typology for the systemic drivers. Renew. Sustain. Energy Rev. 2014, 38, 834–847. [Google Scholar] [CrossRef]
- Gov. cn. Interim Measures on Renewable Energy Electricity Prices and Cost Sharing Management (NDRC Price[2006]7). Available online: http://www.gov.cn/ztzl/2006-01/20/content_165910.htm (accessed on 20 January 2006).
- Newenergy.in-en.com. Interim Measures on Revenue Allocation from Renewable Surcharges (NDRC price[2007]44). Available online: http://newenergy.in-en.com/html/newenergy-939715.shtml (accessed on 23 February 2011).
- Cantone, L.; Testa, P. The Outsourcing of Innovation Activities in Supply Chains with High-Intensity of Research and Development. Available online: http://esperienzedimpresa.it/index.php/espimpresa/article/viewFile/303/13 (accessed on 7 January 2018).
- Goschin, Z. Research and development intensity in Romania. A regional perspective. Procedia Econ. Financ. 2014, 15, 64–70. [Google Scholar] [CrossRef]
- Zeng, D.M.; Wang, H.L. A study of the impact of R&D intensity on dualistic innovation: Empirical evidence from automobile listed companies. Sci. Sci. Manag. S. T. 2016, 37, 69–79. (In Chinese) [Google Scholar]
- Nicholas, T. Scale and Innovation during Two U.S. Breakthrough Eras; Available online: http://www.hbs.edu/faculty/Publication%20Files/15-038_993f3dab-6812-443b-a0ec-8290ca3a4982.pdf (accessed on 7 January 2018).
- Mandel, M. Scale and Innovation in Today’s Economy. Available online: http://progressivepolicy.org/wp-content/uploads/2011/12/12.2011-Mandel_Scale-and-Innovation-in-Todays-Economy.pdf (accessed on 12 December 2011).
- Wang, L.T.; Cai, G.T.; Zhao, D.Q. Analysis of China’s renewable energy technology innovation based on patents. Sci. Technol. Manag. Res. 2015, 20, 161–165. (In Chinese) [Google Scholar]
- Guerzoni, M. The impact of market size and users’ sophistication on innovation: The patterns of demand. Econ. Innov. New Technol. 2010, 19, 113–126. [Google Scholar] [CrossRef]
- Samuelson, P.A. A Theory of Induced Innovation along Kennedy-Weizsacker Lines. Rev. Econ. Stat. 1965, 47, 343–356. [Google Scholar] [CrossRef]
- Fellner, W. Empirical Support for the Theory of Induced Innovation. Q. J. Econ. 1971, 85, 580–604. [Google Scholar] [CrossRef]
- Ouyang, X.L.; Lin, B.Q. Levelized cost of electricity (LCOE) of renewable energies and required subsidies in China. Energy Policy 2014, 70, 64–73. [Google Scholar] [CrossRef]
- Arellano, M.; Bond, S. Some tests of specification for panel data: Monte Carlo evidence and application to employment equations. Rev. Econ. Stud. 1991, 58, 277–297. [Google Scholar] [CrossRef]
- Blundell, R.; Bond, S. Initial conditions and moment restrictions in dynamic panel data models. J. Econ. 1998, 87, 115–143. [Google Scholar] [CrossRef]
- Bruno, G. Approximating the bias of the LSDV estimator for dynamic unbalanced panel data models. Econ. Lett. 2005, 87, 361–366. [Google Scholar] [CrossRef]
- Griliches, Z. Patent Statistics as Economic Indicators: A Survey; Part I. NBER Working Paper Series, No. 3301; March; University of Chicago Press: Chicago, IL, USA, 1990. [Google Scholar]
- Bresman, J.; Birkinshaw, J.; Nobel, R. Knowledge transfer in international acquisitions. J. Int. Bus. Stud. 1999, 30, 439–462. [Google Scholar] [CrossRef]
- Dernis, H.; Guellec, D. Using Patent Counts for Cross-Country Comparisons of Technology Output; STI Mimeo, Organisation for Economic Co-operation and Development: Paris, France, 2011; Available online: http://www.oecd.org/dataoecd/26/11/21682515.pdf (accessed on 12 December 2011).
- Dernis, H.; Kahn, M. Triadic Patent Families Methodology; STI Working Paper 2004/2; Organisation for Economic Co-Operation and Development: Paris, France, 2004. [Google Scholar]
- Shen, J.F.; Luo, C. Overall review of renewable energy subsidy policies in China—Contradictions of intentions and effects. Renew. Sustain. Energy Rev. 2015, 41, 1478–1488. [Google Scholar] [CrossRef]
- Zhang, H.; Zheng, Y.; Ozturk, U.A.; Li, S. The impacts of subsidies on overcapacity: A comparison of wind and solar energy companies in China. Energy 2016, 94, 821–827. [Google Scholar] [CrossRef]
- Al-Amir, J.; Abu-Hijleh, B. Strategies and policies from promoting the use of renewable energy resources in the UAE. Renew. Sustain. Energy Rev. 2013, 26, 660–667. [Google Scholar] [CrossRef]
- International Science Panel on Renewable Energies. Research and Development on Renewable Energies: A Global Report on Photovoltaic and Wind Energy. Available online: http://www.icsu.org/publications/reports-and-reviews/ispre-photovoltaic-wind/ISPRE_Photovoltaic_and_Wind.pdf (accessed on 12 December 2009).
- Inoue, Y.; Miyazaki, K. Technological innovation and diffusion of wind power in Japan. Technol. Forecast. Soc. Chang. 2008, 75, 1303–1323. [Google Scholar] [CrossRef]
- Lin, B.Q.; He, J.X. Learning curves for harnessing biomass power: What could explain the reduction of its cost during the expansion of China? Renew. Energy 2016, 99, 280–288. [Google Scholar] [CrossRef]
- Von Hippel, E. The dominant role of users in the scientific instrument innovation process. Res. Policy 1976, 5, 212–239. [Google Scholar] [CrossRef]
- Scherer, F.M.; Harhoff, D. Technology policy for a world of skew-distributed outcomes. Res. Policy 2000, 29, 559–566. [Google Scholar] [CrossRef]
- Popp, D. International innovation and diffusion of air pollution control technologies: The effects of NOX and SO2 regulation in the U.S.; Japan, and Germany. J. Environ. Econ. Manag. 2006, 51, 46–71. [Google Scholar] [CrossRef]
- Dillig, M.; Jung, M.; Karl, J. The impact of renewables on electricity prices in Germany-An estimation based on historic spot prices in the years 2011–2013. Renew. Sustain. Energy Rev. 2016, 57, 7–15. [Google Scholar] [CrossRef]
- Carley, S. State renewable energy electricity policies: An empirical evaluation of effectiveness. Energy Policy 2009, 37, 3071–3081. [Google Scholar] [CrossRef]
- The New Installed Power-Generating Capacity of Wind Power of 2015 Reached 32.97GW in China. Available online: http://gb.cri.cn/42071/2014/02/25/6071s4437467.htm (accessed on 25 February 2014).
- Total Generation Capacity of 2015 Decreased by 0.2% to 5618.4TWH in China. Available online: http://shcce.com/news/30175/49135.html (accessed on 19 January 2016).
- Zeng, M.; Liu, X.M.; Li, N.; Xue, S. Overall overview of renewable energy tariff policy in China: Evolution, implementation, problems and countermeasures. Renew. Sustain. Energy Rev. 2013, 25, 260–271. [Google Scholar]
- National Energy Administration Website. Renewable Energy: Heavy Subsidies. Available online: http://www.nea.gov.cn/2011-09/19/c_131146166.htm (accessed on 19 September 2011).
- The Cost of Solar Photovoltaic Module Fell, and Enterprises Want to Get Rid of Dependence on Subsidies. Available online: http://www.ocpe.com.cn/show-27672-lists-4.html (accessed on 25 October 2016).
- Xiong, Y.Q.; Yang, X.H. Government subsidies for the Chinese photovoltaic industry. Energy Policy 2016, 99, 111–119. [Google Scholar] [CrossRef]
- Yu, F.; Guo, Y.; Le-Nguyen, K.; Barnes, S.J.; Zhang, W. The impact of government subsidies and enterprise’ R&D investment: A panel data study from renewable energy in China. Energy Policy 2016, 89, 106–113. [Google Scholar]
- Miller, B.; Atkinson, R.D. Rising Tigers, Sleeping Giant II: Asian Nations Outpacing the United States in Clean Energy. July 2015 Information Technology and Innovation Foundation. Center for Clean Energy Innovation. Page 1 to page 14. Available online: http://www2.itif.org/2015-rising-tigers-sleeping-giant.pdf (accessed on 12 July 2015).
- Stokes, L.C. The politics of renewable energy policies: The case of feed-in tariffs in Ontario, Canada. Energy Policy 2013, 56, 490–500. [Google Scholar] [CrossRef]
- Clausen, T.; Pohjola, M.; Sapprasert, K.; Verspagen, B. Innovation strategies as a source of persistent innovation. Ind. Corp. Chang. 2011, 21, 553–585. [Google Scholar] [CrossRef]
- Verona, G. A resource-based view of product development. Acad. Manag. Rev. 1999, 24, 132–142. [Google Scholar]
- Costantini, V.; Crespi, F.; Martini, C.; Pennacchio, L. Demand-pull and technology-push public support for eco-innovation: The case of the biofuels sector. Res. Policy 2015, 44, 577–595. [Google Scholar] [CrossRef]
- Suikun, W.; Jiwei, H. Research on the relationship of government funding, tax policy and technological innovation—Based on growth enterprise market empirical evidence. Sci. Technol. Prog. Policy 2014, 5, 92–96. [Google Scholar]
- Mao, Q.L.; Xu, J.Y. The effect of government subsidy on firms’ new product innovation—An analysis based on the moderate interval of subsidy intensity. China Ind. Econ. 2015, 6, 95–107. [Google Scholar]
- China’s Growth in Renewable Energy Raises “Overcapacity” Concerns: IEA. 25 October 2016. Available online: http://www.marketwatch.com/story/chinas-growth-in-renewable-energy-raises-overcapacity-concerns-iea- (accessed on 25 October 2016).
- International Energy Agency. Energy Technology Perspectives; International Energy Agency: Paris, France, 2014. [Google Scholar]
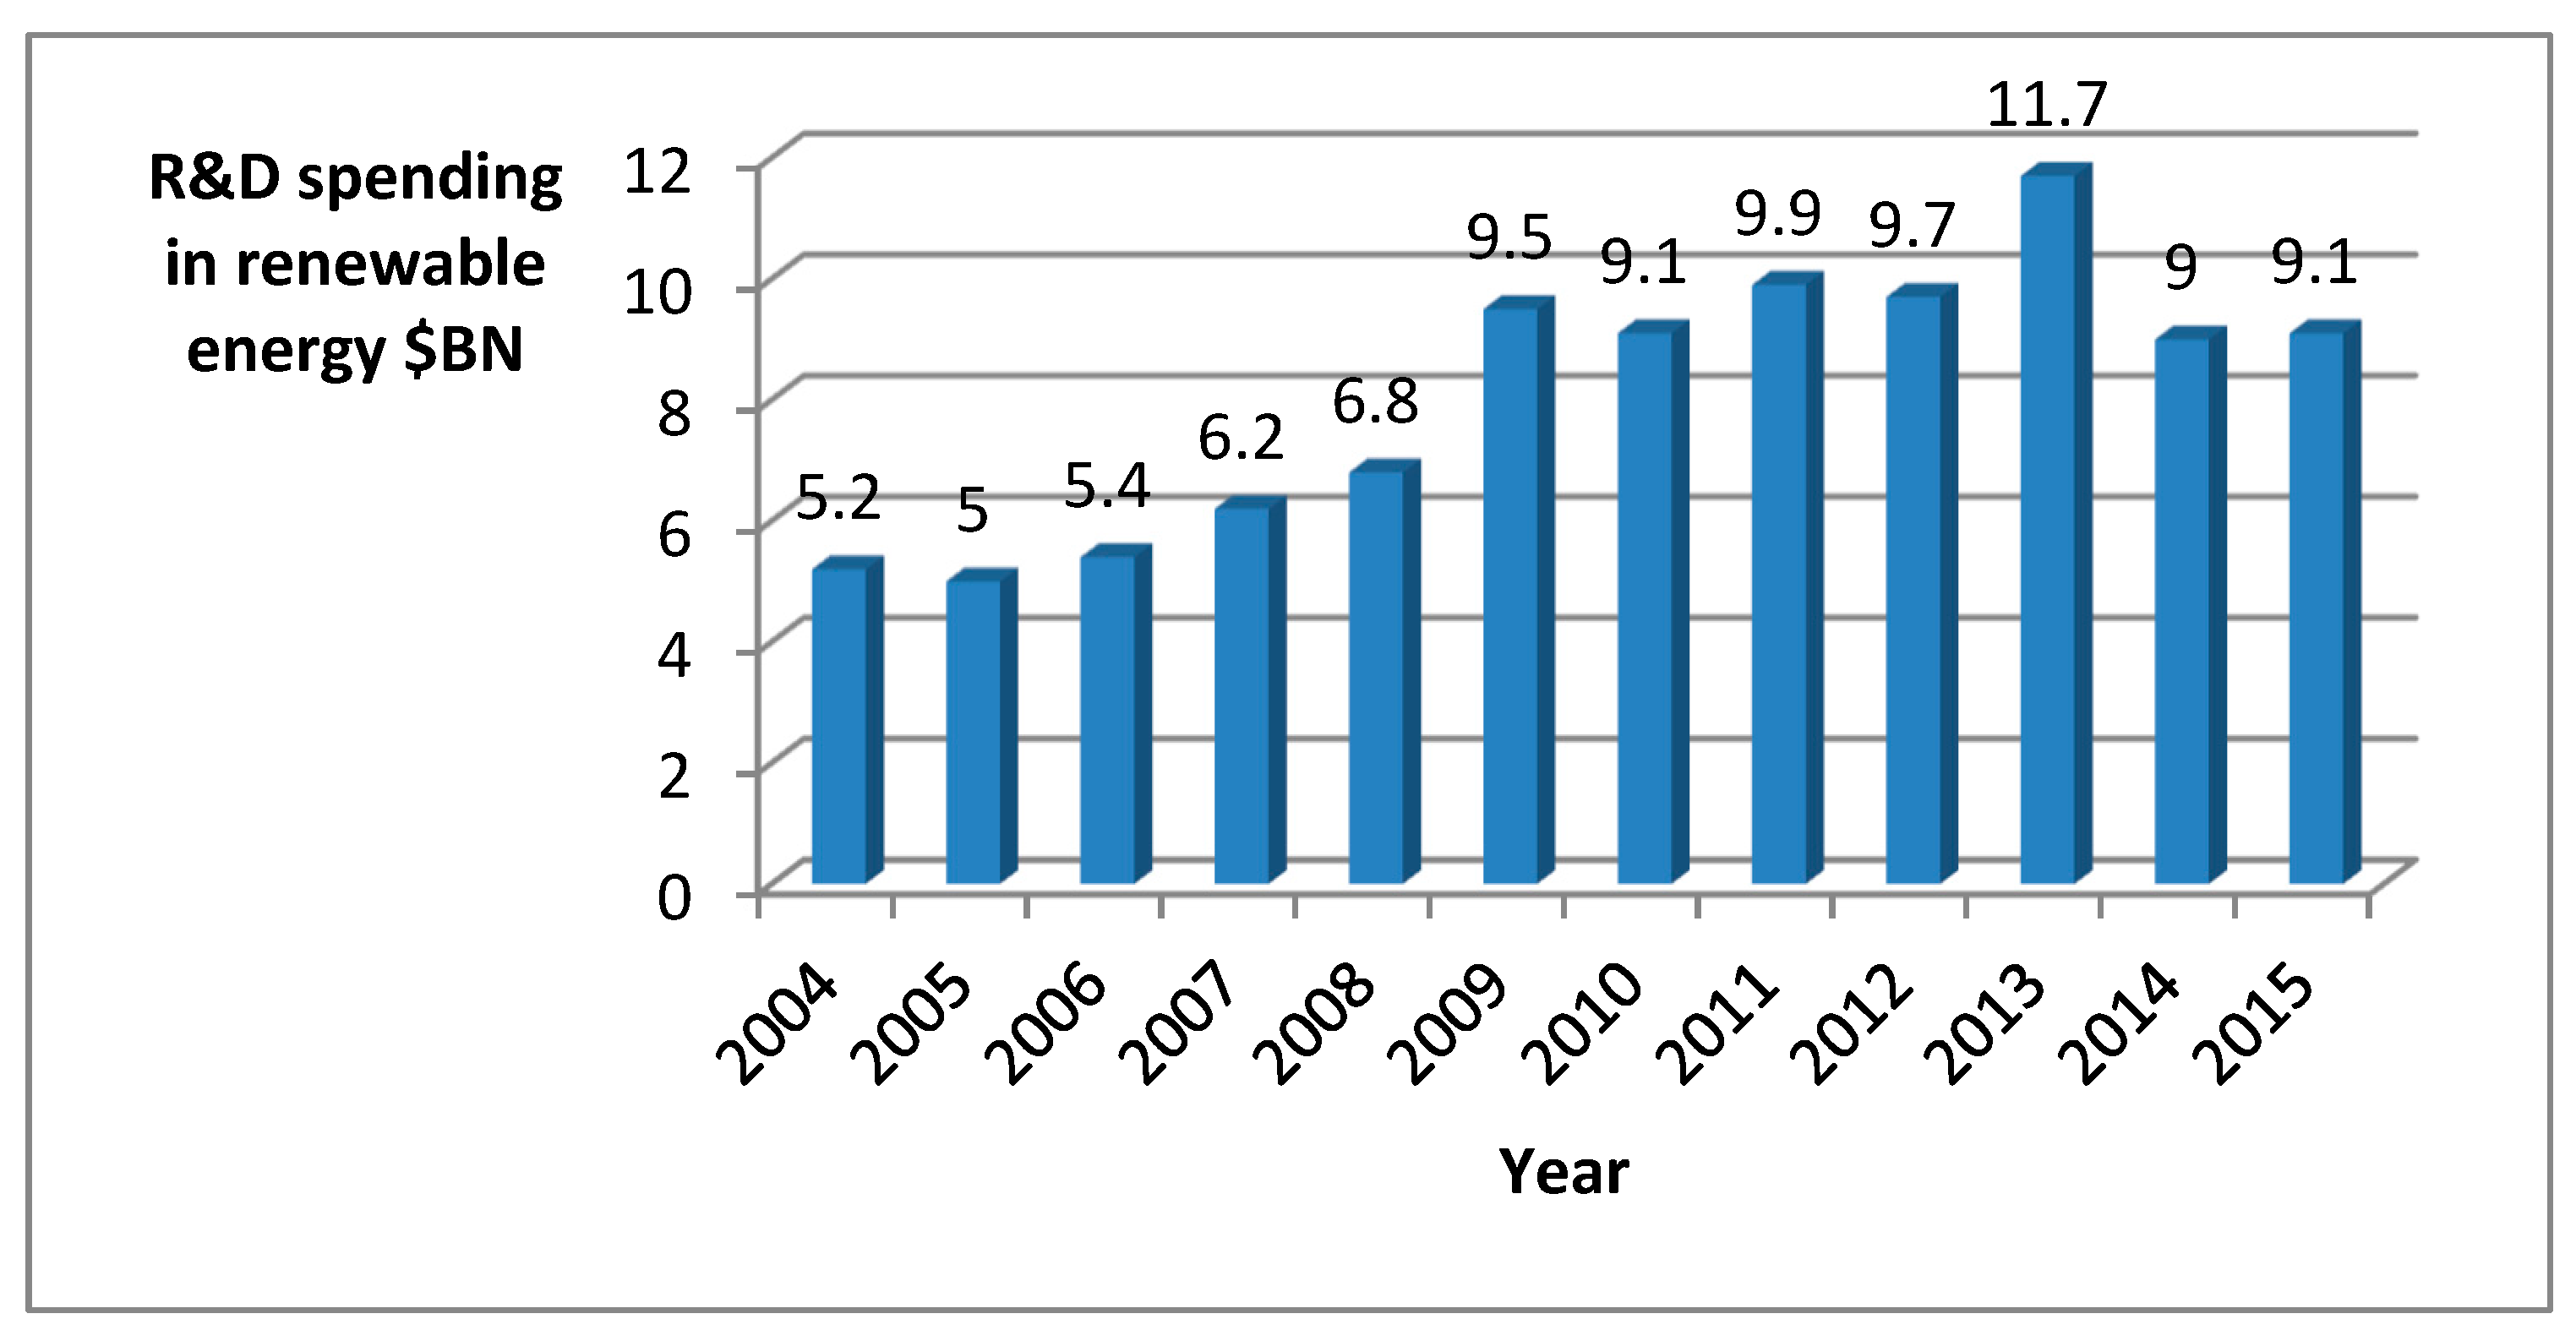
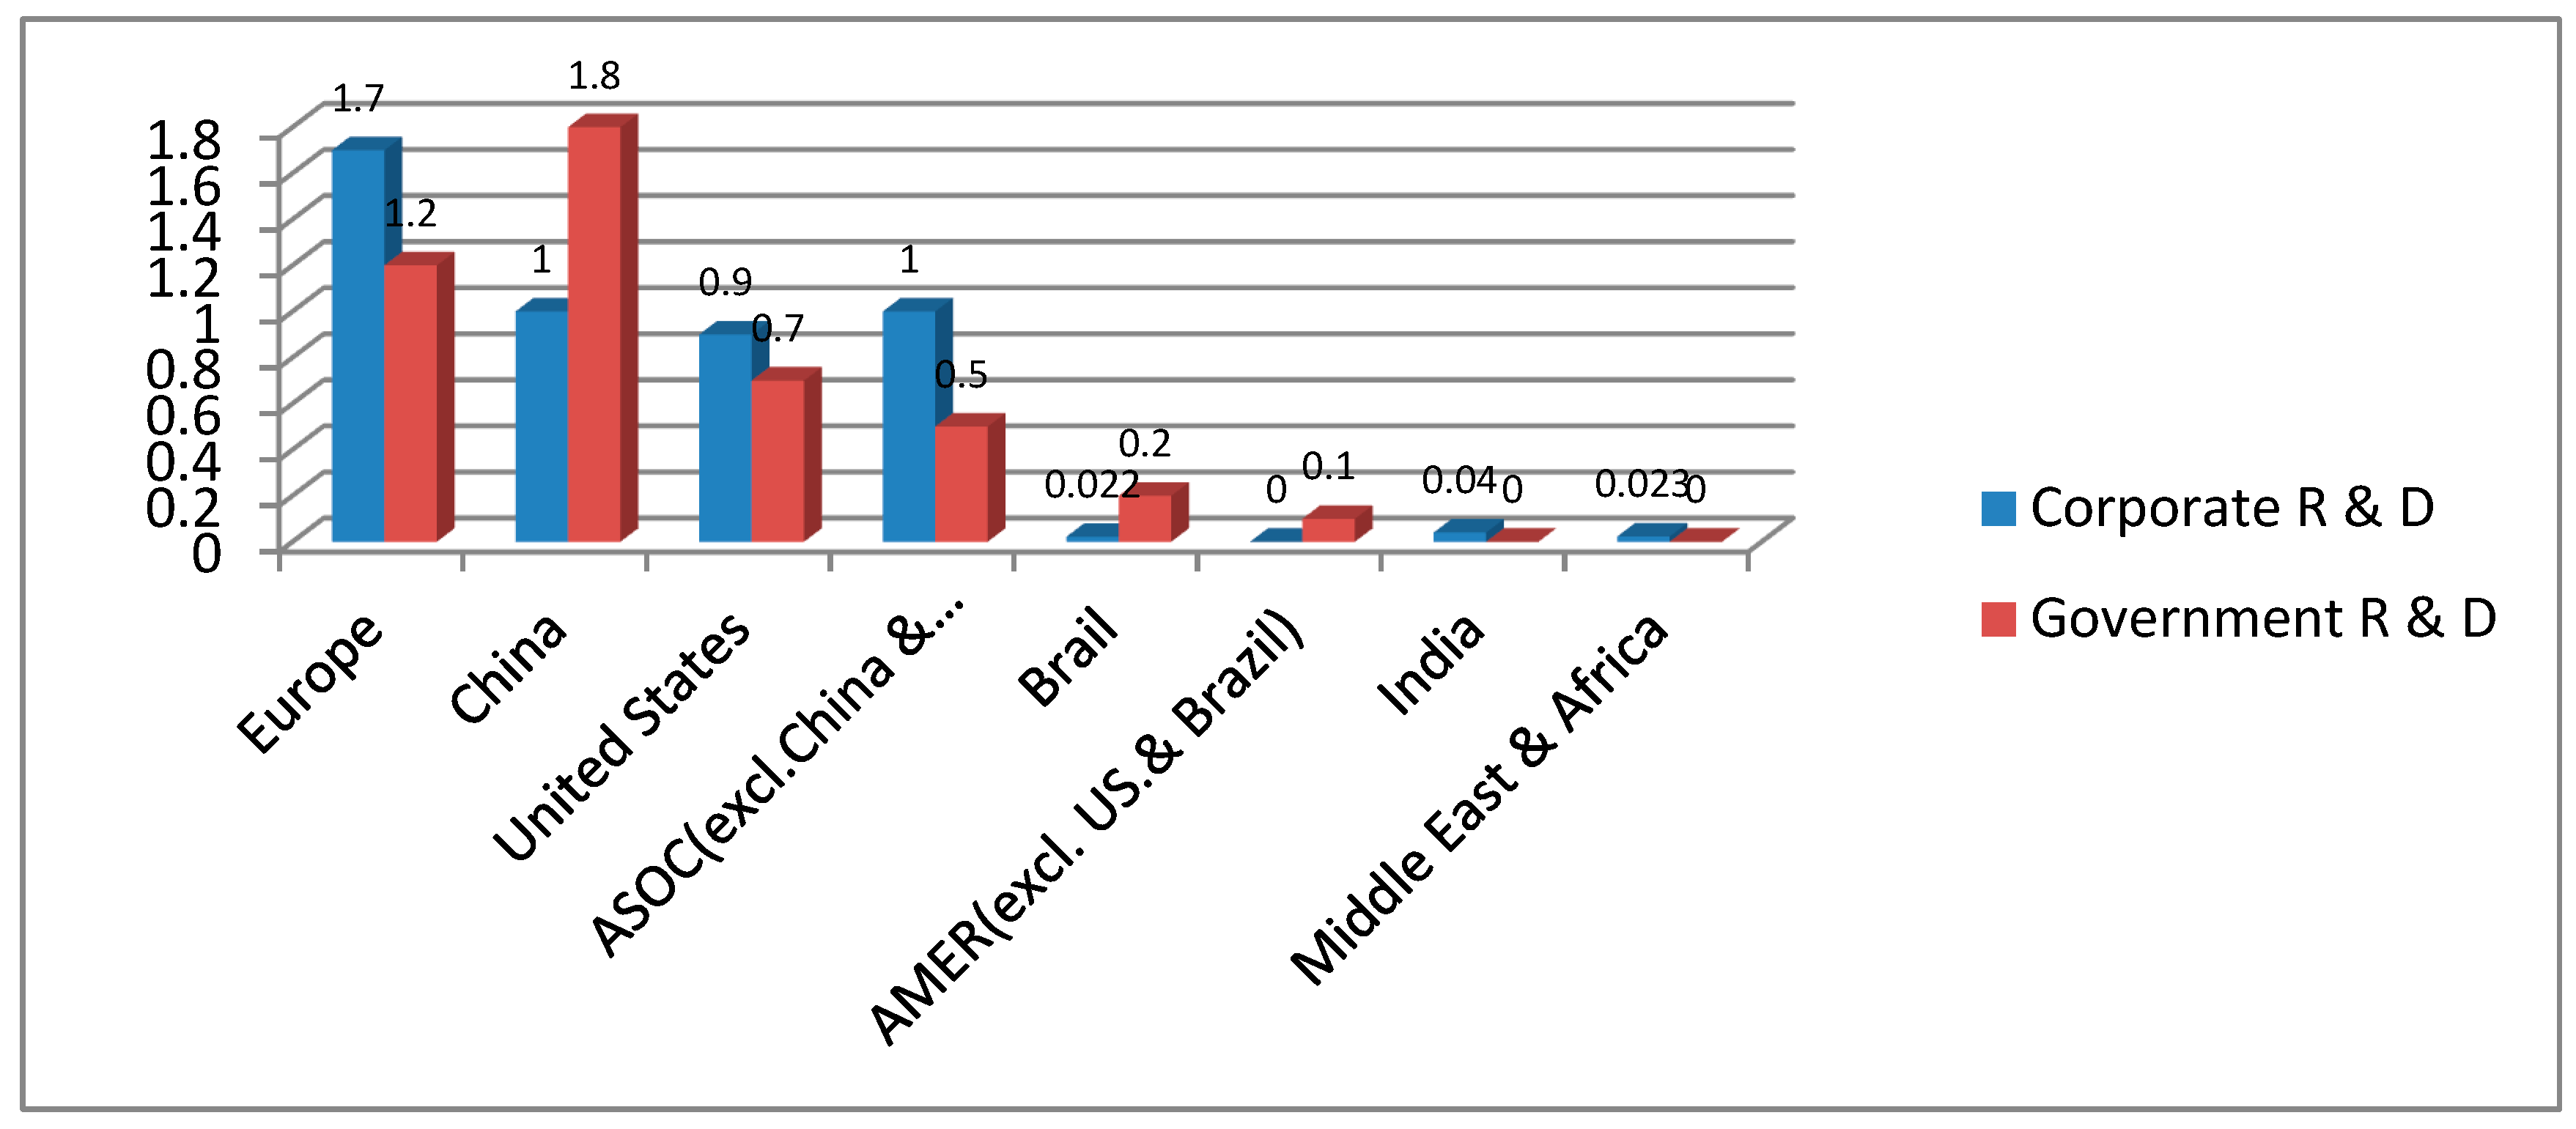
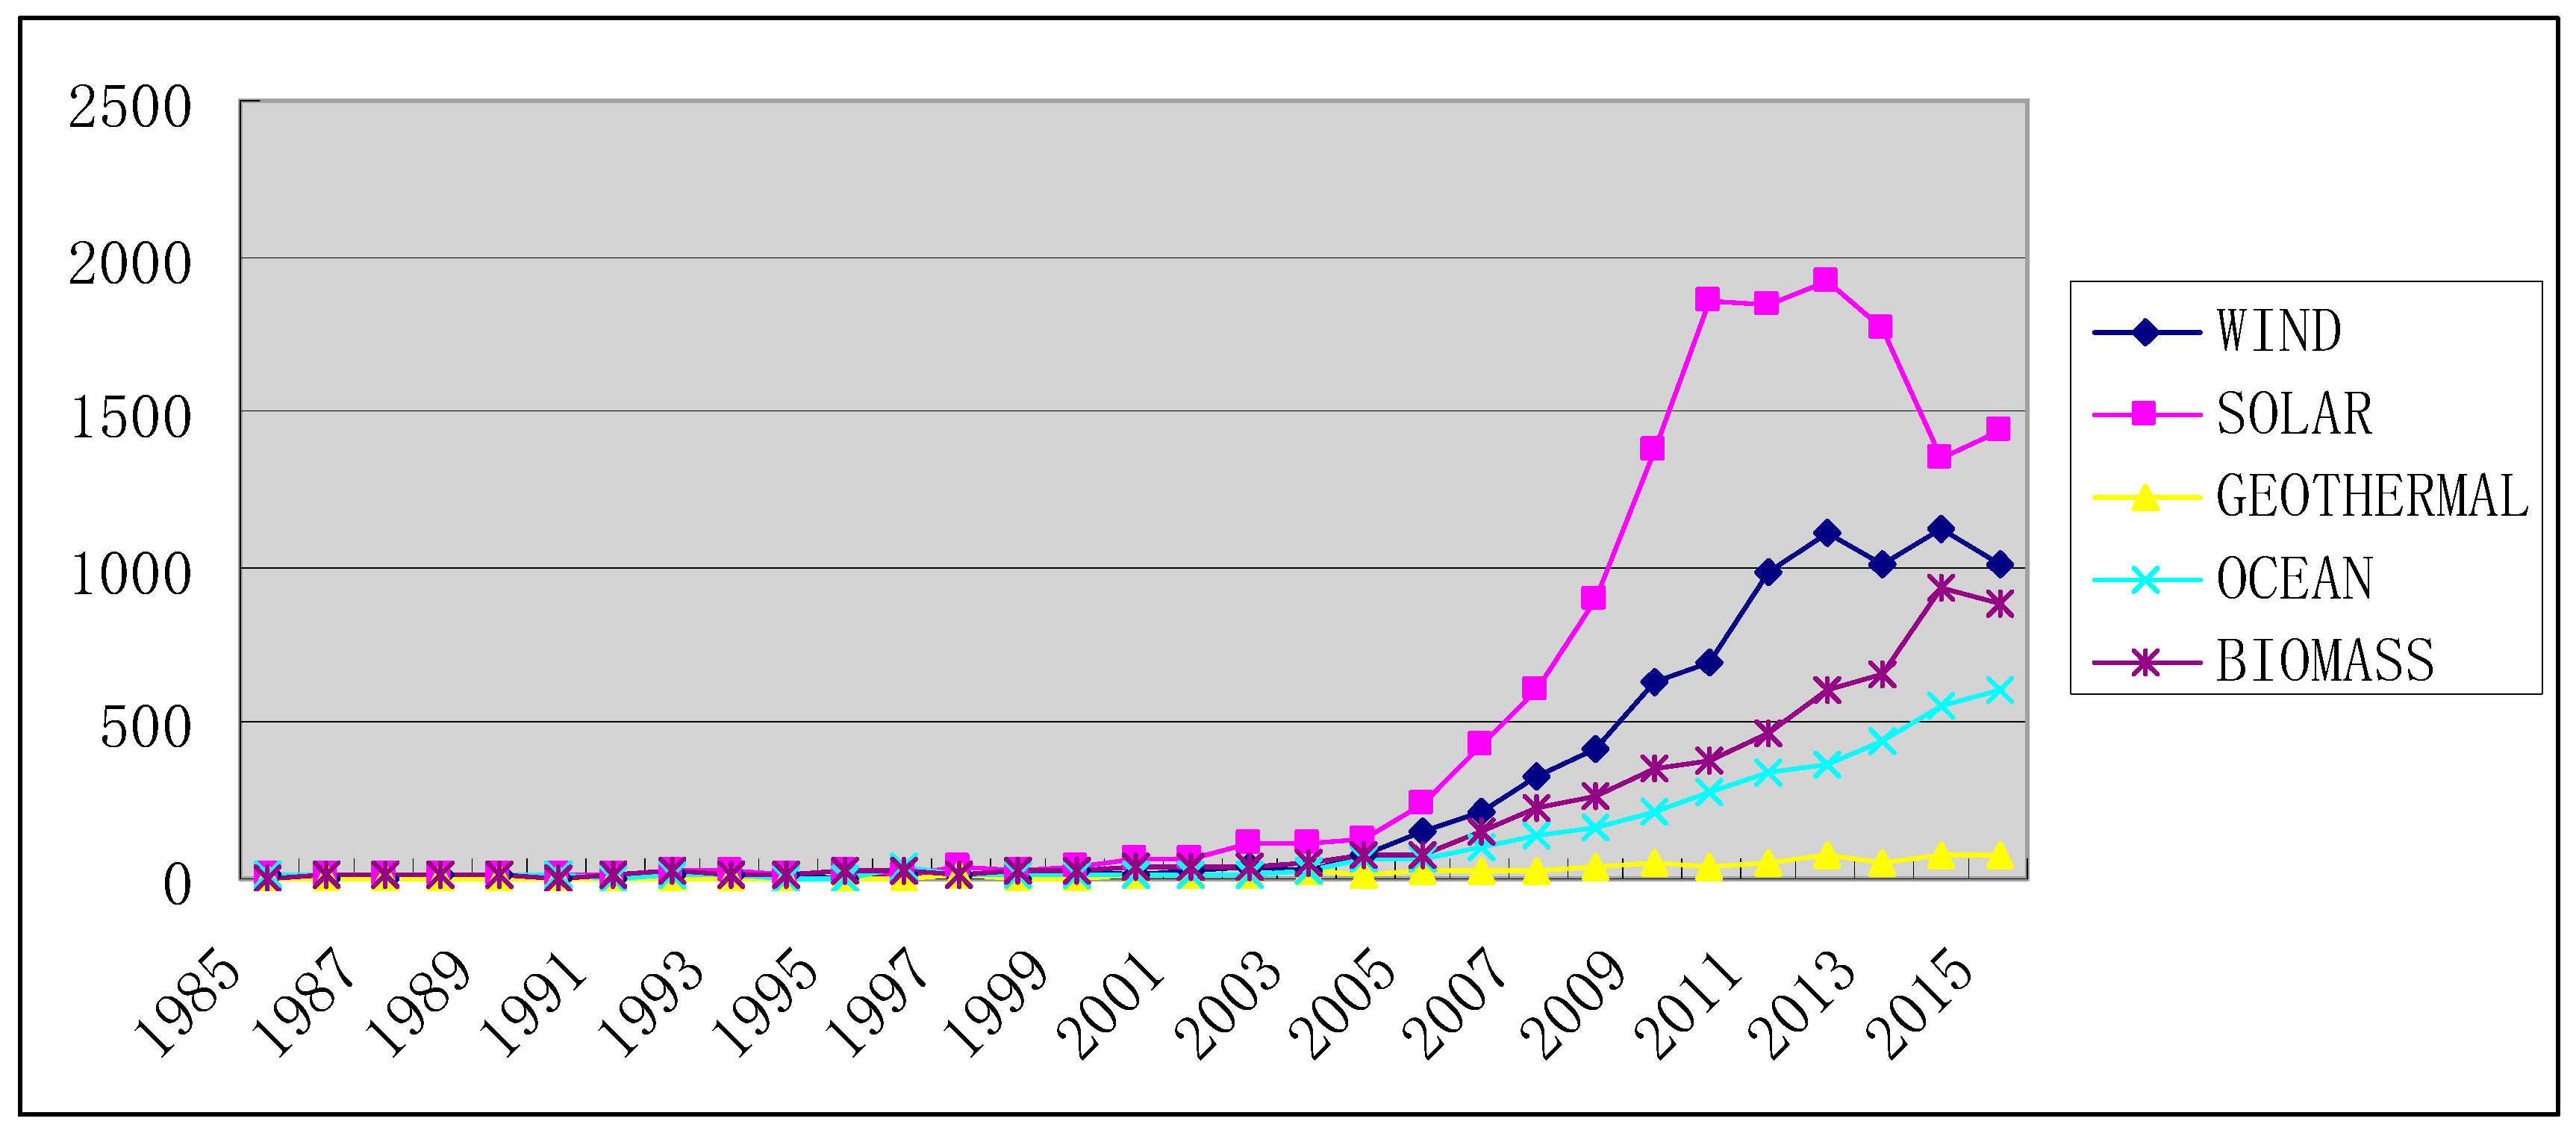


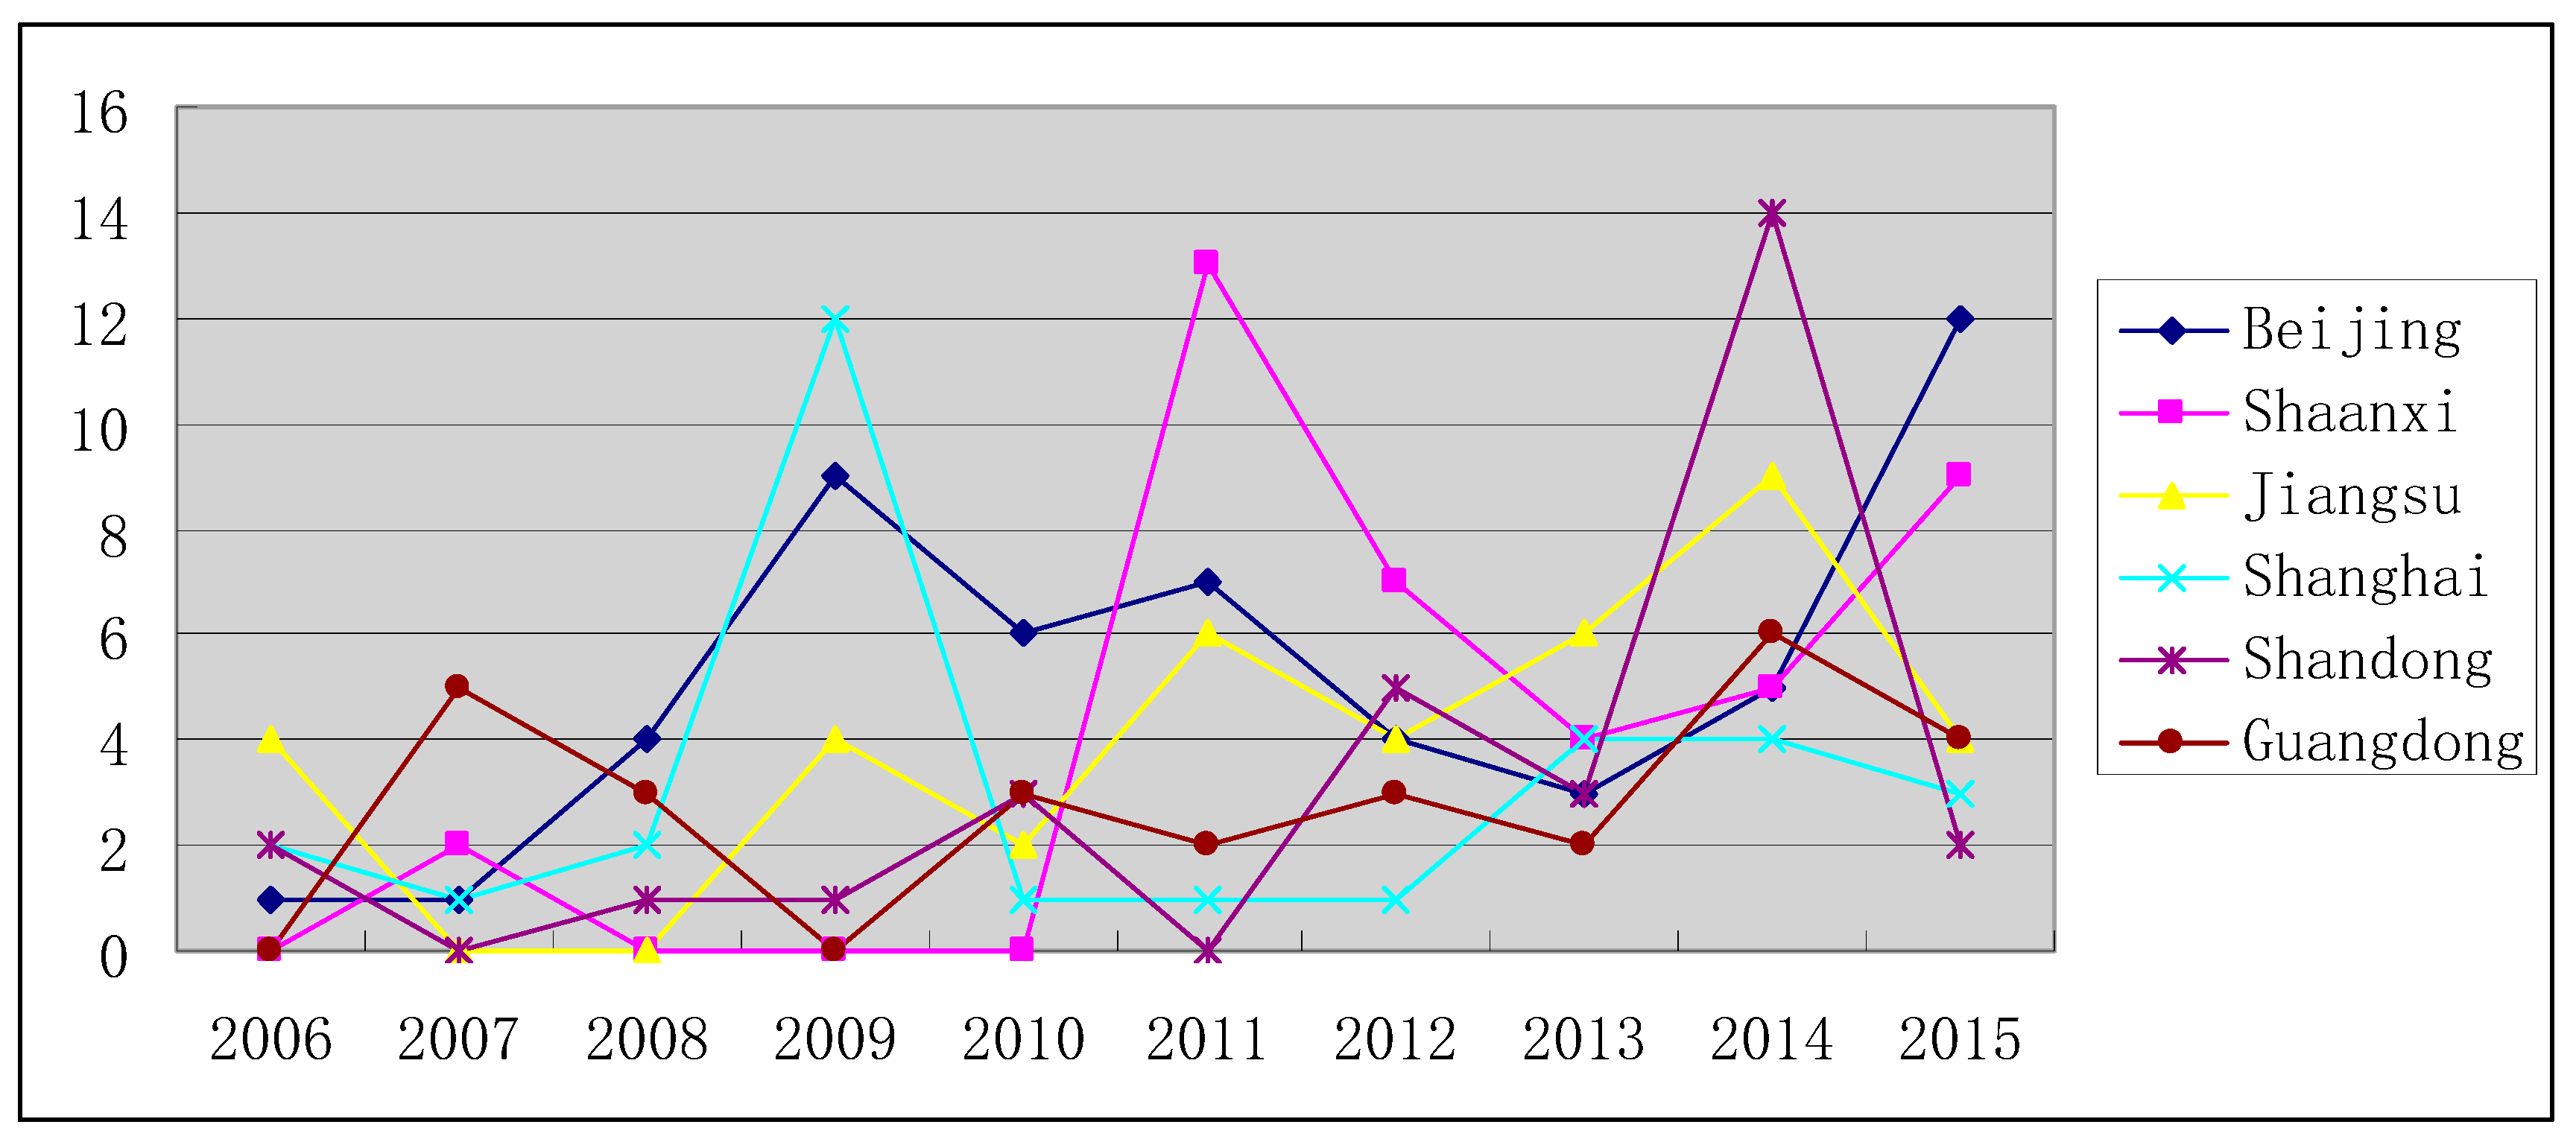
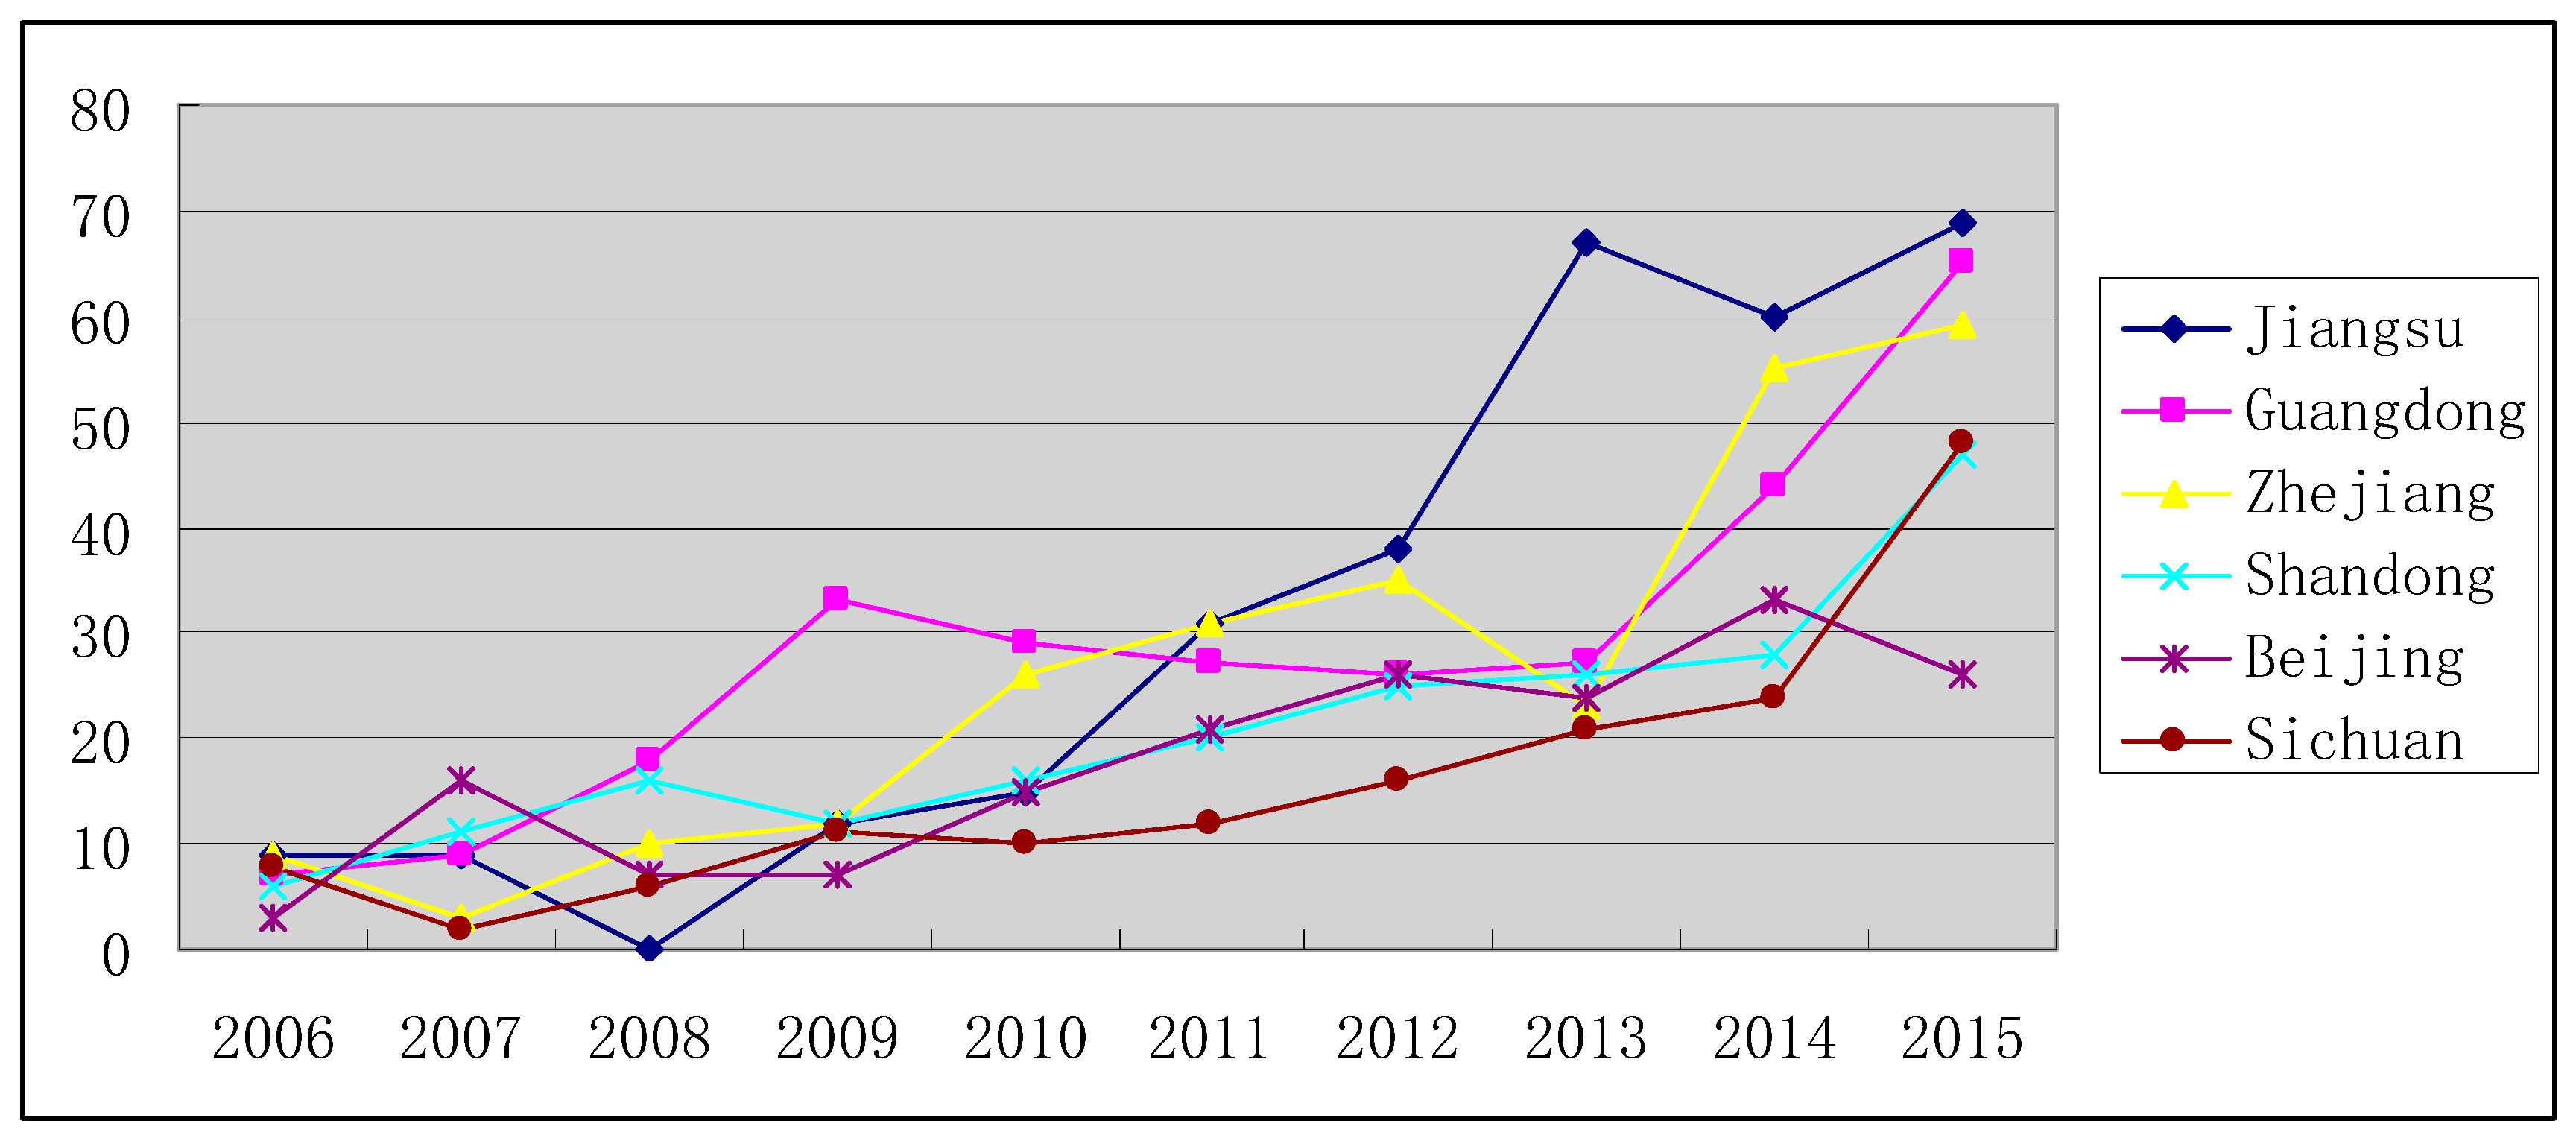
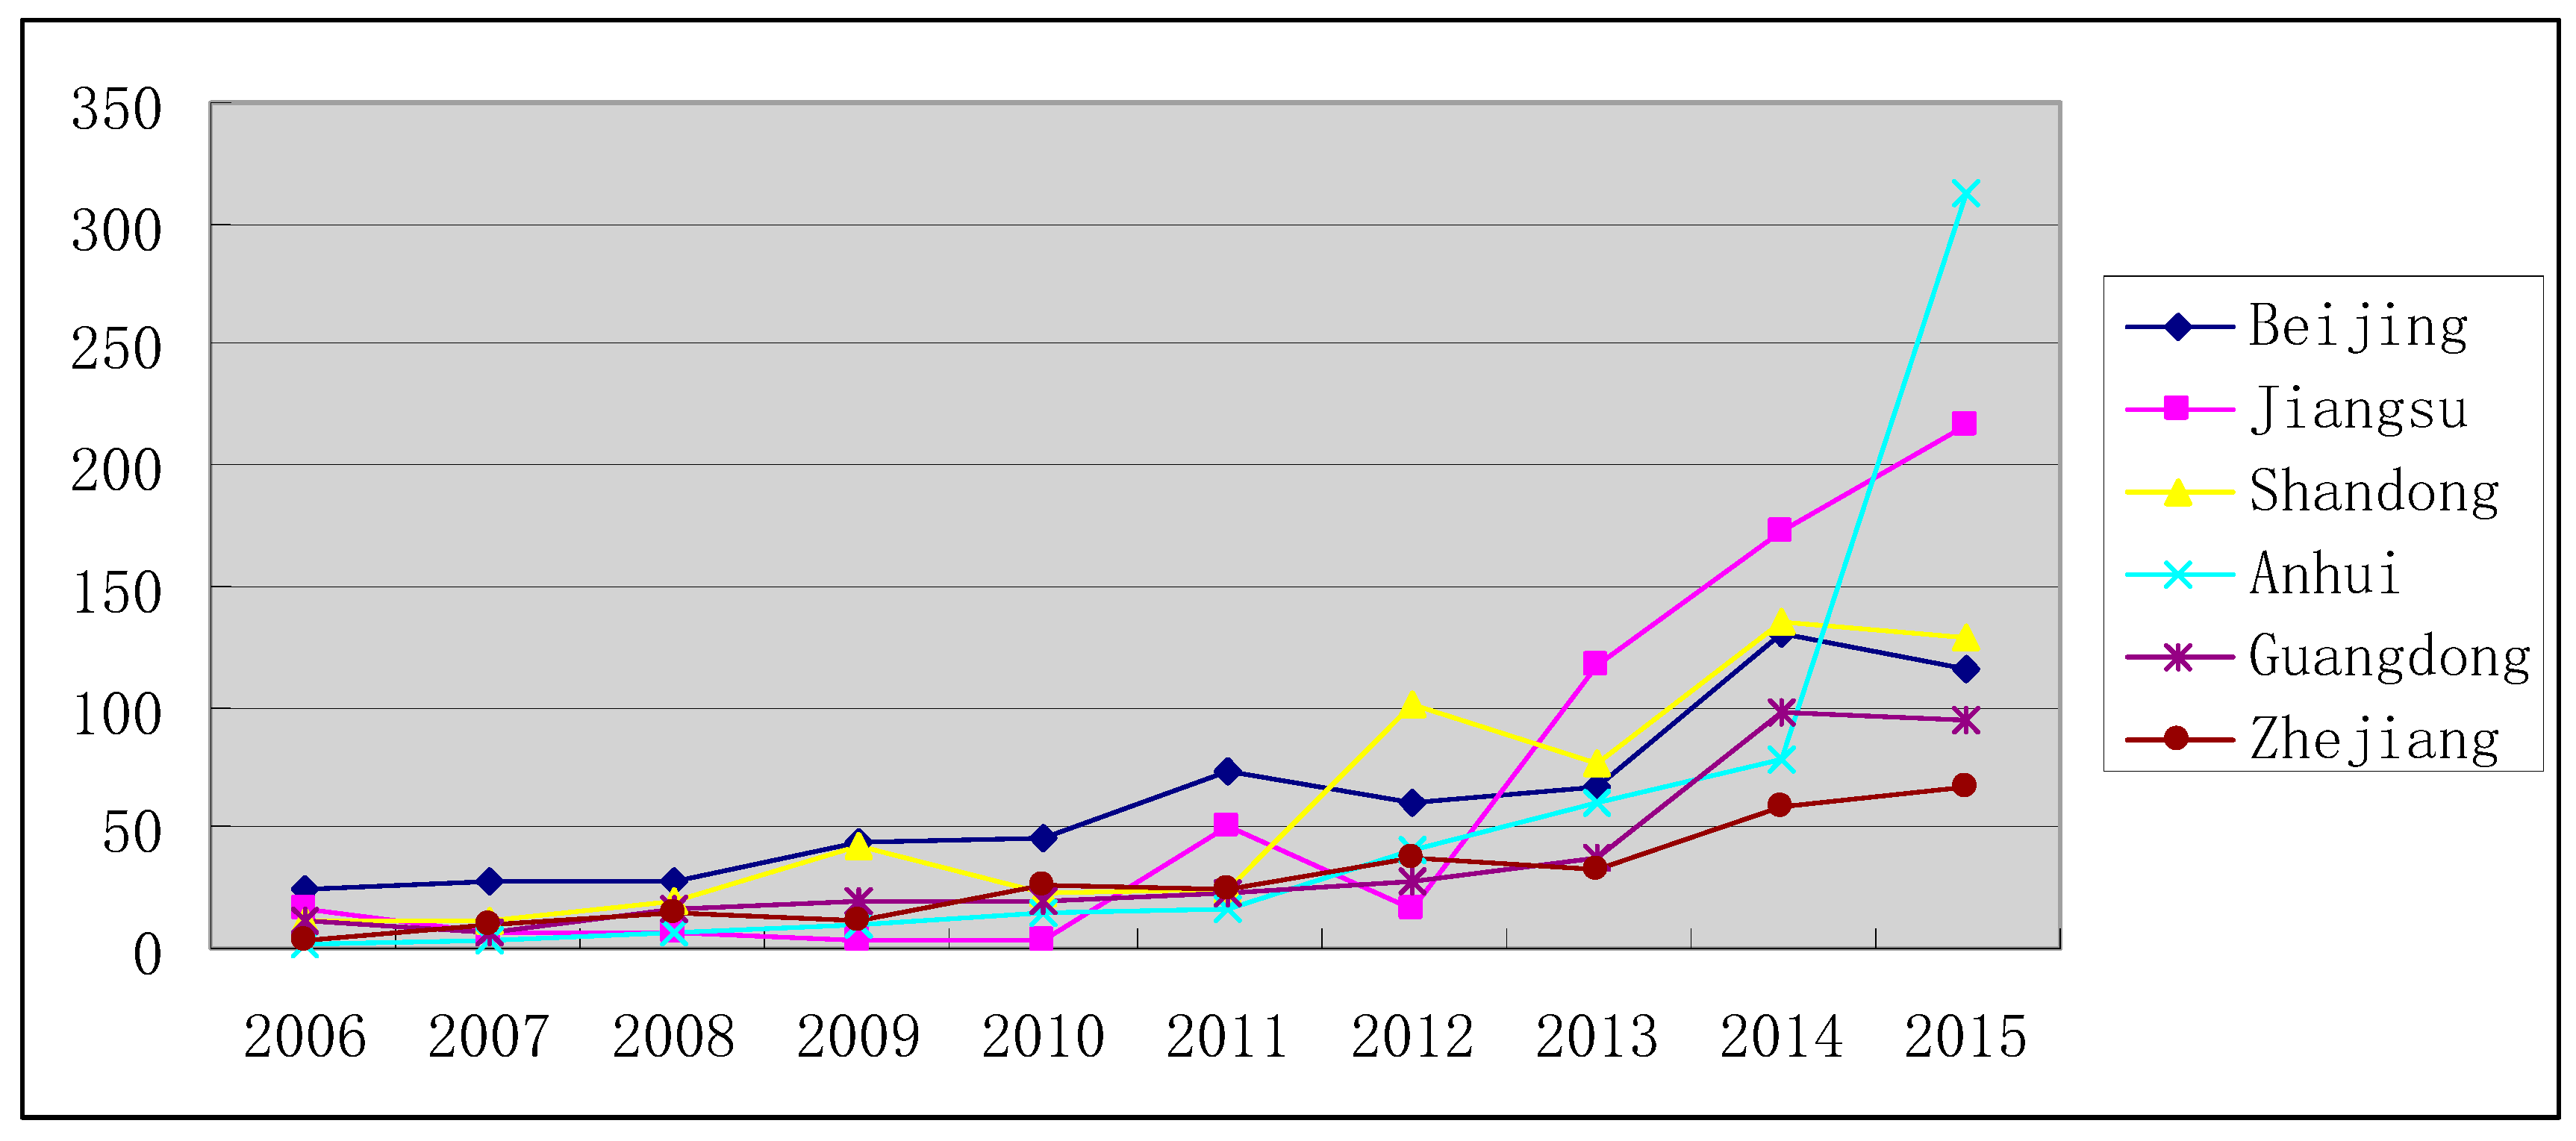
© 2018 by the authors. Licensee MDPI, Basel, Switzerland. This article is an open access article distributed under the terms and conditions of the Creative Commons Attribution (CC BY) license (http://creativecommons.org/licenses/by/4.0/).