Abstract
Trentino (an Italian Province located in the northern part of the country) is equipped with a management system of municipal solid waste collection at the forefront. Among the most positive aspects, there is a great ability for waste separation at the source and a consequent low production of residual municipal solid waste for disposal. Latest data show a gross efficiency of selective collection that has recently reached 80%, one of the highest values in Italy. This study analyzed the “Trentino system” to identify the main elements that have been at the base of the current efficient model. This provided an opportunity to propose a selective collection quality index (SCQI), including collection efficiency for each fraction, method of collection, quality of the collected materials, presence of the punctual tariff and tourist incidence. A period relevant for the transition of the collection system to the recent one was chosen for the demonstrative adoption of the proposed indicators in order to determine the potential of the index adoption. Results of the analysis of this case study were obtained in a quantitative form thanks to the sub-parameters that characterize the proposed index. This allowed selected collection decision makers to focus intently on a territory to find criticalities to be solved. For instance, the use of the index and its sub-indicators in the case of Trentino identified and comparatively quantified the local problems resulting from the presence of a large museum in a small town, tourism peaks in some valleys, and a delay in the punctual tariff adoption. The index has been proposed with the aim to make available an integrated tool to analyze other areas in Italy and abroad.
1. Introduction
In Europe, the framework of waste management in various countries is very different, but it is interesting to note a common profile related to areas climatically homogeneous and traditionally similar in cultural habits. For example, the use of landfills is predominant, especially in the countries of southern Europe. In Greece and Romania, the amount of waste disposed of in landfills exceeds 80%, and in Spain and Italy, their role remains significant [1,2,3,4,5]. In the countries of northern Europe, instead, incineration prevails, except in Finland and England [6,7,8,9,10,11,12]. Countries with a “cold climate” require large amounts of thermal energy for most of the year and are oriented towards a waste management model that encourages recovery of their energy content. The production of fuels and/or biofuels from municipal solid waste (MSW) has become very important in European Union (EU) countries [13,14,15,16,17,18]. In this framework, there is an option that is always considered strategic: selective collection (SC) [19]. Starting from this assumption, the Province of Trento (Italy) is performing an integrated waste management system taking into account the circular economy view regarding the recovery of material and energy and defining strategic policies in order to achieve the following targets:
- a decrease in the total amount of MSW even considering the population growth; this goal involves the constant reduction of MSW per capita generation;
- definition of specific yields of selective collection (SC) for each fraction of waste: these yields integrate the average percentage of recycling (%SC) typically adopted for characterizing the sector;
- definition of a threshold of residual waste (RMSW) as a result of the combination of the reduction of the total production of waste and the achievement of the goals of SC.
To understand the distinctive features of the system in the Province of Trento and to identify the elements that can be improved, indicators have been studied and aggregated into a specific index; their evolution over time highlights the qualitative evolution of the waste management system. This approach ensures the correct implementation of all the helpful steps suitable to provide the full effect of the principles imposed by law.
2. Municipal Waste Management in the Case Study
2.1. Organization Criteria
The implementation of the strategies established by local planning has led to a reorganization of SC that has grown steadily. In the last decades, SC in the Province of Trento has increased from 21% in 2002 to more than 80% today [20]. This also depends on the transition to the method of the punctual tariff extended to all collection areas. A punctual tariff means that a user pays depending on their MSW production; in the case study, that depends specifically on the RMSW produced by each user. In this regard, the resident inhabitants (RES) can be calculated based on the public registration data. The equivalent population (EQ) considers, besides the resident inhabitants, the number of tourists annually derived from the records of hotel businesses and similar activities, and the number of second homes. The total of the Province of Trento was EQ 609,163 in 2012 and EQ 621,512 in 2016, with an EQ/RES ratio of around 1.15 in both cases.
The total production of MSW in the Province of Trento has remained steady over the last decade. Faced with an increase in the equivalent population of a few percentage points, the primary strategic objective of waste reduction has been reached. However, unexpected “help” to reach this target came from the economic crisis of the last decade that reduced the consumption of families.
In 2012, the total MSW production (270,200 t including street sweeping waste) marked the most significant yearly reduction (−9950 t), decreasing to a per capita MSW production value of 442 kg eq-inh−1 year−1 [21]. In 2016, this value reached 427 kg eq-inh−1 year−1, confirming the trend to a reduced amount of MSW [21].
In Figure 1, the composition of MSW from the point of view of SC and RMSW is presented with reference to 2016 [21]. The pie allows checking the role of each fraction in the frame of SC: food waste and cellulosic materials play the most important roles in source-separated streams.
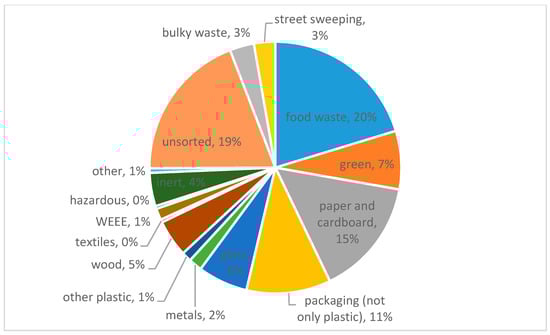
Figure 1.
MSW composition (SC view) in the Province of Trento (2016).
The residual municipal solid waste (RMSW) decreased from 216,400 t/year in 2002, to 73,800 t/year in 2012, to 59,400 t/year in 2016.
The production of per capita RMSW decreased from 388.9 kg eq-inh−1 year−1 in 2002 to 121.3 kg eq-inh−1 year−1 in 2012, to 95.4 kg eq-inh−1 year−1 in 2016 (with EQ/RES not increasing in that period), demonstrating a clear change of behavior among the citizens.
The dynamics of SC and RMSW in the last decade are reported in Figure 2, showing high values of SC already reached 10 years ago [21].
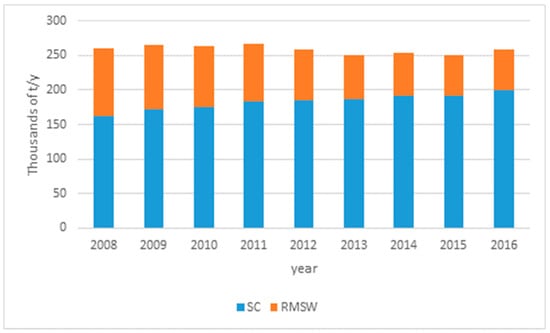
Figure 2.
Dynamics of RMSW and SC in the Province of Trento.
2.2. Financial Aspects
The Italian national regulation states that the administrative and management functions related to waste management are given to municipalities that must apply a specific tariff to users. The tariff must cover all the costs related to the collection service, including administrative costs (i.e., amortization of investments), following the principle of “the polluter pays”. The tariff is structured in two parts: a fixed part to cover the fixed costs and a variable part applied to variable costs. The “polluter pays” principle is applied, usually, evaluating the variable part of the fee in relation to the amount of waste considered “pollutant”, that is to be disposed of (unsorted waste). This is not the unique approach adopted in Italy: in some cases, a reverse mechanism is used to reward the source separation of recyclable materials. In both cases, the method of collection is performed to enable the “punctual” measurement of waste streams and to identify the user who delivers it to the collection service. The adoption of a tariff with an accurate measurement of unsorted MSW produced by the user (UNS) quickly leads to a substantial reduction of the quantity of unsorted MSW. Of course, the quality of SC must be guaranteed by an adequate system of punctual control. In spite of that, in the Province of Trento, the decrease of unsorted MSW corresponded to an increase in scrap in the SC, indicating errors in separation by users and a few attempts to circumvent the system of punctual charging.
3. Materials and Methods
3.1. Percentage of SC
The percentage of selective collection (%SC) is the main indicator used in the sector. The percentage of SC is defined by the ratio:
%SC = (Σi SCi/MSWTOT) × 100
In the classic version, the numerator (SC) is given by the sum of all municipal waste separately collected, while the denominator is the total of the collected municipal waste. MSWTOT is the sum of SC and RMSW (separately collected waste + unsorted waste, bulky and street sweeping waste).
The %SC is often mistakenly identified as the level of waste recovery downstream of all treatments. Of course, collection is not equal to recovery. There are, at least, three waste streams demonstrating that, because they follow final disposal paths at the end of the plant chain:
- ➢
- municipal hazardous waste: even separately collected, this is largely intended for disposal;
- ➢
- impurities collected;
- ➢
- scraps from the treatment chain.
Therefore, the percentage of waste effectively recovered is less than the %SC, and the results must clearly point out differences.
3.2. Effect of Main Parameters on SC Calculation
Data at the yearly level can be used to carry out an SC calculation analysis. We identified four levels of the “purity” of the collection (A, B, C, D), and we used five models of SC calculation (C1…C5):
- use waste collection data as officially announced by the General Managers of the Province (“original data”)
- distribute the multi-material collection in different components such as glass, plastic, metals and scrap based on analysis conducted by the National Consortium for packaging management
- eliminate the impurities of the collection
- eliminate the waste treatment scraps
The parameters related to the impurities of the collection and the waste treatment scraps can be estimated using a mass balance of selection and treatment plants. For the collection of multi-material packaging and single-material plastic, however, the impurities and scraps can be obtained from the periodic analyses and statistical processing conducted by the National Consortium for Packaging.
The calculation models taken as reference for the application of Formula (1) are the following:
- ➢
- C1. Conventional: the numerator (SC) is given by the sum of all fractions separately collected, excluding the unsorted, bulky and street sweeping waste (considered in the denominator as RMSW).
- ➢
- C2. National: in the numerator of the Equation (1), the method adopts Σi SCi. Specifically, the considered streams are the organic fraction (wet + green), packaging (paper, plastic, glass, wood, metal, including fractions resulting from multi-material collection, net of scraps), WEEE from households, bulky to be recovered, used clothing and textile waste and SC of hazardous waste (batteries and accumulators, expired medicine, T/F containers, ink, paint oils, other hazardous waste). The denominator has the same amount reported in the numerator (Σi SCi) to which, at the national level, the unsorted MSW and waste from street sweeping (MWuns), the bulky waste (BW) and the SC scraps (SCS) are added (for example: waste from multi-material collection). Therefore, Formula (1) becomes:%SC = Σi SCi/(Σi SCi + MWuns + BW + SCS) × 100
Inert waste is not counted in urban waste and, therefore, it is neither in the numerator nor the denominator of (2), even if arising from household demolition.
- ➢
- C3. Provincial: Similar to the conventional model with the difference that in the denominator, the waste from street cleaning is not considered. The obtained value is consequently slightly higher, if compared with the traditional method. The exclusion from the calculation of the street sweeping waste is motivated by climatic variables (mainly snow and ice) that the citizen cannot influence.
Additional assumptions are necessary for managing biostabilisation as landfill pre-treatment and the role of home composting.
It is assumed (C4) that all the unsorted MSW is subjected to a process of biostabilization before being stored permanently in a landfill. In the Province of Trento, biostabilization is required by law when the organic fraction to be landfilled exceeds the limit of 115 kg eq-inh−1 year−1, in order to reduce the possible negative effects on the management of the landfill.
Concerning home composting, when it is sufficiently widespread, it removes a major part of the organic waste from collection service, reducing waste production. This provides an additional model of calculation (C5).
Thus, five different values of percentage of recycling combined with four levels of purity of the collection were calculated, yielding 20 combinations.
3.3. Selective Collection Quality Index
The authors defined a new index to support the %SC to obtain a clear reading of the achieved results. Indeed, in addition to %SC, other indicators need to be integrated in a new index to understand how effective SC is, such as:
- collection efficiency for a single fraction
- adopted system and method of collection
- quality of SC
- implementation of the punctual tariff
- tourist incidence
The purpose is to define a synthetic index, SCQI (SC quality index) that is fed by the various indicators listed above, in order to identify the best management models. Its definition will require an eight STEP pathway, pointed out as follows.
Regarding the efficiency related to each fraction and the evaluation of the tourist incidence, it is sufficient to apply the respective definitions. The application of the punctual rate is a simple binary yes/no, while it is possible to create an abstraction for classifying the sorting system and method of collection, assigning a value to the single conventional configuration according to a scale of values fixed as reference.
The measure of the quality of the collection is highly conditioned by the scrap of SC, which is the fraction of waste unrelated to the amount of collected fraction. Usually the difference is due to user errors in separating the waste, especially in the case of plastic packaging.
Within multimaterial collection, there are high percentages of scrap, mainly composed of waste not amenable to further recovery.
The high amount of existing plastic for packaging that leads to unify all of the objects made of plastic, facilitates this phenomenon.
It is important to impose continuous control on users to fight the transfer of foreign materials. To this end, we note the importance of the unique user-container relationship to improve the quality of the collection.
The analysis of all (or at least the most important) waste collected fractions would be required to determine the scraps of recycling. However, it is possible to determine with certainty only the impurities in the collection of packaging.
The scrap of the collection can be used as a variable key in assessing the quality of the collection system.
Starting from these considerations, the variables considered in the construction of the SCQI are (STEP 1):
- Scrap of SC (SSC): this is the tons of waste expelled from the SC stream during the selection phase. The data originate from product analysis performed on the collection of multi-material packaging and single plastic materials, which are only systematically available every three months from the National Consortium of Packaging [22]. For other fractions (i.e., organic, paper and cardboard), few data are available and are more sparse in time; they are assembled directly by the Province of Trento from selected plants.
- Gross SC (SCG): this is the tons of waste collected separately, both with curbside systems and at collection centers. The waste fractions are organic, green, paper and paperboard, multi-material, glass, metals, plastics, wood, textiles, WEEE (Waste from Electric and Electronic Equipment), hazardous wastes, and others. It includes residues of waste collection.
- Unsorted waste (UNS): this is the tons of rubbish collected by the users with a dedicated system.
- Bulky waste (BW): this is the tons of bulky waste collected mainly at the collection center. In some territories, the withdrawal is active on call at the user’s home.
- Residents and equivalent population (RES, EQ).
Starting from the shown variables, we can define some derived variables (STEP 2):
- Net SC, that is SC without scraps:SCN = SCG − SSC
- Residual MSW, that is MSW not managed by SC:RMSW = UNS + BW
- Percentage of SC (definition of the Province of Trento):%SC = SCG/(SCG + RMSW)
- Tourist impact TI, as tourism causes an increase in anthropic pressure:TI = EQ/RES − 1
- The SC purity index (PI) has been defined as (STEP 3):PI = SSC/SCG
The ratio shows how the collection system is characterized by a little amount of scrap. It has a value between 0 and 1.
The preferable results are characterized by low SSC associated with high SCG. The indicator has a clear physical meaning and it is easy to understand. Low values of the index represent the best class that gets worse with increasing PI.
PI, by itself, does not distinguish between areas characterized by little scrap and an undeveloped SC system with territories with higher scraps, but high levels of SC. To properly judge the effectiveness of a SC system, PI must be associated with other leading indicators, such as the collection rate and the per capita production of waste. We consider it useful to introduce some correction factors for PI in order to obtain a new index that summarizes the effect of the considered variables.
We considered the following factors, with the aim of building a quality index with higher general validity than PI (STEP 4):
- (a)
- Level of SC: the territories with a greater percentage of SC generally have a higher amount of scrapes. At constant PI, the territories with lower %SC must be penalized as a collection system as higher %SC initially requires a substantial investment in human, organizational and economic resources. Consequently, PI must grow and the correction factor becomes:with k%SC ∈ [0, ∞], with extremes at %SC = 1 (or 100%), and %SC = 0%.k%SC = (1/%SC − 1)The infinitive value is an extreme case as it means that there is no SC (not acceptable in EU)
- (b)
- Underutilization of SC: SSC is usually a proportion of waste that had to be classfied as undifferentiated. In this context, the approximation is acceptable. A low production of unsorted MSW (UNS) does not automatically show an efficient collection system when associated with high levels of SSC. In this configuration, a transfer of waste from the undifferentiated stream to the collection ones outlines obvious diseconomies of management.The correction factor is:with kUNS ∈ [0, SCG/(SCG + UNS)]kUNS = SSC/(SSC +UNS)SSC + UNS represents the “real” undifferentiated waste. The areas with low SSC and high UNS have a very low ratio, while the territories with high SSC and low UNS are characterized by a high ratio. The higher the KUW ratio, the more the SC results are underutilized.
- (c)
- Migration of bulky waste: the production of bulky waste should be an independent variable of the collection system, reaching standard per capita values. In more advanced collecting systems (high %SC), there is a migration of waste from undifferentiated to bulky. If strict control is not active at the collecting centers and the punctual tariff is applied, the user is encouraged to deliver part of unsorted MSW to the collecting centers to reduce the variable part of the tariff. The formula of the correction factor is:with kBW ∈ [0, 1].kBW = BW/RMSW
- (d)
- Inhabitants and tourist incidence: with all factors constant, the organization of the collection service, in areas with a high number of resident inhabitants and/or a high tourist incidence, is more difficult. The tourist incidence is given by the ratio:with i = catchment area, j = year(aIN.T)ij = EQij/RESij − 1
To determine decreasing factors with increasing variable (RES and aIN.T), we calculated the ratio using the maximum value of the data series for the year j, according to the following expressions:
- coefficient of permanent residents:aRES = 1 − RESij/max{RESi}j
- coefficient of tourist incidence:aT = 1 − (aIN.T)ij/max{(aIN.T)}j
The linear combination of the two coefficients provides the correction factor kAB that, in the more severe case (a territory at the same time characterized by maximum permanent residents and highest incidence of tourism: aRES = 0 and aT = 0), assumes a unit value. Thus,
kAB = aRES + aT
Starting from this framework, the authors propose the following formula (STEP 5) for an SC quality index (SCQI), whose calculation pathway can be reconstructed according to the method proposed by Kyriakis et al. [23]:
SCQI = PI × (1 + k%SC) × (1 + kUNS) × (1 + kBW) × (1 + kAB)
A high value of the index corresponds to a low quality. SCQI coincides with the index of purity PI when a territory simultaneously presents all limiting situations. Consequently, SCQI ≥ PI.
The various contributions of the k factors have the same weight in the formula of SCQI. It is considered appropriate to introduce a weight coefficient p [0, 1] for each factor k in order to better calibrate the influence of SCQI based on the historical data available. Therefore, denoting K (capital letter) as the definitive formula of correction factors, the individual expressions become (STEP 6):
K%SC = 1 + p%SC × k%SC
KUNS = 1 + pUNS × kUNS
KBW = 1 + pBW × kBW
KAB = 1 + pRES × aRES + pT × aT
From which (15) becomes:
SCQI = PI × K%SC × KUNS × KBW × KAB
To fully assess the influence of the four K contributions in (15), a set of indexes was defined as follows (STEP 7):
I%SC = PI × K%SC
IUNS = PI × KUNS
IBW = PI × KBW
IAB = PI × KAB
It is appropriate to define a limited number of classes (STEP 8) in order to facilitate the reading of PI and SCQI. We have chosen to fix three classes:
- Class 1–high
- Class 2–average
- Class 3–low
Data related to a period of some years can be used in order to define the limit values of PI and the correction factors. For the correction factors, limits can be established in relation to the best and worst performances in the catchment areas, in accordance with the objectives of the planning data. For PI, class limits can be defined by evenly distributing the frequency of the sample. SCQI, contrary to PI, does not have a real physical meaning, but represents an abstraction of the quality of the collection, through the linear combination of dimensionless quantities, based on per capita waste weight and inhabitants.
PI must be analyzed together with other factors that characterize the system in order to have a complete and comprehensive reading of the achieved results. Instead, SCQI does not need to explain the characterizing factors, except to understand the origin of the corrections.
3.4. Selection of the Period to Be Analyzed
The years close to the one of introduction of the punctual tariff (Y = 2011) were chosen to assess the proposed index and its sub-parameters; indeed, these are years when the SC efficiency was still growing significantly and not homogeneously in the territory. Thus, an analysis of that period can be useful for pointing out specific criticalities that today are no longer visible. For instance, in the chosen period, the delay in the optimization of SC in areas with a higher presence of tourists is more visible. Data for 2016 show smoothed differences in the territory and thus are less interesting for testing the proposed index.
4. Results and Discussion
4.1. Overall SC
In Figure 3, the SC efficiency for each community in the Province of Trento is reported referred to the year Y + 1. Data were checked to find areas where SC was delayed. Only the town Rovereto showed a delay in SC optimization apparently not related to the peak of tourism; this can be explained by the presence of an important museum that can be visited without requiring a night spent in this town: the tourist flux is higher than the one monitored. Consequently, the SC delay cannot be attributed only to a lack of attention of the resident population.
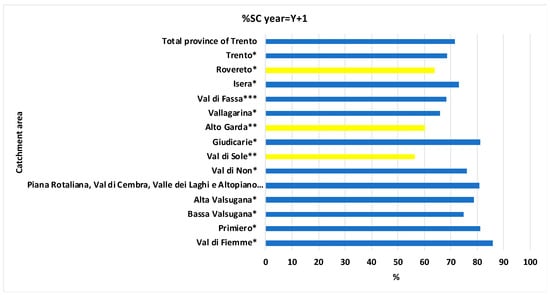
Figure 3.
Catchment areas of MSW in the Province of Trento, relevance of tourism (number of *) and percentage of SC. SC delay is pointed out in orange in case of efficiency lower than 65%, i.e., the target set in Italy by law. Notes: * areas with 1 < [EQ/RES] < 1.5; ** areas with 1.5 < [EQ/RES] < 2; *** areas with 2 < [EQ/RES] < 2.5.
Analyzing the per capita RMSW production in different areas, in Table 1 it can be seen that the highest values were recorded in the catchment areas that had not yet adopted the method of punctual tariff service. Where the punctual tariff was consolidated, the annual production per capita resulted in even less than 100 kg eq-inh−1 year−1. Val di Fiemme was the first territory to invest in this system, applying the method of curbside collection of unsorted MSW.

Table 1.
Production per capita of RMSW (kg eq-inh−1 year−1) in year Y + 1 and the applied tariff model.
4.2. SC Calculation Analysis
A number of parameters, calculated as follows (Table 2), have been used to perform the analysis:
Table 2.
Composition and processing parameters.
- Composition of multimaterial collection: it is the provincial composition related to the year Y + 1. For each quarter, the area sample was rebuilt multiplying the percentage of the fraction by the total amount of collected multimaterial. Subsequently, all contributions were added (all quarters of each basin), obtaining a single provincial sample, from which the percentages of composition were determined. With these percentages, multiplying by the total amount of provincial multimaterial (29,467 t), the quantities were determined. In this way, the sample represents the weighted average of all the considered analyses.
- Impurities of multimaterial collection: the analysis limits the estimate of the impurities of the main collected fractions with dedicated systems that generate significant amounts of waste. The coefficients in the column % were estimated based on literature values [21], except for the plastic data that were derived from the product analysis conducted by the National Consortium for Packaging.
- Assessment of treatment scraps: the percentages were estimated by averaging the data for some treatment plants present in the Province. The value of the plastic is based on a statistic by the National Consortium for Packaging.
- Biostabilization of unsorted MSW: operating parameters (for year Y) of the biostabilization plant installed at the Rovereto landfill were adopted for the analysis. The plant received 20,000 tons/year of unsorted MSW, coming from a basin with about a 185,000 equivalent population. The plant, besides being the largest in Trentino, is representative because the territories of its catchment area were characterized by very different levels of recycling, evenly covering the whole Province. Consequently, the unsorted MSW sent to the plant had a composition sufficiently distributed that can be used as a reference. When calculating the %SC we have considered as denominator, besides the usual fractions of recycling and related scraps, the waste landfilled after biostabilisation: oversize and biostabilized.
- Home Composting: an extension of this practice for 20% of the resident population was considered to evaluate the influence of home composting on the %SC. As there is no precise data on the actual distribution of composters in the Province, the percentage was extrapolated by the number of composters in the city of Trento extended to the entire Province. Considering the resident inhabitants of the Province of Trento and using 0.250 kg inh−1 day−1 for the daily production of waste to be composted, we can determine the amount of organic matter dealt with in the system of home composting, amounting to 9654 t/year deducted from the waste collection system [21]. This amount seems significant, but, even if approximated, is coherent with the urbanization characteristics of the territory, where the verticality of the building is limited and private gardens are typical, i.e., aspects that favor the adoption of home composting.
Table 3 summarizes the original quantities of collected MSW (A), the multimaterial breakdown (B), the consequence of the elimination of impurities due to the collection phase (C) and the elimination of the scraps due to treatment in recovery plants (D). At each step, we highlighted the residues for disposal, with the hypothesis that they are sent to the same landfills for municipal waste. Summing up:
Table 3.
The data of MSW collection (SC streams and other) in the Province of Trento divided by level of purity (t/year).
- -
- column B allowed relocating some recyclable materials collected together (named multimaterial) and moving the amount of undesirable materials in the item “scraps to disposal”;
- -
- column C allowed relocating impurities present in the SC streams to the item “scraps to disposal”;
- -
- column D allowed relocating scraps generated by the treatment of SC streams in recycling plants to the item “scraps to disposal”.
For these relocations, data from Table 2 were used. As these relocations, aimed to point out the real amount of materials recycled, can be done only for recyclable streams, a few items of Table 3 do not change. In other cases, values from A to D demonstrate a high quality of source separation and treatment: this is the case of the organic stream that shows few differences from raw collection to net valorization.
Moving from A to D, we move towards the amount of waste that is closest to the actual recovery of materials and, of course, the value of %SC falls proportionally (unsuitable materials are not taken into account focusing on the recyclable ones).
As reported in Figure 4, the trend in the percentage of SC related to the method of calculation and to the presence of collection and treatment scraps highlights a difference between the different combinations, also in the order of 10%, comparing the national model (C2–C) and the provincial model (C3–A). The conventional model indicates an intermediate value (C1–A).
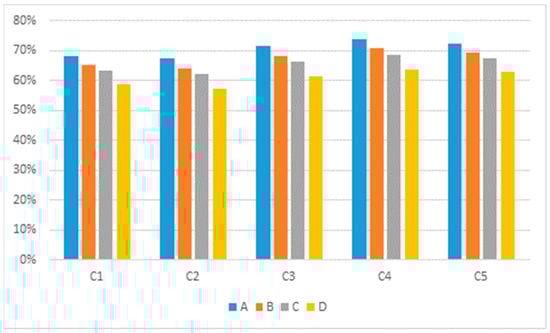
Figure 4.
Results of the SC calculation analysis (C1–C5: calculation methods of SC; A, B, C, D: calculation criteria for impurities and scraps).
As demonstrated in Figure 4, the use of a common calculation model is necessary to compare the results of territories with different management collection services. The %SC should represent the separation capacity of the collection management system, also considering the impurity (C1–A). The importance of defining the new index, SCQI, to accompany the %SC is required to obtain a clearer vision of the achieved results.
4.3. SCQI Assessment
Data related to the selected period were used in order to define the limit values of PI and the correction factors. For the correction factors, limits have been established in relation to the best and worst performances, in accordance with the objectives of the planning data. For PI, class limits have been defined by evenly distributing the frequency of the sample. In conclusion, the classes of PI were defined as:
- Class 1–high PI ≤ 6.1%
- Class 2–average 6.1% < PI < 8.8%
- Class 3–low PI > 8.8%
After establishing the PI and correction factor class limits, the SCQI threshold classes can be calculated. All parameters are summarized in Table 4.
Table 4.
PI, I%SC, IUNS, IBW, IAB and SCQI limits, highest and lowest values.
The PI and SCQI model calculation is sensitive to the definition of the limits of PI as the distribution of values of the latter falls within a very narrow range. Comparing PI and SCQI calculated for the selected period (Table 5), we can appreciate that:
Table 5.
Values of indexes to distinguish classes (brown = class 1; grey = class 2; blue = class 3) calculated for the year of punctual tariff introduction (Y), one year before (Y − 1) and one year after (Y + 1).
- in some areas there is no change in class between the two indexes. This means that the scrap in the collection is the nullifying element, while the correction factors do not affect the change of class, or offset positive and negative effects. The phenomenon is recorded in the areas where the collection system is in a consolidation phase (Val di Fiemme and Alta Valsugana). Alta Valsugana and the area of Trento, however, reached qualitative results of Class 1 for both PI and SCQI. The fact that all the influential indices are always (but one) in Class 1, indicates that the collection has achieved a good level;
- in the other areas, the factor that has the greatest influence is related to the population: residents and tourists. This means that, according to the calculation of SCQI, it gives special importance to the inhabitant settlement and tourist dynamics.
4.4. Discussion
The main advantage of the proposed methodology is the integration of data that quantify the principles of prevention, accountability, cooperation, transparency, technical and economic viability in MSW management. SCQI provides summarized information both in terms of the dynamics of its absolute value, to check improvements in the management of an area, and in terms of comparison between areas, specifically in a same region. This is not obtainable at zero cost. The reason is the need for the detailed generation of data year by year for each area where there is a homogenous responsibility in MSW collection (that can be a valley in a mountainous area or a city in large urbanized areas). The same administrative responsibility does not guarantee the same effort in generating data suitable for characterizing MSW collection and thus SCQI. An example is the difference in quantity and quality of information that can be seen comparing alpine regions in the North of Italy (e.g., Trentino and Lombardy in Italy) but also comparing mountainous regions of different countries (e.g., Trentino in Italy and Transilvania in Romania). The presence of international tourism is surely an incentive for a better management of MSW collection. To this end, SCQI helps the management of MSW collection in tourist areas but its full exploitation needs a tradition in generating data for SC characterization.
In the literature, some performance analyses on MSW management can be found either dedicated to SC or including it in a wider approach.
Chung-Chiang Cheng [24] highlighted the important role of MSW generation in affecting MSW management performance and provided an integrated model to assess MSW management performance by dividing MSW management into three stages including MSW generation, sorting and collection. Compared to this approach, the proposed SCQI focuses on the SC sector at greater detail.
Bianchini et al. [25] pointed out the need to adopt management tools where SC and recovery efficiency are clearly distinguished. The proposed SCQI is coherent with this vision.
Gamberini et al. [26] underlined that the definition of engineering indexes aiding MSW management systems during the design and evaluation of performance is a topic widely discussed in literature. That depends on the interest from technicians and the complexity of the problem requiring efforts by academics and researchers. Nevertheless, although a wide variety of published articles is available in this field, contributions evaluating the implementation of engineering indexes in a wide set of case studies are rare [26]. Thus, the present article, proposing and assessing the SCQI in a wide set of communities, contributes information in this regard.
5. Conclusions
In the case study, the adoption of enhanced collection systems and the implementation of the tariff with accurate measurement, clearly showed a way to get very high levels of waste separation. However, while from the quantitative point of view the results are of absolute excellence, work remains on the qualitative part of recycling, lowering the level of the scrap. Improvements can be identified by the proposed index.
In particular, the assessment of waste collection in general, and of the SC in detail, depend on several factors. The evaluation of the efficiency of the SC expressed in terms of percentage with respect to the total amount of waste is very limited and conditioned by many factors, starting with the typology of tariff details. The present work has made it possible to develop a set of indicators and aggregate indices able to evaluate the different factors that affect SC. In particular, the SC quality index SCQI has been defined and applied to each catchment area of the region object of study. Data used to test the model relate to a historical period in which the areas that started first, such as Val di Fiemme, have reached a phase of the consolidated system. It would be interesting to apply the calculation model in contexts different from Trentino and with longer data series. A limitation to that could be the amount of data necessary and their reliability.
The potentialities of SCQI adoption will be analysed by the authors in research planned for Sibiu County (Transilvania), named the European Region of Gastronomy in 2019, in order to take advantage of the interest of the local authorities for MSW management in that area. Indeed, the adoption of SCQI needs strong collaboration of the administrative sector for data collection and sharing. This new research will provide an opportunity for a comparison between European regions and will help to tune the proposed approach. Moreover, it will provide an opportunity to reconstruct the calculation pathway according to the above-cited method [23], in order to generate a flow chart of the algorithm suitable for software implementation.
Author Contributions
Claudio Zatelli conceived the indicator, whose implementation was discussed with Elena Cristina Rada in order to design its final structure. Elena Cristina Rada supervised Claudio Zatelli in the analysis of the data. Vincenzo Torretta and Lucian Ionel Cioca contributed to the article, checking the criticalities in the exportation of the approach in different areas. Elena Cristina Rada and Claudio Zatelli contributed to the writing of the article, which was revised by all authors.
Conflicts of Interest
The authors declare no conflict of interest.
Abbreviations
| EQ | Equivalent Population |
| EU | European Union |
| MSW | Municipal Solid Waste |
| PI | Purity Index |
| RES | Resident Inhabitants |
| RMSW | Residual Municipal Solid Waste |
| SC | Selective Collection |
| SCQI | Selective Collection Quality Index |
| SCS | SC scraps |
| TI | Tourist Impact |
| UNS | Unsorted MSW |
| WEEE | Waste from Electric and Electronic Equipment |
| BW | Bulky Waste |
References
- Kalogirou, E.; Bourtsalas, A.; Klados, M.; Themelis, N.J. Waste Management in Greece and Potential for Waste-to-Energy. Green Energy Technol. 2012, 55, 219–235. [Google Scholar] [CrossRef]
- Căilean, D.; Teodosiu, C. An assessment of the Romanian solid waste management system based on sustainable development indicators. Sustain. Prod. Consum. 2016, 8, 45–56. [Google Scholar] [CrossRef]
- Puig Ventosa, I.; González Martínez, A.C.; Jofra Sora, M. Landfill and waste incineration taxes in Catalonia, Spain. Green Tax. Environ. Sustain. 2012, 244–257. [Google Scholar] [CrossRef]
- Rada, E.C.; Ragazzi, M.; Ionescu, G.; Merler, G.; Moedinger, F.; Raboni, M.; Torretta, V. Municipal solid waste treatment by integrated solutions: Energy and environmental balances. Energy Procedia 2014, 50, 1037–1044. [Google Scholar] [CrossRef]
- Torretta, V.; Ionescu, G.; Raboni, M.; Merler, G. The mass and energy balance of an integrated solution for municipal solid waste treatment. WIT Trans. Ecol. Environ. 2014, 180, 151–161. [Google Scholar] [CrossRef]
- Chaliki, P.; Psomopoulos, C.S.; Themelis, N.J. WTE plants installed in European Cities: A review of success stories. Manag. Environ. Qual. Int. J. 2016, 27, 606–620. [Google Scholar] [CrossRef]
- Psomopoulos, C.S.; Kaminaris, S.D.; Ioannidis, G.C.; Themelis, N.J. Contribution of WTE Plants in Eu’s Targets for Renewables: A Review Until 2014. In Proceedings of the 5th International Conference on Sustainable Solid Waste Management, Athens, Greece, 21–24 June 2017; pp. 1–8. [Google Scholar]
- Saner, D.; Blumer, Y.B.; Lang, D.J.; Koehler, A. Scenarios for the implementation of EU waste legislation at national level and their consequences for emissions from municipal waste incineration. Resour. Conserv. Recycl. 2011, 57, 67–77. [Google Scholar] [CrossRef]
- Becidan, M.; Wang, L.; Fossum, M.; Midtbust, H.O.; Stuen, J.; Bakken, J.I.; Evensen, E. Norwegian Waste-to-Energy (WTE) in 2030: Challenges and opportunities. Chem. Eng. Trans. 2015, 43, 2401–2406. [Google Scholar] [CrossRef]
- Turconi, R.; Butera, S.; Boldrin, A.; Grosso, M.; Rigamonti, L.; Astrup, T. Life cycle assessment of waste incineration in Denmark and Italy using two LCA models. Waste Manag. Res. 2011, 29, 78–90. [Google Scholar] [CrossRef] [PubMed]
- Jalava, K.; Pölönen, I.; Hokkanen, P.; Kuitunen, M. The precautionary principle and management of uncertainties in EIAs—Analysis of waste incineration cases in Finland. Impact Assess. Proj. Apprais. 2013, 31, 280–290. [Google Scholar] [CrossRef]
- Azapagic, A. Municipal Solid Waste Management: Recovering Energy from Waste. Sustain. Dev. Pract. Case Stud. Eng. Sci. 2010, 261–325. [Google Scholar] [CrossRef]
- Aracil, C.; Haro, P.; Giuntoli, J.; Ollero, P. Proving the climate benefit in the production of biofuels from municipal solid waste refuse in Europe. J. Clean. Prod. 2017, 142, 2887–2900. [Google Scholar] [CrossRef]
- Ripa, M.; Fiorentino, G.; Giani, H.; Clausen, A.; Ulgiati, S. Refuse recovered biomass fuel from municipal solid waste. A life cycle assessment. Appl. Energy 2017, 186, 211–225. [Google Scholar] [CrossRef]
- Ouadi, M.; Jaeger, N.; Greenhalf, C.; Santos, J.; Conti, R.; Hornung, A. Thermo-Catalytic Reforming of municipal solid waste. Waste Manag. 2017, 68, 198–206. [Google Scholar] [CrossRef] [PubMed]
- Woon, K.S.; Lo, I.M.C. A proposed framework of food waste collection and recycling for renewable biogas fuel production in Hong Kong. Waste Manag. 2016, 47, 3–10. [Google Scholar] [CrossRef] [PubMed]
- Gug, J.; Cacciola, D.; Sobkowicz, M.J. Processing and properties of a solid energy fuel from municipal solid waste (MSW) and recycled plastics. Waste Manag. 2015, 35, 283–292. [Google Scholar] [CrossRef] [PubMed]
- Rada, E.C.; Ragazzi, M. Selective collection as a pretreatment for indirect Solid Recovered Fuel generation. Waste Manag. 2014, 34, 291–297. [Google Scholar] [CrossRef] [PubMed]
- Eurostat, Statistics Explained, Recycling. 2017. Available online: http://ec.europa.eu/eurostat/statistics-explained/index.php/Recycling_%E2%80%93_secondary_material_price_indicator (accessed on 5 January 2018).
- Rada, E.C.; Zatelli, C.; Mattolin, P. Municipal solid waste selective collection and tourism. WIT Trans. Ecol. Environ. 2014, 180, 187–197. [Google Scholar] [CrossRef]
- Provincia di Trento. Smaltimento Rifiuti (Waste Management). 2017. Available online: http://www.appa.provincia.tn.it/pianificazione/Piano_smaltimento_rifiuti (accessed on 5 January 2018).
- CONAI. 2017. Available online: http://www.corepla.it/documenti/3547ba29-0bed-45d4-9a42-e5ebfcb3c503/Allegato+Tecnico+Imballaggi+in+Plastica.pdf (accessed on 5 January 2018).
- Kyriakis, E.; Psomopoulos, C.; Kokkotis, P.; Bourtsalas, A.; Themelis, N. A step by step selection method for the location and the size of a waste-to-energy facility targeting the maximum output energy and minimization of gate fee. Environ. Sci. Pollut. Res. 2017, 1–10. [Google Scholar] [CrossRef] [PubMed]
- Chen, C.-C. A performance evaluation of MSW management practice in Taiwan. Resour. Conserv. Recycl. 2010, 54, 1353–1361. [Google Scholar] [CrossRef]
- Bianchini, A.; Pellegrini, M.; Saccani, C. Material and energy recovery in integrated waste management system—An Italian case study on the quality of MSW data. Waste Manag. 2011, 31, 2066–2073. [Google Scholar] [CrossRef] [PubMed]
- Gamberini, R.; Del Buono, D.; Lolli, F.; Rimini, B. Municipal Solid Waste Management: Identification and analysis of engineering indexes representing demand and costs generated in virtuous Italian communities. Waste Manag. 2013, 33, 2532–2540. [Google Scholar] [CrossRef] [PubMed]


© 2018 by the authors. Licensee MDPI, Basel, Switzerland. This article is an open access article distributed under the terms and conditions of the Creative Commons Attribution (CC BY) license (http://creativecommons.org/licenses/by/4.0/).