Real Options Analysis for Acquisition of New Technology: A Case Study of Korea K2 Tank’s Powerpack


Abstract
:1. Introduction
2. Background
3. Acquisition Decisions: The Case of Korea K2 Tank’s Powerpack
- Unit Cost: The powerpack’s estimated unit cost if developed is $1.1M (million), whereas the purchased powerpack cost is $1.4M. Therefore, it is expected that the development will gain $0.3M benefit per unit compared to purchased cost. The greater is the quantity of production, the greater the benefit would be.
- Life Cycle Cost: Korea receives several benefits from domestic production such as the ability to easily solve problems or repair powerpacks during field operation. it can speed up equipment operation rate and shorten time for battle readiness by rapid comprehensive logistics support. In addition, in the future, it will be possible to reduce the maintenance cost of weapons systems operation by developing domestic powerpack series through sequencing of self-propelled artillery, landed armored vehicle, etc. According to the Defense Acquisition Program Administration’s announcement, the investment effect of the K2 tank development program is $3B (billion) in budget cuts, $800M worth of military power builds, and 5401 jobs creation [52,53]. Of course, this number can vary depending on the quantity of production, but it is clear that there is an additional benefit of domestic development.
- Securing the Technology and Export: When developing a weapons system by introducing core sub-systems or core technologies, the export of the weapons system must be approved by the core technology holder’s government. In the worst case, exporting weapons systems may not be possible. To prevent these problems, core technology development is essential. The secured technology can also be used in other fields. For example, Korea was in the process of signing a contract in 2000 to export K9 self-propelled artillery to Turkey. However, MTU, Germany, notified Korea that it cannot approve the export of the K9 engine. Eventually, the problem was resolved, but the Korean government was concerned that the same situation could arise when exporting K2 tanks.
- Risk of Failure: Korea has not developed a high-power, high-reliability powerpack of 1500 horsepower. In addition, the K2 tank would be mass-produced in 2011 with the developed powerpack after completion of development in 2008. Therefore, the development schedule was very tight, and it was very likely that the schedule would not be met. In developed countries, it took more than 10 years to develop a 1500-horsepower engine.
- Reduce risk of Development: Korea has developed and operated powerpacks of less than 1000 horsepower, but the powerpacks of more than 1000 horsepower have relied on overseas purchase due to lack of technology, high development cost and lack of economic efficiency. Therefore, based on the technology and production capacity accumulated in the 1000-horsepower powerpack, the introduction of 1500-horsepower powerpack technology from overseas countries can greatly enhance the development potential. In addition, domestic production can secure a certain level of 1500-horsepower powerpack technology.
- Export Limit: The introduction of technology can lead to difficulties in exporting such weapons system, e.g., the K9 self-propelled artillery. However, the exports issue would be resolved if the export agreement is specified in the technology-introducing contract or exporting the K2 tank, except for the powerpack.
- Avoid Risk: The Korean Ministry of National Defense can secure the powerpack on time for mass production of the K2 tank. It is a good alternative when the quantity of mass production is low and the technical difficulty is high.
- Export Limit and No Technology Securing: As with the introduction of technology, exports can be limited. In addition, because there is no domestic production, even if K2 tank production is increased, there is no benefit in Korea.
3.1. Uncertainties
- R&D Uncertainty: The following risks are included.
- Technology Risk: Making a reliable military grade powerpack is a challenging, high technology endeavor. There was no Korean manufacturer with experience in the development of powerpacks. Korean automakers, which have technology to develop engines and transmissions, are not interested in powerpacks because tank powerpacks are not marketable. Consequently, no Korean developer has experience in making tank powerpacks consisting of high-power diesel engines and transmissions.
- Schedule Risk: The six-year development period is set to meet the production stage of the K2 tank. Developed countries took 10 years to develop the powerpack. It is very likely that the project will be delayed.
- Project Budget Risk: Government R&D budget is limited. Developers must cover their own costs when development is delayed. This risk must be considered with Schedule Risk.
- Market Uncertainty:
- Quantity Risk: The Korean government has a limited budget for weapons systems and defense priorities may shift over time. The attack helicopter, the AH-64 Series (South Korea decided to purchase 36 AH-64E attack helicopters in 2013), is a competitor to the production volume of the K2 tank. A risk is the procurement number of tanks decreases, which would result in the development costs being amortized over fewer tanks, thus a higher per unit cost.
3.2. Expected Benefit
3.2.1. Without Uncertainties
3.2.2. Actual Acquisition Experience versus the Planned Acquisition
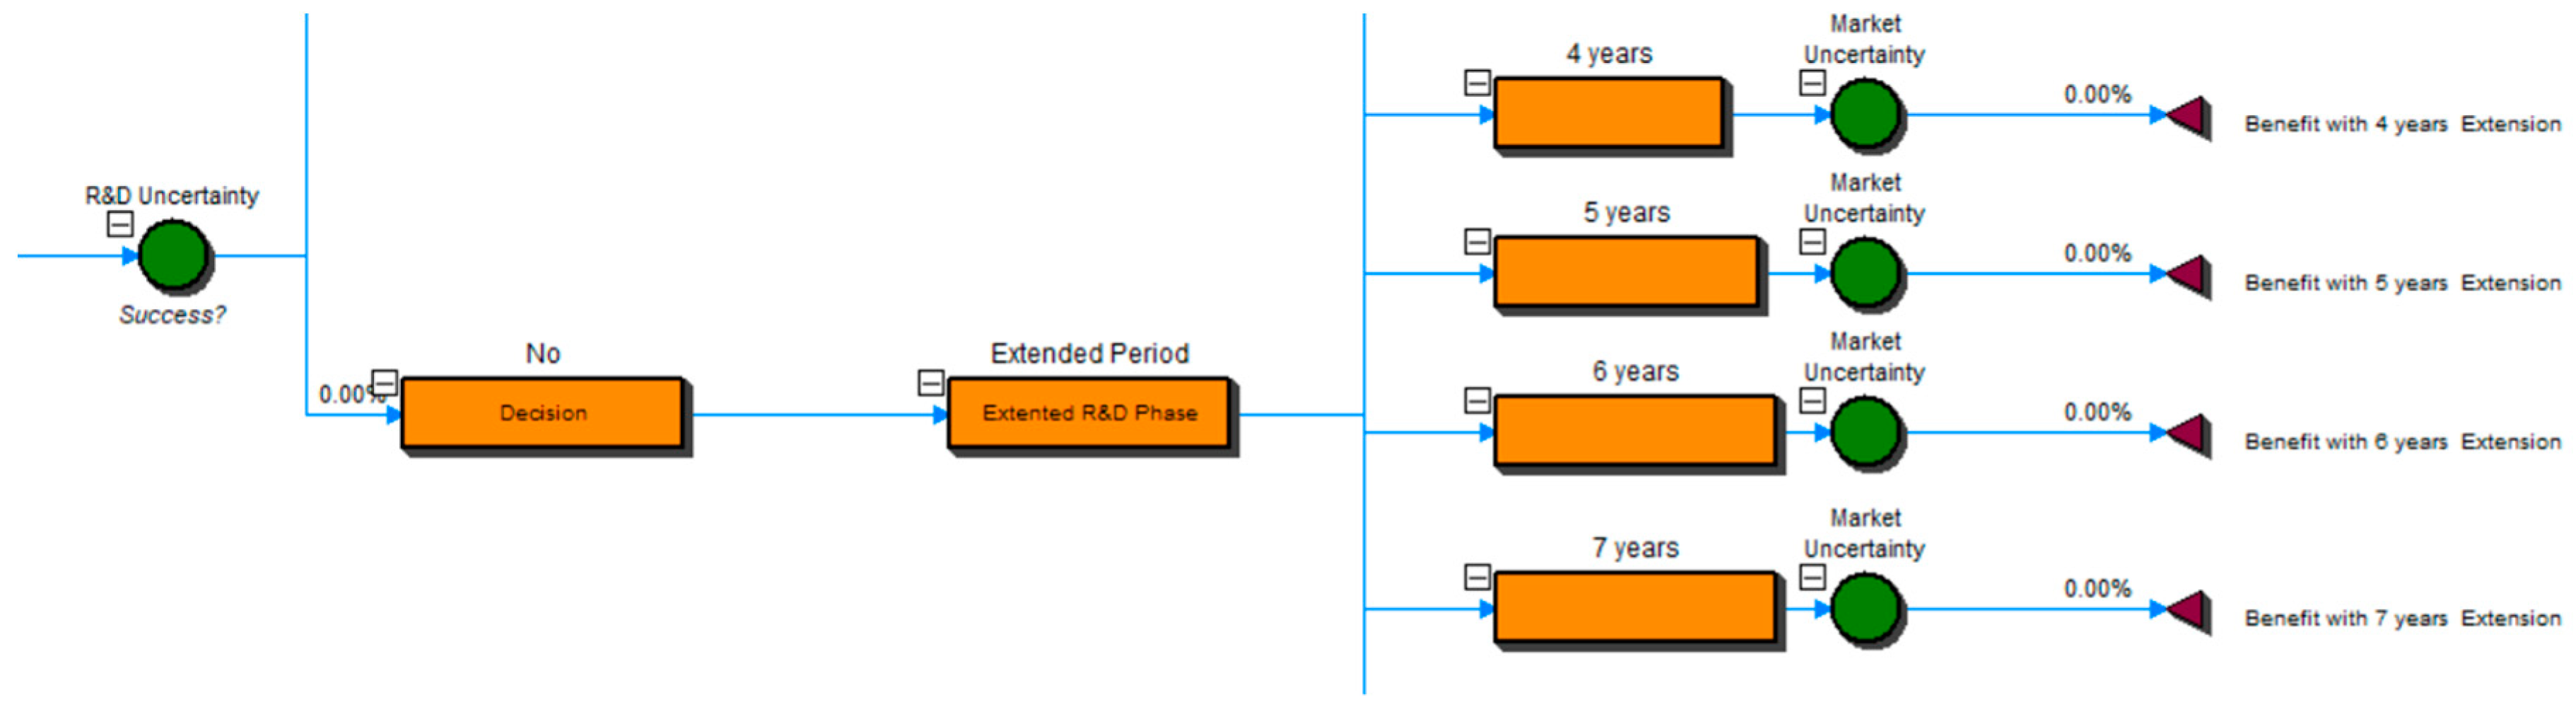
3.3. Decision Tree with Real Options
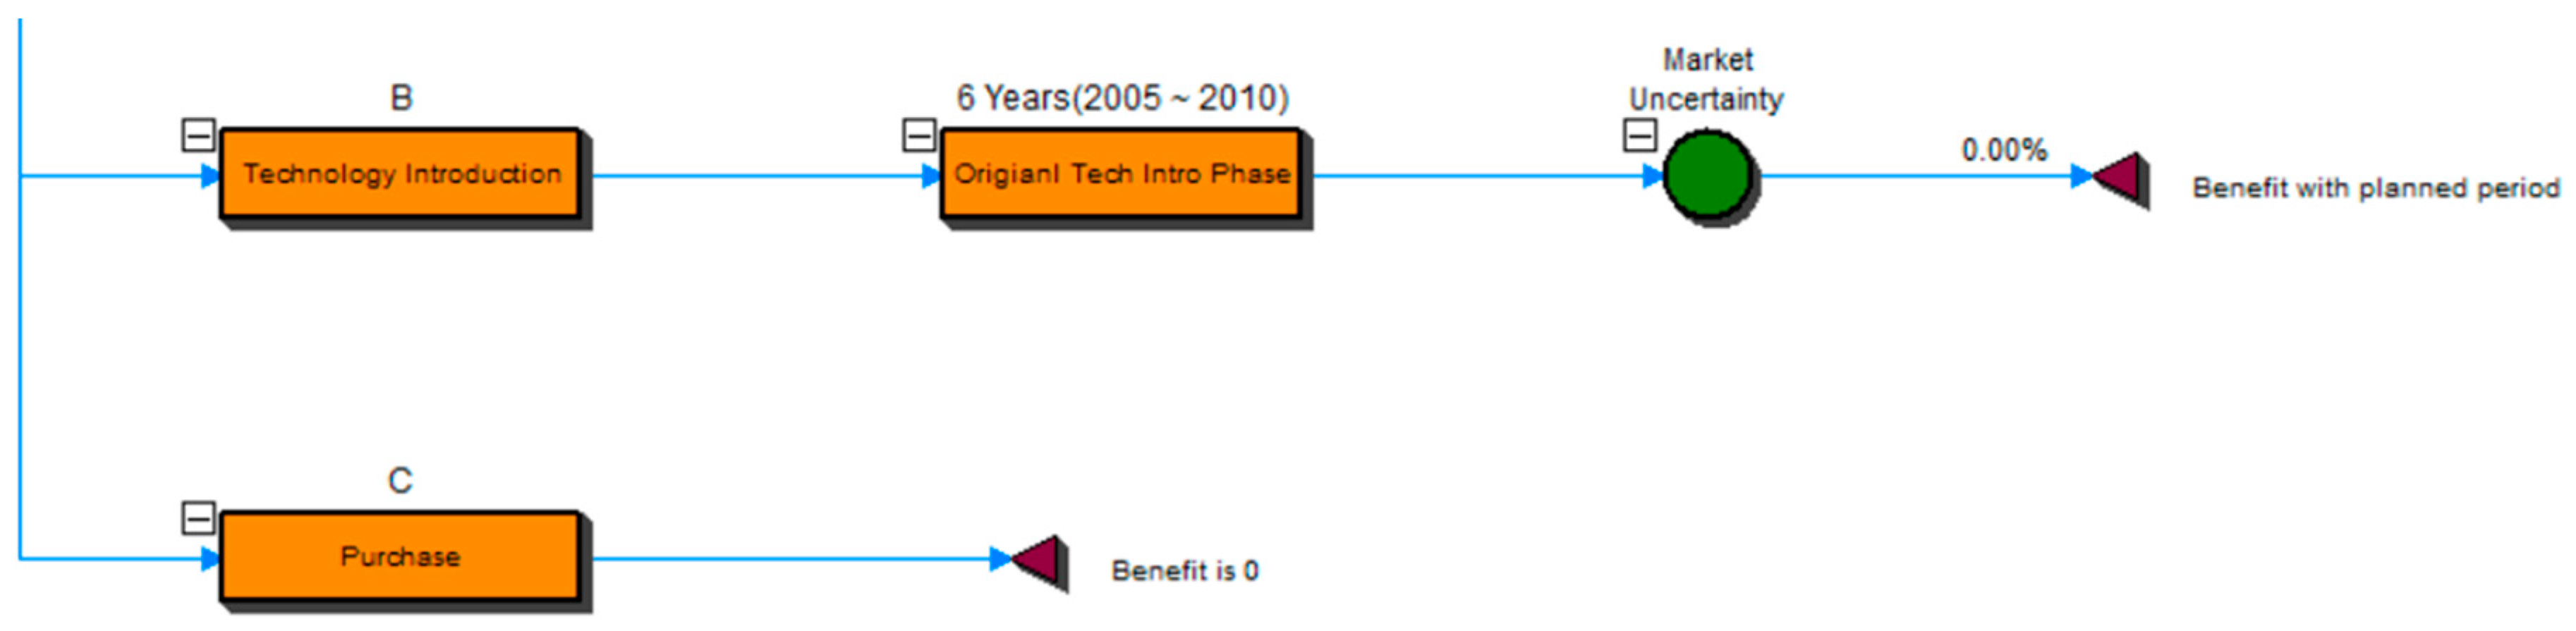
3.3.1. Decision Tree Modeling
Powerpack with no Options
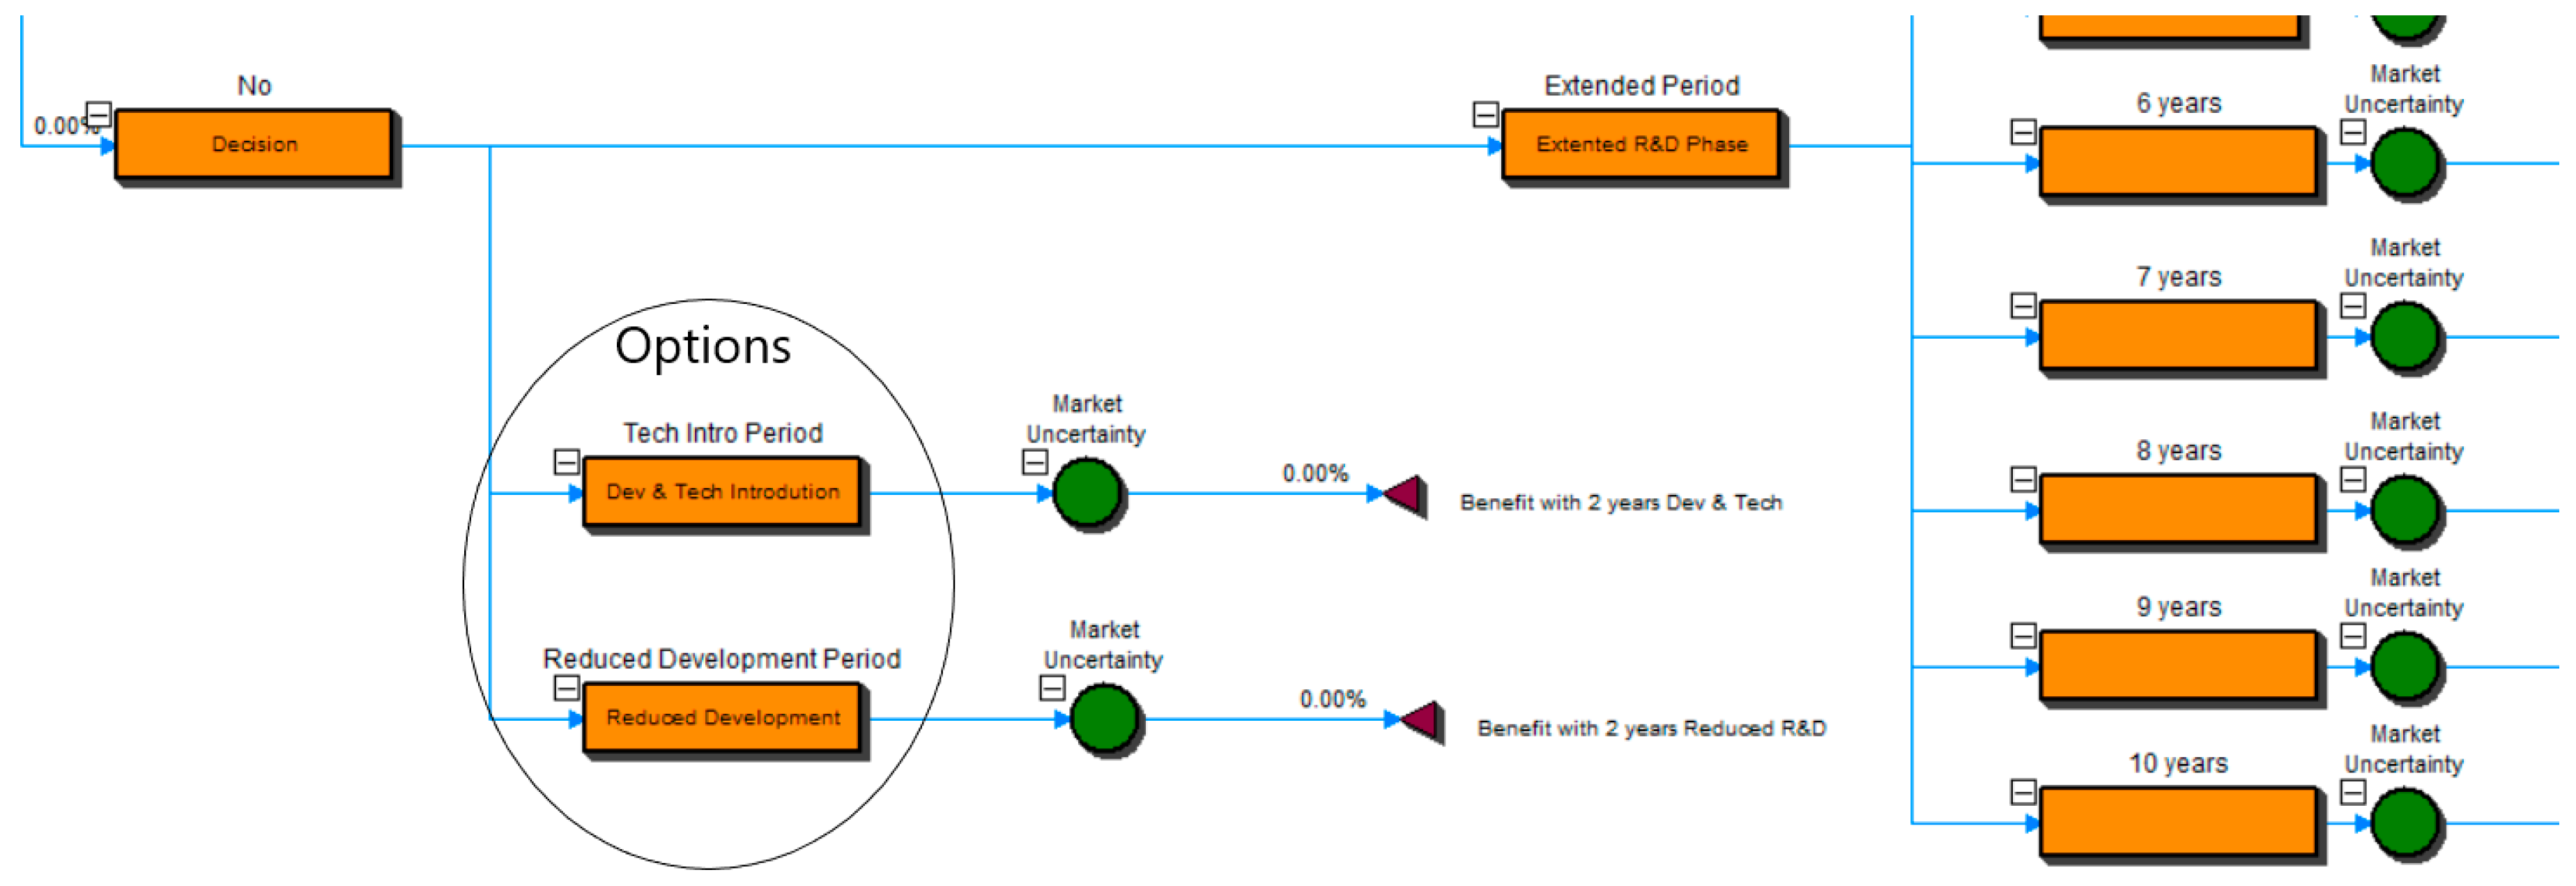
Powerpack with Options
- Development and Technology Introduction Options: Purchase engine and transmission technology from overseas. Much development has already been completed. Since it has not solved the major defects, the introduction of technology will make it easier to solve the problems already experienced by developed countries.
- Reduced Development Option: Produce a lower-reliability powerpack. The failure of Korea’s powerpack development project is not due to lack of performance, but due to unreliability of reliability standards. It is an option to introduce a lower-reliability powerpack. Because of the large number of reserves to be prepared for failure, the actual benefit will be less.
3.3.2. Decision Tree Valuation
- The initial investment in R&D: $100M
- The additional investment cost for each extension period: $15M/year (max 10 years) (an approximation dividing the development cost of $1M by the planned development period of six years)
- The quantity: 200–800 units (most likely 400)
- The export quantity: 50–200 (most likely 100)
- The reduced rate of domestic production quantity: 20 units/extended year (set the minimum value considering the production capacity of K2 tank is 50 units per year; because produced K2 tanks cannot be operated without a powerpack, the total quantity of powerpacks must be reduced by the number of powerpacks purchased)
- The reduced rate of export quantity: 5 units/extended year
- The discount rate: 5.5% [54]
- The development and technology introduction option cost: $0M/year, and can be developed within two years because we have already secured development equipment and technical know-how through development; considering the cost of purchasing technology, it was estimated to double the cost of extension
- The reduced development option cost: $15M/year, which has a benefit of 80% of the base product, and can be developed within two years.
4. Results and Analysis
4.1. Powerpack with No Options
- Development: Select when production quantity is high and development is possible within seven years.
- Purchase: Select when development is expected to take more than eight years, or when production quantity is medium or small.
- Technology Introduction: Select when production quantity is high and development is expected to take more than seven years.
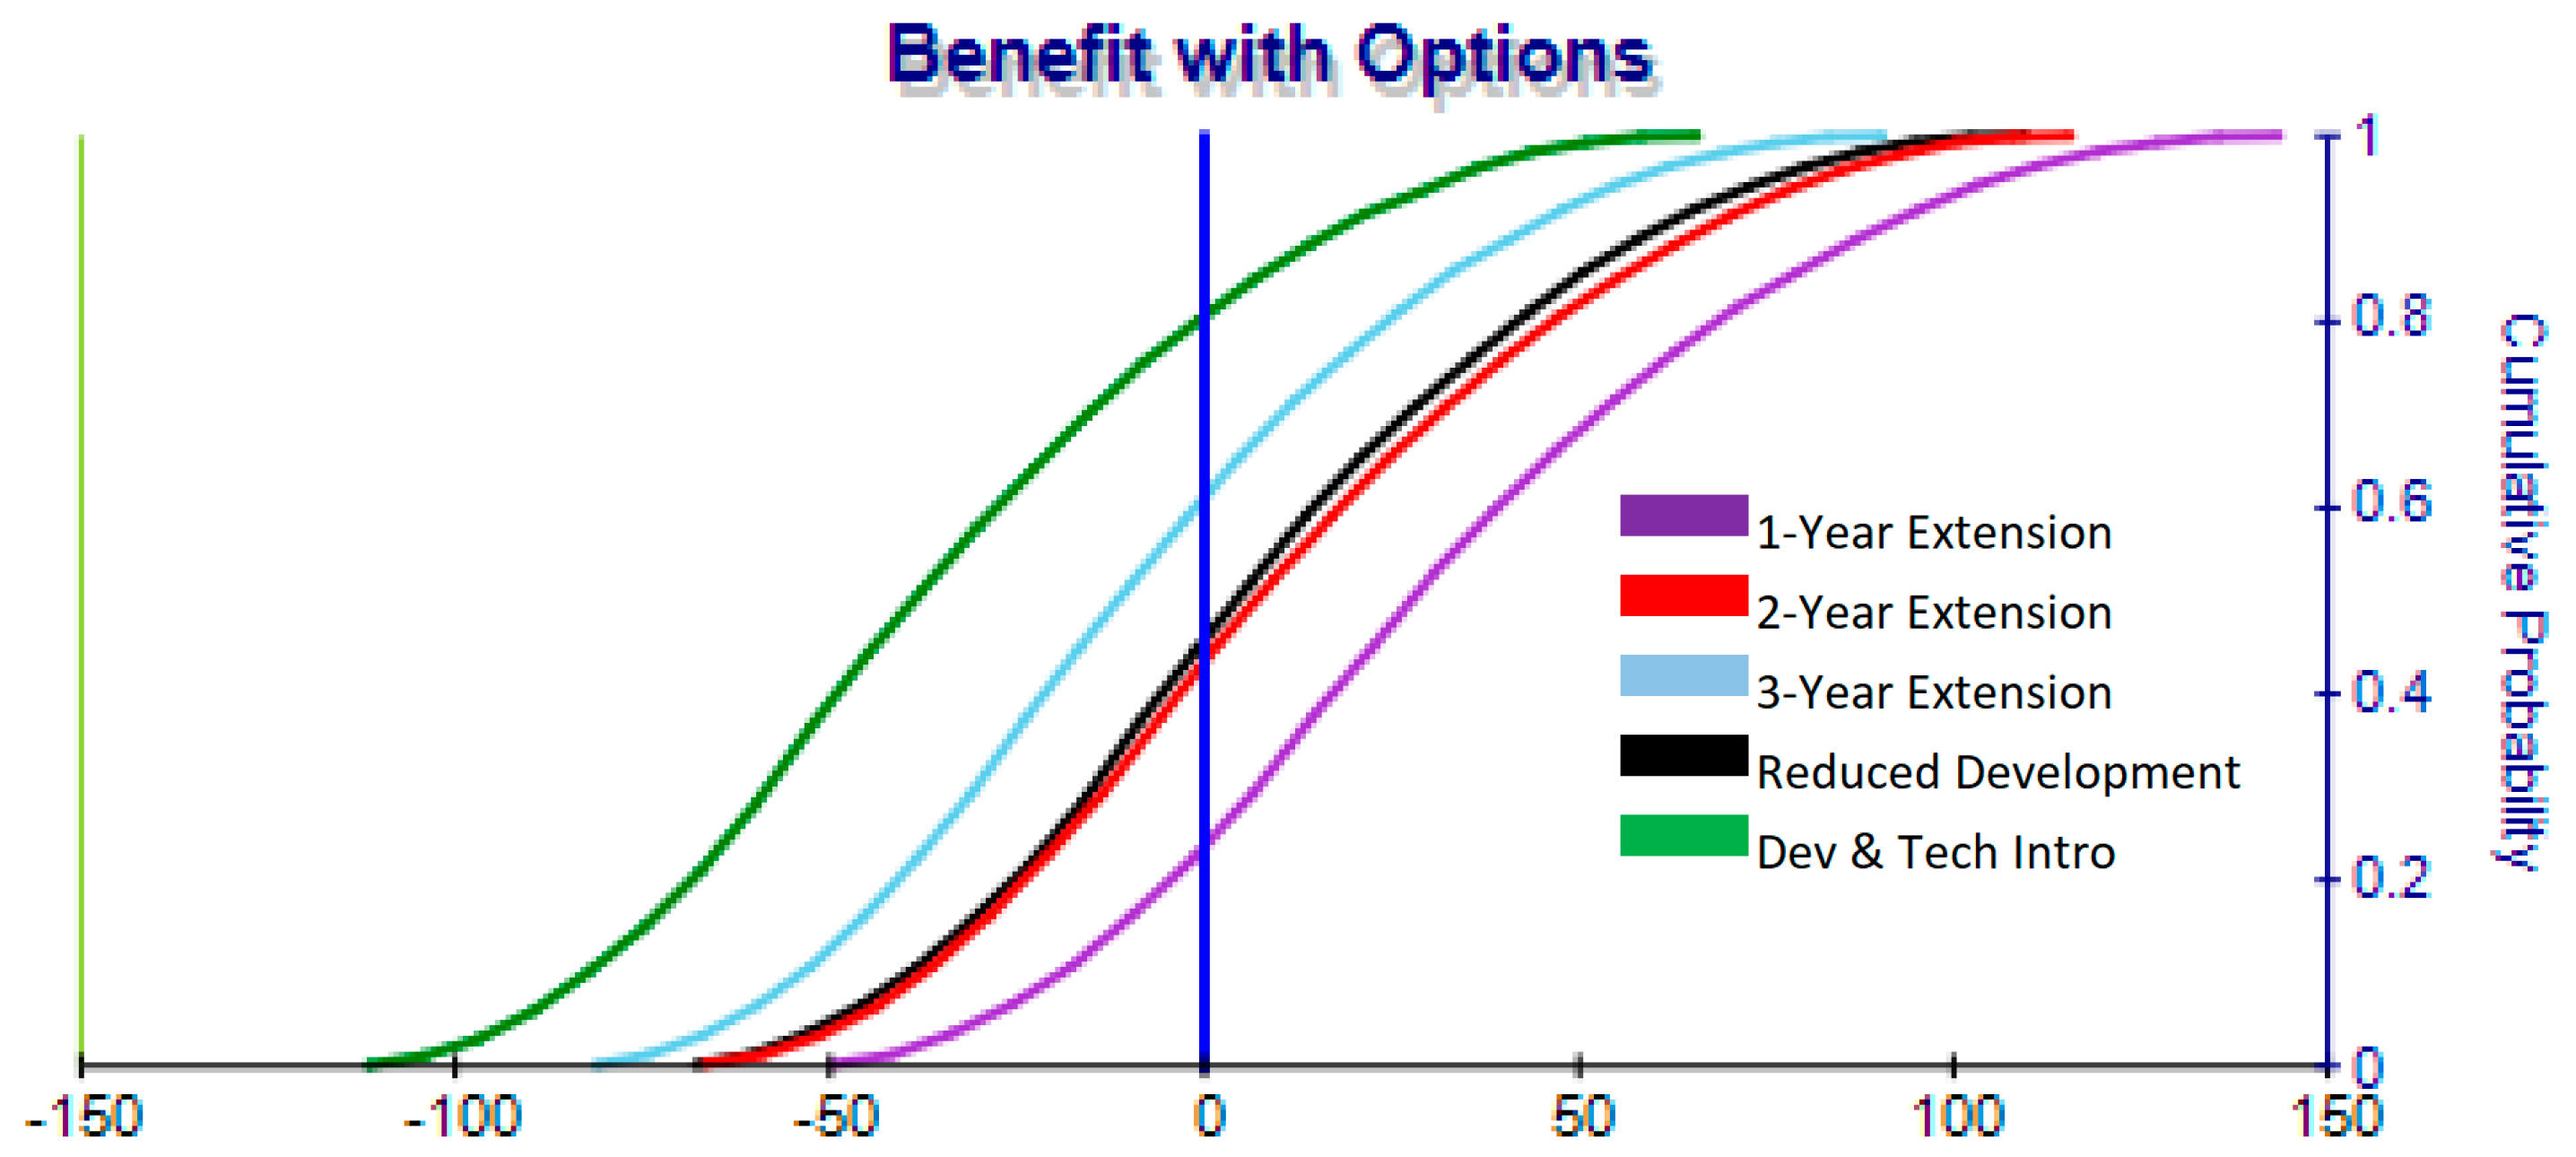
4.2. Powerpack with Options
- Continue Development: Select when development success potential is very high in two years.
- The Reduced Development option: Select when development is expected to extend beyond three years.
- Development and Technology Introduction: Select when the user requires 100% performance and we cannot solve a technical problem and the probability of success is very low.
5. Discussion
6. Conclusions
Author Contributions
Funding
Acknowledgments
Conflicts of Interest
References
- Tishler, A.; Dvir, D.; Shenhar, A.; Lipovetsky, S. Identifying critical success factors in defense development projects: A multivariate analysis. Technol. Forecast. Soc. Chang. 1996, 51, 151–171. [Google Scholar] [CrossRef]
- Porter, A.L. Forecasting and Management of Technology; Wiley: Hoboken, NJ, USA, 1991. [Google Scholar]
- Coates, V.; Farooque, M.; Klavans, R.; Lapid, K.; Linstone, H.A.; Pistorius, C.; Porter, A.L. On the Future of Technological Forecasting. Technol. Forecast. Soc. Chang. 2001, 67, 1–17. [Google Scholar] [CrossRef]
- Daim, T.U.; Kocaoglu, D.F.; Anderson, T.R. Using technological intelligence for strategic decision making in high technology environments. Technol. Forecast. Soc. Chang. 2011, 78, 197–198. [Google Scholar] [CrossRef]
- Robinson, D.K.R.; Huang, L.; Guo, Y.; Porter, A.L. Forecasting Innovation Pathways (FIP) for new and emerging science and technologies. Technol. Forecast. Soc. Chang. 2013, 80, 267–285. [Google Scholar] [CrossRef]
- Cunningham, S.W.; Kwakkel, J. Innovation forecasting: A case study of the management of engineering and technology literature. Technol. Forecast. Soc. Chang. 2011, 78, 346–357. [Google Scholar] [CrossRef]
- Sakata, I.; Sasaki, H.; Akiyama, M.; Sawatani, Y.; Shibata, N.; Kajikawa, Y. Bibliometric analysis of service innovation research: Identifying knowledge domain and global network of knowledge. Technol. Forecast. Soc. Chang. 2013, 80, 1085–1093. [Google Scholar] [CrossRef]
- Jun, S.; Park, S.S.; Jang, D.S. Technology forecasting using matrix map and patent clustering. Ind. Manag. Data Syst. 2012, 112, 786–807. [Google Scholar] [CrossRef]
- Choi, S.; Jun, S. Vacant technology forecasting using new Bayesian patent clustering. Technol. Anal. Strateg. Manag. 2014, 26, 241–251. [Google Scholar] [CrossRef]
- Kim, S.; Jang, D.; Jun, S.; Park, S. A Novel Forecasting Methodology for Sustainable Management of Defense Technology. Sustainability 2015, 7, 16720–16736. [Google Scholar] [CrossRef] [Green Version]
- The Naval Center for Cost Analysis. Economic Analysis Guide. 2013. Available online: https://www.ncca.navy.mil/references/DON_Economic_Analysis_Guide.pdf (accessed on 11 June 2018).
- Baker, H.K.; Dutta, S.; Saadi, S. Management Views on Real Options in Capital Budgeting. J. Appl. Financ. 2011, 21, 18–29. [Google Scholar]
- Trigeorgis, L. A Conceptual Options Framework for Capital Budgeting. Adv. Futures Options Res. 1988, 3, 145–167. [Google Scholar]
- Trigeorgis, L. Real Options and Interactions with Financial Flexibility. Financ. Manag. 1993, 22, 202–224. [Google Scholar] [CrossRef]
- van Putten, I.; MacMillan, A. Making Real Options Really Work. Harv. Bus. Rev. 2004, 82, 134–142. [Google Scholar] [PubMed]
- Mun, J. Real Options Analysis versus Traditional DCF Valuation in Layman’s Terms. In Managing Enterprise Risk: What the Electric Industry Experience Implies for Contemporary Business Elsevier Global Energy Policy and Economics Series; Elsevier: Amsterdam, The Netherlands, 2006; pp. 75–106. [Google Scholar]
- Mun, J. Real Options Analysis: Tools and Techniques for Valuing Strategic Investments and Decisions; John Wiley & Sons: Hoboken, NJ, USA, 2002. [Google Scholar]
- Katritzky, A.R.; Oliferenko, A.; Lomaka, A.; Karelson, M. Six-membered cyclic ureas as HIV-1 protease inhibitors: A QSAR study based on CODESSA PRO approach. Bioorg. Med. Chem. Lett. 2002, 12, 3453–3457. [Google Scholar] [CrossRef]
- Buurman, J.; Zhang, S.; Babovic, V. Reducing Risk through Real Options in Systems Design: The Case of Architecting a Maritime Domain Protection System. Risk Anal. 2009, 29, 366–379. [Google Scholar] [CrossRef] [PubMed]
- Dixit, A.K.; Pindyck, R.S. Investment under Uncertainty; Princeton University Press: Princeton, NJ, USA, 1994. [Google Scholar]
- Triantis, A.; Borison, A. Real Options: State of the Practice. J. Appl. Corp. Financ. 2001, 14, 8–24. [Google Scholar] [CrossRef]
- Pennock, M.J.; Rouse, W.B.; Kollar, D.L. Transforming the Acquisition Enterprise: A Framework for Analysis and a Case Study of Ship Acquisition. Syst. Eng. 2007, 10, 99–117. [Google Scholar] [CrossRef] [Green Version]
- Merton, R.C. Lifetime Portfolio Selection under Uncertainty: The Continuous-Time Case. Rev. Econ. Stat. 1969, 51, 247–257. [Google Scholar] [CrossRef]
- Black, F.; Scholes, M. The Pricing of Options and Corporate Liabilities. J. Political Econ. 1973, 81, 637–654. [Google Scholar] [CrossRef]
- Brennan, M.J.; Schwartz, E.S. Evaluating Natural Resource Investments. J. Bus. 1985, 58, 135–157. [Google Scholar] [CrossRef]
- Mcdonald, R.; Siegel, D. The Value of Waiting to Invest. Q. J. Econ. 1986, 101, 707–727. [Google Scholar] [CrossRef]
- Perlitz, M.; Peske, T.; Schrank, R. Real options valuation: The new frontier in R&D project evaluation? R D Manag. 1999, 29, 255–269. [Google Scholar]
- de Weck, O.L.; de Neufville, R.; Chaize, M. Staged Deployment of Communications Satellite Constellations in Low Earth Orbit. J. Aerosp. Comput. Inf. Commun. 2004, 1, 119–136. [Google Scholar] [CrossRef] [Green Version]
- Wang, T. Real Options in Projects and Systems Design Identification of Options and Solution for Path Dependency. Ph.D. Thesis, Massachusetts Institute of Technology, Cambridge, MA, USA, 2005; p. 337. [Google Scholar]
- Wang, T.; de Neufville, R. Identification of Real Options ‘in’ Projects. INCOSE Int. Symp. 2006, 16, 1124–1133. [Google Scholar] [CrossRef]
- Engel, A.; Browning, T.R. Designing systems for adaptability by means of architecture options. Syst. Eng. 2008, 11, 125–146. [Google Scholar] [CrossRef]
- Giachetti, R.E. A flexible approach to realize an enterprise architecture. Procedia Comput. Sci. 2012, 8, 147–152. [Google Scholar] [CrossRef] [Green Version]
- Benaroch, M.; Kauffman, R.J. A Case for Using Real Options Pricing Analysis to Evaluate Information Technology Project Investments. Inf. Syst. Res. 1999, 10, 70–86. [Google Scholar] [CrossRef] [Green Version]
- Smith, J.E. Alternative Approaches for Solving Real-Options Problems. Decis. Anal. 2005, 2, 89–102. [Google Scholar] [CrossRef]
- Scott, L.O. Option Pricing when the Variance Changes Randomly: Theory, Estimation, and an Application. J. Financ. Quant. Anal. 1987, 22, 419–439. [Google Scholar] [CrossRef]
- Boyle, P.; Broadie, M.; Glasserman, P. Monte Carlo methods for security pricing. J. Econ. Dyn. Control 1997, 21, 1267–1321. [Google Scholar] [CrossRef]
- Cheah, C.Y.J.; Liu, J. Valuing governmental support in infrastructure projects as real options using Monte Carlo simulation. Constr. Manag. Econ. 2006, 24, 545–554. [Google Scholar] [CrossRef]
- Mun, J. Modeling Risk: Applying Monte Carlo Simulation, Real Options Analysis, Forecasting, and Optimization Techniques; John Wiley & Sons: Hoboken, NJ, USA, 2006. [Google Scholar]
- Bashiri, A.; Davison, M.; Lawryshyn, Y. Real Option Valuation Using Simulation and Exercise Boundary Fitting—Extended Abstract. In Proceedings of the 22nd Annual International Real Options Conference, Düsseldorf, Germany, 21–23 June 2018. [Google Scholar]
- Delaurentis, D.; Davendralingam, N. Acquisition Management for System-of-Systems: Requirement Evolution and Acquisition Strategy Planning; Dudley Knox Library: Monterey, CA, USA, 2013. [Google Scholar]
- Komoroski, C.; Housel, T.; Mun, J. A Methodology for Improving the Shipyard Planning Process: Using KVA Analysis, Risk Simulation and Strategic Real Options; Dudley Knox Library: Monterey, CA, USA, 2006. [Google Scholar]
- Pellegrino, R.; Costantino, N.; Tauro, D. Supply Chain Finance: A supply chain-oriented perspective to mitigate commodity risk and pricing volatility. J. Purch. Supply Manag. 2018. [Google Scholar] [CrossRef]
- Ranieri, L.; Mossa, G.; Pellegrino, R.; Digiesi, S. Energy Recovery from the Organic Fraction of Municipal Solid Waste: A Real Options-Based Facility Assessment. Sustainability 2018, 10, 368. [Google Scholar] [CrossRef]
- Habib, M.S.; Sarkar, B.; Habib, M.S.; Sarkar, B. An Integrated Location-Allocation Model for Temporary Disaster Debris Management under an Uncertain Environment. Sustainability 2017, 9, 716. [Google Scholar] [CrossRef]
- Brandão, L.E.; Dyer, J.S.; Hahn, W.J. Using Binomial Decision Trees to Solve Real-Option Valuation Problems. Decis. Anal. 2005, 2, 69–88. [Google Scholar] [CrossRef] [Green Version]
- Long, D.; Johnson, S. The Littoral Combat Ship from Concept to Program Case Studies in National Security Transformation; Office of the Deputy Assistant Secretary of Defense: Pentagon City, VA, USA, 2007.
- Adler, J.; Ahart, J.; Housel, T.; Mun, J. AEGIS Platforms: The Potential Impact of Open Architecture in Sustaining Engineering; Dudley Knox Library: Monterey, CA, USA, 2007. [Google Scholar]
- Angelis, D.I.; Ford, D.; Dillard, J. Real Options in Military System Acquisition: The Case Study of Technology Development for the Javelin Anti-Tanl Weapon System; Naval Postgraduate School: Monterey, CA, USA, 2012. [Google Scholar]
- Trigeorgis, L. Real Options: Managerial Flexibility and Strategy in Resource Allocation; MIT press: Cambridge, MA, USA, 1996. [Google Scholar]
- Chang, S.J.F.; Backus, G.R. Applying real options to flexible systems engineering: A proof-of-concept study on capability acquisition of tactical data LINKS. In Proceedings of the 1st Annual 2007 IEEE Systems Conference, Honolulu, HI, USA, 9–12 April 2007; pp. 271–277. [Google Scholar]
- South Korea’s K2 Tank to run on German Transmission. Defense News, 14 February 2018.
- Lee, P.; Song, G. Economical Effect of Maneuver Weapon Systems Development; Korea National Defense University: Seoul, Korea, 2009. [Google Scholar]
- Kim, J. A Research Comparing Domestically Developed Weapon System and Overseas Purchase; Kookmin University: Seoul, Korea, 2015. [Google Scholar]
- Kim, K.; Baek, S.; Baek, Y.; Kim, H.; Park, S. A Study on Preliminary Feasibility Study Standard Guide of Airport Busuness Field, 3rd ed.; Korea Development Institute: Sejong, Korea, 2014. [Google Scholar]
- Hwang, S. Methodology of Economic Assessment for Classified R&D Programs; Science & Technology Policy Institute: Seoul, Korea, 2006. [Google Scholar]
- Anderloni, F.; Vangelista, L. Project Valuation Using Real Options Analysis; Department of Information Engineering: Hong Kong, China, 2011. [Google Scholar]
- Lee, Y. Application of Real Option Analysis Method in Preliminary Feasibility Study of National R&D Project; Korea Institute of Science & Technology Evaluation and Planning: Seoul, Korea, 2008. [Google Scholar]


| Risks | Development | Technology Introduction | Purchase | |
|---|---|---|---|---|
| R&D | ||||
| Technology Risk | Engine | High | Very Low | None |
| Transmission | High | Very Low | None | |
| Schedule Risk | Engine | High | Very Low | None |
| Transmission | High | Very Low | None | |
| Budget Risk | Engine | High | Very Low | None |
| Transmission | High | Very Low | None | |
| Market | ||||
| Quantity Risk | Engine | Medium | Medium | Medium |
| Transmission | Medium | Medium | Medium | |
| Acquisition Method | Items | Unit Price ($M) | Domestic Production | Export Production | Total Cost ($M) (All Costs or Benefits Are in the Millions.) |
|---|---|---|---|---|---|
| Development | Engine | 0.50 | 680 (748) ** | 200 | |
| Transmission | 0.60 | 680 (748) | 200 | $822.8M | |
| Technology Introduction * | Engine | 0.50 | 680 (748) | - | |
| Transmission | 0.60 | 680 (748) | - | $822.8M | |
| Purchase | Engine | 0.90 | 680 (748) | - | |
| Transmission | 0.50 | 680 (748) | - | $1047.2M |
| Alternatives ($M) | R&D Cost (A) | Direct Savings Due to Lower Unit Cost (B) | Indirect Savings Due to Export Sales (C) | Total Savings (D = B + C − A) | |
|---|---|---|---|---|---|
| Development | Engine | 53 | 224.4 = (0.40 − 0.10) × 748 | 199.8 = 224.4 + 75.4 − 100 | |
| Transmission | 47 | ||||
| Technology Introduction | Engine | 53 | 224.4 = (0.40 − 0.10) × 748 | - | 124.4 = 224.4 − 100 |
| Transmission | 47 | ||||
| Purchase | Engine | - | - | - | - |
| Transmission | - | - | - | - | |
| Uncertainties | Expected Value | Actual Value | Remarks | |
|---|---|---|---|---|
| R&D | ||||
| Technology Risk | Engine | 80% Success Possibility | 100% | Succeed in 2015 |
| Transmission | 0% | Failed in 2017 | ||
| Schedule Risk | Engine | 6 Years (2005–2010) | 11 Years (2005–2015) | - First Extension: ~2011 - Second Extension: ~2012 - Third Extension: ~2014 - Delayed: ~2017 |
| Transmission | 13 Years (2005–2017) | |||
| Budget Risk | Engine | $53M | $93M = 53M + 8 × 5M | Additional Cost - $ 8M/year |
| Transmission | $47M | $96M = 47 + 7 × 7 | - $ 7M/year | |
| Market | ||||
| Quantity Risk | Engine | 680 Units (748) * | 306 Units (331) | K2 Tank Production Plan - First Production: 100 (Until 2015) ** - Second Production: 106 (Until 2020) - Second Production: 106 (Until 2020) |
| Transmission | ||||
| Alternatives ($M) | R&D Cost (A) | Direct Savings Compared to Purchasing (B) | Indirect Savings Due to Export Sales (C), Discount Rate 5.5% | Total Savings (D = B + C − A) | |
|---|---|---|---|---|---|
| Development | Engine | 93 | 88.4 = 0.40 × 221 | −59.5 = 88.4 + 41.1 − 93 − 96 | |
| Transmission | 96 | - | - | ||
| Technology Introduction * | Engine | 53 | 88.4 = 0.40 − 221 | - | 35.4 = 88.4 − 53 |
| Transmission | - | - | - | - | |
| Purchase | Engine | - | - | - | - |
| Transmission | - | - | - | - | |
| Items | Quantity | Development | Technology Introduce | Development and Technology Introduction | Reduced Development | ||||||||||
|---|---|---|---|---|---|---|---|---|---|---|---|---|---|---|---|
| Extension Years | |||||||||||||||
| 0 | 1 | 2 | 3 | 4 | 5 | 6 | 7 | 8 | 9 | 10 | 0 | 2 | 2 | ||
| Domestic Production | High | 800 | 780 | 760 | 740 | 720 | 700 | 680 | 660 | 640 | 620 | 600 | 800 | 760 | 760 |
| Medium | 400 | 380 | 360 | 340 | 320 | 300 | 280 | 260 | 240 | 220 | 200 | 400 | 360 | 360 | |
| Small | 200 | 180 | 160 | 140 | 120 | 100 | 80 | 60 | 40 | 20 | 0 | 200 | 160 | 160 | |
| Benefit per unit | 0.3 | 0.3 | 0.3 | 0.3 | 0.3 | 0.3 | 0.3 | 0.3 | 0.3 | 0.3 | 0.3 | 0.3 | 0.3 | 0.3 | |
| Cost | 100 | 115 | 130 | 145 | 160 | 175 | 190 | 205 | 220 | 235 | 250 | 100 | 130 | 130 | |
| Discount rate | 5.50% | ||||||||||||||
| Export | High | 200 | 195 | 190 | 185 | 180 | 175 | 170 | 165 | 160 | 155 | 150 | - | - | - |
| Medium | 100 | 95 | 90 | 85 | 80 | 75 | 70 | 65 | 60 | 55 | 50 | - | - | - | |
| Small | 50 | 45 | 40 | 35 | 30 | 25 | 20 | 15 | 10 | 5 | 0 | - | - | - | |
| Powerpack Benefit | Development | Technology Introduction | ||||||||||
|---|---|---|---|---|---|---|---|---|---|---|---|---|
| Extension Year | ||||||||||||
| 0 | 1 | 2 | 3 | 4 | 5 | 6 | 7 | 8 | 9 | 10 | 0 (Year) | |
| Min | −19.71 | −49.52 | −66.54 | −81.25 | −94.60 | −106.65 | −116.43 | −125.34 | −134.12 | −140.50 | −146.03 | −39.54 |
| 25% Percentile | 38.64 | −1.38 | −21.12 | −38.42 | −53.78 | −67.74 | −79.89 | −90.47 | −100.80 | −108.95 | −116.22 | 5.02 |
| Median | 78.41 | 31.41 | 9.80 | −8.30 | −25.52 | −42.00 | −54.55 | −66.89 | −77.88 | −86.94 | −94.86 | 34.87 |
| Mean | 83.81 | 36.10 | 14.10 | −4.41 | −22.21 | −38.05 | −51.38 | −63.81 | −74.57 | −84.30 | −92.38 | 38.99 |
| 75% Percentile | 155.36 | 94.91 | 69.71 | 47.23 | 27.86 | 10.10 | −6.80 | −20.73 | −34.16 | −45.85 | −56.60 | 94.15 |
| Max | 213.71 | 143.05 | 115.12 | 90.06 | 68.69 | 49.01 | 29.74 | 14.14 | −0.83 | −14.30 | −26.79 | 138.71 |
| 0 Benefit Percent | 2% | 20% | 40% | 58% | 73% | 85% | 93% | 98% | 100% | 100% | 100% | 16% |
| Standard Deviation | 49.27 | 40.41 | 38.23 | 36.41 | 34.50 | 33.04 | 31.07 | 29.65 | 27.87 | 26.39 | 25.14 | 37.63 |
| Powerpack B/C | Development | Technology Introduction | ||||||||||
|---|---|---|---|---|---|---|---|---|---|---|---|---|
| Extension Year | ||||||||||||
| 0 | 1 | 2 | 3 | 4 | 5 | 6 | 7 | 8 | 9 | 10 | 0 (Year) | |
| Min | −0.21 | −0.36 | −0.46 | −0.54 | −0.59 | −0.63 | −0.65 | −0.67 | −0.68 | −0.69 | −0.69 | −0.39 |
| 25% Percentile | 0.38 | 0.13 | −0.05 | −0.18 | −0.28 | −0.35 | −0.41 | −0.45 | −0.48 | −0.51 | −0.53 | 0.05 |
| Median | 0.78 | 0.47 | 0.24 | 0.05 | −0.07 | −0.17 | −0.24 | −0.30 | −0.35 | −0.39 | −0.42 | 0.36 |
| Mean | 0.83 | 0.51 | 0.27 | 0.09 | −0.04 | −0.14 | −0.22 | −0.29 | −0.33 | −0.37 | −0.40 | 0.40 |
| 75% Percentile | 1.55 | 1.10 | 0.77 | 0.53 | 0.34 | 0.19 | 0.07 | −0.02 | −0.09 | −0.16 | −0.21 | 0.94 |
| Max | 2.13 | 1.59 | 1.17 | 0.88 | 0.65 | 0.46 | 0.31 | 0.20 | 0.11 | 0.02 | −0.05 | 1.39 |
| 0 B/C Percent | 3% | 11% | 24% | 43% | 59% | 73% | 84% | 92% | 97% | 100% | 100% | 16% |
| Standard Deviation | 0.49 | 0.41 | 0.35 | 0.30 | 0.26 | 0.23 | 0.20 | 0.18 | 0.16 | 0.15 | 0.13 | 0.38 |
| Items | Development Period (Years) | ||||||||||
|---|---|---|---|---|---|---|---|---|---|---|---|
| Quantity | 6 | 7 | 8 | 9 | 10 | 11 | 12 | 13 | 14 | 15 | 16 |
| Low | P | P | P | P | P | P | P | P | P | P | P |
| Medium | P | P | P | P | P | P | P | P | P | P | P |
| High | D | D | T | T | T | T | T | T | T | T | T |
| Powerpack Benefit | Extended R&D | Development and Technology Introduction | Reduced Development | ||
|---|---|---|---|---|---|
| 1-Year | 2-Year | 3-Year | 2-Year | 2-Year | |
| Min | −49.52 | −66.54 | −81.25 | −110.78 | −66.99 |
| 25% Percentile | −1.38 | −21.12 | −38.42 | −66.55 | −22.95 |
| Median | 31.41 | 9.80 | −8.30 | −36.78 | 7.72 |
| Mean | 36.10 | 14.10 | −4.41 | −32.58 | 11.15 |
| 75% Percentile | 94.91 | 69.71 | 47.23 | 21.90 | 65.14 |
| Max | 143.05 | 115.12 | 90.06 | 66.12 | 109.19 |
| 0 Benefit Percent | 20% | 40% | 58% | 79% | 43% |
| Standard Deviation | 40.41 | 38.23 | 36.41 | 37.51 | 37.29 |
| Approach | Analysis Target | Economic Analysis | Flexibility with Uncertainty | Decision-Making Support | Exit Strategy in a Project |
|---|---|---|---|---|---|
| Old |
| N/A (only cost-effectiveness analysis) | N/A |
| N/A |
| New (in this paper) |
|
|
|
|
|
© 2018 by the authors. Licensee MDPI, Basel, Switzerland. This article is an open access article distributed under the terms and conditions of the Creative Commons Attribution (CC BY) license (http://creativecommons.org/licenses/by/4.0/).
Share and Cite
Kim, S.; Giachetti, R.; Park, S. Real Options Analysis for Acquisition of New Technology: A Case Study of Korea K2 Tank’s Powerpack. Sustainability 2018, 10, 3866. https://doi.org/10.3390/su10113866
Kim S, Giachetti R, Park S. Real Options Analysis for Acquisition of New Technology: A Case Study of Korea K2 Tank’s Powerpack. Sustainability. 2018; 10(11):3866. https://doi.org/10.3390/su10113866
Chicago/Turabian StyleKim, Sungchul, Ronald Giachetti, and Sangsung Park. 2018. "Real Options Analysis for Acquisition of New Technology: A Case Study of Korea K2 Tank’s Powerpack" Sustainability 10, no. 11: 3866. https://doi.org/10.3390/su10113866
APA StyleKim, S., Giachetti, R., & Park, S. (2018). Real Options Analysis for Acquisition of New Technology: A Case Study of Korea K2 Tank’s Powerpack. Sustainability, 10(11), 3866. https://doi.org/10.3390/su10113866