Rainwater Harvesting as a Drinking Water Option for Mexico City

Abstract
:1. Introduction
2. Materials and Methods
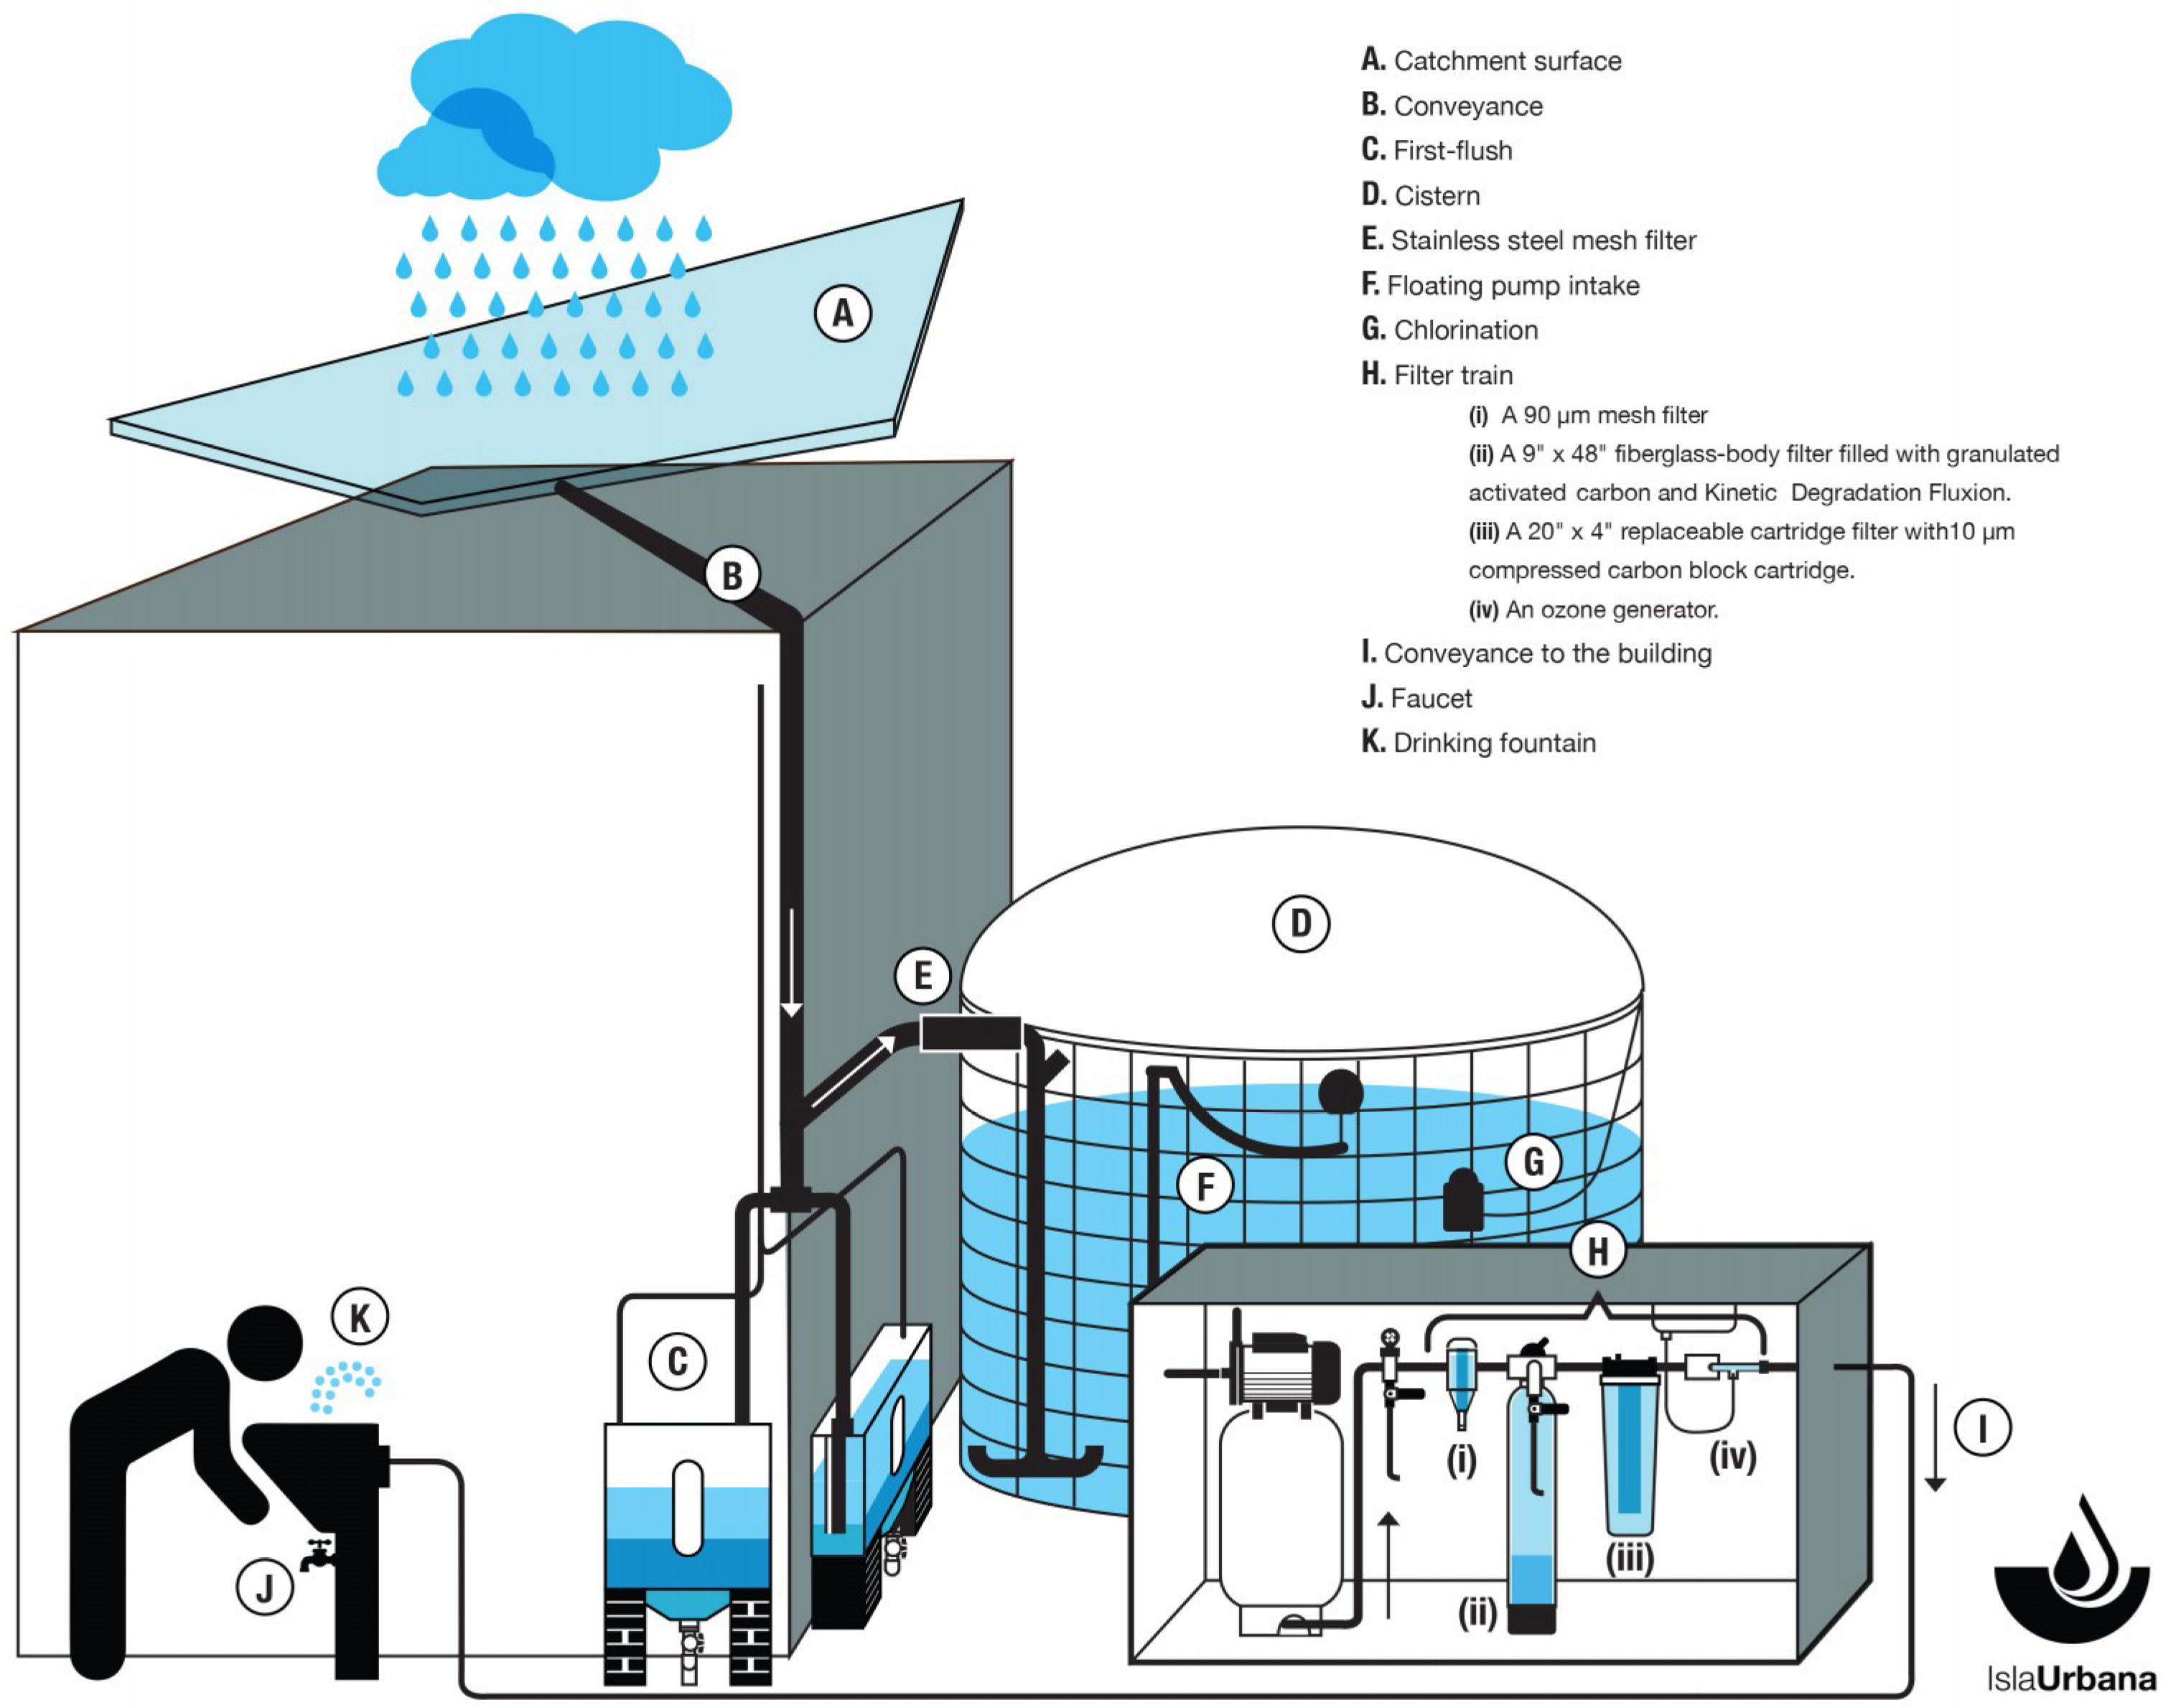
2.1. Description of the RWH System
- A. Catchment surface. This is a surface of tempered glass that covers the inner courtyard of the building. The roof is approximately 193.22 m2 and the water is channeled through a system of galvanized steel gutters.
- B. Conveyance. The water is transported through polypropylene pipes.
- C. First-flush. Two identical first-flush units developed by Isla Urbana called Tlaloques are used to divert the initial 400 L of precipitation during a rainfall event to wash the roof before water is allowed into the tank.
- D. Cistern. Made from a high-density polyethylene geomembrane contained in a galvanized steel mesh, the cistern has a 30,000 L capacity. The inlet of the cistern has a turbulence-reducing device fitted to reduce the disturbance of sedimented particles at the bottom by incoming water.
- E. Stainless steel mesh filter. Apertures are sized 1 × 2 mm to eliminate leaves and larger debris.
- F. Floating pump intake. Water is extracted from the tank through a pump connected to a floating intake inside the cistern, to draw water from a depth of about 25 cm below the surface level, avoiding the bottom of the tank, where sediments and other contaminants settle.
- G. Chlorination. Inside the cistern, a floating device with capacity for one tablet of 200 g, is used to dispense chlorine from tablets containing 65% of calcium hypochlorite, added every three months.
- H. Filter train. The cistern outflow passes through a filter train consisting of the following elements:
- (i)
- A 90 µm mesh filter.
- (ii)
- A 9″ × 48″ fiberglass body filter filled with granulated activated carbon and Kinetic Degradation Fluxion (KDF), an alloy of copper and zinc used in water purifiers.
- (iii)
- A 20″ × 4″ replaceable cartridge filter with a 10 µm compressed carbon block cartridge.
- (iv)
- An ozone generator.
- I. Conveyance to the building. The water continues from the filters to the drinking fountains, along two potable-grade polypropylene lines with fully thermo-fused joints and couplings to prevent leakage or contamination entry.
- J. Faucet.
- K. Drinking fountain. As a last stage of treatment, the drinking fountains have a filter train consisting of a 5-micron sediments filter and 3-micron compressed active carbon filter, impregnated with colloidal silver as a final disinfectant.
2.2. Sampling and Analysis
3. Results and Discussion
4. Conclusions
Author Contributions
Funding
Acknowledgments
Conflicts of Interest
References
- Rahman, A. Recent Advances in Modelling and Implementation of Rainwater Harvesting Systems towards Sustainable Development. Water 2017, 9, 595. [Google Scholar] [CrossRef]
- McDonald, R.I.; Weber, K.; Padowski, J.; Flörke, M.; Schneider, C.; Green, P.A.; Gleeson, T.; Eckman, S.; Lehner, B.; Balk, D.; et al. Water on an urban planet: Urbanization and the reach of urban water infrastructure. Glob. Environ. Chang. 2014, 27, 96–105. [Google Scholar] [CrossRef] [Green Version]
- CONAGUA (Comisión Nacional del Agua). Estadísticas del Agua en México, Edición 2016, 1st ed.; Secretaríade Medio Ambiente y Recursos Naturales: Ciudad de México, Mexico, 2016; pp. 118–121. [Google Scholar]
- Banco Mundial. Agua urbana en el Valle de México: ¿Un Camino verde para Mañana? 1st ed.; Banco Mundial: Washington, DC, USA, 2013; p. 92. [Google Scholar]
- Romero Lankao, P. Water in Mexico City: What will climate change bring to its history of water-related hazards and vulnerabilities? Environ. Urban. 2010, 22, 157–178. [Google Scholar] [CrossRef]
- INEGI (Instituto Nacional de Estadística y Geografía). Available online: http://www3.inegi.org.mx/sistemas/temas/default.aspx?s=est&c=21385 (accessed on 6 June 2018).
- Muller, M. Adapting to climate change: Water management for urban resilience. Environ. Urban. 2007, 19, 99–113. [Google Scholar] [CrossRef]
- Moreno-Mata, A.; Villasis-Keever, R.; Morató, J. Climatic change, management of water rain and flood risk in the metropolitan area of San Luis Potosí, México. In Urban Resilience for Risk and Adaptation Governance; Brunetta, G., Caldarice, O., Tollin, N., Rosas-Casals, M., Morato, J., Eds.; Springer: New York, NY, USA, 2018. [Google Scholar]
- Molina, L.T.; Molina, M.J. Air Quality in the Mexico Megacity: An Integrated Assesment; Kluwer Academic Publishers: Dordrecht, The Netherlands, 2002. [Google Scholar]
- APHA (American Public Health Association); AWWA (American Water Works Association); WEF (Water Environment Federation); Eaton, A.D. Standard Methods for the Examination of Water and Wastewater; de Edición, N., Ed.; APHA; AWWA; WEF: Washington, DC, USA, 2005; ISBN 0-87553-047-8. [Google Scholar]
- Secretaría de Salud Modificación a la Norma Oficial Mexicana NOM-127-SSA1-1994 (2000). Salud Ambiental. Agua Para uso y Consumo Humano. Límites Permisibles de Calidad y Tratamientos a que se Debe Someter el Agua Para su Potabilización. Available online: http://www.salud.gob.mx/unidades/cdi/nom/m127ssa14.html (accessed on 7 June 2018).
- United States Environmental Protection Agency National Primary Drinking Water Regulations. Available online: https://www.epa.gov/sites/production/files/2016-06/documents/npwdr_complete_table.pdf (accessed on 7 June 2018).
- WHO (World Health Organization). Guidelines for Drinking-Water Quality. Available online: http://apps.who.int/iris/bitstream/10665/44584/1/9789241548151_eng.pdf (accessed on 8 June 2018).
- García, R.; Belmont, R.; Padilla, H.; Torres, M.C.; Báez, A. Trace metals and inorganic ion measurements in rain from Mexico City and a nearby rural area. Chem. Ecol. 2009, 25, 71–86. [Google Scholar] [CrossRef]
- Báez, A.; Belmont, R.; García, R.; Padilla, H.; Torres, M.C. Chemical composition of rainwater collected at a southwest site of Mexico City, Mexico. Atmos. Res. 2007, 86, 61–75. [Google Scholar] [CrossRef]
- Estupiñán-Day, S.V.; Heriberto; Duchon, K.; Soto Navarro, P.R.; Vega Gleason, S. Final report Task force meeting: Defluoridation systems for Latin America and the Caribbean. In Task Force Meeting Defluoridation Systems for Latin America and the Caribbean; Pan American Health Organization, Ed.; Pan American Health Organization: Washington, DC, USA, 2005; p. 81. [Google Scholar]
- Armienta, M.A.; Segovia, N. Arsenic and fluoride in the groundwater of Mexico. Environ. Geochem. Health 2008, 30, 345–353. [Google Scholar] [CrossRef] [PubMed]
- Grimaldo, M.; Borja-Aburto, V.H.; Ramírez, A.L.; Ponce, M.; Rosas, M.; Díaz-Barriga, F. Endemic fluorosis in San Luis Potosi, Mexico. I. Identification of risk factors associated with human exposure to fluoride. Environ. Res. 1995, 68, 25–30. [Google Scholar] [CrossRef] [PubMed]
- Alarcón-Herrera, M.; Martin-Dominguez, I.; Trejo-Vazquez, R.; Dozal, S. Well water fluoride, dental fluorosis, and bone fractures in the Guadiana Valley of Mexico. Fluoride 2001, 34, 139–149. [Google Scholar]
- Valdez Jimenez, L.; Lopez Guzman, O.D.; Cervantes Flores, M.; Costilla-Salazar, R.; Calderon Hernandez, J.; Alcaraz Contreras, Y.; Rocha-Amador, D.O. In utero exposure to fluoride and cognitive development delay in infants. Neurotoxicology 2017, 59, 65–70. [Google Scholar] [CrossRef] [PubMed]
- Morales-Arredondo, I.; Rodríguez, R.; Armienta, M.A.; Villanueva-Estrada, R.E. The origin of groundwater arsenic and fluorine in a volcanic sedimentary basin in central Mexico: A hydrochemistry hypothesis. Hydrogeology 2016, 24, 1029–1044. [Google Scholar] [CrossRef]
- Sampayo-Reyes, A.; Hernández, A.; El-Yamani, N.; López-Campos, C.; Mayet-Machado, E.; Rincón-Castañeda, C.B.; Limones-Aguilar, M.L.; López-Campos, J.E.; de León, M.B.; González-Hernández, S.; et al. Arsenic induces DNA damage in environmentally exposed Mexican children and adults. Influence of GSTO1 and AS3MT polymorphisms. Toxicol. Sci. 2010, 117, 63–71. [Google Scholar] [CrossRef] [PubMed]
- Camacho, L.M.; Gutiérrez, M.; Alarcón-Herrera, M.T.; Villalba, M.D.L.; Deng, S. Occurrence and treatment of arsenic in groundwater and soil in northern Mexico and southwestern USA. Chemosphere 2011, 83, 211–225. [Google Scholar] [CrossRef] [PubMed]
- Del Razo, L.M.; García-Vargas, G.G.; Valenzuela, O.L.; Castellanos, E.H.; Sánchez-Peña, L.C.; Currier, J.M.; Drobná, Z.; Loomis, D.; Stýblo, M. Exposure to arsenic in drinking water is associated with increased prevalence of diabetes: A cross-sectional study in the Zimapán and Lagunera regions in Mexico. Environ. Health 2011, 10, 73. [Google Scholar] [CrossRef] [PubMed]
- Currier, J.M.; Ishida, M.C.; González-Horta, C.; Sánchez-Ramírez, B.; Ballinas-Casarrubias, L.; Gutiérrez-Torres, D.S.; Cerón, R.H.; Morales, D.V.; Terrazas, F.A.B.; Del Razo, L.M.; et al. Associations between Arsenic Species in Exfoliated Urothelial Cells and Prevalence of Diabetes among Residents of Chihuahua, Mexico. Environ. Health Perspect. 2014, 122, 1088–1094. [Google Scholar] [CrossRef] [PubMed] [Green Version]
- Canter, L.W. Nitrate in Groundwater; Lewis Publishers: Boca Raton, FL, USA, 1997. [Google Scholar]
- Muñoz, H.; Armienta, M.A.; Vera, A.; Ceniceros, N. Nitrato en el agua subterránea del Valle de Huamantla, Tlaxcala, México. Rev. Int. Contam. Ambient. 2004, 20, 91–97. [Google Scholar]
- Almasri, M.N. Nitrate contamination of groundwater: A conceptual management framework. Environ. Impact Assess. Rev. 2007, 27, 220–242. [Google Scholar] [CrossRef]
- Ryan, M.C. An investigation of inorganic nitrogen compounds in the groundwater in the Valley of Mexico. Geofis. Int. 1989, 28, 417–433. [Google Scholar]
- Edmunds, W.; Carrillo-Rivera, J.; Cardona, A. Geochemical evolution of groundwater beneath Mexico City. J. Hydrol. 2002, 258, 1–24. [Google Scholar] [CrossRef]
- Montiel-Palma, S.; Armienta Hernández, M.A.; Rodríguez Castillo, R.; Domínguez Mariani, E. Identificación de zonas de contaminación por nitratos en el agua subterránea de la zona sur de la Cuenca de México. Rev. Int. Contam. Ambient. 2014, 30, 149–165. [Google Scholar]
- Querol, X.P.; Pey, J.; Minguillón, M.C.; Pérez, N.; Alastuey, A.; Viana, M.; Moreno, T. PM Speciation and sources in Mexico during the MILAGRO-2006 Campaing. Atmos. Chem. Phys. 2008, 8, 111–128. [Google Scholar] [CrossRef]
- Molina, L.T.M.; Madronich, S.; Gaffney, J.S.; Apel, E.; de Foy, B.; Fast, J.; Ferrare, R.; Herndon, S.; Jimenez, J.L.; Lamb, B.; et al. An overview of the MILAGRO 2006 Campaign: Mexico City emissions and their transport and transformation. Atmos. Chem. Phys. 2010, 10, 8697–8760. [Google Scholar] [CrossRef] [Green Version]
- Abbasi, T.; Abbasi, S.A. Sources of Pollution in Rooftop Rainwater Harvesting Systems and Their Control. Crit. Rev. Environ. Sci. Technol. 2011, 41, 2097–2167. [Google Scholar] [CrossRef]
- WHO (World Health Organization). Sulfate in Drinking-Water: Background Document for Development of WHO Guidelines for Drinking-Water Quality. Available online: http://www.who.int/water_sanitation_health/dwq/chemicals/sulfate.pdf (accessed on 20 June 2018).
- Báez, A.P.; Belmont, R.D.; García, R.M.; Torres, M.C.B.; Padilla, H.G. Rainwater chemical composition at two sites in Central Mexico. Atmos. Res. 2006, 80, 67–85. [Google Scholar] [CrossRef]


| Parameters | Average | Maximum | Minimum | Standard Deviation | Mexican Drinking Water Standards | USEPA National Drinking Water Regulations | WHO Guidelines for Drinking Water Quality |
|---|---|---|---|---|---|---|---|
| Temperature °C | 16.49 | 20.20 | 8.80 | 2.20 | |||
| pH In situ | 6.36 | 8.26 | 4.11 | 0.94 | |||
| Conductivity μS/cm | 79.14 | 191.00 | 44.00 | 24.59 | |||
| Alkalinity (as CaCO3 mg/L) | 6.14 | 55.9 | 0.0 | 10.66 | |||
| pH Lab | 6.22 | 7.61 | 4 | 0.99 | 6.5–8.5 | 6.5–8.5 * | |
| HCO3− mg/L | 13.80 | 68.2 | 0.0 | 12.33 | |||
| SO42− mg/L | 16.75 | 23.90 | b.d.l. ˠ | 400 | 250 * | ||
| Cl− mg/L | 11.34 | 17.10 | 2.00 | 3.87 | 250 | 250 * | |
| F− mg/L | 0.07 | 0.21 | 0.04 | 0.03 | 1.5 | 4 | 1.5 |
| Na+ mg/L | 2.20 | 6.40 | b.d.l. | 200 | 50 | ||
| K+ mg/L | 0.50 | 0.5 | b.d.l. | ||||
| Total hardness as CaCO3 mg/L (Calcium carbonate) | 28.24 | 56.4 | 6.5 | 7.69 | 500 | ||
| Ca2+ mg/L | 8.47 | 14.5 | 2.6 | 2.10 | |||
| Mg2+ mg/L | 1.82 | 4.9 | b.d.l. | ||||
| SiO2 mg/L | 2.32 | 8.3 | b.d.l. | ||||
| NO3− mg/L | 1.90 | 4.3 | b.d.l. | 50 | |||
| Nitrates (as N mg/L) | 0.48 | 1.0 | b.d.l. | 10 | 10 | ||
| As mg/L | 0.003 | 0.004 | b.d.l. | 0.025 | 0.01 | 0.01 | |
| Pb mg/L | 0.002 | 0.010 | b.d.l. | 0.01 | 0.015 | 0.01 | |
| Cu mg/L | 0.106 | 0.160 | b.d.l. | 2 | 1.3 | 2 | |
| Zn mg/L | 0.468 | 1.16 | b.d.l. | 5 | 5 * | ||
| Fe mg/L | 0.089 | 0.20 | b.d.l. | 0.3 | 0.3 * | ||
| Al mg/L | 0.042 | 0.207 | b.d.l. | 0.2 | 0.05 to 0.2 * | ||
| Cr(VI) mg/L | b.d.l. | b.d.l. | b.d.l. | 0.05 (total chromium) | 0.1 (total chromium) | 0.05 (total chromium) | |
| TDS mg/L | 52.71 | 103.00 | 24.00 | 16.73 | 1000 | 500 * |
| Parameters | Aug 2014 | Sept 2014 | Nov 2014 | Jan 2015 | Mar 2015 | Apr 2015 | May 2015 | June 2015 | Aug 2015 | Sept 2015 | Nov 2015 | Average | Maximum | Minimum | Standard Deviation | Báez et al., 2007 (μeq/L) | García et al., 2009 (mg/L) |
|---|---|---|---|---|---|---|---|---|---|---|---|---|---|---|---|---|---|
| Temperature °C | 17.7 | 18.5 | 16.8 | 16.2 | 18.6 | 20.2 | 19 | 15.3 | 18.7 | 16.7 | 18.6 | 17.85 | 20.20 | 15.30 | 1.44 | ||
| pH In situ | 4.48 | 4.11 | 5.06 | 5.56 | 5.78 | 5.5 | 5.3 | 6.99 | 5.44 | 5.03 | 6.12 | 5.40 | 6.99 | 4.11 | 0.77 | ||
| Conductivity in μS/cm | 48 | 54 | 52 | 68 | 63 | 65 | 69 | 89 | 74 | 80 | 93 | 68.64 | 93 | 48 | 14.59 | ||
| Alkalinity (as CaCO3 mg/L) | 0.0 | 2.0 | 2.0 | 4.2 | 4.0 | 5.2 | 3.7 | 7.4 | 4.2 | 4.0 | 5.0 | 3.79 | 7.4 | 0.0 | 1.94 | ||
| pH Lab | 4.28 | 4 | 4.5 | 4.9 | 5.4 | 5.4 | 6.14 | 7.11 | 5.44 | 5.19 | 6.12 | 5.32 | 7.11 | 4 | 0.91 | 5.08 | 5.75 |
| HCO3− mg/L | 0 | 2.4 | 2.5 | 5.2 | 4.9 | 6.4 | 4.5 | 9 | 5.77 | 4.86 | 6.13 | 4.70 | 9 | 0 | 2.39 | ||
| SO42− mg/L | b.d.l. ˠ | b.d.l. | b.d.l. | b.d.l. | b.d.l. | b.d.l. | b.d.l. | b.d.l. | b.d.l. | b.d.l. | b.d.l. | b.d.l. | b.d.l. | b.d.l. | 61.9 | 2.37 | |
| Cl− mg/L | 5.3 | 5.7 | 7.4 | 8.4 | 10.4 | 11.4 | 11.7 | 16.2 | 13 | 13.2 | 13.7 | 10.58 | 16.2 | 5.3 | 3.50 | 9.6 | 0.38 |
| F− mg/L | 0.06 | 0.06 | 0.06 | 0.06 | 0.08 | 0.07 | 0.07 | 0.04 | 0.07 | 0.05 | 0.06 | 0.06 | 0.08 | 0.04 | 0.011 | ||
| Na+ mg/L | b.d.l. | b.d.l. | 1.2 | 1.8 | 1.9 | 1.8 | 1.8 | 2.9 | 2 | 2.3 | 3 | 3 | b.d.l. | 7.0 | 0.31 | ||
| K+ mg/L | b.d.l. | b.d.l. | b.d.l. | b.d.l. | b.d.l. | b.d.l. | b.d.l. | b.d.l. | b.d.l. | b.d.l. | b.d.l. | b.d.l. | b.d.l. | b.d.l. | 2.2 | 0.09 | |
| Total hardness as CaCO3 mg/L | 6.5 | 14.8 | 20 | 25 | 27.8 | 25.1 | 25.8 | 32.7 | 24.4 | 23.4 | 29.8 | 23.21 | 32.7 | 6.5 | 7.28 | ||
| Ca2+ mg/L | 2.6 | 5.9 | 6.4 | 7 | 8 | 8.4 | 7.7 | 10.6 | 8.1 | 7.7 | 9.8 | 7.47 | 10.6 | 2.6 | 2.11 | 26.4 | 0.2 |
| Mg2+ mg/L | b.d.l. | b.d.l. | 1.0 | 1.8 | 1.9 | 1.0 | 1.6 | 1.5 | 1.0 | 1.0 | 1.3 | 1.9 | b.d.l. | 2.5 | 0.04 | ||
| SiO2 mg/L | b.d.l. | b.d.l. | b.d.l. | b.d.l. | b.d.l. | b.d.l. | b.d.l. | b.d.l. | b.d.l. | b.d.l. | b.d.l. | b.d.l. | b.d.l. | b.d.l. | |||
| NO3− mg/L | 3.1 | 3 | 2.7 | 3.4 | 2.5 | 3.3 | 3.3 | 4 | 3.1 | 2.9 | 2.8 | 3.10 | 4 | 2.5 | 0.405 | 42.6 | 2.064 |
| Nitrates (as N mg/L) | 0.70 | 0.67 | 0.60 | 0.80 | 0.60 | 0.80 | 0.74 | 0.90 | 0.60 | 0.60 | 0.70 | 0.9 | 0.60 | 0.107 | |||
| As mg/L | b.d.l. | b.d.l. | b.d.l. | b.d.l. | b.d.l. | b.d.l. | b.d.l. | b.d.l. | b.d.l. | b.d.l. | 0.0013 | 0.0013 | b.d.l. | ||||
| Pb mg/L | 0.003 | b.d.l. | b.d.l. | b.d.l. | b.d.l. | 0.002 | b.d.l. | 0.000 | b.d.l. | 0.002 | 0.001 | 0.003 | b.d.l. | 0.00541 | |||
| Cu mg/L | b.d.l. | b.d.l. | b.d.l. | 0.06 | b.d.l. | b.d.l. | b.d.l. | b.d.l. | 0.13 | b.d.l. | b.d.l. | 0.13 | b.d.l. | ||||
| Zn mg/L | 0.26 | 0.27 | 0.24 | 0.25 | 0.24 | 0.26 | 0.28 | 0.27 | 0.32 | 0.34 | 0.3 | 0.28 | 0.34 | 0.24 | 0.032 | ||
| Fe mg/L | 0.06 | b.d.l. | b.d.l. | b.d.l. | b.d.l. | 0.11 | 0.11 | 0.11 | 0.15 | b.d.l. | 0.14 | 0.15 | b.d.l. | 0.07734 | |||
| Al mg/L | 0.050 | 0.044 | 0.037 | 0.022 | 0.041 | 0.027 | 0.029 | 0.001 | 0.026 | 0.065 | 0.018 | 0.033 | 0.065 | 0.001 | 0.017 | 0.08394 | |
| Cr(VI) mg/L | b.d.l. | b.d.l. | b.d.l. | b.d.l. | b.d.l. | b.d.l. | b.d.l. | b.d.l. | b.d.l. | b.d.l. | b.d.l. | b.d.l. | b.d.l. | b.d.l. | 0.00124 | ||
| TDS mg/L | 24 | 45 | 28 | 46 | 32 | 45 | 66 | 86 | 40 | 40 | 57 | 46.27 | 86 | 24 | 17.883 |
| Parameters | Aug 2014 | Sept 2014 | Nov 2014 | Jan 2015 | Mar 2015 | Apr 2015 | May 2015 | June 2015 | Aug 2015 | Sept 2015 | Nov 2015 | Average | Maximum | Minimum | Standard Deviation |
|---|---|---|---|---|---|---|---|---|---|---|---|---|---|---|---|
| Temperature °C | 8.8 | 15 | 13.3 | 14.7 | 9.4 | 18.2 | 14.6 | 14.8 | 16.7 | 14.2 | 15.5 | 14.11 | 18.2 | 8.8 | 2.80 |
| pH In situ | 8.02 | 7.45 | 7.66 | 7.05 | 7.36 | 6.92 | 7 | 6.76 | 6.69 | 6.71 | 6.87 | 7.14 | 8.02 | 6.69 | 0.43 |
| Conductivity in μS/cm | 191 | 77 | 69 | 77 | 78 | 75 | 72 | 101 | 89 | 82 | 98 | 91.73 | 191 | 69 | 34.48 |
| Alkalinity (as CaCO3 mg/L) | 55.9 | 16.8 | 15.5 | 14.6 | 13 | 14.6 | 11.6 | 14.8 | 12.6 | 12 | 13.1 | 17.68 | 55.9 | 11.6 | 12.77 |
| pH Lab | 6.71 | 6.93 | 6.8 | 6.7 | 6.2 | 6.7 | 7.14 | 7.25 | 6.98 | 6.98 | 7.31 | 6.88 | 7.31 | 6.2 | 0.31 |
| HCO3− mg/L | 68.2 | 20.5 | 19.0 | 17.8 | 15.9 | 17.8 | 13.6 | 18.0 | 15.3 | 14.6 | 15.9 | 21.50 | 68.2 | 13.6 | 15.62 |
| SO42− mg/L | 23.9 | b.d.l. ˠ | b.d.l. | b.d.l. | b.d.l. | b.d.l. | b.d.l. | b.d.l. | b.d.l. | b.d.l. | b.d.l. | 23.9 | b.d.l. | ||
| Cl− mg/L | 3.5 | 8.9 | 8.9 | 12.4 | 12 | 12.6 | 12.5 | 16.9 | 14.5 | 15 | 16.8 | 12.18 | 16.9 | 3.5 | 3.93 |
| F− mg/L | 0.21 | 0.08 | 0.08 | 0.06 | 0.07 | 0.06 | 0.07 | 0.04 | 0.04 | 0.04 | 0.04 | 0.072 | 0.21 | 0.04 | 0.05 |
| Na+ mg/L | 6.4 | 1 | 1.2 | 2 | 1.8 | 1.8 | 1.8 | 2.9 | 2.1 | 2.2 | 2.9 | 2.37 | 6.4 | 1 | 1.46 |
| K+ mg/L | 0.5 | b.d.l. | b.d.l. | b.d.l. | b.d.l. | b.d.l. | b.d.l. | b.d.l. | b.d.l. | b.d.l. | b.d.l. | 0.5 | b.d.l. | ||
| Total hardness as CaCO3 mg/L (Calcium carbonate) | 56.4 | 33.2 | 31.9 | 30.2 | 27.8 | 33.9 | 31.6 | 35.1 | 29.1 | 26.6 | 33.9 | 33.61 | 56.4 | 26.6 | 8.02 |
| Ca2+ mg/L | 14.5 | 7.7 | 8 | 7.6 | 8 | 9.3 | 9.2 | 11.4 | 10 | 9 | 11.6 | 9.66 | 14.5 | 7.6 | 2.11 |
| Mg2+ mg/L | 4.9 | 3.4 | 2.9 | 2.8 | 1.9 | 2.6 | 2.1 | 1.6 | 1 | 1 | 1.2 | 2.31 | 4.9 | 1 | 1.18 |
| SiO2 mg/L | 6.6 | 1.7 | b.d.l. | 1.2 | b.d.l. | b.d.l. | b.d.l. | b.d.l. | 0.8 | b.d.l. | b.d.l. | 6.6 | b.d.l. | ||
| NO3− mg/L | 1.3 | b.d.l. | b.d.l. | b.d.l. | b.d.l. | b.d.l. | b.d.l. | b.d.l. | b.d.l. | b.d.l. | b.d.l. | 1.3 | b.d.l. | ||
| Nitrates (as N mg/L) | 0.3 | b.d.l. | b.d.l. | b.d.l. | b.d.l. | b.d.l. | b.d.l. | b.d.l. | b.d.l. | b.d.l. | b.d.l. | 0.3 | b.d.l. | ||
| As mg/L | 0.004 | 0.0025 | b.d.l. | b.d.l. | b.d.l. | b.d.l. | b.d.l. | b.d.l. | b.d.l. | b.d.l. | b.d.l. | 0.004 | b.d.l. | ||
| Pb mg/L | 0.001 | b.d.l. | b.d.l. | b.d.l. | b.d.l. | b.d.l. | b.d.l. | 0.001 | b.d.l. | 0.001 | b.d.l. | 0.001 | b.d.l. | ||
| Cu mg/L | b.d.l. | b.d.l. | b.d.l. | b.d.l. | b.d.l. | b.d.l. | b.d.l. | b.d.l. | 0.1 | b.d.l. | b.d.l. | 0.1 | b.d.l. | ||
| Zn mg/L | b.d.l. | b.d.l. | b.d.l. | b.d.l. | 0.16 | 0.55 | 0.63 | 0.7 | 1.07 | 1.04 | 0.64 | 1.07 | b.d.l. | ||
| Fe mg/L | b.d.l. | b.d.l. | b.d.l. | b.d.l. | b.d.l. | b.d.l. | b.d.l. | b.d.l. | b.d.l. | b.d.l. | b.d.l. | b.d.l. | b.d.l. | b.d.l. | |
| Al mg/L | 0.068 | 0.1724 | 0.207 | b.d.l. | 0.04 | 0.029 | 0.033 | 0.0273 | 0.009 | b.d.l. | 0.008 | 0.207 | b.d.l. | ||
| Cr(VI) mg/L | b.d.l. | b.d.l. | b.d.l. | b.d.l. | b.d.l. | b.d.l. | b.d.l. | b.d.l. | b.d.l. | b.d.l. | b.d.l. | b.d.l. | b.d.l. | b.d.l. | |
| TDS mg/L | 103 | 50 | 51 | 47 | 28 | 40 | 54 | 68 | 79 | 79 | 61 | 60 | 103 | 28 | 21.09 |
© 2018 by the authors. Licensee MDPI, Basel, Switzerland. This article is an open access article distributed under the terms and conditions of the Creative Commons Attribution (CC BY) license (http://creativecommons.org/licenses/by/4.0/).
Share and Cite
Gispert, M.Í.; Hernández, M.A.A.; Climent, E.L.; Flores, M.F.T. Rainwater Harvesting as a Drinking Water Option for Mexico City. Sustainability 2018, 10, 3890. https://doi.org/10.3390/su10113890
Gispert MÍ, Hernández MAA, Climent EL, Flores MFT. Rainwater Harvesting as a Drinking Water Option for Mexico City. Sustainability. 2018; 10(11):3890. https://doi.org/10.3390/su10113890
Chicago/Turabian StyleGispert, Mireya Ímaz, María Aurora Armienta Hernández, Enrique Lomnitz Climent, and María Fernanda Torregrosa Flores. 2018. "Rainwater Harvesting as a Drinking Water Option for Mexico City" Sustainability 10, no. 11: 3890. https://doi.org/10.3390/su10113890