Evaluation of Eco-Driving Training for Fuel Efficiency and Emissions Reduction According to Road Type


Abstract
:1. Introduction
2. Eco-Driving Training and Its Impact
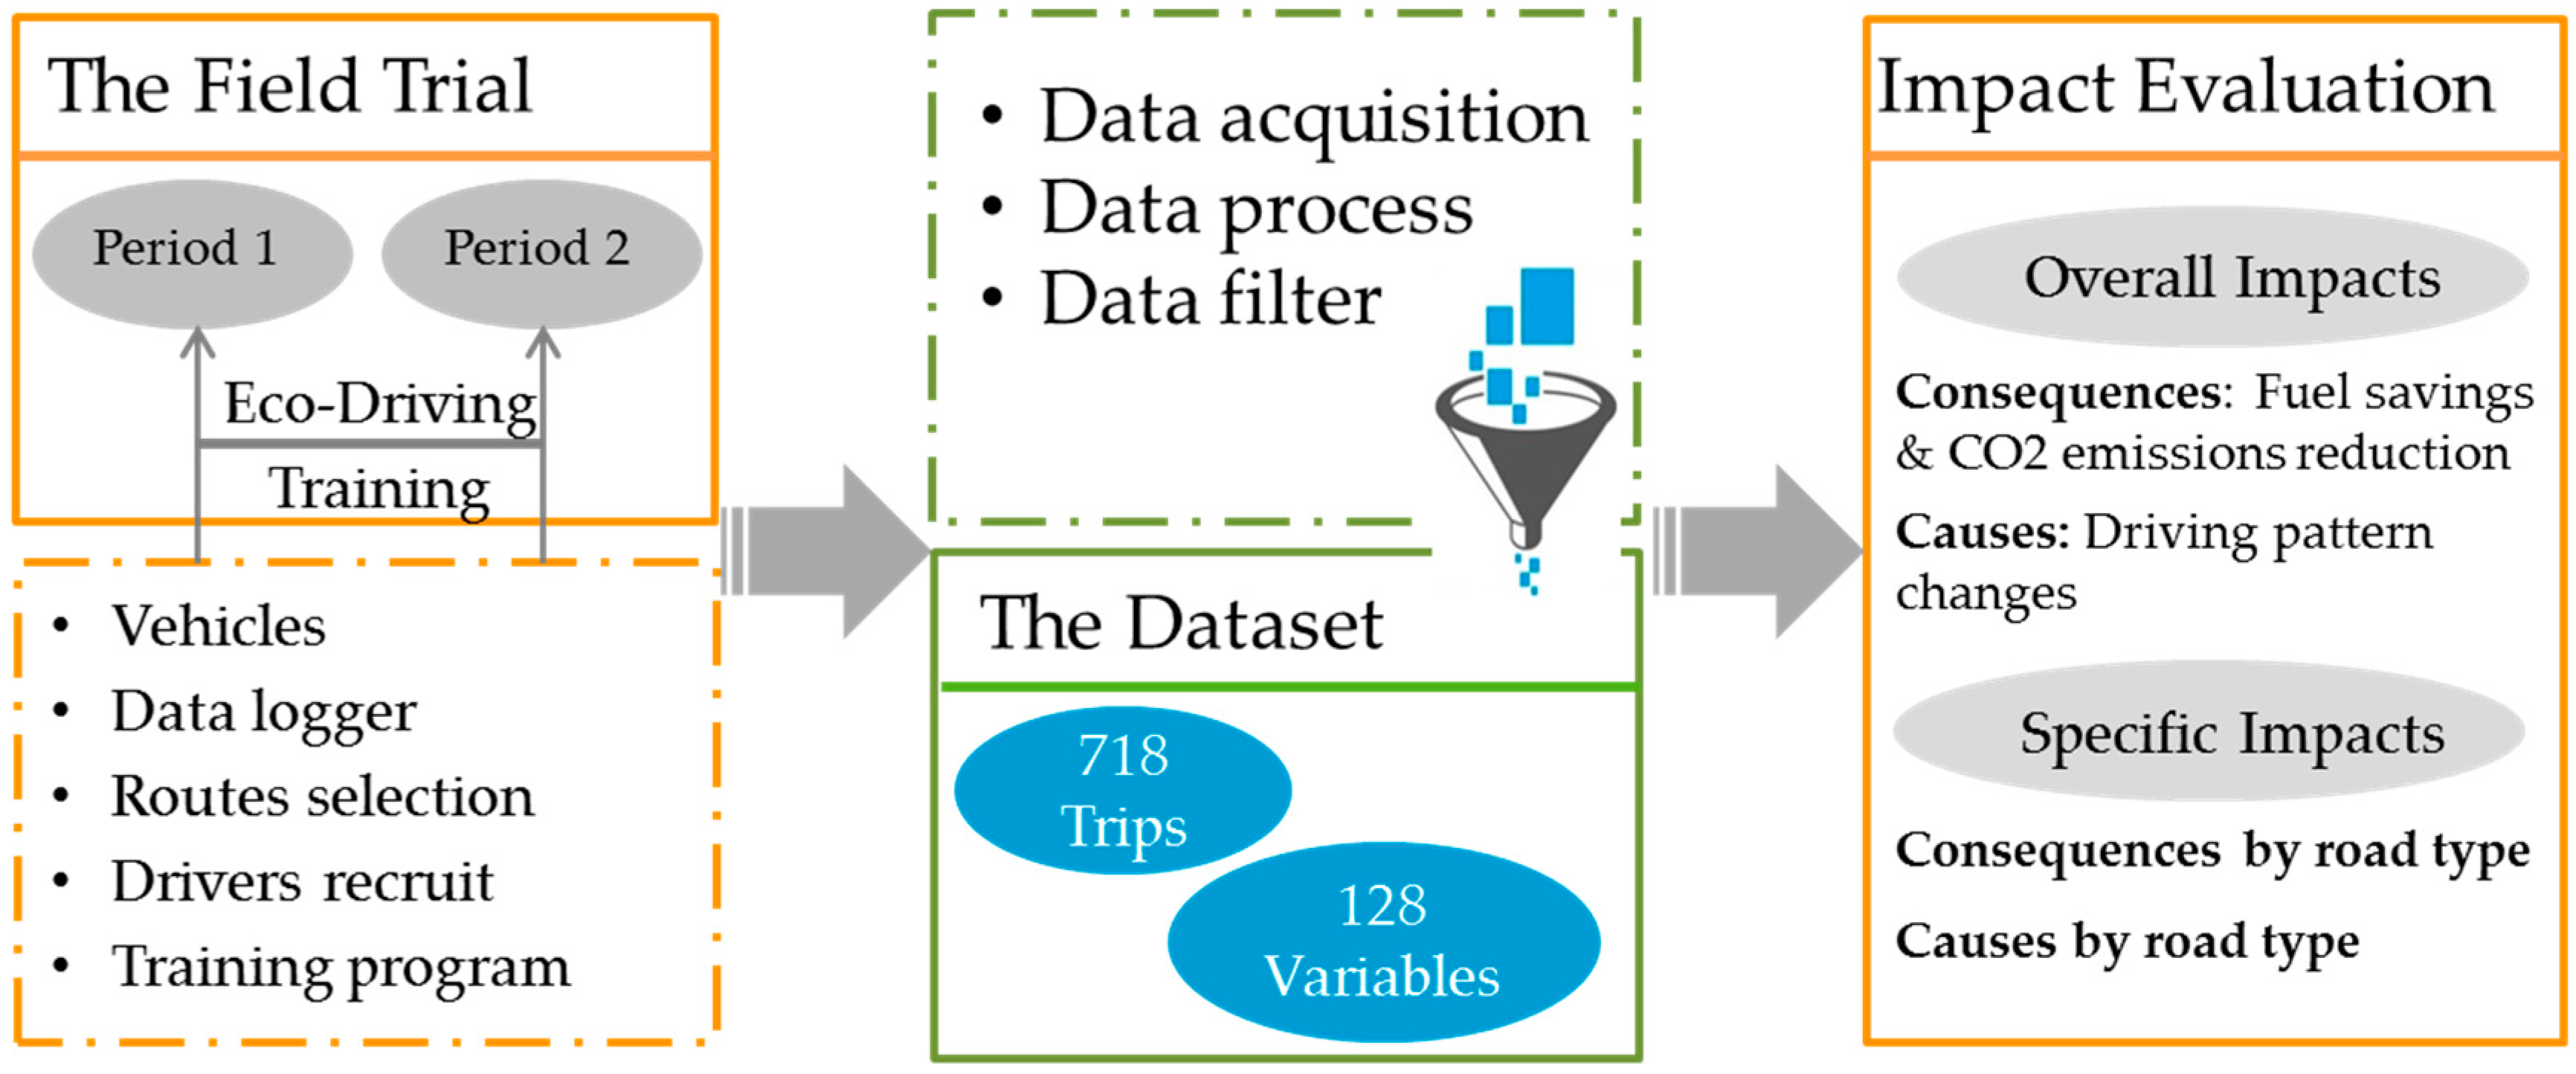
3. Methodology
3.1. The Field Trial
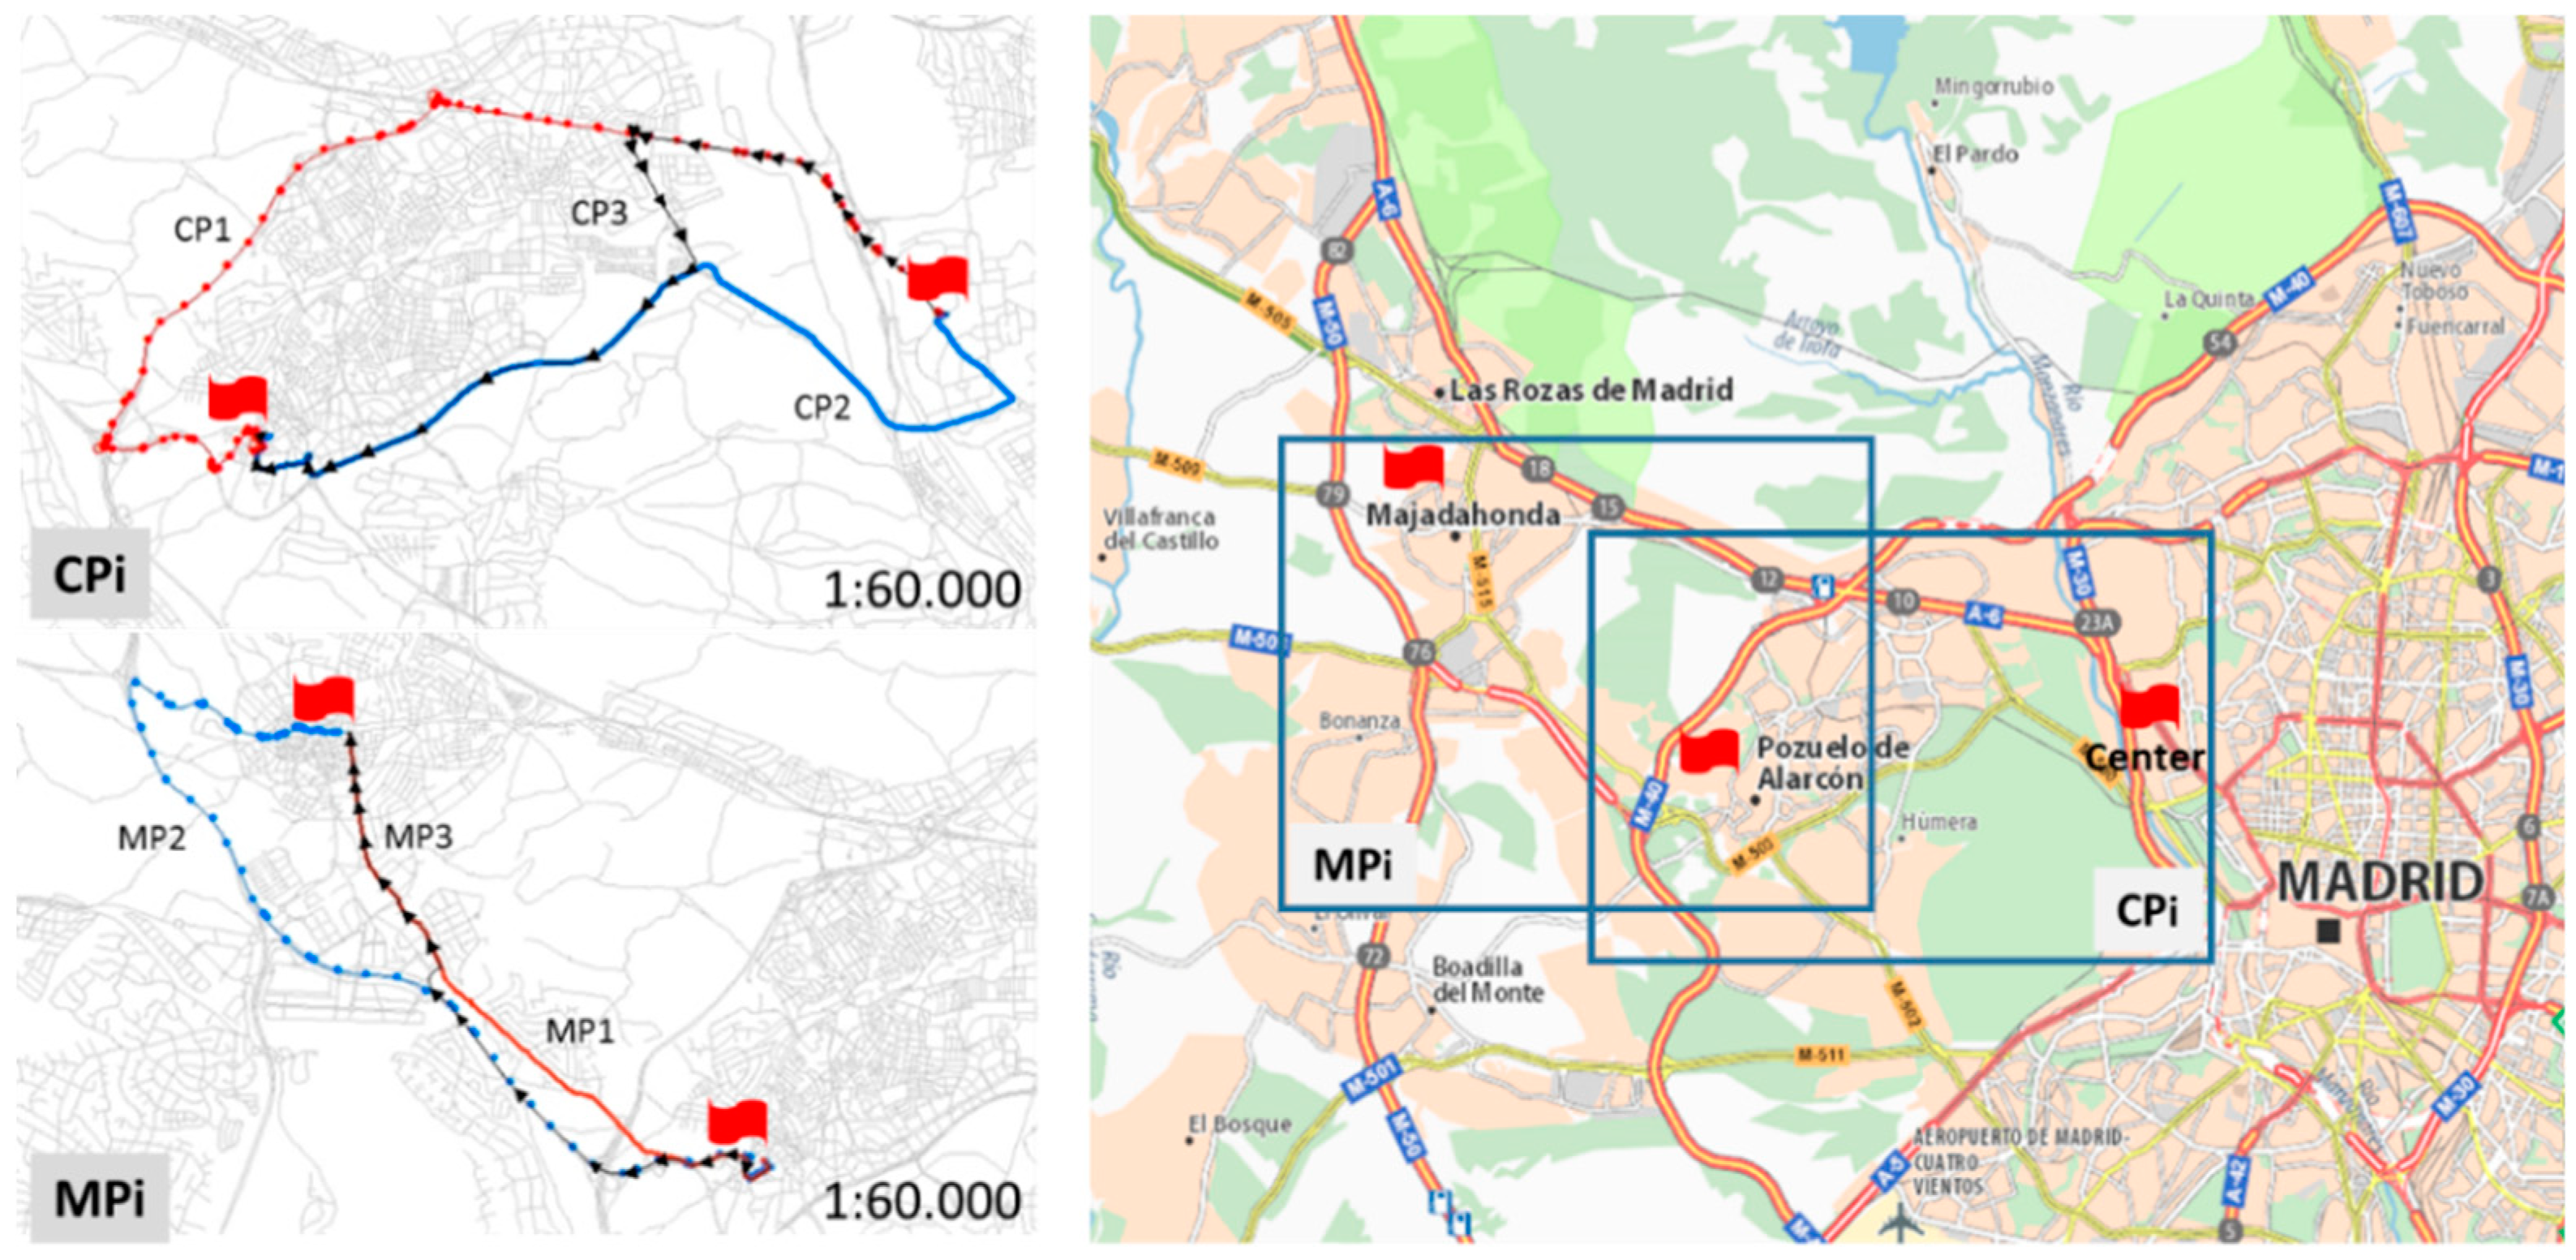
3.1.1. Route Selection
3.1.2. Driver Selection, Scheduling, and Eco-Driving Training
- reducing and maintaining a steady speed;
- reducing unnecessary accelerations;
- using higher gears and changing up to higher gears as rapidly as possible;
- rolling the vehicle with the gear engaged and without accelerating on the approach to an intersection or pedestrian crossings;
- avoiding unnecessary weight;
- anticipating current traffic conditions;
- switching off the engine during stops of over 1 minute.
3.2. The Dataset
3.3. The Impact Evaluation Method
4. Results
4.1. Overall Impacts of Eco-Driving Training
4.2. Impacts of Eco-Driving by Road Type
5. Conclusions and Policy Recommendations
5.1. Main Findings
- A short-term eco-driving training course has significant effects on changing drivers’ habitual driving performance. The general savings in fuel consumption due to the application of eco-driving is up to 6.3% regardless of fuel type and road type. However, this study only focused on the immediate effects of eco-driving training; so, it cannot guarantee that the same effects would remain long-term, since drivers may turn back to their ingrained driving habits. This is also the major challenge for eco-driving technology, as mentioned in the previous studies [9,14,17,38,39].
- The driving performance parameters that were considered in the study (average and maximum RPM, average and maximum speed, aggressive acceleration/deceleration) changed significantly after the training. Drivers were observed to modify their driving behaviour and drive more smoothly, accelerate/decelerate less aggressively, and avoid unnecessary stops during the trip.
- The field trial involving different road sectors shows various outcomes in terms of fuel savings and changes in driving patterns. The highest fuel savings were achieved on major arterial roads (8%) with a number of roundabouts and pedestrian crossings. Drivers have more difficulty in applying eco-driving techniques on highways with high traffic intensity. When traffic conditions are favorable, eco-driving is more successful on itineraries that are characterized by lower speed limits and with several roundabouts and give ways; on highways and high-speed roads, free-flow conditions can encourage an increase in cruising speed, which translates into higher instant fuel consumption.
5.2. Policy Recommendations
Supplementary Materials
Author Contributions
Funding
Acknowledgments
Conflicts of Interest
References
- Dalkmann, H.; Brannigan, C. Sustainable Transport: A Sourcebook for Policy-Makers in Developing Cities. Transport and Climate Change. Module 5e. Deutsche Gesellschaft fuer Technische Zusammenarbeit (GTZ 2007). Available online: http://lib.icimod.org/record/13155/files/5302.pdf (accessed on 3 September 2018).
- ACEA. The Automobile Industry Pocket Guide 2017/2018. European Automobile Manufacturers Association. 2017. Available online: http://www.acea.be/uploads/publications/ACEA_Pocket_Guide_2017-2018.pdf (accessed on 3 September 2018).
- Alam, M.S.; McNabola, A. A critical review and assessment of Eco-Driving policy & technology: Benefits & limitations. Transp. Policy 2014, 35, 42–49. [Google Scholar] [CrossRef]
- Zhou, M.; Jin, H.; Wang, W. A review of vehicle fuel consumption models to evaluate eco-driving and eco-routing. Transp. Res. Part D Transp. Environ. 2016, 49, 203–218. [Google Scholar] [CrossRef]
- Sivak, M.; Schoettle, B. Eco-driving: Strategic, tactical, and operational decisions of the driver that influence vehicle fuel economy. Transp. Policy 2012, 22, 96–99. [Google Scholar] [CrossRef]
- Ecowill Final Report. The Golden Rules of Eco-Driving. 2013. Available online: http://cieca.eu/sites/default/files/documents/projects_and_studies/ECOWILL_FINAL_REPERT.pdf (accessed on 3 September 2018).
- Muslim, N.H.; Keyyanfar, A.; Shafaghat, A.; Abdullahi, M.M.; Khorami, M. Green driver: Travel behaviors revisited on fuel saving and less emission. Sustainability 2018, 10, 325. [Google Scholar] [CrossRef]
- Keyvanfar, A.; Shafaghat, A.; Muhammad, N.Z.; Ferwati, M.S. Driving behaviour and sustainable mobility-policies and approaches revisited. Sustainability 2018, 10, 1152. [Google Scholar] [CrossRef]
- Huang, Y.; Ng, E.C.Y.; Zhou, J.L.; Surawski, N.C.; Chan, E.F.C.; Hong, G. Eco-driving technology for sustainable road transport: A review. Renew. Sustain. Energy Rev. 2018, 93, 596–609. [Google Scholar] [CrossRef]
- Johansson, H. Impact of Ecodriving on Emissions and Fuel Consumption: A Pre-Study; Swedish National Road Administration: Borlange, Sweden, 1999. [Google Scholar]
- Henning, W. Ford-Eco-Driving–Best Practice Training & Evaluation, Improving Fuel Economy, Reducing CO2. In Proceedings of the Ecodriven Final Conference, Prague, Czech Republic, 12–13 November 2008. [Google Scholar]
- Smit, R.; Rose, G.; Symmons, M. Assessing the impacts of ecodriving on fuel consumption and emissions for the Australian situation. In Proceedings of the 33th Australasian Transport Research Forum, Canberra, ACT, Australia, 26–29 September 2010. [Google Scholar]
- Ng, C.Y.; Huang, Y.; Hong, G.; Zhou, J.; Surawski, N.; Ho, J.; Chan, E. Effects of an On-Board Safety Device on the Emissions and Fuel Consumption of a Light Duty Vehicle (No. 2018-01-1821); SAE Technical Paper; International Powertrains, Fuels & Lubricants Meeting: Sydney, Australia, 2018. [Google Scholar]
- Eco-drive, Fiat. Eco-driving Uncovered—The Benefit and Challenges of Eco-Driving, Based on the First Study Using Real Journey Data. Available online: http://www.futuremobilitynow.com/assets/ECO-DRIVING_UNCOVERED_full_report_2010_EN.pdf (accessed on 3 September 2018).
- Johansson, H.; Gustafsson, P.; Henke, M.; Rosengren, M. Impact of EcoDriving on Emissions; International Scientific Symposium on Transport and Air Pollution: Avignon, France, 2003. [Google Scholar]
- Zarkadoula, M.; Zoidis, G.; Tritopoulou, E. Training urban bus drivers to promote smart driving: A note on a Greek eco-driving pilot program. Transp. Res. Part D Transp. Environ. 2007, 12, 449–451. [Google Scholar] [CrossRef]
- Boriboonsomsin, K.; Barth, M.J.; Vu, A. Evaluation of driving behavior and attitude toward eco-driving. In Proceedings of the Transportation Research Board 90th Annual Meeting, Washington, DC, USA, 23–27 January 2011. [Google Scholar]
- Andrieu, C.; Saint Pierre, G. Comparing effects of eco-driving training and simple advices on driving behavior. Procedia-Soc. Behav. Sci. 2012, 54, 211–220. [Google Scholar] [CrossRef]
- Rutty, M.; Matthews, L.; Andrey, J.; Del Matto, T. Eco-driver training within the City of Calgary’s municipal fleet: Monitoring the impact. Transp. Res. Part D Transp. Environ. 2013, 24, 44–51. [Google Scholar] [CrossRef]
- Strömberg, H.K.; Karlsson, I.M. Comparative effects of eco-driving initiatives aimed at urban bus drivers–Results from a field trial. Transp. Res. Part D Transp. Environ. 2013, 22, 28–33. [Google Scholar] [CrossRef]
- Ho, S.H.; Wong, Y.D.; Chang, V.C. What can eco-driving do for sustainable road transport? Perspectives from a city (Singapore) eco-driving programme. Sustain. Cities Soc. 2015, 14, 82–88. [Google Scholar] [CrossRef]
- Schall, D.L.; Wolf, M.; Mohnen, A. Do effects of theoretical training and rewards for energy-efficient behavior persist over time and interact? A natural field experiment on eco-driving in a company fleet. Energy Policy 2016, 97, 291–300. [Google Scholar] [CrossRef]
- Barla, P.; Gilbert-Gonthier, M.; Castro, M.A.L.; Miranda-Moreno, L. Eco-driving training and fuel consumption: Impact, heterogeneity and sustainability. Energy Econ. 2017, 62, 187–194. [Google Scholar] [CrossRef]
- Dirección General de Tráfico. Parque de Vehículos per Provincias 2016. Available online: http://www.dgt.es/es/seguridad-vial/estadisticas-e-indicadores/parque-vehiculos/tablas-estadisticas (accessed on 3 September 2018).
- Wang, Y.; Monzon, A. Economic crisis and its influences on the interaction between land use and transport in Madrid Region. Transp. Res. Procedia 2016, 18, 100–107. [Google Scholar] [CrossRef]
- García-Castro, A. Understanding How to Reduce Road Transport Emissions: Modelling the Impact of Eco-Driving. Ph.D. Thesis, Escuela Técnica superior de Ingenioeros de Caminos Canales y Puertos-Universidad Politécnica de Madrid, Madrid, Spain, 2016. [Google Scholar]
- Garcia-Castro, A.; Monzon, A.; Valdes, C.; Romana, M. Modelling different penetration rates of eco-driving in urban areas. Impacts on traffic flow and emissions. Int. J. Sustain. Transp. 2017, 11, 282–294. [Google Scholar] [CrossRef]
- Birrell, S.; Taylor, J.; McGordon, A.; Son, J.; Jennings, P. Analysis of three independent real-world driving studies: A data driven and expert analysis approach to determining parameters affecting fuel economy. Transp. Res. Part D Transp. Environ. 2014, 33, 74–86. [Google Scholar] [CrossRef] [Green Version]
- Ericsson, E. Independent driving pattern factors and their influence on fuel-use and exhaust emission factors. Transp. Res. Part D Transp. Environ. 2001, 6, 325–345. [Google Scholar] [CrossRef]
- Smit, R.; Smokers, R.; Rabé, E. A new modelling approach for road traffic emissions: VERSIT+. Transp. Res. Part D Transp. Environ. 2007, 12, 414–422. [Google Scholar] [CrossRef]
- Greenwood, I.; Dunn, R.; Raine, R. Estimating the effects of traffic congestion on fuel consumption and vehicle emissions based on acceleration noise. J. Transp. Eng. 2007, 133, 96–104. [Google Scholar] [CrossRef]
- Beusen, B.; Broekx, S.; Denys, T.; Beckx, C.; Degraeuwe, B.; Gijsbers, M.; Scheepers, K.; Govaerts, L.; Torfs, R.; Panis, L.I. Using on-board logging devices to study the longer-term impact of an eco-driving course. Transp. Res. Part D Transp. Environ. 2009, 14, 514–520. [Google Scholar] [CrossRef]
- Coelho, M.C.; Frey, H.C.; Rouphail, N.M.; Zhai, H.; Pelkmans, L. Assessing methods for comparing emissions from gasoline and diesel light-duty vehicles based on microscale measurements. Transp. Res. Part D Transp. Environ. 2009, 14, 91–99. [Google Scholar] [CrossRef]
- EMEP/EEA Air Pollutant Emission Inventory Guidebook 2016. Available online: https://www.eea.europa.eu/publications/emep-eea-guidebook-2016 (accessed on 10 October 2018).
- Faria, M.; Farias, T.; Baptista, P. Driving behavior patterns: Impacts on emissions and safety performance. In Proceedings of the NECTAR 2017 International Conference, Madrid, Spain, 31 May–2 June 2017. [Google Scholar]
- Jimenez-Palacios, J.L. Understanding and Quantifying Motor Vehicle Emissions with Vehicle Specific Power and TILDAS Remote Sensing. Ph.D. Thesis, Massachusetts Institute of Technology, Department of Mechanical Engineering, Cambridge, MA, USA, 5 December 1998. [Google Scholar]
- Wang, Y.; Lois, D.; Boggio-Marzet, A.; Monzón, A. Eco-driving in real traffic: An experimental study in Spanish cities. In Proceedings of the XIII Congreso de Ingeniería del Transporte, Gijón, Spain, 6–8 June 2018. [Google Scholar]
- Lai, W.T. The effects of eco-driving motivation, knowledge and reward intervention on fuel efficiency. Transp. Res. Part D Transp. Environ. 2015, 34, 155–160. [Google Scholar] [CrossRef]
- Díaz-Ramirez, J.; Giraldo-Peralta, N.; Flórez-Ceron, D.; Rangel, V.; Mejía-Argueta, C.; Huertas, J.I.; Bernal, M. Eco-driving key factors that influence fuel consumption in heavy-truck fleets: A Colombian case. Transp. Res. Part D Transp. Environ. 2017, 56, 258–270. [Google Scholar] [CrossRef]
- Coloma, J.F.; García, M.; Wang, Y.; Monzón, A. Green Eco-driving effects in non-congested cities. Sustainability 2018, 10, 28. [Google Scholar] [CrossRef]


| Reference Number | Year of Publication | Road Type | Methodology | Fuel Consumption (fc) |
|---|---|---|---|---|
| [10] | 1999 | Mixed type | Results compared after instructions | −10.90% |
| [15] | 2003 | Mixed type | 86 drivers; results compared after instructions | −8% with fc monitoring and −1.2% without |
| [16] | 2007 | 15 km route | 3 bus drivers | 10–15% |
| [11] | 2008 | Mixed type | 300 drivers; results compared after training | −25% short term, −10% long term |
| [17] | 2011 | City and highway | 20 drivers; results compared after 2 weeks, receiving instant feedback | City −6%, Highway −1% |
| [18] | 2012 | 70 km Mixed type | 20 drivers; results compared before and after training | −11.3% |
| [19] | 2013 | Mixed type | After training; results compared after one month | −1.7 kg CO2 emissions per day |
| [20] | 2013 | 16 km urban road | 54 drivers; results compared after 6 weeks | −6.80% |
| [21] | 2015 | Mixed type | 116 drivers; pre-test, 30 min training, re-test | Less than −10% |
| [22] | 2015 | Mixed type | 91 logistic drivers | No effect |
| Route | Road Type | Lanes | Speed Limit (km/h) | Distance (km) | Travel Time Range (min) * | Average Daily Intensity ** 103 | Average Slope (%) *** | |
|---|---|---|---|---|---|---|---|---|
| Direction I | Direction II | |||||||
| CP1 | Highway | 2 × 2 to 4 × 4 lanes With high occupancy vehicle lane-HOV or barrier | 80/120 | 15.2 | 18–35 | 77–133 | −2.8~2.8 | −2.5~2.9 |
| Local street | 1 × 1 without barrier | 50 | ||||||
| CP2 | Highway | 2 × 2 to 4 × 4 lanes With HOV lane or barrier | 80/120 | 13.3 | 18–30 | 48–59 | −3.6~3.0 | −2.8~3.5 |
| Urban arterial road | 2 × 2 separated by barrier. Parking both side | 40 | ||||||
| Local street | 1×1 without barrier | 50 | ||||||
| CP3 | Highway | 2 × 2 to 4 × 4 lanes With HOV lane or barrier | 80/120 | 13.5 | 18–22 | 48–133 | −3.2~3.2 | −3.0~3.3 |
| Local street | 1 × 1 without barrier | 50 | ||||||
| MP1 | Urban arterial road | 2 × 2 separated by barrier | 30/50 | 8.2 | 18–30 | 17 | −3.0~3.0 | −3.2~3.4 |
| Local street | 1 × 1 without barrier | 50 | ||||||
| MP2 | Highway | 2 × 2 or 3 × 3 separated by barrier | 90/120 | 13.2 | 16–30 | 17–62 | −2.6~2.9 | −2.8~3.1 |
| Mayor arterial road | 2 × 2 separated by barrier | 30/50 | ||||||
| Local street | 1 × 1 without barrier | 50 | ||||||
| MP3 | Highway | 2 × 2 separated by barrier | 90 | 8.6 | 16–35 | 17–43 | −3.2~3.1 | −3.1~3.6 |
| Mayor arterial road | 2 × 2 separated by barrier | 30/50 | ||||||
| Local street | 1 × 1 without barrier | 50 | ||||||
| Driver ID | Age (Years Old) | Gender | Driving Experience (Year) |
|---|---|---|---|
| 1 | 25 | Woman | 7 |
| 2 | 24 | Man | 5 |
| 3 | 30 | Man | 11 |
| 4 | 24 | Man | 6 |
| 5 | 55 | Woman | 34 |
| 6 | 56 | Woman | 38 |
| 7 | 40 | Man | 21 |
| 8 | 42 | Man | 23 |
| 9 | 24 | Man | 6 |
| 10 | 23 | Man | 4 |
| 11 | 25 | Woman | 6 |
| 12 | 24 | Woman | 7 |
| Average | 33 | - | 14 |
| Sets | Variables | Average | St.dev. | Min | Max |
|---|---|---|---|---|---|
| Drivers’ profiles | age | 31.7 | 11.7 | 23 | 56 |
| years of experience | 13 | 11.3 | 4 | 38 | |
| Experiment on road n = 3153 | distance recorded (km) | 2.33 | 1.85 | 0.03 | 10.27 |
| travel time (s) | 209 | 157 | 6 | 1533 | |
| speed (km/h) | 42.4 | 24.3 | 2.8 | 101.5 | |
| fuel consumption (l/100 km) | 5.71 | 1.06 | 3.98 | 12.66 | |
| CO2 emissions (g/km) | 183.2 | 33.7 | 24.2 | 550.6 | |
| Period 1 (Pre-training) n = 1668 | distance recorded (km) | 2.36 | 1.87 | 0.03 | 10.27 |
| travel time (s) | 207 | 163 | 6 | 1533 | |
| speed (km/h) | 43.1 | 25.0 | 3.3 | 101.5 | |
| fuel consumption (l/100 km) | 5.91 | 1.24 | 4.03 | 12.66 | |
| CO2 emissions (g/km) | 189.4 | 34.6 | 69.2 | 550.6 | |
| Period 2 (Post-training) n = 1485 | distance recorded (km) | 2.30 | 1.83 | 0.09 | 6.88 |
| travel time (s) | 210 | 150 | 15 | 1383 | |
| speed (km/h) | 41.6 | 23.4 | 2.8 | 94.9 | |
| fuel consumption (l/100 km) | 5.53 | 0.78 | 3.97 | 10.21 | |
| CO2 emissions (g/km( | 177.4 | 33.1 | 24.2 | 480.2 |
| Parameter Type | Description | Code | Unit |
|---|---|---|---|
| Fuel consumption and emissions | Average fuel consumption | avg_FC | L/100 km |
| Average CO2 emissions | avg_CO2 | g/km | |
| Driving-performance-related | Average RPM | avg_RPM | rpm |
| Maximum RPM | max_RPM | rpm | |
| Average speed | avg_speed | km/h | |
| Maximum speed | max_speed | km/h | |
| % time with aggressive acceleration (more than 1.389 m/s2) | avg_acc | % | |
| % time with sudden deceleration (less than −1.389m/s2) | avg_dec | % | |
| Traffic-intensity-related | percentage of stop time (0 km/h) | V0% | % |
| 95th percentile of instant recorded speed | V95 | km/h |
| Road Type | Lanes and Barriers | Speed Limit (km/h) | Traffic Intensity (Vehicles/Day) | No. of Road Sectors in the Dataset |
|---|---|---|---|---|
| Local street | 1 or 1 × 1 without traffic barrier | 30/50 | <5000 | 1234 |
| Major arterial road | 2 × 2 separated by rigid barrier | 50 | 15,000–20,000 | 330 |
| Highway I (urban) | 3 × 3 or 4 × 4 with rigid barriers | 80/120 | 45,000–55,000 | 992 |
| Highway II (national) | 4 × 4 lanes separated by HOV lane | 90/120 | >100,000 | 243 |
| Period | Period 1 (Pre-Training) | Period 2 (Post-Training) | Diff. | |||
|---|---|---|---|---|---|---|
| Parameters | ||||||
| Mean | St.dev | Mean | St.dev | |||
| Total sample | ||||||
| avg_FC (l/100 km) | 5.91 | 1.24 | 5.53 | 0.78 | −6.3% | |
| avg_CO2 (g/km) | 189.4 | 34.6 | 177.4 | 33.1 | −6.3% | |
| Petrol vehicle | ||||||
| avg_FC (l/100 km) | 6.17 | 2.43 | 5.70 | 2.28 | −7.6% | |
| avg_CO2 (g/km) | 204.8 | 68.4 | 189.2 | 59.0 | −7.6% | |
| Diesel vehicle | ||||||
| avg_FC (l/100 km) | 5.61 | 2.52 | 5.35 | 2.18 | −4.7% | |
| avg_CO2 (g/km) | 172.6 | 76.5 | 164.6 | 72.2 | −4.7% | |
| Period | Period 1 (Pre-Training) | Period 2 (Post-Training) | Diff. | |||
|---|---|---|---|---|---|---|
| Parameter | Mean | St.dev | Mean | St.dev | ||
| avg_rpm (rpm) | 1773 | 422 | 1510 | 365 | −14.8% | |
| max_rpm (rpm) | 2850 | 503 | 2209 | 428 | −22.5% | |
| avg_speed (km/h) | 43.1 | 25.0 | 41.6 | 23.4 | −3.5% | |
| max_speed (km/h) | 69.1 | 25.0 | 63.8 | 24.0 | −7.7% | |
| avg_acc (%) | 6.50 | 4.61 | 4.33 | 3.24 | −33.4% | |
| avg_dec (%) | 5.69 | 4.60 | 3.21 | 2.70 | −43.5% | |
| V95 (km/h) | 65.6 | 25.0 | 60.7 | 23.8 | −7% | |
| V0% (%) | 6.4% | 11% | 5.2% | 10% | −18.9% | |
© 2018 by the authors. Licensee MDPI, Basel, Switzerland. This article is an open access article distributed under the terms and conditions of the Creative Commons Attribution (CC BY) license (http://creativecommons.org/licenses/by/4.0/).
Share and Cite
Wang, Y.; Boggio-Marzet, A. Evaluation of Eco-Driving Training for Fuel Efficiency and Emissions Reduction According to Road Type. Sustainability 2018, 10, 3891. https://doi.org/10.3390/su10113891
Wang Y, Boggio-Marzet A. Evaluation of Eco-Driving Training for Fuel Efficiency and Emissions Reduction According to Road Type. Sustainability. 2018; 10(11):3891. https://doi.org/10.3390/su10113891
Chicago/Turabian StyleWang, Yang, and Alessandra Boggio-Marzet. 2018. "Evaluation of Eco-Driving Training for Fuel Efficiency and Emissions Reduction According to Road Type" Sustainability 10, no. 11: 3891. https://doi.org/10.3390/su10113891
APA StyleWang, Y., & Boggio-Marzet, A. (2018). Evaluation of Eco-Driving Training for Fuel Efficiency and Emissions Reduction According to Road Type. Sustainability, 10(11), 3891. https://doi.org/10.3390/su10113891