Abstract
This study investigated defect risks in residential buildings using the Loss Distribution Approach (LDA), a method of identifying and quantifying operational risks in economic terms. Analysis was performed on 7554 defects in 48 residential buildings where defect disputes occurred between 2008 and 2017. Defects were classified into eight types: affected functionality, broken items, corrosion, detachment, incorrect installation, missing task, surface appearance, and water problems. Work types were classified into seven groups: reinforced concrete (RC), masonry, finish, mechanical, electrical, and plumbing (MEP), door and windows, furniture, and miscellaneous. Using a risk matrix from these categories, the frequency distribution and severity distribution for each matrix cell was used to calculate loss distributions; these were combined to find the total loss distribution. The defect risks centered on RC and MEP. For RC, broken items and water leaks due to cracks or damage represented the most severe defects. For MEP, severe defects occurred owing to malfunctions in products and installation problems. Loss distributions can be used to create scenarios and corresponding response plans; thus, when a defect dispute occurs, the cost can be assessed. Furthermore, residential buildings’ loss distributions for each cell can be used to evaluate the types of work where defects occur and to verify relevant subcontractor’s abilities.
1. Introduction
An environmental policy for the building industry would aim to maintain a high quality of the built environment while optimizing the use of resources [1]. Especially, it is important to manage defects for maintaining a building’s performance [2,3,4]. In this respect, the management of building defects is a worthy aim that can make a significant contribution to sustainability [5].
A defect is defined as “a failing or shortcoming in the function, performance, statutory or user requirements of a building, and might manifest itself within the structure, fabric, services, or other facilities of the affected building” [6]. Defects come to light in the post-handover stage, with the most common being incomplete tile grouting and incorrect fixtures and fittings in toilets. In addition, failure to apply second coats of paint to walls is deemed a problematic issue. Typical surface/appearance defects include floor or wall unevenness, stains, mess, small cracks, and marks, mainly caused by a lack of protection [7,8].
Various countries have made efforts to resolve defects in residential buildings [2,8,9,10,11] however, even though various methods have been found for preemptively discovering and removing various defects in the design and construction phases, there continue to be circumstances where many come to light after handover to the consumer [12].
Even though customer dissatisfaction increases when defects occur in the post-handover stage, contractors are relatively apathetic in their responses to defects [2]. Different interpretations and perceptions of defects by customers and contractors often lead to conflict after a dwelling is handed over [13].
Defects in residential buildings arise from poor design decisions, workmanship, material quality, and lack of protection [7,12]. Ultimately, defects represent risks of the occupancy phase, which are caused by human error and work processes. To resolve the risks caused by such defects, previous studies have focused on finding problem points based on the examination of present conditions and then developing a basic framework for managing defects. However, there is a relative lack of studies that have presented systematic models for effectively managing defects. Studies on risk management are performed more actively in the field of economics than in the field of construction. In economics, risk is classified into market risk, credit risk, operational risk, etc. Operational risks are those that arise from human error and operational practices [14]. From this perspective, the various problems caused by the defects discussed above can be considered operational risk. According to the Basel Committee on Banking Supervision, the Loss Distribution Approach (LDA) is the most sophisticated technique for estimating operational risk [15]. This study aimed to analyze the importance of defect risk in residential buildings and to find methods for effectively managing defect risk by using the LDA, a method for identifying and quantifying operational risks.
2. Literature Review
Defects in residential buildings are not only directly linked to residents’ quality of life; they can also be linked to disputes with contractors. The various defects which occur in the post-handover stage are connected to all kinds of wasted resources and economic losses as additional investments are made. Residents are harmed temporally, materially, and psychologically, and businesses suffer not only monetary losses but also reduced credit ratings. As such, studies are being performed in various countries to recognize and resolve the problem of various defect risks in residential buildings.
Mill et al. (2009) discussed the nature of the most important defects and investigated the impact of contractor type and building type in Australia [2]. Forcada et al. (2013b) examined the nature of defects at the post-handover stage by identifying their type, elemental characteristics, and the subcontract trade in which they arose for seven major residential developments constructed in Spain [8]. Chong et al. (2006) identified the most important design strategies and failure causes that could help prevent latent defects from poor design decisions in Singapore. Their research showed that it is possible to create a simple and flexible decision framework that designers can rely on for design evaluation and to eliminate latent defects [9]. Rotimi et al. (2015) investigated a list of common defects and provided insight into the extent of defects experienced by new homeowners at handover in New Zealand [10]. Hopkin et al. (2016) aimed to better understand how housing associations (HAs), in practice, learn from past defects to reduce the prevalence of defects in future new homes in the UK [11].
For some time, studies have continuously been published on the subject of identifying defect risk and analyzing the problem from a variety of perspectives. Ilozor et al. (2004) determined the interconnections between key house defects to establish whether there is a pattern or sequence in their occurrence. They investigated that the most economically prudent house faults, paying the greatest attention to faming and roofing [3]. Forcada et al. (2012) analyzed the defects that remain in the post-handover stage, which usually lasts 12 months and includes the defects liability period, and identified the factors that influence the appearance of these defects, determining whether a significant difference exists in the quality of the two main residential building types built by developers (flats and detached houses) [4]. Forcada et al. (2013a) classified defects according to their source and origin using a total of 2351 post-handover defects derived from four Spanish builders. They revealed that the most common defects identified by customers at post-handover were derived from bad workmanship and were related to construction errors and omissions [7]. Chong et al. (2005) looked into the differences among defects that occurred during construction and then 2 to 6 years after initial occupancy and found that the defects during these periods were very different [12]. Georgiou (2010) sought to verify and validate a building defect classification system that had been previously developed [16]. Macarulla et al. (2013) developed a defect classification system for the Spanish housing sector that covered the period from construction until the operational stage [17]. Pan et al. (2015) examined the profile of building defects in number, type, location, and severity and investigated their influencing factors, including building type, floor area, number of bedrooms, build method, and performance standard [18]. Forcada et al. (2016) examined the nature of defects that remain at handover and compared it with those defects identified by customers when they first occupy the dwelling [19]. Solar et al. (2016) investigated the most relevant and frequent construction defects in ceramic cladding in housing projects from pre-delivery to final building use [20]. Most of these studies simply examined the frequency of defects or defect costs in order to assess their importance. Uncertainty exists because defect frequency and cost appear in a variety of forms, but these studies were limited in terms of creating systems to comprehensively quantify this uncertainty.
In addition, others have investigated the uncertainty of defect occurrence and are seeking effective methods for managing defect risk. Aljassmi et al. (2016) provided practical defect management suggestions that were determined based on the frequency, magnitude, and pathogenicity criteria, providing means for construction managers to prioritize system improvements that would produce the highest quality outcomes [21]. Bortolini et al. (2018) devised an objective and standardized building inspection system to evaluate the technical performance of existing buildings [22]. Lee (2018) presented a decision-making process for optimizing the selection of building facade materials to minimize potential defects and the life-cycle cost (LCC) of building maintenance [23]. These studies have set severity as a major criterion in defining the defect uncertainty. However, since most of these documents utilize a questionnaire or a 5-point Likert scale, they have limitations in terms of error according to subjective judgment.
In this study, we used the LDA methodology to overcome such limitations. The LDA is used to construct a detailed risk matrix, measure the frequency and depth of each cell in the matrix based on actual data, and quantify the loss scales probabilistically, thereby providing a detailed analysis of operational risks like defects, and allowing one to analyze the importance of defect risk in residential buildings.
3. Research Methodology
LDA is mainly used in the risk management and insurance industries to assess expected losses from accidents. It is the most often discussed method in scientific studies on operational risk management. For businesses such as insurance companies and banks, LDA uses statistical analysis methods based on data from actual accidents. As such, it has more descriptive power and logicality than other operational risk assessment methods [24]. Figure 1 shows a comparison of the LDA in the field of economics, and the method used in this study.
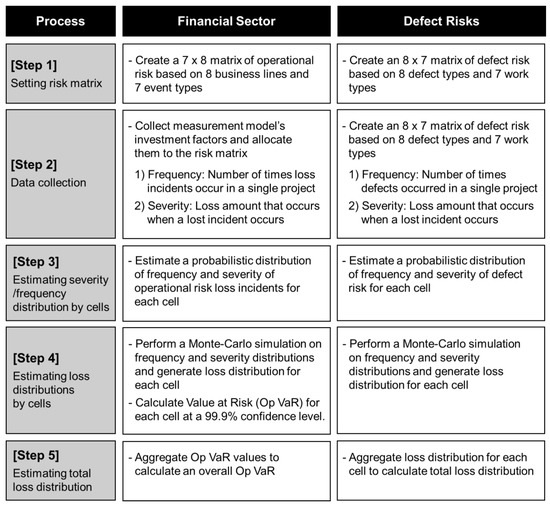
Figure 1.
Loss Distribution Approach (LDA) processes in the field of economics and in this study. VaR: Value at Risk.
First, a risk matrix is constructed; in the financial sector, operational risk is classified into 8 business lines and 7 event types for a 7 × 8 risk matrix. This matrix structure can be set up in a flexible way according to the operational risks’ detailed measurement standards and factors. In this study, the risk matrix was set up based on 8 defect types and 7 work types, and the frequency and severity data of each cell were found in order to perform the analysis. In the particular case of severity, it was necessary to perform revisions based on residential buildings’ scales, so it was defined as the ratio of total area to defect cost. Next, the frequency distribution and severity distribution of each cell in the risk matrix were set. For the frequency distribution, the most typical form of discrete distribution, the Poisson distribution, was applied [25]. Severity distribution is a continuous distribution, and so models with tail distributions were used (i.e., log-normal distribution, Weibull distribution, gamma distribution, and Pareto distribution). In this study, fitness verification was performed on each distribution to set the severity distribution of each cell.
Next, a Monte-Carlo simulation is performed on the frequency distribution and severity distribution to set the loss distribution of each cell. When LDA is used in the financial sector, the loss for each cell is estimated and the VaR(Value at Risk) of operational risk, which is called the Op VaR, for each cell is calculated at a 99.9% confidence level. The 99.9% confidence level is specified in the Basel Accords and can be used flexibly; that is, it can be set flexibly according to the target of the LDA analysis. The confidence level of the entire distribution can be set between 0 and 100%, and the degree of risk can be checked. In this study, rather than use a 99.9% confidence level, the loss distribution of each cell was found to understand the defect risk of each cell in the risk matrix. Finally, the loss distributions of each cell were combined to find the total loss distribution.
4. Analysis
4.1. Setting the Defect Risk Matrix
In order to use LDA in analyzing defect risk, the frequency and severity distributions of each cell must be set. As such, data for each cell must be procured. If each cell is made to be overly detailed, it is difficult to procure the cell’s data. Taking this into account, we used the existing literature as a basis and classified eight types of defect (affected functionality, broken item, corrosion, detachment, incorrect installation, missing task, surface appearance, and water problem (Table 1), and seven types of work (reinforced concrete (RC), masonry, finish, mechanical, electrical, and plumbing (MEP), door and windows, furniture, and miscellaneous, as specified by the Korea Land and Housing Corporation). The risk matrix was set (Table 2) and the analysis was performed.

Table 1.
Defect classification.
Table 2.
Risk matrix. RC: reinforced concrete; MEP: mechanical, electrical, and plumbing.
4.2. Data Collection
Table 3 shows 7554 defect cases in 48 residential buildings completed between 1999 and 2012 that were analyzed in this study. The data were distributed in each cell of the above risk matrix. All the buildings we examined were apartments, which is the representative type of residence in Korea. A defect dispute occurred for each case, and inspection of defects was officially conducted. Thus, the difference between the time of completion and the time of inspection is actually the defect period, which varies from 4 to 12 years. Further, since the defect cost may vary depending on the size in each case, the defect cost was analyzed after being corrected with respect to the total area.
Table 3.
Overview of cases.
As shown in Table 4, an examination of the defect frequency by defect type showed that broken items (30.88%) were the most frequent defect type. In addition, it showed that missing tasks (13.97%), incorrect installation (13.20%), water problems (12.47%), and affected functionality (12.21%) occurred frequently. An examination of the defect cost by defect type showed that broken items (36.82%) also incurred the largest defect costs. In addition, incorrect installation (30.23%) and missing tasks (19.41%) also incurred high costs. Finally, when the defect cost was revised by area, broken items (33.34%) incurred the greatest defect cost. In addition, incorrect installation (21.36%) and missing tasks (19.24%) also incurred relatively high costs.
Table 4.
Defect frequency and cost of each defect type.
The defect frequency by work type (Table 5) showed that RC (33.98%) and finish (32.98%) contain the most frequent defects, while RC (42.56%) and finish (41.42%) incurred the largest defect costs. When the defect cost was revised by area, RC (41.37%) and finish (40.71%) incurred the greatest defect cost.
Table 5.
Defect frequency and cost of each work type.
Table 6 and Table 7 summarize the defect frequency and cost depending on the defect and work types. Because the components of a building typically age over time, in the literature, time is considered as a factor affecting building performance [27,28,29,30]. However, Table 6 and Table 7 do not show a distinct relationship between defects and aging. This is because design, workmanship, lack of protection, materials, user, and various other causes of defects exist; this does not mean that there is no relationship between aging and defects.
Table 6.
Defect frequency and cost of each defect type over time.
Table 7.
Defect frequency and cost of each work type over time.
4.3. Estimating Loss Distribution by Cell
In this study, the severity and frequency distributions of each cell were found based on the data categorized in each cell of the risk matrix. First, each cell’s severity distribution was set as the distribution with the highest fitness from among the continuous distributions for each cell (e.g., the lognormal, Weibull, beta, or Pareto distribution). In addition, each cell’s frequency distribution was set as the Poisson distribution, which is generally the most used discrete distribution [25]. The frequency distribution mean values of each cell are shown in Table 8; the severity distribution mean values of each cell are shown in Table 9; the loss distributions of each cell that was found through the cell’s severity and frequency distributions are shown in Table 10.
Table 8.
Frequency distribution mean values of each cell.
Table 9.
Severity distribution mean values of each cell.
Table 10.
Loss distribution mean values of each cell.
The work types with the relatively largest losses due to defects include RC, finish, and MEP (Table 10). For RC work, defect losses were mainly caused by broken items and water problems, such as leaks due to cracks or damage. A comprehensive examination of the main defect phenomena in RC (Table 8 and Table 9) showed that these defects are typical examples of LSHF (low-severity high-frequency). Furthermore, when incorrect installation defects occur in RC work, their severity is relatively high. For finish work, defects mainly included broken items, detachment, incorrect installation, missing tasks, and surface appearance (Table 10). A comprehensive examination of these defects (Table 8 and Table 9) showed that these defects are typical examples of LSHF. For finish work, not only do a far wider variety of work types exist compared with RC, but the components and materials are used in a variety of ways; consequently, defects can occur more widely. In addition, RC work has an effect on structural stability, but finish work has a direct effect on the residential environment (i.e., defects can be observed by residents directly); as such, the defect frequency is very high.
MEP work has a strong effect on the characteristics of installation in the building interior. Pipes, electrics, and electronic products are installed in the building, and malfunctions in the products themselves or installation problems can occur. As such, the results showed that MEP work has relatively high losses owing to affected functionality and incorrect installation defects.
4.4. Estimating the Total Loss Distribution
Figure 2 shows the total loss distribution that is calculated by combining the loss distributions of each cell. Total loss distribution is the distribution of defect costs for a single project when faults occur. Here, defect risk is represented by the loss amount on the horizontal axis, and the vertical axis probability is the probability that this defect risk will occur. As shown in Figure 2, the shape of the distribution is log normal with a long tail toward the right. From the perspective of real-world risk management, this is considered a form for which management is required.
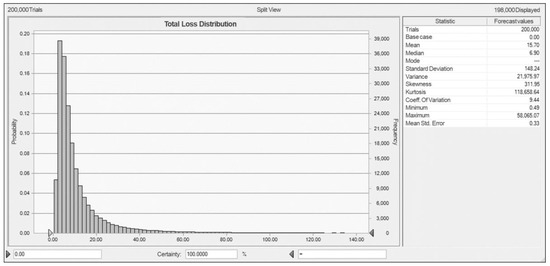
Figure 2.
Results of total loss distribution analysis.
In most cases of normal risk analysis, mean values are used or the existing data is received as-is without any separate analysis. However, a variety of risk analysis methods that are based on probability and statistics theory have been presented, and operational risk analysis techniques such as LDA have been developed. By using these, it is possible to manage risk more effectively. Based on the distribution model, the mean value can be calculated as the expected loss when a project is performed internally within a company to handle risk through cash reserves. Abnormal mean values can be calculated as unexpected loss, and the risk can be handled through a variety of means such as insurance.
In this context, it is possible to handle basic defect risk by calculating the 15.70 $/m2 total loss distribution mean value as a ratio of losses due to defects and total area and multiply it by the project’s total area, as shown in Figure 2 and Table 11. In addition, it is possible to handle cases that deviate from the mean values based on the defect loss by a percentile (Table 11) and to identify related scenarios and corresponding response plans.
Table 11.
Total loss by percentile.
5. Discussion
In this study, the importance of defects based on defect type and work type was examined using LDA. This is directly related to occupancy and should be considered in quality management. Further, to overcome the limitations of the defect analysis based on defect frequency, as reported in the existing literature, a more detailed analysis was carried out using LDA, which is a probabilistic methodology in which the defect cost is used as a weight. LDA can be used to manage defects in two ways.
The first is to adjust for dispute resolution, as shown in Figure 3. In this study, the risk matrix is composed of two dimensions: work type and defect type. However, defects can be classified into various criteria such as components, spaces, origin, and sources. This means that the risk matrix can be composed of multiple dimensions, and the LDA can be expanded by applying data to the corresponding matrix. Moreover, it is possible to generate a total loss distribution by adjusting the total defect cost. In the total loss distribution, after the average value is set as the expected loss and as a reference point of the defective amount, it can be used to adjust the defect gap considered by the disputing parties. Furthermore, as the number of defects can be confirmed in terms of a percentile, it is possible to judge the number of defects and make a reasonable decision based on this judgment. In addition, depending on the type of each defect in the risk matrix, it is possible to break down the number of defects and define its reference point in a detailed defect classification system to facilitate detailed decision-making.
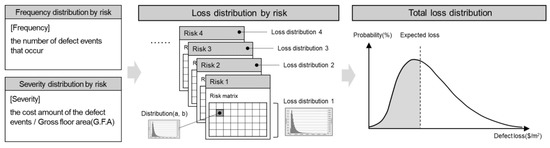
Figure 3.
Concept of dispute resolution using Loss Distribution Approach (LDA).
The second is to use the LDA as a post evaluation and feedback instrument, as shown in Figure 4. If the previously constructed loss distribution is represented as the cumulative probability distribution shown in Figure 4, one can confirm that the project has a relatively large number of defects when the real loss (RL) of the post-evaluation target project is to the right of the expected loss. As shown in the right side of Figure 4, LDA is used to construct a risk matrix for individual risks and defines a probability distribution for each matrix cell. Thus, the type and cause of a relatively high or low RL can be identified, feedback can be given to the sub-contract associated with that part, or evaluation data from the sub-contract can be used for future contract review.
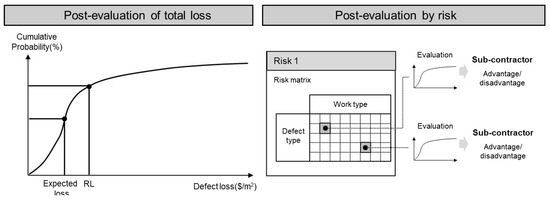
Figure 4.
Concept of post-evaluation using LDA.
6. Conclusions
Various defects in the maintenance phase weaken the performance of buildings. This adversely affects not only the quality of life of the customer and the reputation of the contractor, but also building’s sustainability. In other words, degradation of the various building components caused by defects, may eventually lead to wastes of resources and energy. Therefore, it is very important to manage the defects to ensure the sustainability of buildings.
This study aimed to find a method to perform detailed analysis of the effects of defect risk in residential buildings; we chose LDA, a method from the financial sector for identifying and quantifying operational risks, such as the occurrence of defects in the occupancy phase.
The defect risk was checked via the loss distribution of each cell, and the results showed that defect risk is concentrated on RC, finish, and MEP work. In the case of RC work, which has a close relationship with structural stability, broken items and water leaks due to cracks or damage were the most severe. In the case of finish work, the defect types were more various, and showed LSHF characteristics. Not only does the finish work have a direct effect on the residential environment, it is also directly observable by residents, and so the frequency of defects is very high. For MEP, where there is a relatively large amount of installation, it was found that severe defects occur owing to MEP product malfunctions or installation problems.
The total loss distribution was calculated by combining the loss distributions of each cell; it was used to quantify defect risk and to facilitate an efficient response. The total loss distribution’s mean value was 15.70 $/m2, calculated according to the loss amounts caused by the defects. Percentiles for amounts higher than this can be used to create various scenarios and develop corresponding response plans. Using this approach, when defect disputes occur, it will be possible to understand the level of the defect cost in a way that considers all of the parties involved in the dispute. In addition, it will be possible to use the residential buildings’ loss distribution for each cell to identify work types with relatively high or low defect risks in the occupancy phase. Problems related to these areas can be given as feedback to subcontractors, and evaluation data on subcontractors can be procured for use in later subcontract evaluations.
Generally, there are systems that protect customers from defects, but there are still disputes over defects in many residential buildings. Generally, contractors are responsible for various defects or omissions for a certain period of time, but customers’ complaints accumulate as the various building defects arising during occupancy are officially recognized, and these defects require time to be repaired. Defects found by customers during occupancy are mostly due to human error, material, and design rather than the construction method itself. Therefore, their occurrence can be minimized through quality control before handover. This also reduces the rework costs incurred during occupancy and maintains the reputation of contractors. However, contractors are constrained to examine potential flaws, as they must maintain a contracted construction period while controlling the various issues and uncertainties associated with the work of multiple subcontractors. In this regard, contractors need a strategy to manage defects efficiently. In addition, conflicts between customers and contractors often arise as a result of disagreements over defect costs, which is likely to lead to an extended dispute. As this will cause actual damage to both customers and contractors, it is necessary to establish a reasonable dispute settlement system. From this point of view, one would expect that the importance of each type of work and defect discussed here can contribute to an efficient quality control system and can be used as a basis for post-evaluation and dispute settlement.
If sufficient data can be procured, this study could be extended to create a more detailed risk matrix, and consequently a more robust loss distribution. In this study, the risk matrix was created from defect types and work types; however, in previous studies, analysis has also been performed on components and defect causes. If a risk matrix considered these and its loss distribution was calculated, a variety of response plans for defects could be found.
Author Contributions
S.L. developed the concept and drafted the manuscript. J.K. revised the manuscript and supervised the overall work. S.L. reviewed the manuscript. All authors read and approved the manuscript.
Funding
This work was supported by the research fund of Hanyang University (HY-2018).
Conflicts of Interest
The authors declare no conflict of interest.
References
- Pulselli, R.M.; Simoncini, E.; Pulselli, F.M.; Bastianoni, S. Emergy analysis of building manufacturing, maintenance and use: Em-building indices to evaluate housing sustainability. Energy Build. 2007, 39, 620–628. [Google Scholar] [CrossRef]
- Mills, A.; Love, P.E.D.; Williams, P. Defect costs in residential construction. J. Constr. Eng. Manag. 2009, 135, 12–16. [Google Scholar] [CrossRef]
- Ilozor, B.D.; Okoroh, M.I.; Egbu, C.E. Understanding residential house defects in Australia from the State of Victoria. Build. Environ. 2004, 39, 327–337. [Google Scholar] [CrossRef]
- Forcada, N.; Macarulla, M.; Fuertes, A.; Casals, M.; Gangolells, M.; Roca, X. Influence of building type on post-handover defects in housing. J. Perform. Constr. Facil. 2012, 26, 433–440. [Google Scholar] [CrossRef]
- Chapman, J.C. Learning from failures. In Learning from Construction Failures; Campbell, P., Ed.; Whittles Publishing: Dunbeath, UK, 2001. [Google Scholar]
- Watt, D.S. Building Pathology: Principles and Practice; Blackwell Science: Oxford, UK, 1999. [Google Scholar]
- Forcada, N.; Macarulla, M.; Gangolells, M.; Casals, M.; Fuertes, A.; Roca, X. Post-handover housing defects: Sources and origins. J. Perform. Constr. Facil. 2013, 27, 756–762. [Google Scholar] [CrossRef]
- Forcada, N.; Macarulla, M.; Love, P.E.D. Assessment of residential defects at post-handover. J. Constr. Eng. Manag. 2013, 139, 372–378. [Google Scholar] [CrossRef]
- Chong, W.K.; Low, S.P. Latent Building Defects: Causes and Design Strategies to Prevent Them. J. Perform. Constr. Facil. 2006, 20, 213–221. [Google Scholar] [CrossRef]
- Rotimi, F.E.; Tookey, J.; Rotimi, J.O. Evaluating Defect Reporting in New Residential Buildings in New Zealand. Buildings 2015, 5, 39–55. [Google Scholar] [CrossRef]
- Hopkin, T.; Lu, S.L.; Rogers, P.; Sexton, M. Detecting defects in the UK new-build housing sector: A learning perspective. Constr. Manag. Econ. 2016, 34, 35–45. [Google Scholar] [CrossRef]
- Chong, W.K.; Low, S.P. Assessment of defects at construction and occupancy stages. J. Perform. Constr. Facil. 2005, 19, 283–289. [Google Scholar] [CrossRef]
- Craig, N.; Sommerville, J.; Auchterlounie, T. Customer satisfaction and snagging in the UK private house building sector. In Proceedings of the 26th Annual ARCOM Conference, Leeds, UK, 6–8 September 2010; pp. 1199–1208. [Google Scholar]
- Volt, J. The Statistical Mechanics of Financial Markets; Springer: Berlin, Germany, 2005. [Google Scholar]
- Figini, S.; Giudici, P.; Pierpaolo, U.; Sanyal, A. A statistical method to optimize the combination of internal and external data in operational risk measurement. J. Oper. Risk 2007, 2, 69–78. [Google Scholar] [CrossRef]
- Georgiou, J. Verification of a building defect classification system for housing. Struct. Surv. 2010, 28, 370–383. [Google Scholar] [CrossRef]
- Macarulla, M.; Forcada, N.; Casals, M.; Gangolells, M.; Fuertes, A.; Roca, X. Standardizing Housing Defects: Classification, Validation, and Benefits. J. Constr. Eng. Manag. 2013, 139, 968–976. [Google Scholar] [CrossRef]
- Pan, W.; Thomas, R. Defects and Their Influencing Factors of Posthandover New-Build Homes. J. Perform. Constr. Facil. 2015, 29. [Google Scholar] [CrossRef]
- Forcada, N.; Macarulla, M.; Gangolells, M.; Casals, M. Handover defects: Comparison of construction and post-handover housing defects. Build. Res. Inf. 2016, 44, 279–288. [Google Scholar] [CrossRef]
- Del Solar, P.; Del Rio, M.; Villoria, P.; Nadal, A. Analysis of Recurrent Defects in the Execution of Ceramic-Coatings Cladding in Building Construction. J. Constr. Eng. Manag. 2016, 142. [Google Scholar] [CrossRef]
- Aljassmi, H.; Han, S.; Davis, S. Analysis of the Complex Mechanisms of Defect Generation in Construction Projects. J. Constr. Eng. Manag. 2016, 142. [Google Scholar] [CrossRef]
- Bortolini, R.; Forcada, N. Building Inspection System for Evaluating the Technical Performance of Existing Buildings. J. Perform. Constr. Facil. 2018, 32. [Google Scholar] [CrossRef]
- Lee, J.S. Value Engineering for Defect Prevention on Building Facade. J. Constr. Eng. Manag. 2018, 144. [Google Scholar] [CrossRef]
- Ong, M. The Basel Handbook: A Guide for Financial Practitioners; Risk books: London, UK, 2007. [Google Scholar]
- Alenander, C. Operational Risk: Regulation, Analysis and Management; Prentice Hall: Upper Saddle River, NJ, USA, 2007. [Google Scholar]
- Georgiou, J.; Love, P.E.D.; Smith, J. A comparison of defects in houses constructed by owners and registered builders in the Australian State of Victoria. Struct. Surv. 1999, 17, 160–169. [Google Scholar] [CrossRef]
- Kliukas, R.; Kudzys, A. Probabilistic durability prediction of existing building elements. J. Civ. Eng. Manag. 2004, 10, 107–112. [Google Scholar] [CrossRef]
- Kim, S.; Frangopol, D.M.; Zhu, B. Probabilistic Optimum Inspection/Repair Planning to Extend Lifetime of Deteriorating Structures. J. Perform. Constr. Facil. 2011, 25, 534–544. [Google Scholar] [CrossRef]
- Kim, S.; Frangopol, D.M.; Soliman, M. Generalized Probabilistic Framework for Optimum Inspection and Maintenance Planning. J. Struct. Eng. 2013, 139, 435–447. [Google Scholar] [CrossRef]
- Silva, A.; Neves, L.C.; Gaspar, P.L.; de Brito, J. Probabilistic transition of condition: Render facades. Build. Res. Inf. 2016, 44, 301–318. [Google Scholar] [CrossRef]


© 2018 by the authors. Licensee MDPI, Basel, Switzerland. This article is an open access article distributed under the terms and conditions of the Creative Commons Attribution (CC BY) license (http://creativecommons.org/licenses/by/4.0/).