Abstract
The main purpose of selecting proper designs for landfills is to accommodate quantities of waste without having a negative effect on the surrounding environment and human health. The Babylon Governorate (province) in Iraq was taken as an example of an arid area with very shallow groundwater and where irregular waste disposal sites had developed that had not been subject to international standards when they were selected for landfill use. In the current study, the suggested design for landfills is a base liner and final cover system. In this suggested design, the final cover system allows for three scenarios. The first scenario considers an evapotranspiration soil cover (ET) (capillary barriers type), the second scenario is a modified cover design of “RCRA Subtitle D”, and the third scenario is a combination of the first and second scenarios. The HELP 3.95 D model was applied to the selected landfill sites in the governorate to check if there was any penetration of the leachate that might in future percolate from the landfill’s bottom barrier layer in arid areas. The results from the suggested landfill design showed that there was no leachate percolation from the bottom barrier layer using the second and third scenarios. For the first scenario, however, there was a small amount of leachate through the bottom barrier layer in the years 2013 and 2014.
1. Introduction
Landfills are a common means of disposing waste. Approximately 95% of the world’s garbage is sent to landfill sites [1,2,3,4,5]. This method is considered an economic and systematic way to manage garbage when compared to other methods of managing waste, such as the reuse and recycling of garbage and the burning and subsequent burial of garbage in dump sites [5,6,7,8]. Inefficient landfill management systems in several countries are the cause of harmful impacts that affect both the environment and human health (e.g., surface water and groundwater contamination, gas emissions, and even human suffocation because of the spontaneous combustion of landfill waste) [2,5,9]. In addition, the leachate that is generated within landfills is considered a prime cause of groundwater contamination. The liquid leachate includes different types of pollutants which filter through the landfill’s layers [2,3,10]. In addition to the design process, landfill siting is also a complex task since several significant factors should be accommodated within any study area. These factors include general and local regulations, economic factors, environmental factors, population growth rates, increasing public awareness, human health, and, for local residents, the difficulty of finding land that meets the required conditions to be a landfill site in the face of growing official objection and popular dissent surrounding the idea of the establishment of landfill locations in their areas [2,11,12,13]. This is also the case with respect to landfill siting in the Babylon Governorate in Iraq.
Landfill design broadly includes two systems: the base liner system and the final cover system. A base liner system is used to control pollution that results from waste in modern landfills. The liner system is intended to protect environmental parameters (soil and ground water) from contamination arising from landfill. In modern landfills, the base liner system is constructed to form a barrier between the environment and the waste and to drain the leachate to treatment facilities through leachate collection systems. There are many types of landfill liner systems, but they can broadly be described as the single-liner system, the composite-liner system, and the double-liner system [14].
In contrast, the final cover system is used to separate the waste from the environment through placing layers of final cover over the waste. The final cover layers act to prevent water from infiltrating into the mass of waste, thereby reducing leachate generation [15]. In addition, the system minimizes surface erosion by boosting drainage into the final cover layers. In theory, the final cover system should operate well during its life span, with the lowest cost for maintenance whilst accommodating settlement due to any decomposition of organic materials in the waste mass [16].
According to [15], the main designs used as final cover solutions for landfills in semi-arid and arid areas in the USA are the “RCRA Subtitle D Cover” and the “RCRA Subtitle C Cover” systems. However, there are alternative designs for a final cover system that can be used, and these include a geosynthetic clay liner cover, a capillary barrier cover, an anisotropic barrier cover, and an evapotranspiration soil cover [17]. Indeed, in the literature, many studies have given environmental guidelines and recommendations for landfill design in various countries and in different regions, as can be seen below.
In New South Wales, Australia, for example, the land area west of the Great Dividing Range has an arid to semi-arid climate and average rainfall ranges from 15 to 50 cm per annum. The annual average rainfall in Eastern New South Wales ranges from 70 to 140 cm per annum, while the annual rainfall in the far northwest of New South Wales is less than 18 cm per annum [18].
In New South Wales, the base liner system design for landfills involves either a primary barrier for municipal solid waste or a dual barrier system (primary and secondary barriers) for restricted (hazardous) solid waste landfills [19]. The primary barrier liner system can be used in arid to semi-arid areas, and its layers are [19] (i) a compacted sub-base, 20 cm thick, (ii) a compacted clay liner (barrier soil) ≤1 m thick, with a gradient of 3% transverse and 1% longitudinal direction and a hydraulic conductivity of ≤1.0 × 10⁻⁹ m/s, (iii) a geomembrane placed over the clay liner with a thickness of < 2 mm, (iv) a protective geotextile placed on top of the geomembrane to protect it from damage, (v) a non-woven separation geotextile placed over the drainage layer to decrease the entry of fine materials from the waste, (vi) a drainage layer (gravel) with a thickness of 30 cm, and with a hydraulic conductivity of ≥1.0 × 10⁻³ m/s. The leachate collection pipes are laid within the drainage layer, and the internal diameter of the pipes should be >15 cm with an interval of <25 m.
The recommended design for the final cover layers for landfills in New South Wales (from the top to the bottom layers) is as follows: (i) topsoil of 20 cm, (ii) a re-vegetation layer at least 1 m thick, (iii) a top barrier layer (compacted clay) with a thickness of 60 cm and saturated hydraulic conductivity of ≥1.0 × 10⁻⁹ m/s, and (iv) a 30 cm thick support layer.
In Kuwait, in the Arabian Gulf (an arid area), the suggested designs for landfill include both the base liner system and the final cover system [20]. The layers of the base liner system (from bottom to top) are as follows: (i) a sub grade layer of native soil, with a minimum saturated hydraulic conductivity of 1.0 × 10⁻⁷ cm/s, (ii) a highly compacted barrier layer of 90 cm with four lifts (each lift is 22.5 cm) (the hydraulic conductivity of this barrier layer is 1.0 × 10⁻⁶ cm/s), (iii) a drainage layer containing coarse materials (gravel or sand) with a thickness of 30 cm, and containing the leachate collection pipes, (iv) a geotextile filter layer over the drainage layer to protect it from clogging by fine materials that might transfer from the waste mass above, and (v) a 60 cm deep protective layer, used to protect the leachate collection pipes from damage and to filter leachate before it is removed to treatment units.
The characteristics of suggested layers for the final cover system for landfill in Kuwait (from top to bottom) are as follows: (i) a topsoil layer, 30 cm thick, containing a mixture of silt and natural gravel, and with a slope of more than 3%, (ii) a drainage layer (30 cm) consisting of sand or gravel, with a slope of 3% at the bottom of the layer and with a hydraulic conductivity of ≥1.0 × 10⁻² cm/s (drainage pipes are laid within the drainage layer to transfer leachate to the sump), and (iii) a top barrier layer comprising compacted soil with a hydraulic conductivity of ≥1.0 × 10⁻⁵ cm/s (the thickness of this layer is 60 cm with three lifts (each lift is 20 cm)), and (iv) a base layer (natural soil) used to collect gas released from landfill and as a foundation for the cover system layers.
Another example is the suggested design for the new phase of landfill in Southern Makkah, Saudi Arabia, which consists of the base liner system and the final cover (capping) system [16]. Makkah, Saudi Arabia, is located in a hot, desert climate, and it is notable for high temperatures, even in winter. The average mean annual temperatures are between 24.7 and 38.1 °C, and the average rainfall reading for the years 1986–2000 is 111.8 mm [21].
In Southern Makkah, the layers for the base liner system (from bottom to top) are as follows [16]: (i) a base layer consisting of compacted original soil (natural materials) in situ (the soil is laid down as compacted layers after excavating to the required depth of approximately 1 m above the water table), (ii) a 30 cm thick cushion layer placed over the base layer and composed of compacted clean sand (maximum dry density should be more than 90% since this layer acts as a cushion to the geomembrane liner), (iii) a leachate collection system containing gravel and 30 cm in thickness, and (iv) a 2.5 mm geomembrane (HDPE) used to prevent the groundwater contamination by the leachate.
The final cover (capping) system in Southern Makkah has the following layers [16]: (i) a foundation cover of sand material, 30 cm thick, placed over the waste mass, (ii) a cushion layer consisting of moderately compacted sand with a thickness of 30 cm (this layer is placed over the foundation cover, and the gas collection pipes are laid within this layer), (iii) a synthetic, bentonite (six mm thick) clay liner (GCL) positioned between two strong but thin layers of the unwoven geotextile as a sandwich to protect the bentonite barrier from cracks (the first unwoven geotextile layer is placed over the bentonite (as a drainage layer), while the second unwoven geotextile is positioned beneath the bentonite to reinforce the GCL liner), (iv) a 60 cm thick topsoil layer with a surface slope of between 3 and 5% to prevent surface erosion by runoff and water pools on the topsoil surface.
In countries that have a tropical climate (especially developing countries), annual rainfall is more than 250 cm and can be as much as 1000 cm in monsoon season [22]. Mean temperatures in tropical are more than 18 °C [23]. Both the base lining system and the final cover system are used in these regions.
In such climates, the base liner system consists of five layers as follows [5]: (i) a base liner layer of clay with a thickness of 40–80 cm, which has a hydraulic conductivity of ≤1.0 × 10⁻⁹ m/s, (ii) a geomembrane liner (HDPE), 0.4–0.5 cm thick, placed on the clay layer, and (iii) a leachate collection system that includes the drainage layer (gravel) and leachate collection pipes that are placed within it (the drainage layer should be more than 50 cm thick, with a slope >2%, with a hydraulic conductivity of ≥1.0 × 10⁻³ m/s), (iv) an optional non-wave geotextile filter layer placed over the drainage layer to protect it from clogging by fine materials that come from the layers above, and (v) a protective layer consisting of compacted soft particles of waste (e.g., paper, organic materials, shredded waste, other smaller particles of waste), with a thickness of between 30 and 50 cm and with a hydraulic conductivity of ≤1.0 × 10⁻⁵.
According to [5], the recommended design for the final cover in tropical countries is as follows: (i) an intermediate cover layer (compost material or soil) placed on the waste zone to a thickness of 50 cm and with a surface slope of between 5 and 10%, (ii) an alternative option where the intermediate cover can be replaced by a top sealing system (clay liner) based on settlement progress after 5–20 years (the thickness of the clay liner is 50 cm with a slope of >5%), and (iii) topsoil placed on the clay layer with a thickness of more than 50 cm. Additionally, in tropical countries, dense vegetation is suggested for use in the final cover of the landfill.
In cold regions (e.g., Ireland), the components of landfill design for non-hazardous waste include the base liner system and the final cover (capping) system [24]. The layers of the base liner system in Ireland are as follows: (i) subgrade, (ii) a composite liner (the lower component) that includes compacted clay, where the layer’s thickness is ≥1 m with four lifts (each lift is 25 cm), and the hydraulic conductivity of the compacted soil is ≤1.0 × 10⁻⁹ m/s, (iii) a composite liner (the upper component) consisting of a geomembrane liner (HDPE) with a thickness of ≥2 mm, (iv) a leachate collection system that contains the drainage layer (gravel) with a thickness of more than 50 cm, and where the hydraulic conductivity of the gravel is ≥1.0 × 10⁻³ m/s (the leachate collection pipes of 20 cm diameter are placed within the drainage layer), and (v) a protective layer laid over the leachate collection layer to prevent any fine materials from moving into the drainage layer and clogging it and to protect the geomembrane from damage.
The components of the final cover system in Ireland are as follows: (i) a topsoil layer, between 15 and 30 cm thick, consisting of uniform soil with a slope of more than 1:3 to prevent aggregation of water on the landfill’s surface, (ii) a sub-soil (topsoil support) layer positioned beneath the topsoil layer with a thickness of ≥1 m, (iii) a drainage layer beneath the support-topsoil layer with a thickness of 50 cm and a hydraulic conductivity of ≥1.0 × 10⁻³ m/s, (iv) a 60 cm thick compacted barrier layer with three lifts (each lift of 20 cm) and a hydraulic conductivity of ≤1.0 × 10⁻⁹ m/s, and (v) a foundation layer (optional) consisting of natural material with a thickness of more than 30 cm and a hydraulic conductivity of ≥1.0 × 10⁻³ m/s.
Despite these various working landfill systems that exist in the world, all processes regarding waste in the Babylon Governorate, starting from the collection to its disposal, lack proper management. At present, 16 locations for waste disposal are spread over the cities of the Babylon Governorate. All these locations are considered irregular according to Iraqi authorities, and these waste disposal locations have all failed to adopt the criteria used in developed countries when being selected [25]. According to [15,16], the composition of municipal solid waste (MSW) in the Babylon Governorate is 55% organic material. In the Babylon Governorate in 2013, the solid waste quantity was approximately 483 thousand (tonnes) [26,27], and the estimated solid waste quantity in 2030 will be close to one million (tonnes) [25]. In addition to this growth in MSW, landfill siting is complicated by the fact that the groundwater level (beneath the surface) in the Babylon Governorate is shallow. The maximum reading of groundwater depth is 15.97 m, while the minimum depth is 0.423 m [28].
As part of an updated study, and in order to check the soil characteristic as well as the water level from the ground surface to the groundwater depth, soil investigations were done in the year 2016 on the selected sites for landfill in the Babylon Governorate. This investigation provided accurate information to enable planners to know the locally available soil materials that could contribute in the construction of the suggested layers within the landfill design. In addition, this information proved useful when selecting the height, types, and the number of layers above the surface, as well as the depth and type of layers that will be used beneath the surface. The information also gives planners a suitable method for selecting layers and other requirements in cases where groundwater depth is shallow in the study area [24]. Criteria that conform to the requirements of international scientific and environmental standards were also employed in the process of selecting locations for landfill in all districts in the Babylon Governorate. Subsequently, multi-criteria methods (MCDM) and GIS software were applied together in order to establish the optimum location for landfills. The multi-criteria methods were used to obtain relative weights for the criteria in certain steps and different procedures. The main multi-criteria methods applied for this purpose were a pair-wise comparison method, ranking methods, and rating methods. Many previous studies have also used multi-criteria methods and GIS software to determine candidate sites for landfill such as [29,30,31,32,33,34].
In the present study, the “Hydrologic Evaluation of Landfill Performance” (HELP 3.95 D) model was applied to check the suggested design for the selected sites in the Babylon Governorate districts. This was because the main additional source for the leachate that resulted from waste is the amount of water that infiltrates from rainfall. This model enables users to compute the amount of leaching into the suggested layers and the water level on the surface of barrier layers at various periods. The required information that should be entered into the HELP model to calculate the leachate and to select the proper soil materials and layer thicknesses are weather parameters and the soil characteristics for each layer. The main goal of this model is to know whether any leachate is coming from the waste zone through the layers located under it and thus causing groundwater contamination [35,36,37]. To calculate the leachate throughout the layers in landfill sites, many previous studies have also applied the HELP model (e.g., [38,39,40,41,42,43]).
The aim of this study is to adopt a suitable design for landfills in the arid area which is distinguished by shallow groundwater depth. The Babylon Governorate was selected to be a case study for the arid area in order to validate the suggested design for landfill that will apply in the study area: the base liner system and the final cover system. The suitability of the three scenarios for the final cover system that will be used in the arid area were checked using the HELP model.
1.1. Study Area
The Babylon Governorate lies in the middle part of Iraq, about 100 km to the south of Baghdad (the Iraqi capital), between latitudes 32°5′41″ N and 33°7′36″ N and between longitudes 44°2′43″ E and 45°12′11″ E (Figure 1). The area of the Babylon Governorate is 5337 km2, and its population is about 2,200,000 [44]. Administratively, the Babylon Governorate has five major districts (locally called Qadhaas). These districts are Al-Hillah, Al-Mahawil, Al-Hashimiyah, Al-Qasim, and Al-Musayiab. Each district is divided into small cities, and, in total across the five districts there are 16 small cities that are administratively linked to major districts.
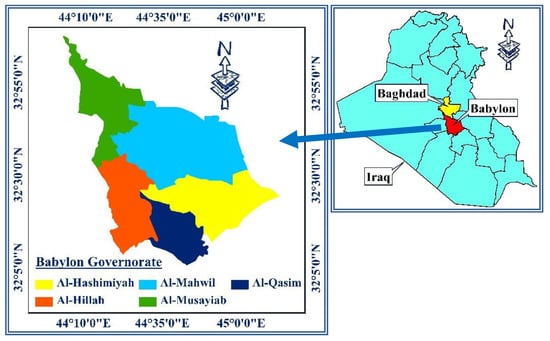
Figure 1.
The Babylon Governorate, Iraq.
The Babylon Governorate is located in the arid, hot region between the rivers Tigris and Euphrates [45,46]. The winter is cold and rainy, with approximately 6.8 h/day of sunlight. The average daytime temperature is 24 °C and, although temperatures normally remain above 0 °C (10 °C), they can decrease below freezing during some nights. The summer season is particularly hot, with an average of approximately 12 h of sunlight/day and the weather is usually dry with no precipitation. The temperature during the summer can reach more than 50 °C in the shade. The average temperature ranges during the summer months are between 40 °C in the day and 24 °C at night. The annual average wind speed in the Babylon Governorate is 7.2 km/h, with the wind predominantly coming from the northwest and blowing throughout the year. For the years from 2005 to 2016, average annual precipitation was 102 mm. The average annual relative humidity is 45.8 [47,48,49,50].
1.2. Selecting and Assessing the Candidate sites for Landfill
GIS software was applied using (MCDM) methods to choose the optimum candidate locations for landfill in each district in the Babylon Governorate. Using the GIS software (10.5 (Lulea University of Technology, Lulea, Sweden)), for the high vulnerability criteria, 15 final maps were produced for the study area. These criteria are discussed and explained in [51,52,53,54,55,56]. Geologically, clastic (fertile) materials known as alluvial deposits extend from the surface to a depth of more than 50 m, and no rocks are exposed in this area [57].
Two locations were chosen from the final map of each district (10 locations for the Babylon governorate), and these locations were compared with their positions on the satellite images of the governorate. Moreover, in 2016, the soil investigations and soil sample testing for the chosen sites were conducted by the National Center for Construction Laboratories and Research Babylon-Iraqi Ministry of Housing & Construction [58,59].
Figure 2 shows the symbols of the chosen location in the Babylon governorate (two sites for each district). These symbols represent the Al-Hillah district (Location 1 (Hi-1) & Location 2 (Hi-2)), the Al-Qasim district (Location 1 (Q-1) & Location 2 (Q-2)), the Al-Hashimiyah district (Location 1 (Hs-1) & Location 2 (Hs-2)), the Al-Mahawil district (Location 1 (Ma-1) & Location 2 (Ma-2)), and the Al-Musayiab district (Location 1 (Hu-1) & Location 2 (Hu-2)) [52].
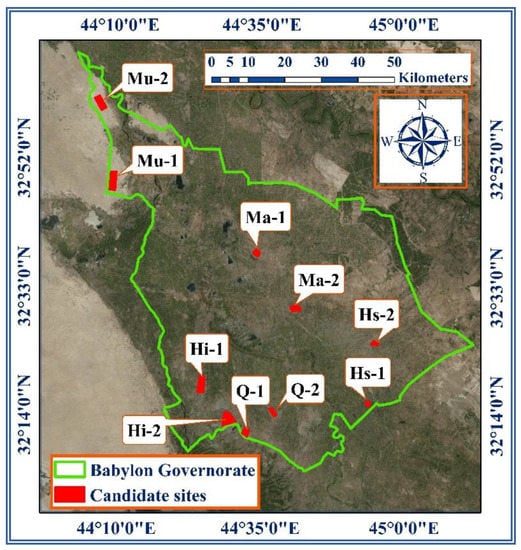
Figure 2.
Selected locations for landfill distributed throughout the districts of the Babylon Governorate.
2. Methodology
2.1. The HELP 3.95 D Model
The “Hydrologic Evaluation of Landfill Performance” (HELP) model is the most commonly applied model in the world, with a history extending over 30 years, and three versions are now available [37]. This model is used to compute the water balance of systems of the cover and bottom liners for polluted sites and landfills. Although this model does not compute a two-directional flow, it does compute the flow in a vertical direction (infiltration, evapotranspiration, and saturated and unsaturated vertical flow) and lateral dimension flow (lateral drainage, surface runoff) as well as the combination of these processes. Thus, the HELP model is defined as being ‘‘quasi-two directional.’’ The daily readings of the weather data for a specific period of years (up to 100 years) as well as the required data for the soil layers in the landfill are entered into this model to calculate the hydrological water balance in the landfill [37]. This is done by calculating the quantities of runoff, evapotranspiration (potential and actual), the quantity of soil water storage in the layers of landfill, leachate percolation through the barrier layers, and the amount of leachate collected by pipes from the drainage layer [35]. For open or closed landfills, the HELP model is applied to check the design of the base liner system and the final cover system [37].
2.2. Input Data
2.2.1. Evapotranspiration Date
The essential information to calculate the potential as well as actual evapotranspiration in the HELP model are tabulated in Table 1.

Table 1.
The required information data to calculate the evapotranspiration in the “Hydrologic Evaluation of Landfill Performance” (HELP) model.
2.2.2. Daily Weather Data
The required input weather data in the HELP model includes rainfall, temperature, and solar radiation. For the Babylon Governorate, the data for rainfall (daily depth), temperature (daily mean), and solar radiation (daily sum) for the years from 2005 to 2016 [50] were entered into the model (Figure 3a–c).
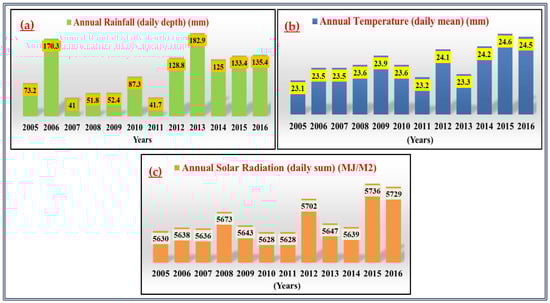
Figure 3.
Average annual readings for 2005–2016 of (a) rainfall, (b) temperature, and (c) solar radiation.
2.3. Data for Soil Layers Needed for Landfill Design in the HELP Model
The necessary data for soil layers for landfill design that will be entered into the HELP model can be briefly described as follows.
2.3.1. Landfill Materials Characteristics
Forty-four different kinds of material with their characteristics are found in the current model. The soil materials are classified into three groups based on their compaction degree using [36]. These groups are as follows: disturbed agricultural and surface soils (natural soils), moderately compacted soils, and highly compacted soils. The United States Department of Agriculture (USDA) and the Unified Soil Classification System (USCS) classifications were used for this purpose [36].
The properties of soil and other material can be changed in the HELP model. Therefore, in the current study, the properties of material (already existing in the HELP model) were entered in some layers for the suggested design of landfill, while other layers had their properties changed so that they had the same properties as soils local to the Babylon Governorate. All these materials entered into the model to construct the layers of the landfill should be standard and subjected to both the (USDA) system and the (USCS) system.
2.3.2. Layers Types in the HELP Model
In the HELP model, four layer-types can be used and entered in the soil and design window. These types, according to [36], are vertical percolation, lateral drainage, barrier soil layer, and geomembrane.
2.3.3. Calculating the Runoff Curve Number
The HELP model estimated the runoff curve number for the surface slope from the soil database using the developed method of Soil Conservation Service (SCS) for (AMC-II) [35,60]. The values of slope length and surface slope were 100 m and 3%, respectively, and the texture of the topsoil was silty-clay loam and the vegetation type on the landfill surface was fair grass.
2.3.4. The Required Height from Landfill Base to Groundwater Level
The height from groundwater level to the base of landfill should be more than 150 cm [61] or, alternatively, 200 cm [62]. Accordingly, in the Babylon Governorate, the height from the landfill base (on the surface) to the groundwater level was ≤2 m in the chosen locations for landfill.
2.4. Soil Layer Data for the Suggested Design
The suggested landfill design in the Babylon Governorate should be implemented in such a way as to reduce the influence of waste on human health and environmental factors, especially given that the governorate is located in an arid area and has a shallow groundwater depth. For the current study, the suggested design of landfill comprises the soils layers for the systems of the base liner and the final cover as follows.
2.4.1. Base Liner System
The suggested landfill design for the base liner system in these arid areas consists of the bottom barrier layer, the geomembrane liner, the leachate collection system, and the protective layer.
1. The Bottom Barrier Layer
The aim of implementing a bottom barrier layer within the landfill is to avert or reduce the contamination of soil, surface water, as well as groundwater by leachate or having polluted water generated from the landfill locations [24,63]. The bottom barrier layer acts to filter the leachate materials within it and to avoid the lateral surface flow of leachate [64]. The bottom barrier consists of composite materials of compacted soils, which have a low permeability.
In the current design, the bottom barrier layer consists of sandy clay with high compaction. The thickness of the bottom barrier layer is 0.6 m, and its saturated hydraulic conductivity is 1.0 × 10⁻⁷ cm/s.
2. The Geomembrane Liner
In a landfill, the geomembrane liner is put over the composite barrier layer [65], and the bottom barrier and geomembrane act together to prevent leachate percolation into the groundwater.
In this design, a geomembrane of high-density polyethylene (HDPE) was selected for the chosen landfills. The thickness of the geomembrane is 0.15 cm [61,64], and its hydraulic conductivity is 2.0 × 10⁻¹³ cm/s.
3. Leachate Collection System
The system of leachate collection consists of a drainage layer (gravel) and leachate collection pipes. The function of this system is to collect the percolated leachate from the waste body and send it, via the collection pipes, to the treatment facility [24,61]. The minimum design requirements for constructing the leachate collection system are as follows (Figure 3):
- the drainage blanket layer material is to include gravel material [19,24,63];
- the required thickness of the leachate collection system should be 30 cm [16,19,63];
- for the main drainpipes, the lateral spacing is ≤25 m [19] or even ≤30 m [66,67,68];
- for the main drain pipes, the minimum diameter should be 15 [19,61,63], 20 [24], or even 30 cm [68];
- for the main drainpipes, the minimum longitudinal slope toward the pit (sump) should be 1% [24] or 2% [19];
- two lateral pipes are to be joined with each main drainpipe, and, for each lateral pipe, the required space is 2 m [64];
- toward the direction of the main drainpipe, the minimum slope in transverse direction should be 2 [24] or 3% [19];
- all main drainpipes are joined with the main header pipe located around the cells of the site to send the leachate to the sump.
- the cleaning points should be sited along the main header pipe (outside the waste body) [68] and at the ends of the main drainpipes and lateral pipes as well as in the cross section of the main drain pipes and lateral pipes;
- a leachate collection pit (sump) is distributed in cells of a landfill at the lowest points of the bottom barrier surface, and gravitational force acts to transfer the leachate by pipes toward the sumps [24,66];
- operating pumps work to raise the collected leachate in the sumps to the necessary level [24] to send it to a treatment facility [5].
For the present design, the drainage blanket layer contains gravel material with a thickness of 30 cm and a saturated hydraulic conductivity of 3.0 × 10⁻¹ cm/s. The slope of the lateral drainage layer for the leachate collection system is 3%, and its length is 100 m.
4. Protection Layer
The protection layer is placed above the gravel material layer within the leachate collection system to ensure that the drainage layer continues to operate for an extended period. This is because waste particles must not be allowed to move into the drainage layer, and because of the need to protect the drainage layer from disruption and the drainage pipes from breakage [5,24].
In this suggested design, the protection layer (30 cm thick) consists of sand, with a saturated hydraulic conductivity of 5.0 × 10⁻³ cm/s.
Figure 4 shows the sketch of suggested soils layers for the base liner system.
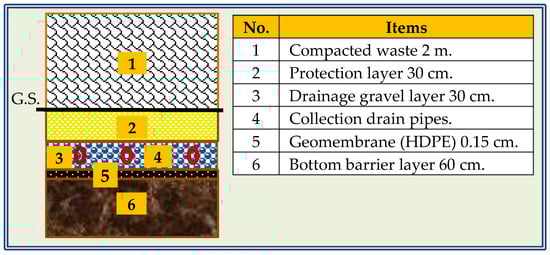
Figure 4.
Sketch of suggested soils layers for the base liner system.
2.4.2. Compacted Waste
For the current design, the waste was placed directly above the ground surface level at a total net height of 2 m after compacting in four lifts, where the height of each compacted lift is 0.5 m. The preferred typical height of waste after compacting is 2 or 4 m [69]. British Columbia (2016) [61] suggests the thickness of compacted waste of each lift should be ≤0.6 m.
To reduce the subsidence or settlement under the loading of cumulative solid waste, a 2 m height of compacted solid waste was used. Thus, the additional height of the compacted waste will increase the surface deformation of the bottom barrier layer [70]. The density of compacted waste is 700 kg/m3, which corresponds with the latest studies in this field [71,72,73]. The characteristics of the compacted waste with a density of 700 kg/m3 are a porosity of 0.61, a field capacity of 0.161 [74], and a hydraulic conductivity of 1.0 × 10⁻⁵ [75,76]. The daily soil cover of around 15 cm in thickness should take into consideration the need to cover the waste in the active landfill sites to avoid negative impacts on human health and surrounding environment elements, such as insect and rodent infestation, odors, and disease [5,16,61]
2.4.3. The Final Cover System
The purposes of implementing the final cover system in landfills are to (i) prevent waste affecting public health and the surrounding environment, (ii) reduce odors as well as methane gas release into the atmosphere, (iii) decrease the infiltration of rainfall into the waste, and (iv) minimize the erosion by runoff [5,19,20].
In this study, the suggested design of the final cover system comprises three scenarios. In the first scenario, the evapotranspiration soil cover (ET) (capillary barriers type) was used. This type of cover system is the one most applied recently for landfills in arid areas in the USA and other developed countries [15,17].
In the first scenario, the suggested design for the layers (from the bottom to the top) and their specifications for the final cover using the evapotranspiration soil cover (ET), uniform (monolithic) barriers are as follows (Figure 5a).
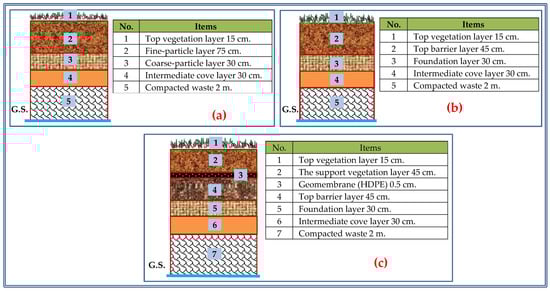
Figure 5.
Sketch of suggested landfill design for final cover systems of (a) the first scenario, (b) the second scenario, and (c) the third scenario.
- The intermediate cover consists of moderately compacted silty-clay loam of 30 cm depth with a hydraulic conductivity of 1.9 × 10⁻⁶. The intermediate cover is used to cover the waste, once the waste has reached the maximum allowable height in each cell in a landfill or can be used in the rainfall season or if the waste has not reached the required height after 30 days [5,61,77].
- The coarse-particle soil layer consists of coarse sand with a hydraulic conductivity of 1.0 × 10⁻² cm/s and a thickness of 30 cm. The difference in the unsaturated hydraulic conductivity between fine-particle soil and coarse-particle soil layers acts to break the capillary action at the interface of these layers. Consequently, it will reduce water percolation into the coarser-grained layer and thus into the waste mass [17].
- The top, uniform (monolithic) layer contains moderately compacted loam (fine practical) [15]. The saturated hydraulic conductivity is 1.0 × 10⁻⁵ cm/s, and its thickness is 75 cm. This layer acts to store water within the fine particle soil until it is removed from the vegetation through transpiration or from the surface of the soil through evaporation based on the high temperature during most months in the arid area [15]. If this layer reaches a saturation point, water can percolate into the coarse-particle soil layer quickly and then enter the waste mass easily [15]. In addition, this layer enables the growth of plant roots within it that extend from the topsoil layer [16].
- The topsoil layer comprises silty clayey loam materials. The thickness of the topsoil layer is 15 cm, and its saturated hydraulic conductivity is 4.0 × 10⁻⁵ cm/s.
The second scenario is the modified cover design of “RCRA Subtitle D,” which is also applied in arid areas and which is considered the cheapest system according to [15]. The required layers (from the bottom to the top) for the modified design for the final cover system and their specifications using “RCRA Subtitle D” are as follows (Figure 5b):
- The intermediate cover consists of moderately compacted silty-clay loam of 30 cm with a hydraulic conductivity of 1.0 × 10⁻⁶ cm/s.
- The foundation layer consists of coarse sand with a hydraulic conductivity of 1.0 × 10⁻² cm/s, and its thickness is 30 cm. In this design, the foundation layer is optional and is used to install the gas collection system within it.
- The highly compacted soil of sandy clay (as a barrier layer) with a thickness of 45 cm was used instead of the clay soil that is used in the “RCRA Subtitle D” design. The saturated hydraulic conductivity of this layer is 1.0 × 10⁻⁷ cm/s.
- The topsoil layer contains silty-clay loam materials. The thickness of the topsoil layer is 15 cm, and its saturated hydraulic conductivity is 4.0 × 10⁻⁵ cm/s.
The third scenario was designed to combine the first and second scenarios. The suggested design for the final cover consists of the supported vegetation layer that consists of moderate compacted loam (fine particles) to store water until it evaporates [17]. Beneath this layer is the top barrier layer (the high compacted sandy clay), which utilizes material readily available in the study area (The Babylon Governorate, Iraq). The geomembrane layer was positioned over the top barrier layer. The top barrier layer and the geomembrane liner work together to prevent water percolation into the waste body and reduce leachate generation. The principle of the third scenario is based on storing the water that drains from the surface, within the vegetation layer (fine particles), and the above top barrier until it evaporates from the surface due to the high temperature during most months in the arid area.
In the third scenario, the layers (from bottom to top) and their specifications for the final cover include the following (Figure 5c).
- The intermediate cover consists of moderately compacted silty-clay loam of 30 cm with a hydraulic conductivity of 1.0 × 10⁻⁶ cm/s.
- The foundation layer (30 cm thick) consists of coarse sand. The saturated hydraulic conductivity of the foundation layer is 1.0 × 10⁻² cm/s. This layer acts as a cushion for the layers that will be placed above it, and the gas collection system is usually laid within it over the waste zone [16,20].
- The top barrier layer contains highly compacted sandy clay with a thickness of 45 cm. The saturated hydraulic conductivity of the top barrier layer is ≤1.0 × 10⁻⁷ cm/s.
- The geomembrane layer (type HDPE), with a thickness of 0.5 cm [71], is put over the top barrier soil. It has a saturated hydraulic conductivity of 2.0 × 10⁻¹³ cm/s.
- The support vegetation layer consists of moderately compacted loam (fine particles) with a thickness of 45 cm, and its saturated hydraulic conductivity is 1.0 × 10⁻⁵ cm/s. This layer acts to promote the growth the roots within it that will extend from the topsoil layer [16]. It also stores water until evaporation occurs [17].
- The topsoil layer is used for the vegetation growth and involves silty clayey loam materials. The thickness of the topsoil layer is 15 cm, and its saturated hydraulic conductivity is 4.0 × 10⁻⁵ cm/s. The slope of the top surface for the final cover is approximately 3% (30H:1V) [24], while the side slope of the final cover of the landfill site is about 30% (3H:1V) [61,66].
2.5. Soils Layers Are Used in the HELP 3.95 D Model
The layers of the base liner system and the layers of the final cover system for all scenarios were entered into the HELP model. This is used to check the suggested landfill design that will be implemented in the chosen locations in The Babylon Governorate. The data for the characteristics of each layer were layer thickness, porosity, field capacity, wilting point, initial soil water content, and hydraulic conductivity [35,36]. The data for the characteristics of the layers for the suggested landfill design, considering three scenarios for the final cover system, can be seen in Table 2, Table 3 and Table 4.
Table 2.
Suggested layer data entered in the HELP model for the landfill design (first scenario).
Table 3.
Suggested layer data entered in the HELP model for the landfill design (second scenario).
Table 4.
Suggested layer data entered in the HELP model for the landfill design (third scenario).
3. Results
In the HELP model, after entering the data for the hydrological parameters in the Babylon Governorate along with the soil layers for the suggested landfill design, the extension files for “weather data files” and “evapotranspiration and soil & design data files” were created. The extension files were run in this model to produce results for the proposed design, and the results were as follows.
3.1. Evaporative Zone Results
For the period from 2005 to 2016, the value of the evaporative depth zone entered into the HELP model was 50 cm, and this number was entered based on the field test. Table 5 shows the results of the evaporative zone of landfills that were computed within this model after entering the required data for the three scenarios. The value of the total subsurface inflow for each year was zero mm for a successive 12- year period. The values of the water content in all soil layers (at the beginning of 2005) were 899.94 mm (first scenario), 851.68 mm (second scenario), and 987.84 mm (third scenario). These values were obtained by a summation of the value of soil water storage in all layers in 2005 and the initial rainfall value in 2005 of 40 mm.
Table 5.
Evaporative zone data and total initial soil water content computed in the HELP model for the three scenarios.
3.2. Annual Data for the Period of (2005–2016)
After entering the hydrological parameters for the Babylon Governorate, together with the required soil data for the layers of landfill into the HELP model, the annual information over the period from 2005 to 2016 were computed. The annual results values using the three scenarios are shown in Table 6. These values comprise the following parameters: rainfall, runoff, evapotranspiration (potential and actual), and change in water content in the soil for the selected period.
Table 6.
Yearly results of hydrological parameters data (mm) computed in HELP 3.95D model throughout the period of (2005–2016), utilizing three scenarios.
The amount of water content in all the soil layers over the period from 2005 to 2016 for the three scenarios is shown in Table 7.
Table 7.
Values of soil water and water storage change in all soil layers (mm) over the period of (2005–2016) (values computed in HELP 3.95 D model), utilizing three scenarios.
3.3. Mean Yearly Data Over a Successive 12 Years Period
The mean yearly rainfall data (mm) and percentages were computed within the HELP model for the years 2005–2016. In this model, the mean yearly rainfall reading was 10.193 cm. For the distribution of rainfall in the landfill into the runoff, actual evapotranspiration, and the change in water content in the soil for all scenarios, the mean yearly values of actual evapotranspiration, runoff, and change in soil water content can be seen in Table 8.
Table 8.
Mean yearly values of actual evapotranspiration, runoff, and change in soil water content of the three scenarios.
The mean yearly readings of water leakage into the layer(s), mean water level above layer(s) surface, and the collected water from drainage layer(s) are presented in Table 9. The maximum water head above the layers’ surface was computed based on [78].
Table 9.
Mean yearly readings computed in the HELP 3.95 D model for soil water behavior through the layers of landfill design over the period of 2005–2016, utilizing three scenarios.
3.4. Highest Daily Values for the Period of 2005–2016
The highest daily values of different parameters and soil water behavior in all proposed layers were computed within the HELP model for the successive 12- year period (2005–2016) (Table 10).
Table 10.
Highest daily readings computed in current model for rainfall, runoff, and behavior of water in all proposed layers for a successive 12- year period, utilizing the three scenarios.
3.5. Soil Water Storage for the Suggested Layers of Landfill (Initial and Final Values)
The values of soil water storage for the suggested layers in the landfill (initial value in 2005 and final value in 2016) were computed with the HELP model. Volumetric content of the soil water storage was also computed in the current model. The readings of initial soil water content in all layers in 2005 (at the end of the first year for the chosen period) for the first, second, and third scenarios were 93.994, 89.168, and 102.784 cm, respectively. The readings of final water content in all soil layers at the end of 2016 were 98.480 (first scenario), 91.918 (second scenario), and 106.647 cm (third scenario) (Table 11).
Table 11.
Soil water content for the suggested layers in the landfill (initial soil water content in 2005 and final soil water content in 2016) of the three scenarios.
4. Discussion
Adequate landfill design is the main factor in environmental requirements to prevent the contamination of groundwater by the leachate produced from a landfill site, especially in a low groundwater level and arid area like the Babylon Governorate, Iraq.
Proposed designs for the selected landfill sites in Babylon Governorate using a Geographic Information System environment and MCDM methods consist of a base liner system and a final cover system. For three scenarios, the suggested design for the base liner system consists of a protection layer of sand material with a thickness of 30 cm positioned beneath the zone of waste. A drainage layer (gravel) of 30 cm was placed beneath the protective layer, and the leachate collection pipes are laid within this layer to remove and send the leachate to the treatment facilities. A 0.15 cm thick geomembrane liner (a type of high-density polyethylene) was placed directly over the bottom barrier layer. The bottom barrier layer consists of composite soil of sandy clay at a thickness of 60 cm. This layer is set in situ as four sub-layers (each being 15 cm thick) under high compaction.
To avoid crack forming in the clay layer when it is exposed to drying from below by heat that is released from the bottom of the landfill or from surrounding conditions [19], a mixture of clay with granular materials (e.g., sand) is usually used to reduce the potential for swelling and shrinkage and to improve the shear strength of cohesive clayey soils [79]. Mixing clay soil with granular materials is a soil improvement method. The mixture of green clay (70%) or red clay (80%), which are available in Iraq, with sand (in the bottom barrier) yields a hydraulic conductivity of 1.0 × 10⁻⁹ cm/s [41].
The compacted waste is put over the ground surface because of the low groundwater level in Babylon Governorate. The solid waste height was 2 m, with a density of 700 kg/m3 (after compaction) in order to reduce settlement and deformation on the bottom barrier soil surface under the cumulative loads of waste over the landfill surface. Then, the intermediate soil cover of 30 cm is used to cover the waste mass to conserve the environment in the surrounding areas.
In the current design of landfills, for the final cover system, three scenarios that are suitable for arid areas were suggested. The first scenario (evapotranspiration soil cover (ET), capillary barriers) contains the coarse-particle soil layer (coarse sand) with a 30 cm thickness, and this is placed over the intermediate cover layer. The fine-particle soil layer (moderately compacted loam) with a thickness of 75 cm is placed on the coarse particle soil layer. A 15 cm thick layer of topsoil is then placed on top of the fine particle soil layer, which consists of silty-clay loam.
In the second scenario, the “RCRA Subtitle D” cover design was used, but it was modified by adding the coarse sand layer (30 cm) as a foundation for the layers of the cover system, and which was placed over the intermediate cover. Then, the clay soil that is used in the “RCRA Subtitle D” cover design as a barrier layer was replaced by the highly compacted soil of sandy clay (45 cm), which is available in the Babylon Governorate. The topsoil layer of silty clayey loam is placed over the barrier layer with a thickness of 15 cm.
In the third scenario, the suggested design for the final cover system was based on combining certain layers from the first and second scenarios. This cover consists of the intermediate cover (30 cm) of moderately compacted silty-clay loam, and the foundation layer (30 cm) of coarse sand placed over the intermediate cover. The top barrier layer (45 cm) of highly compacted sandy clay, and with a saturated hydraulic conductivity of 1.0 × 10⁻⁷ cm/s, was placed over the foundation layer. The 0.5 cm thick geomembrane liner (HDPE) was placed on the top barrier. The supported vegetation layer of moderately compacted loam (fine particles) was placed on the geomembrane liner, and this layer is used to store water within it and on the top barrier layer until evaporation takes place. The topsoil layer (15 cm) of silty-clay loam is placed over the supported vegetation layer.
According to [41], mixing sand with proportions of green clay (30–50%) and red clay (40–60%) yields a hydraulic conductivity of 1.0 × 10⁻⁹ to 1.0 × 10⁻¹⁰ m/s. Therefore, the top barrier layer of sandy clay is more suitable than the clayey soil for the final cover system of landfills in arid areas.
The top barrier layer (in the second and third scenarios) and the top uniform (monolithic) layer (fine practical) (in the first scenario) must be maintained for a certain time to avoid deformation on these layers’ surface (without a ripple) and cracks when the organic material within the waste zone degrades [5]. The waste in the Babylon Governorate is composed of more than 55% organic material [80]. Therefore, a similar amount of soil material was used to construct the top barrier layer and the top uniform layer, but this should be subject to monitoring and maintenance (if it is necessary) for a specific time until the settlement in these surface layers has completed before placing other layers of the final cover system over it.
In the current design, the HELP 3.95 D model was applied to check the suggested design appropriateness for the chosen landfill sites in Babylon Governorate. This model considers hydrology parameter data as well as the required data for evapotranspiration and soil layers for the proposed landfill design. In the current model, results showed that the mean yearly rainfall reading was 10.193 cm for the chosen period from 2005 to 2016. Actual evapotranspiration, runoff, and changes in water content in all soil layers are the results of mean yearly rainfall. The value of mean yearly runoff (22.39 mm) in the second scenario was higher than in both the first scenario (10.76 mm) and the third scenario (10.74 mm). The values of actual evapotranspiration in the first scenario (87.44 mm) and third scenario (87.97 mm) were more than that in the second scenario (77.25 mm). The mean yearly values of change in water storage were 3.74 (Scenario 1), 2.29 (Scenario 2), and 3.22 mm (Scenario 3) (Figure 6).
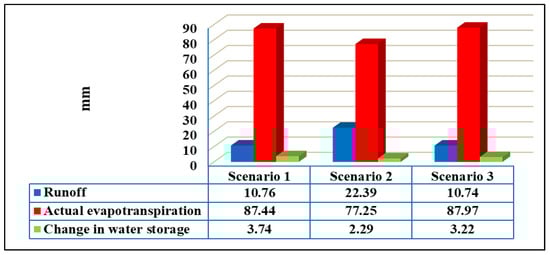
Figure 6.
The mean yearly values of runoff, actual evapotranspiration, and change in water storage in soil of the three scenarios.
For all scenarios, the mean yearly results obtained showed that there was no water percolation through the bottom barrier layer during the years from 2005 to 2016. In the first scenario, the amount of water drainage that was removed from the leachate collection system was 3.0 × 10⁻⁵ mm. In the second and third scenarios, there was no leakage through the soil layers that were positioned under the ground surface. In the third scenario, the mean water level above the geomembrane surface (Layer 3) within the final cover system was about 33 mm, and the amount of water leakage into the top barrier soil (Layer 4) was 0.011 mm.
In this model, annual runoff values in the second scenario were higher than the values in the first and third scenarios, which were close to each other. Furthermore, the values of the actual evapotranspiration for the first and third scenarios were almost equal and more than the values in the second scenario (Figure 7). For all three scenarios, most values of actual evapotranspiration during the chosen period (2005–2016) were higher than runoff values, except for some years in the second scenario where the runoff values were higher than those of the actual evapotranspiration due to a high amount of rainfall.
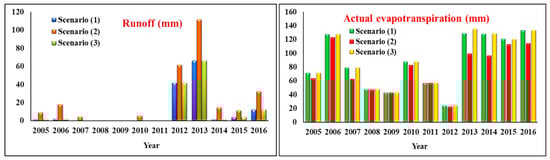
Figure 7.
Annual values of runoff and actual evapotranspiration of the three scenarios.
In the second and third scenarios, the results of annual values showed that there was no water percolation into the bottom barrier layer for the years from 2005 to 2016. Moreover, in the first scenario, there was no leachate percolation through the bottom barrier layer during the study years apart from in 2013 and 2014. In these years, water percolation figures were 1.4 × 10⁻⁵ and 4.0 × 10⁻⁶ mm, respectively. These values are considered small, and they resulted from the high rate of rainfall during these years. In such cases, the layer (Layer 2) of fine particle soil (within the final cover) reached a limit of saturation, meaning that water infiltrated quickly into the layer of coarse particle soil, and through it to the under layers. Although, these values were small, they should still be considered when adopting this design in the study area.
The amount of water content in all soil layers for the years from 2005 to 2016 for the second scenario were more than that for the first scenario, and the first scenario was higher than the third scenario. This is due to the use of additional layers that acted to increase the final water content of the soils in each scenario. For the three scenarios, the values of water content change in the soil layers yielded a negative hydrological water balance in the last year of the selected period (2016). Therefore, the water interception was equal to 0.0 mm/year for the three scenarios.
In the HELP model, the maximum daily value of runoff in the second scenario (94.33 mm) was higher than in the first (65.62 mm) and third scenarios (65.47 mm). For all scenarios, there was no leakage of leachate from any layers of the landfill situated beneath the ground surface. In the third scenario, the average highest daily value of the water level above the geomembrane surface (Layer 3) was 156.65 mm. The value of water percolation through the top barrier soil (Layer 4) was 1.4 × 10⁻⁴ mm, but there was no water leakage through the layers beneath it.
The cost of the “RCRA Subtitle D” cover design (second scenario) was cheaper than the design for the final cover of evapotranspiration (ET) (the first scenario) [15]. Therefore, the third scenario of final cover design is logically more expensive than that in the first and second scenarios because it used additional layers in its design.
For all layers, the value that resulted from subtracting the amount of final soil water storage from the initial soil water storage was 4.486 (first scenario), 2.75 (second scenario), and 3.863 cm (third scenario). For all scenarios, the value of interception water was 0.0 mm/year.
In the first scenario, the additional value in the final water content in all soil layers in 2016 compared to initial water content in all soil layers in 2005 resulted from the infiltration of surface water through the topsoil layer (Layer 1), the fine particle soil layer (Layer 2), the coarse particle soil layer (Layer 3), and the waste mass layer (Layer 5). In the second scenario, the value of final water content in the soil layers of the landfill increased in 2016 due to the infiltration of a quantity of rainfall that came from the surface through the topsoil layer (Layer 1) and the top barrier soil layer (Layer 2). In the third scenario, the value of final water content in all the soil layers in 2016 was higher than the initial value of soil water content in 2005. This is because surface water infiltrated into the topsoil layer (Layer 1) and the support vegetation layer (Layer 2), so a small amount (1.543 cm) infiltrated into the waste mass itself (Layer 7).
5. Conclusions
In the present study, the suggested design of landfill in the arid areas consisted of a base liner system and a final cover system. For the final cover system in the study area, three scenarios were used. These scenarios are the evapotranspiration soil cover (ET) (capillary barriers) (first scenario), the modified cover design, “RCRA Subtitle D” (second scenario), and the third design scenario, suggested because it combines the advantageous properties of the first and second scenarios.
The three scenarios of the final cover system are suitable for implementing in arid areas based on the properties of weather parameters that are available in these areas (high temperature, and a low rainfall amount but with high intensity in a short duration). The results showed there was no leachate percolation through the bottom barrier layer during the years (2005–2016) using the second and third scenarios. In the first scenario, the small leachate amount only leaked through the bottom barrier layer in 2013 and 2014. Generally, therefore, the suggested landfill design has achieved its main objective in the Babylon Governorate, and this design can be applied in arid areas that have similar conditions to the study area.
Author Contributions
The first author writing the paper and collected data as well as implemented the field, lab, and modeling. Other authors assisted the first author in discussing the results and discussions.
Funding
The first author (Ali Chabuk) has a scholarship from University of Babylon, Iraq, to do his PhD degree at Lulea University of Technology (LTU). Lulea University of Technology provided all facilities (labs, computer, and others) for the first author and the fees for publishing papers.
Conflicts of Interest
The authors declare no conflict of interest.
References
- Kjeldsen, P.; Barlaz, M.A.; Rooker, A.P.; Baun, A.; Ledin, A.; Christensen, T.H. Present and Long-Term Composition of MSW Landfill Leachate: A Review. Crit. Rev. Environ. Sci. Technol. 2002, 32, 297–336. [Google Scholar] [CrossRef]
- Scott, J.; Beydoun, D.; Amal, R.; Low, G.; Cattle, J. Landfill management, Leachate Generation, and Leach Testing of solid Wastes in Australia and Overseas. Crit. Rev. Environ. Sci. Technol. 2005, 35, 239–332. [Google Scholar] [CrossRef]
- He, Y.; Zhao, Y.; Zhou, G.; Huang, M. Field Assessment of Stratified Aged-Refuse-Based Reactor for Landfill Leachate Treatment. Waste Manag. Res. 2011, 29, 1294–1302. [Google Scholar] [CrossRef] [PubMed]
- Hart, J. Geophysical Investigation of the Clay Cap at a Closed Landfill in Southwestern Ontario, Canada. Master’s Thesis, Department of Earth and Environmental Sciences, University of Windsor, Windsor, Canada, 2013. [Google Scholar]
- Munawar, E.; Fellner, J. Guidelines for Design and Operation of Municipal Solid Waste Landfills in Tropical Climates; Report; International Solid Waste Association (ISWA): Wien, Austria, 2013. [Google Scholar]
- Brockerhoff, M.P. An Urbanizing World; Population Reference Bureau (PRB): Washington, DC, USA, 2000; Volume 55, p. 48. [Google Scholar]
- Proske, H.; Vlcko, J.; Rosenbaum, M.S.; Dorn, M.; Culshaw, M.; Marker, B. Special Purpose Mapping for Waste Disposal Sites. Bull. Eng. Geol. Environ. 2005, 64, 1–54. [Google Scholar] [CrossRef]
- Moeinaddini, M.; Khorasani, N.; Danehkar, A.; Darvishsefat, A.A.; Zienalyan, M. Siting MSW Landfill Using Weighted Linear Combination and Analytical Hierarchy Process (AHP) Methodology in GIS Environment (Case Study: Karaj). Waste Manag. 2010, 30, 912–920. [Google Scholar] [CrossRef] [PubMed]
- Joseph, K.; Nagendran, R.; Palanivelu, K.; Thanasekaran, K.; Visvanathan, C. Dumpsite Rehabilitation and Landfill Mining; Anna University: Chennai, India, 2004; p. 65. Available online: http://saahas.org/wpcontent-saahas/uploads/2015/02/Landfills3.pdf (accessed on 5 October 2017).
- Schmoll, O.; Howard, G.; Chilton, G.; Chorus, I. Protecting Ground Water for Health: Managing the Quality of Drinking-Water Sources; World Health Organization: Geneva, Switzerland, 2006; p. 697. ISBN 9241546689. [Google Scholar]
- Lober, D.J. Resolving the Siting Impasse: Modeling Social and Environmental Locational Criteria with a Geographic Information System. J. Am. Plan. Assoc. 1995, 61, 482–495. [Google Scholar] [CrossRef]
- Siddiqui, M.Z.; Everett, J.W.; Vieux, B.E. Landfill Siting Using Geographic Information Systems: A Demonstration. J. Environ. Eng. 1996, 122, 515–523. [Google Scholar] [CrossRef]
- Lin, H.; Kao, J. Enhanced spatial model for landfill siting analysis. J. Environ. Eng. 1999, 125, 845–951. [Google Scholar] [CrossRef]
- Hughes, K.; Christy, A.; Heimlich, J. Landfill Types and Liner Systems; Ohio State University Extension Fact Sheet CDFS-138-05; The Ohio State University: Columbus, OH, USA, 2013; p. 4. Available online: http://ce561.ce.metu.edu.tr/files/2013/11/liner-1.pdf (accessed on 3 July 2017).
- U.S. Department of Energy. Alternative Landfill Cover. Subsurface Contaminants Focus Area and Characterization, Monitoring, and Sensor Technology Crosscutting Program. Office of Environmental Management Office of Science and Technology. 2000; p. 27. Available online: https://www.flagstaff.az.gov/DocumentCenter/View/11018/USDOE-2000?bidId= (accessed on 2 July 2017).
- Abu-Rizaiza, A.S.; Abdul Aziz, H. The Proposed Design and Tendering for the New Phase of Landfill at Southern Makkah Disposal Site: Phase 1; Design Report; Collaborative Consultation Project between King Abdulaziz University: Jeddah, Saudi Arabia; Universiti Sains Malaysia: Penang, Malaysia, 2011; p. 80. [Google Scholar]
- Madalinski, K.L.; Gratton, D.N.; Weisman, R.J. Evapotranspiration Covers: An Innovative Approach to Remediate and Close Contaminated Sites. Remediation 2003, 14, 55–67. [Google Scholar] [CrossRef]
- Wikipedia. Available online: https://en.wikipedia.org/wiki/New_South_Wales (accessed on 23 June 2018).
- NSW EPA (New South Wales Environment Protection Authority). Environmental Guidelines Solid Waste Landfills, 2nd ed.; NSW EPA: Sydney, Australia, 2016; p. 95.
- Al-Yaqout, A.; Townsend, F.; ASCE Members. Strategy for Landfill Design in Arid Regions, Practice Periodical of Hazardous, Toxic, and Radioactive. Waste Manag. 2001, 5, 2–13. [Google Scholar]
- Wikipedia. Available online: https://en.wikipedia.org/wiki/Mecca (accessed on 23 June 2018).
- Atmosphere, Climate & Environment Information Programme, Encyclopedia of atmospheric Environment. 2000. Available online: http://www.ecoca.ro/meteo/tutorial/Climate/Older/Rainfall_Patterns.html (accessed on 1 August 2018).
- Reis, J. What Is the Meaning of Tropical Climate, Sciencing. 2017. Available online: https://sciencing.com/meaning-tropical-climate-8722483.html (accessed on 1 August 2018).
- Ireland EPA (Ireland Environmental Protection Agency). Landfill Manuals Landfill Site Design; Environmental Protection Agency: Wexford, Ireland, 2000; p. 154.
- Chabuk, A.; Al-Ansari, N.; Hussain, H.M.; Knutsson, S.; Pusch, R. Present Status of Solid Waste Management at Babylon Governorate, Iraq. Engineering 2015, 7, 408–423. [Google Scholar] [CrossRef]
- Iraqi Ministry of Municipalities and Public Works. Records of Directorate of Babylon Municipalities, Babylon; Internal Reports; Iraqi Ministry of Municipalities and Public Works: Baghdad, Iraq, 2013.
- Iraqi Ministry of Municipalities and Public Works. Records of Directorate of Al-Hillah Municipality, Babylon; Internal Reports; Iraqi Ministry of Municipalities and Public Works: Baghdad, Iraq, 2013.
- Iraqi Ministry of Water Resources. General Commission for Groundwater, Baghdad; Internal Reports; Iraqi Ministry of Water Resources: Baghdad, Iraq, 2015.
- Tsolaki-Fiaka, S.; Bathrellos, G.D.; Skilodimou, H.D. Multi-Criteria Decision Analysis for an Abandoned Quarry in the Evros Region (NE Greece). Land 2018, 7, 43. [Google Scholar] [CrossRef]
- Bathrellos, G.D.; Skilodimou, H.D.; Chousianitis, K.; Youssef, A.M.; Pradhan, B. Suitability estimation for urban development using multi-hazard assessment map. Sci. Total Environ. 2017, 575, 119–134. [Google Scholar] [CrossRef] [PubMed]
- Alavi, N.; Goudarzi, G.; Babaei, A.A.; Jaafarzadeh, N.; Hosseinzadeh, M. Municipal solid waste landfill site selection with geographic information systems and analytical hierarchy process: A case study in Mahshahr County, Iran. Waste Manag. Res. 2013, 3, 98–105. [Google Scholar] [CrossRef]
- Eskandari, M.; Homaee, M.; Mahmodi, S. An integrated multi criteria approach for landfill siting in a conflicting environmental, economical and socio–cultural area. Waste Manag. 2012, 32, 1528–1538. [Google Scholar] [CrossRef] [PubMed]
- Effat, H.A.; Hegazy, M.N. Mapping potential landfill sites for North Sinai cities using spatial multicriteria evaluation. Egypt. J. Remote Sens. Space Sci. 2012, 15, 125–133. [Google Scholar] [CrossRef]
- Uyan, M. MSW landfill site selection by combining AHP with GIS for Konya, Turkey. Environ. Earth Sci. 2014, 71, 1629–1639. [Google Scholar] [CrossRef]
- Schroeder, P.R.; Dozier, T.S.; Zappi, P.A.; McEnroe, B.M.; Sjostrom, J.W.; Peyton, R.L. The Hydrologic Evaluation of Landfill Performance (HELP) Model, Engineering Documentation for Version 3; U.S. Environmental Protection Agency Office of Research and Development: Washington, DC, USA, 1994; p. 126.
- Berger, K.U.; Schroeder, P.R. The Hydrologic Evaluation of Landfill Performance (HELP) Model, User’s Guide for HELP-D (Version 3.95 D); 6th Revised Edition for Version HELP 3.95D; Institute of Soil Science, University of Hamburg: Hamburg, Germany, 2013; p. 74. [Google Scholar]
- Berger, K.U. On the Current State of the Hydrologic Evaluation of Landfill Performance (HELP) Model. Waste Manag. 2015, 38, 201–209. [Google Scholar] [CrossRef]
- Alslaibi, T.; Mogheir, Y.; Afifi, S. Analysis of Landfill Components in Estimating the Percolated Leachate to Groundwater Using the HELP Model. Water Sci. Technol. 2010, 62, 1727–1734. [Google Scholar] [CrossRef]
- Alslaibi, T.M.; Abustan, I.; Mogheir, Y.K.; Afifi, S. Quantification of Leachate Discharged to Groundwater Using the Water Balance Method and the Hydrologic Evaluation of Landfill Performance (HELP) Model. Waste Manag. 2013, 3, 50–59. [Google Scholar] [CrossRef]
- Xu, Q.; Kim, H.; Jain, P.; Townsend, T.G. Hydrologic Evaluation of Landfill Performance (HELP) Modeling in Bioreactor Landfill Design and Permitting. J. Mater. Cycles Waste Manag. 2012, 14, 38–46. [Google Scholar] [CrossRef]
- Al-Taie, L. Performance of Clay Liners in Near-Surface Repositories in Desert Climate. Ph.D. Thesis, Soil Mechanics and Foundation Engineering, Lulea University of Technology, Lulea, Sweden, 2014. [Google Scholar]
- Frikha, Y.; Fellner, J.; Zairi, M. Leachate Generation from Landfill in a Semi-Arid Climate: A Qualitative and Quantitative Study from Sousse, Tunisia. Waste Manag. 2017, 35, 940–948. [Google Scholar] [CrossRef] [PubMed]
- Chabuk, A.; Al-Ansari, N.; Ezz-Aldeen, M.; Laue, J.; Pusch, R.; Hussain, M.H.; Knutsson, S. Two Scenarios for Landfills Design in Special Conditions Using the HELP Model: A Case Study in Babylon Governorate, Iraq. Sustainability 2018, 10, 125. [Google Scholar] [CrossRef]
- Iraqi Ministry of Planning. Records of Directorate of Census Babylon; Internal Reports; Iraqi Ministry of Planning: Baghdad, Iraq, 2017.
- Frenken, K. Irrigation in the Middle East Region in Figures, AQUASTAT Survey – 2008. Food and Agriculture Organization of the United Nations (FAO); FAO Water Reports (34); FAO: Rome, Italy, 2009; p. 423. [Google Scholar]
- Kadhim, A.J.; Ali, A.H. Climate Classification of the Kifil Area South Babylon Governorate/Iraq. Researches of the first international conference (Babylon and Razi Universities). 2011, pp. 1–8. Available online: https://www.iasj.net/iasj?func=fulltext&aId=49278 (accessed on 10 June 2018).
- Al Khalidy, K.S.; Chabuk, A.J.; Kadhim, M.M. Measurement of Lead Pollution in the Air of Babylon Governorate, Iraq during Year 2010, World Academy of Science. Eng. Technol. 2012, 6, 830–833. [Google Scholar]
- Iraqi Ministry of Municipalities and Public Works. Structural Plan of Babylon Governorate, The Directorate General of Urban Planning, Information Analysis Report (Revised), Stage 2; Iraqi Ministry of Municipalities and Public Works: Baghdad, Iraq, 2009; p. 223.
- CEB (Consulting Engineering Bureau College of Engineering). Hydrological Study of Ancient Babylon Site; Final Internal Report; Iraqi Ministry of Higher Education & Scientific Research, Baghdad University: Baghdad, Iraq, 2012.
- Iraqi Ministry of Transportation Constitutions. Iraqi Meteorological Organization & Seismology; Internal Reports; Iraqi Ministry of Transportation Constitutions: Baghdad, Iraq, 2017.
- Chabuk, A.; Al-Ansari, N.; Hussain, H.M.; Knutsson, S.; Pusch, R. Combining GIS Applications and Method of Multi-Criteria Decision-Making (AHP) For Landfill Siting in Al-Hashimiyah Qadhaa, Babylon, Iraq. Sustainability 2017, 9, 1932. [Google Scholar] [CrossRef]
- Chabuk, A.; Al-Ansari, N.; Hussain, H.M.; Knutsson, S.; Pusch, R.; Laue, J. Landfills Site Selection in Babylon, Iraq. J. Earth Sci. Geotech. Eng. 2017, 7, 1–15. [Google Scholar]
- Chabuk, A.; Al-Ansari, N.; Hussain, H.M.; Knutsson, S.; Pusch, R. Landfill Site Selection Using Geographic Information System (GIS) and AHP: A Case Study Al-Hillah Qadhaa, Babylon, Iraq. Waste Manag. Res. 2016, 34, 427–437. [Google Scholar] [CrossRef]
- Chabuk, A.; Al-Ansari, N.; Hussain, M.H.; Knutsson, S.; Pusch, R. GIS-based assessment of combined AHP and SAW methods for selecting suitable sites for landfill in Al-Musayiab Qadhaa Babylon, Iraq. Environ. Earth Sci. 2017, 76, 209–220. [Google Scholar] [CrossRef]
- Chabuk, A.; Al-Ansari, N.; Hussain, M.H.; Knutsson, S.; Pusch, R.; Laue, J. Landfill Sitting by Two Methods in Al-Qasim, Babylon, Iraq and Comparing Them Using Change Detection Method. Engineering 2017, 9, 723–737. [Google Scholar] [CrossRef]
- Chabuk, A.; Al-Ansari, N.; Hussain, M.H.; Knutsson, S.; Pusch, R. Landfill Sites Selection Using Analytical Hierarchy Process and Ratio Scale Weighting: Case Study of Al-Mahawil, Babylon, Iraq. Engineering 2017, 9, 123–141. [Google Scholar] [CrossRef]
- Jassim, S.Z.; Goff, J.C. Geology of Iraq. Dolin; Prague and Moravain Museum: Brno, Czech Republic, 2006; p. 356. [Google Scholar]
- Iraqi Ministry of Housing & Construction. National Center for Construction Laboratories and Research, Babylon; Internal Report; Iraqi Ministry of Housing & Construction: Baghdad, Iraq, 2016.
- Chabuk, A.; Al-Ansari, N.; Hussain, H.M.; Kamaleddin, S.; Knutsson, S.; Pusch, R.; Laue, J. Soil Characteristics in Selected Landfill Sites in the Babylon Governorate, Iraq. J. Civ. Eng. Archit. 2017, 11, 348–363. [Google Scholar] [CrossRef]
- Bauerle, M. Adapting the Hydrologic Evaluation of Landfill Performance (H.E.L.P.) Model to the Climatic and Soil Characteristics of Queensland. Master’a Thesis, School of Earth, Environmental and Biological Sciences, Science and Engineering Faculty, Queensland University of Technology, Brisbane, Australia, 2016; p. 175. [Google Scholar]
- British Columbia. Landfill Criteria for Municipal Solid Waste, 2nd ed.; British Columbia Ministry of Environment: Fort St. John, BC, USA, 2016; p. 76. [Google Scholar]
- WVJPCE (Wihan Visser Jan Palm Consulting Engineers); TAWGA (Thorsten Aab WSP Group Africa). Guidelines to the Design of a Landfill Facility, Landfill Interest Group: Seminar Session 2: Overview of Landfill Facility Design and Associated Infrastructure. 2014, p. 42. Available online: https://www.iwmsa.co.za/downloads/wspguidelines.pdf (accessed on 15 June 2017).
- Swedish EPA (Swedish Environmental Protection Agency). Landfilling of Waste, Handbook with General Advice to the Ordinance (SFS 2001:512) on Disposal of Waste and to Chapter 15, § 34 in the Environmental Code (SFS 1998:808); Swedish Environmental Protection Agency Handbook: Stockholm, Sweden, 2004; p. 43.
- Bagchi, A. Design of Landfills and Integrated Solid Waste Management, 3rd ed.; John Wiley & Sons, Inc.: Hoboken, NJ, USA, 2004; p. 696. [Google Scholar]
- Rowe, R.K.; Sangam, H.P. Durability of HDPE Geomembranes. Geotext. Geomembr. 2002, 20, 77–95. [Google Scholar] [CrossRef]
- JICA (Japan International Coorperation Agency). The Study on the Safe Closure and Rehabilitation of Landfill Sites in Malaysia. In Technical Guideline for Sanitary Landfill, Design and Operation, Revised Draft; Final Report; Japan International Cooperation Agency, Yachiyo Engineering Co., Ltd., EX Corporation: Tokyo, Japan, 2004; Volume 5, p. 126. [Google Scholar]
- Haubrichs, R. Sanitary Landfill Design Municipal Solid Waste (MSW); Civil Engineering, Waste and Water Environmental Engineering, University of Duisburg-Essen: Duisburg, Germany, 2006; Available online: https://www.uni-due.de/imperia/md/content/abfall/landfilldesignss2006_1.pdf (accessed on 25 October 2017).
- Ramke, H.-G. Appropriate Design and Operation of Sanitary Landfills. University of Applied Sciences Ostwestfalen-Lippe, Germany. Prepared for the International Conference on Sustainable Economic Development and Sound Resource Management in Central Asia. 2001, p. 30. Available online: http://www.hs-owl.de/fb8/fachgebiete/abfallwirtschaft/pdf/Tashkent_2001_Internet.pdf (accessed on 2 July 2018).
- Oni, O.A. An Investigation into the Impact of Sequential Filling on Properties of Emplaced Refuse Lifts and Moisture Stored in a Municipal Solid Waste Landfill. Ph.D. Thesis, Department of Civil and Environmental Engineering, University of Southampton, Southampton, UK, 2000; p. 226. [Google Scholar]
- Laue, J.; Nater, P.; Herzog, R. Soil Structure Interaction of Circular Footings on Layered Soil: First Results. Available online: https://books.google.com.hk/books?hl=zh-TW&lr=&id=Ti5yVnhdnxkC&oi=fnd&pg=PA463&dq=Soil+Structure+Interaction+of+Circular+Footings+on+Layered+Soil:+First+Results.+In+BGA+International+Conference+on+Foundations:+Innovations,+Observations,+Design+and+Practice:&ots=KqyPCSBodn&sig=b0yAHTtC3TonWfMgBvEDScmp2YM&redir_esc=y#v=onepage&q=Soil%20Structure%20Interaction%20of%20Circular%20Footings%20on%20Layered%20Soil%3A%20First%20Results.%20In%20BGA%20International%20Conference%20on%20Foundations%3A%20Innovations%2C%20Observations%2C%20Design%20and%20Practice%3A&f=false (accessed on 1 August 2018).
- Oweis, I.S.; Khera, R.P. Geotechnology of Waste Management, 2nd ed.; PWS Publishing Company: Boston, MA, USA, 1998; p. 472. [Google Scholar]
- Vesilind, P.A.; Worrell, W.; Reinhart, D. Solid Waste Engineering, Brooks/Cole; Pacific Grove: Philadelphia, PA, USA, 2002; p. 395. [Google Scholar]
- UNEP-IETC. International Source Book on Environmentally Sound Technologies (ESTs) for Municipal Solid Waste Management (MSWM) 2006. Available online: http://www.unep.or.jp/Ietc/ESTdir/Pub/MSW/index.asp (accessed on 20 February 2018).
- Haque, M.A.; Modal, M.S.A.; Tauhid-Ur-Rahman, M. Characterization of Leachate and Solid Waste of Dhaka City Corporation Landfill Site for Solid Waste Stabilization. Am. J. Civ. Eng. Archit. 2013, 1, 39–42. [Google Scholar]
- Jain, P.; Townsend, T.G.; Tolaymat, T.M. Steady–State Design of Vertical Wells for Liquids Addition at Bioreactor Landfills. Waste Manag. 2010, 30, 2022–2029. [Google Scholar] [CrossRef] [PubMed]
- Townsend, T.G.; Miller, W.L.; Earle, J.F.K. Leachate-Recycle Infiltration Ponds. J. Environ. Eng. 1995, 121, 465–471. [Google Scholar] [CrossRef]
- Joyal, C. New Solid Waste Facility–Preliminary Design Report; Final Report; Department of Public Works and Engineering, Dillon Consulting Limited: Yellowknife, NT, Canada, 2006; p. 77. [Google Scholar]
- McEnroe, B.M. Maximum Saturated Depth over Landfill Liner. University of Kansas ASCE. J. Environ. Eng. 1993, 119, 262–270. [Google Scholar] [CrossRef]
- Pusch, R. Geological Storage of Highly Radioactive Waste; Springer: Berlin/Heidelberg, Germany, 2008; p. 379. [Google Scholar] [CrossRef]
- Iraqi Ministry of Municipalities and Public Works. Records of Directorate of Babylon Municipalities, Babylon; Internal Reports; Iraqi Ministry of Municipalities and Public Works: Baghdad, Iraq, 2015.


© 2018 by the authors. Licensee MDPI, Basel, Switzerland. This article is an open access article distributed under the terms and conditions of the Creative Commons Attribution (CC BY) license (http://creativecommons.org/licenses/by/4.0/).