Abstract
Driving experiences provided by the introduction of new vehicle technologies are directly impacting the criteria for road network design. New criteria should be taken into consideration by designers, researchers and car owners in order to assure traffic safety in changed conditions that will appear with, for example, introduction of Autonomous Vehicles (AVs) in everyday traffic. In this paper, roundabout safety level is analysed on the originally developed microsimulation model in circumstances where different numbers of AVs vehicles are mixed with Conventional Vehicles (CVs). Field data about speed and traffic volumes from existing roundabouts in Croatia were used for development of the model. The simulations done with the Surrogate Safety Assessment Model (SSAM) give some relevant highlights on how the introduction of AVs could change both operational and safety parameters at roundabouts. To further explore the effects on safety of roundabouts with the introduction of different shares of AVs, hypothetical safety treatments could be tested to explore whether their effects may change, leading to the estimation of a new set of Crash Modification Factors.
1. Introduction
Roundabouts are very often used as a measure for improvement of traffic safety in road networks in urban and suburban areas because they proved to have better performance regarding traffic safety than the standard type of at-grade intersections. Reviews done on the basis of data from 28 studies from different countries [1] show that roundabouts are associated with a reduction of 30 to 50% in the number of injury accidents and that fatal accidents are reduced by 50 to 70%. The results based on available accident data were similar, of studies on roundabouts traffic safety done for middle European countries [2] and also those done by Rodegerdts et al. [3] for different countries around the world.
Traffic safety in roundabouts, however, is still an important issue of design process especially in countries where roundabouts present new solutions for intersections. There are some types of accidents that typically occur on single roundabouts. Research done by Montella [4] at 15 roundabouts in Naples, Italy with the aim to identify crash contributory factors at urban roundabouts shows that the most problematic element of single lane roundabouts is their entrance because almost 68% of all accidents happen at the entrance of a roundabout. As for the contributing factors in 60% of the total crashes, the geometric design of the entrance was identified as problematic in more than one-third of road users-drivers and in the same amount pavement condition, mostly friction, contributed to the crashes. Moreover, according to research by Chen et al. [5] at some US and Italian roundabouts, it is suitable to get an approach-level data for models in which traffic safety is related to different predicted approach speeds. This approach could be an indirect way for developing roundabout safety models in which roundabout geometric elements are used to predict speed, which then can be used as a predictor of crash frequency.
So far, the new driving experiences provided by the introduction of new vehicle technologies are directly impacting the criteria for road network design. New criteria should be taken into consideration by designers, researchers and car owners in order to assure traffic safety in changed conditions that will appear with, for example, the introduction of Autonomous Vehicles (AVs) in everyday traffic. For example, Gonzalez et al. [6] have developed a path planning method for autonomous vehicle driving at roundabouts. The proposed method presumes continuous vehicle path by minimizing curvature steps to increase smoothness, dividing the driving process into three stages: entrance manoeuvre, driving within the roundabout and exit manoeuvre. Referring to the models developed for traffic flow and capacity [7], assuming a given share of autonomous vehicles, it has been proven that capacity increases disproportionately as the share of autonomous vehicles increases. It should be noted that the shortening of the time gaps comes into effect as early as the first autonomous vehicle; the speed increase at high densities will only be possible for purely autonomous traffic.
Then, in the early stage of AV implementation, traffic composition will be mostly manually-driven vehicles with several vehicles with automated driving functions and some AVs. It becomes significant to study the key road safety issues when AVs with different settings are mixed in traffic. Hence, there is a need to study the coexistence of Conventional Vehicles (CV) and AVs in the same road link at the same time, and to rethink the road infrastructure standards in a way that can suit both types of vehicles [8,9]. Traffic micro-simulation is a valuable approach to investigate how safety and operational traffic characteristics will change when AVs circulate in the streets, and to consider new Crash Modification Factors (CMFs) [10,11].
In this paper, roundabouts’ safety performances are analysed on an originally developed microsimulation model in circumstances where different numbers of AVs are mixed with Conventional Vehicles (CVs). Field data about speed and traffic volumes from existing roundabouts in Croatia were used to develop the model.
2. Data
A micro-simulation model was developed for a widely used type of roundabouts—single-lane suburban roundabouts of middle size, with an inscribed diameter ranging from 45 to 70 m with three or four approaches. They are located in a touristic area where traffic loading has great seasonal variations.
This paper analyses the AVs revolution on mobility demand and on reimagining the road network, through the management of micro simulation models applicable to AVs. The major aim of traffic micro simulation is to produce representative measures of macroscopic traffic flow–delay, journey time, flow and speed. The behaviour of individual vehicles is not generally considered in detail. As such, the accuracy of the base situation—including, for example, the longitudinal spacing of vehicles, does not fall under question, and is not subject to site-specific calibration or validation. Specific parameters (VISSIM) have been identified as levers—allowing the modification of vehicle behaviour to represent a possible future for AVs. Behavioural change in VISSIM refers to a specific vehicle type [12,13]. This research will also show how the mechanisms by which AVs could impact traffic flow, network performance and road capacity are, in the main, reasonably well understood and broadly accepted. This research will explore the impact of potential behavioural changes relating to:
- changed longitudinal movement of vehicles;
- the ability to change following behaviour based on the capability of the lead vehicle;
- different levels of gap acceptance and lane changing behaviour;
- connectivity to represent better provision of informed decision making at the entrance of the roundabouts;
- different perception-reaction times between human and AVs users;
- temporary lack of attention (inattention parameter), to consider the inattention while driving CVs in urban environment caused by the use of smartphones.
2.1. Field Measured Data Inputs for Microsimulation
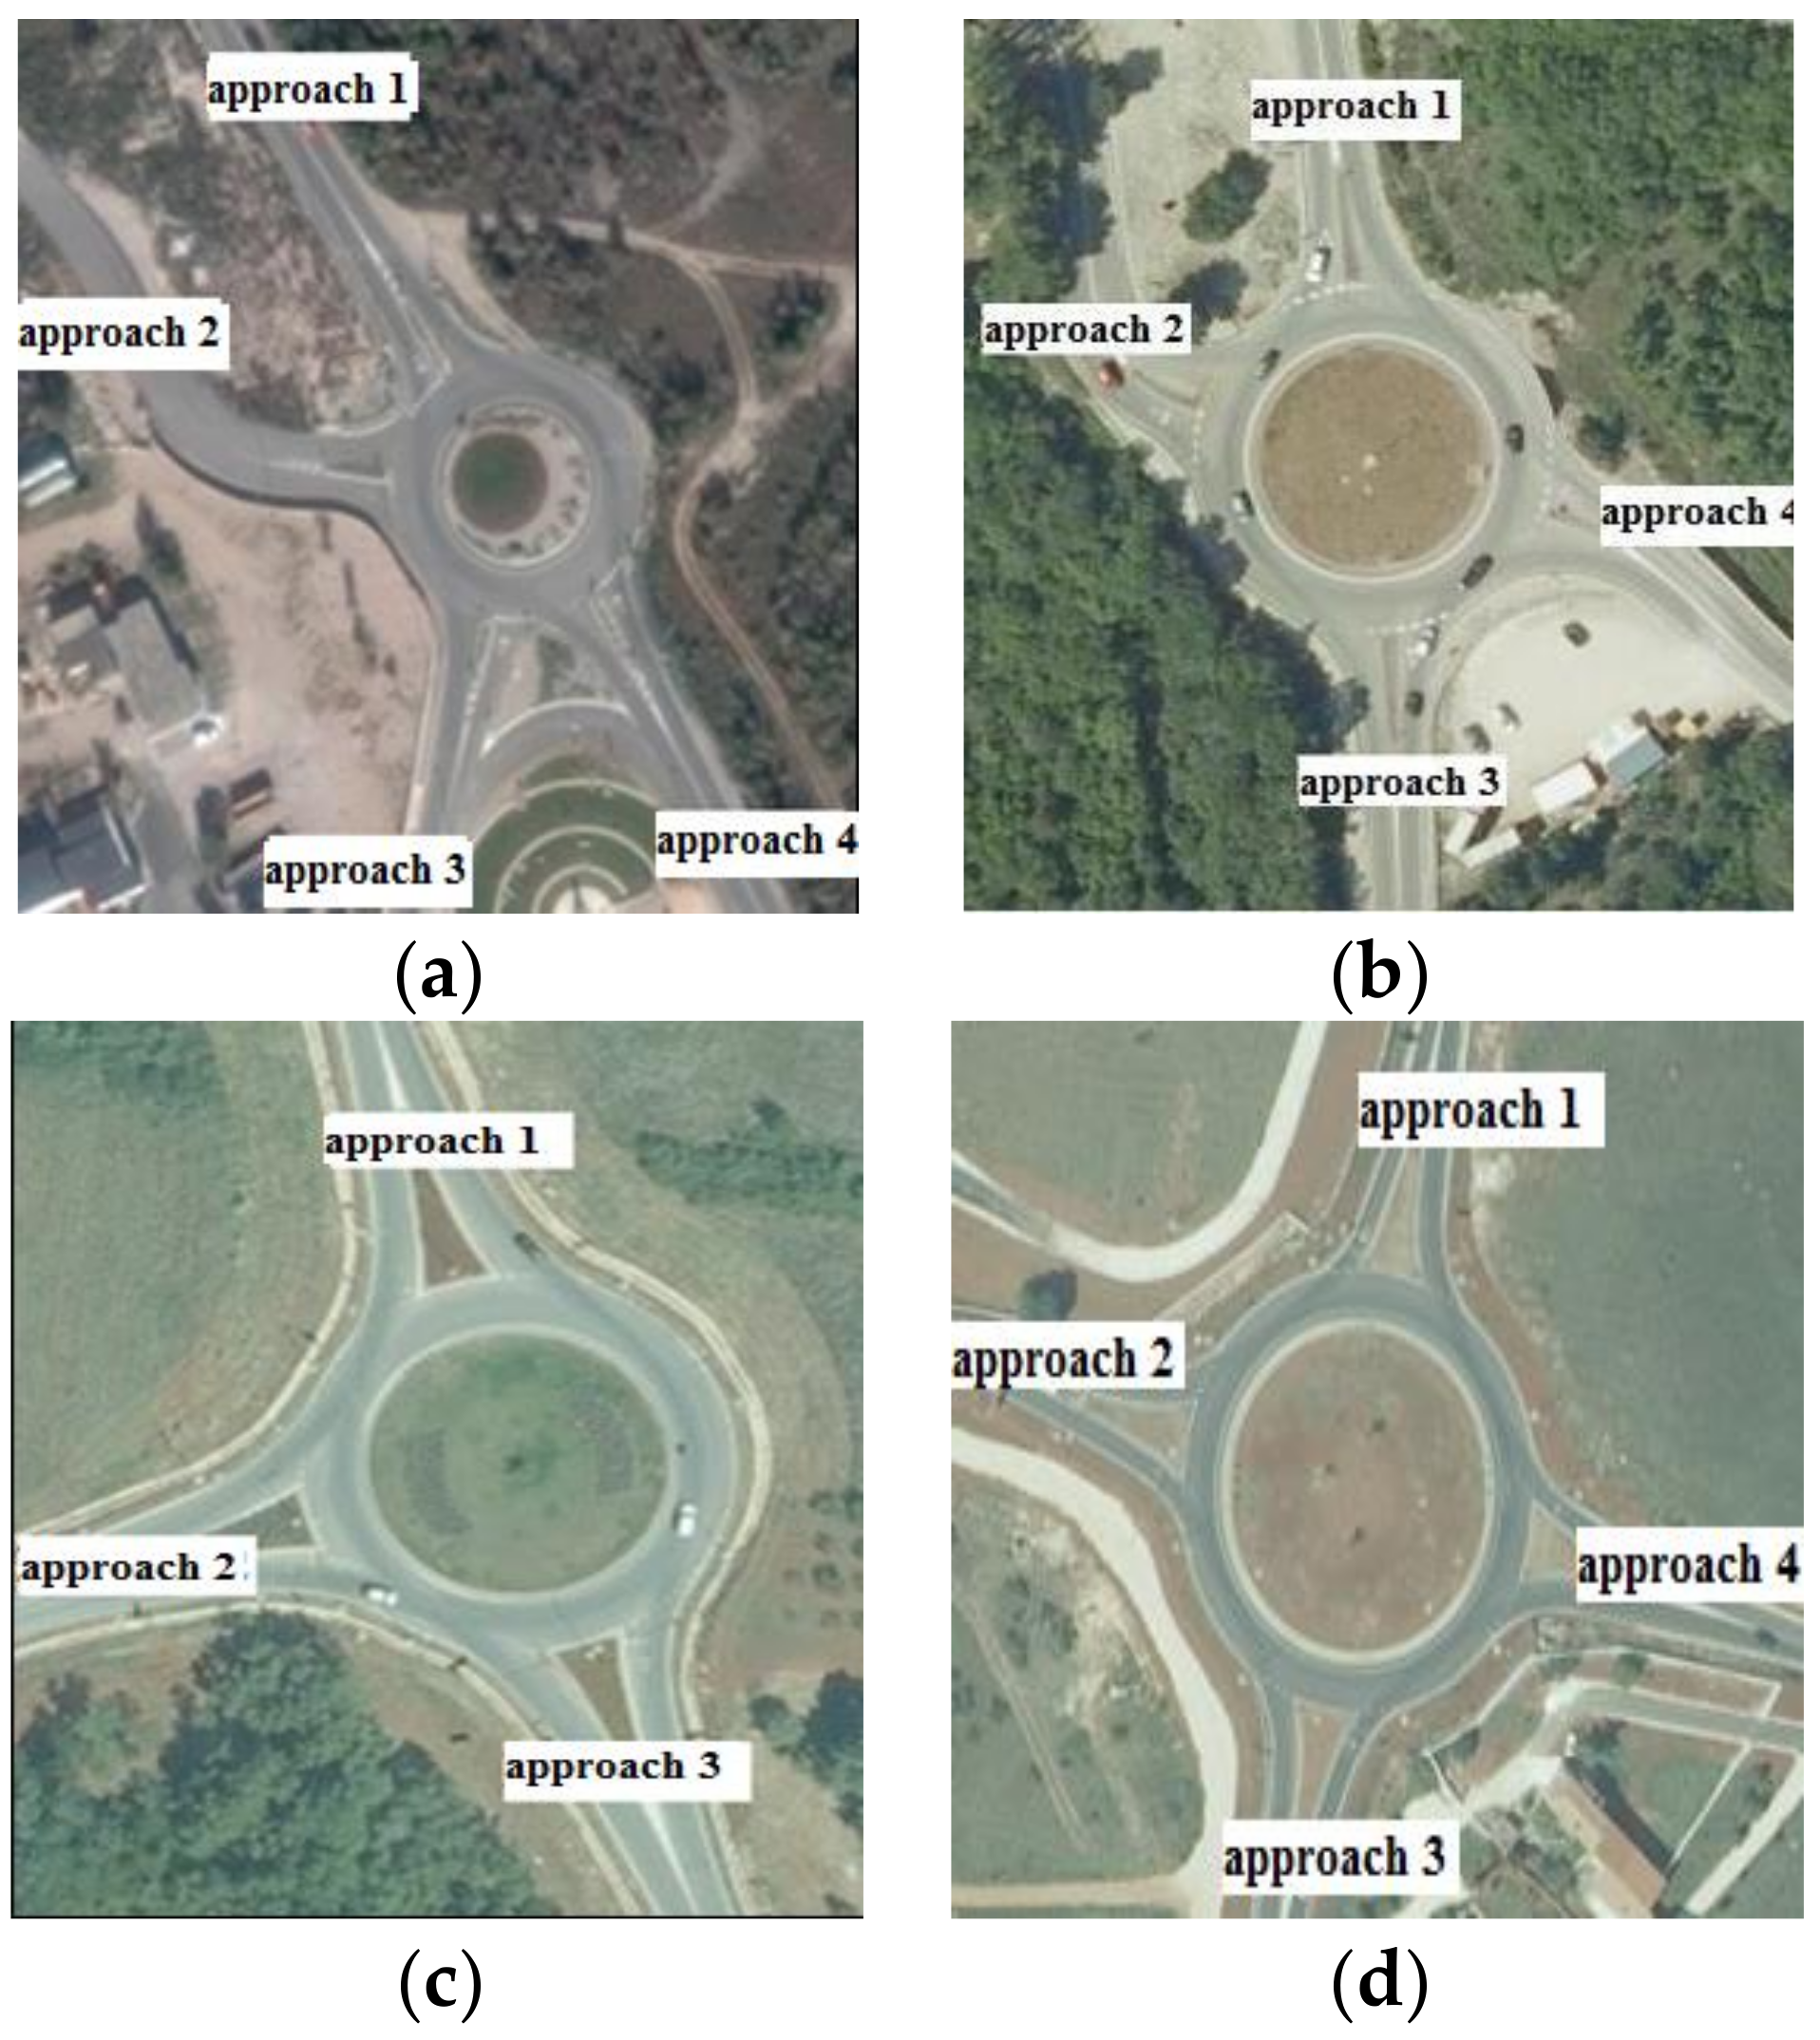
For the purpose of model development, data from four roundabouts in Croatia were used, subsequently the roundabouts were set into the virtual environment PTV VISSIM in accordance with real geometry parameters shown in Figure 1.

Figure 1.
(a) Roundabout Omišalj; (b) Roundabout Malinska; (c) Roundabout Stancija Vodopija; (d) Roundabout Šikići.
Three roundabouts can be characterized as medium-sized roundabouts, with external radius of 22.5–25 m, and one roundabout can be characterized as a big roundabout, with external radius of 35 m. All four roundabouts were designed according to Croatian Guidelines for Roundabouts Design. Selected roundabouts have basic traffic conditions in common: there is no pedestrian and bicycle traffic or they can be disregarded, they have a highlighted main direction and it is the direction straight through the roundabout. Experimental testing on each roundabout included 50 vehicle passes on straight path through the roundabout. Since experimental testing included two straight directions on roundabout, altogether 100 passes for each roundabout were recorded. The same passenger car was used, and three drivers were alternated (2 male and 1 female driver). Each pass was recorded by precise Global Navigation Satellite System (GNSS) device placed in the longitudinal axis of the vehicle in the area of the driver and front passenger. The GNSS device captured five geo-referenced positions of the vehicle in 1 s, which enables highly accurate analysis of the position of vehicle and calculation of its speed when passing through the roundabout.
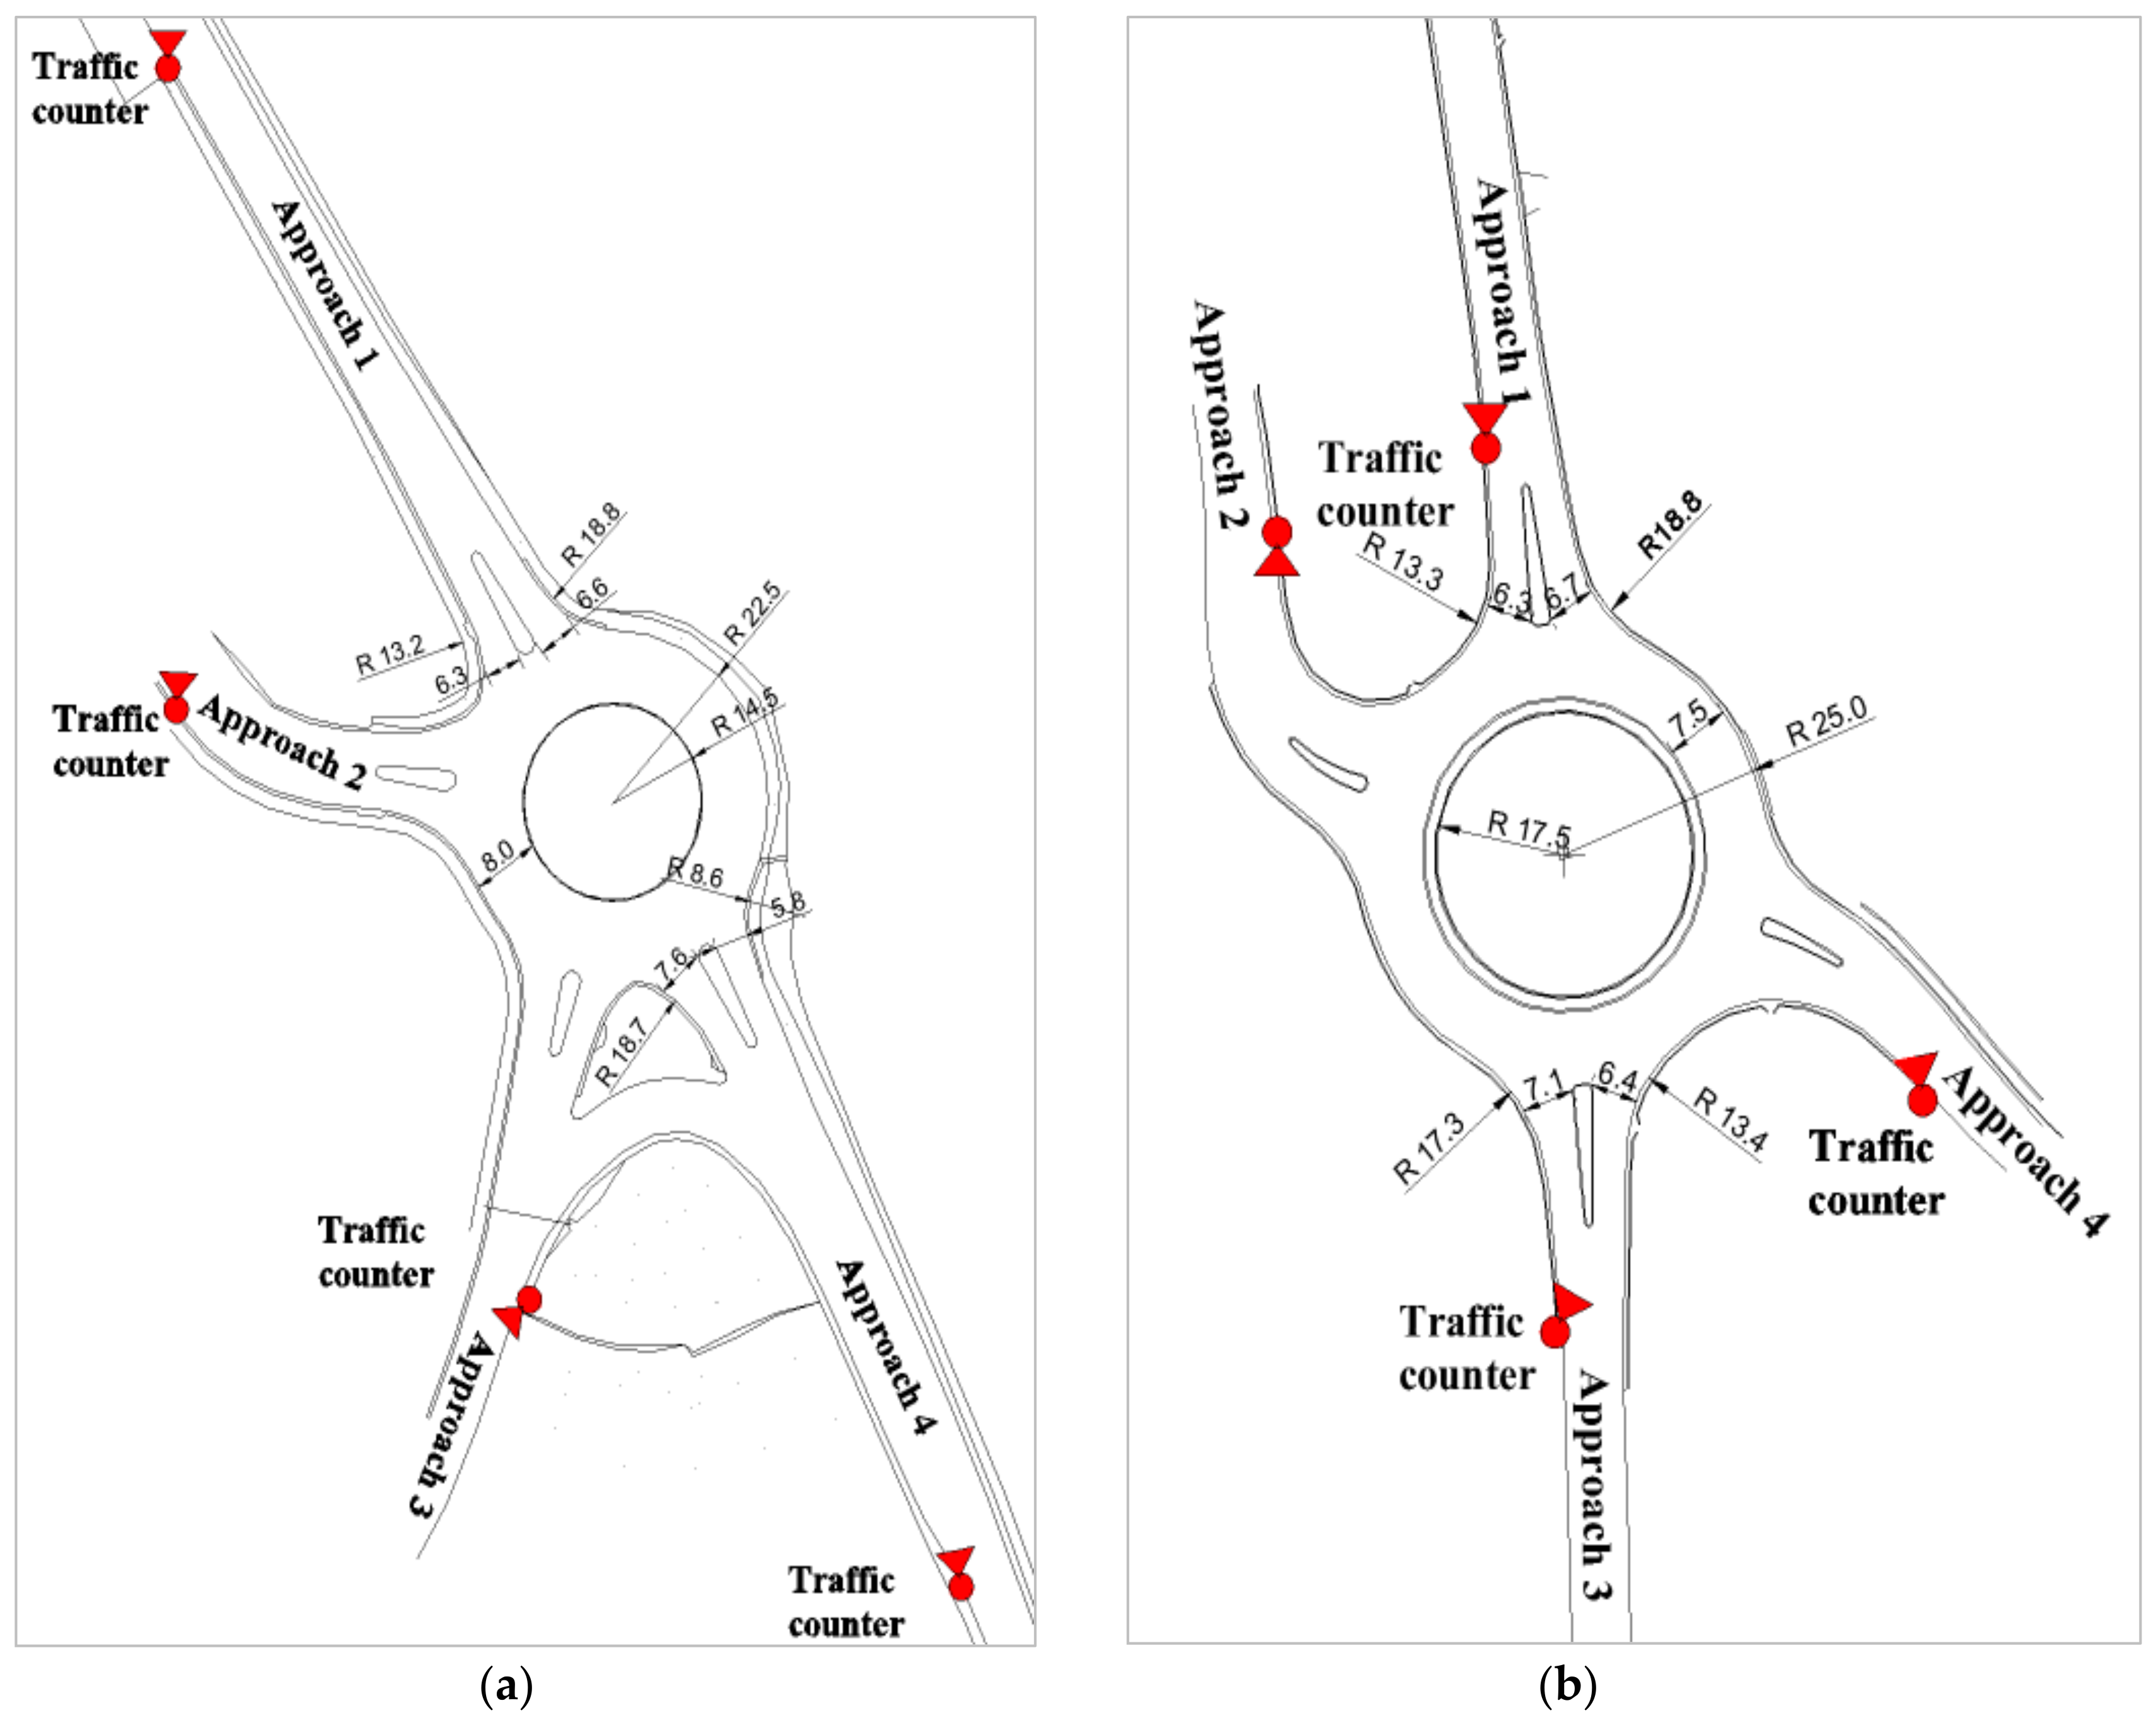
Based on data from GNSS device speed of vehicles at the entrance (Vent), in the middle of the roundabout (Vring) and at the exit (Vexit) were determined, for all 50 passes, for each of the two straight directions on each roundabout. In order to determine the traffic load on the Omišalj (Figure 2a) and Malinska (Figure 2b) roundabout, traffic counters “Datacollect SDRtraffic+” were set in a period of five days during the out-of-season period. Friday was selected as a relevant day for the model development.
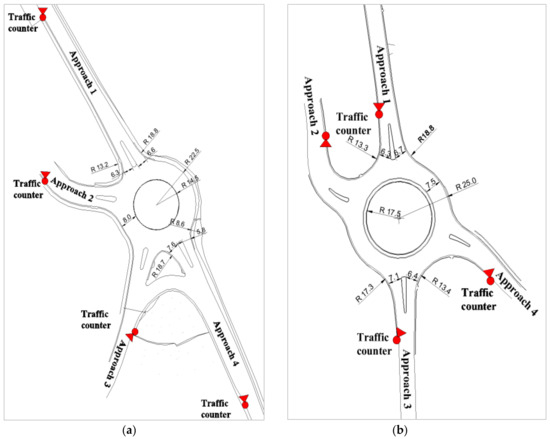
Figure 2.
Traffic load was recorded on four positions. (a) Omišalj, (b) Malinska.
The Omišalj and Maliska roundabouts are located in a touristic area where traffic loading has great seasonal variations which were taken into account. The difference between average seasonal (ASDT) and out-of-season traffic (ADTT) is approximately 30%. The arm capacity was calculated using traffic data gathered during the out-of-season traffic period. Traffic volumes were increased for 30% to adjust to seasonal traffic flows which better represent critical conditions at chosen roundabouts (Table 1).

Table 1.
[a] Traffic volumes for Omisalj roundabout; [b] Traffic volumes for Malinska roundabout.
Table 2.
Origin-Destination Matrix—Omisalj roundabout.
Table 3.
Origin Destination Matrix—Malinska roundabout.
2.2. Safety Data for Conflict Analysis Evaluation
The traffic simulations for the different traffic patterns were made considering two chosen intersections, the Omisalj and Malinska roundabouts. The microsimulation was based on gathered data: the peak hour traffic (Table 1) and number of crash for the last six years (Table 4).
Table 4.
Real crash in Omisalj and Malinska roundabout.
For the analysed roundabouts, 30 simulations for each scheme and for each traffic configuration were done. The overall duration of the simulation was 90 min distributed as follows: 15 min serving as the initialization or warm-up period during which traffic was loaded into the road network and the system could have a chance to reach equilibrium; 60 min for the simulation, where trajectory data was generated; 15 min that allow for the emptying of the road network without affecting the traffic during the hour considered by the simulation.
The trajectory file produced by VISSIM was then used for the conflict analysis using the software Surrogate Safety Assessment Model (SSAM), considering the last simulation.
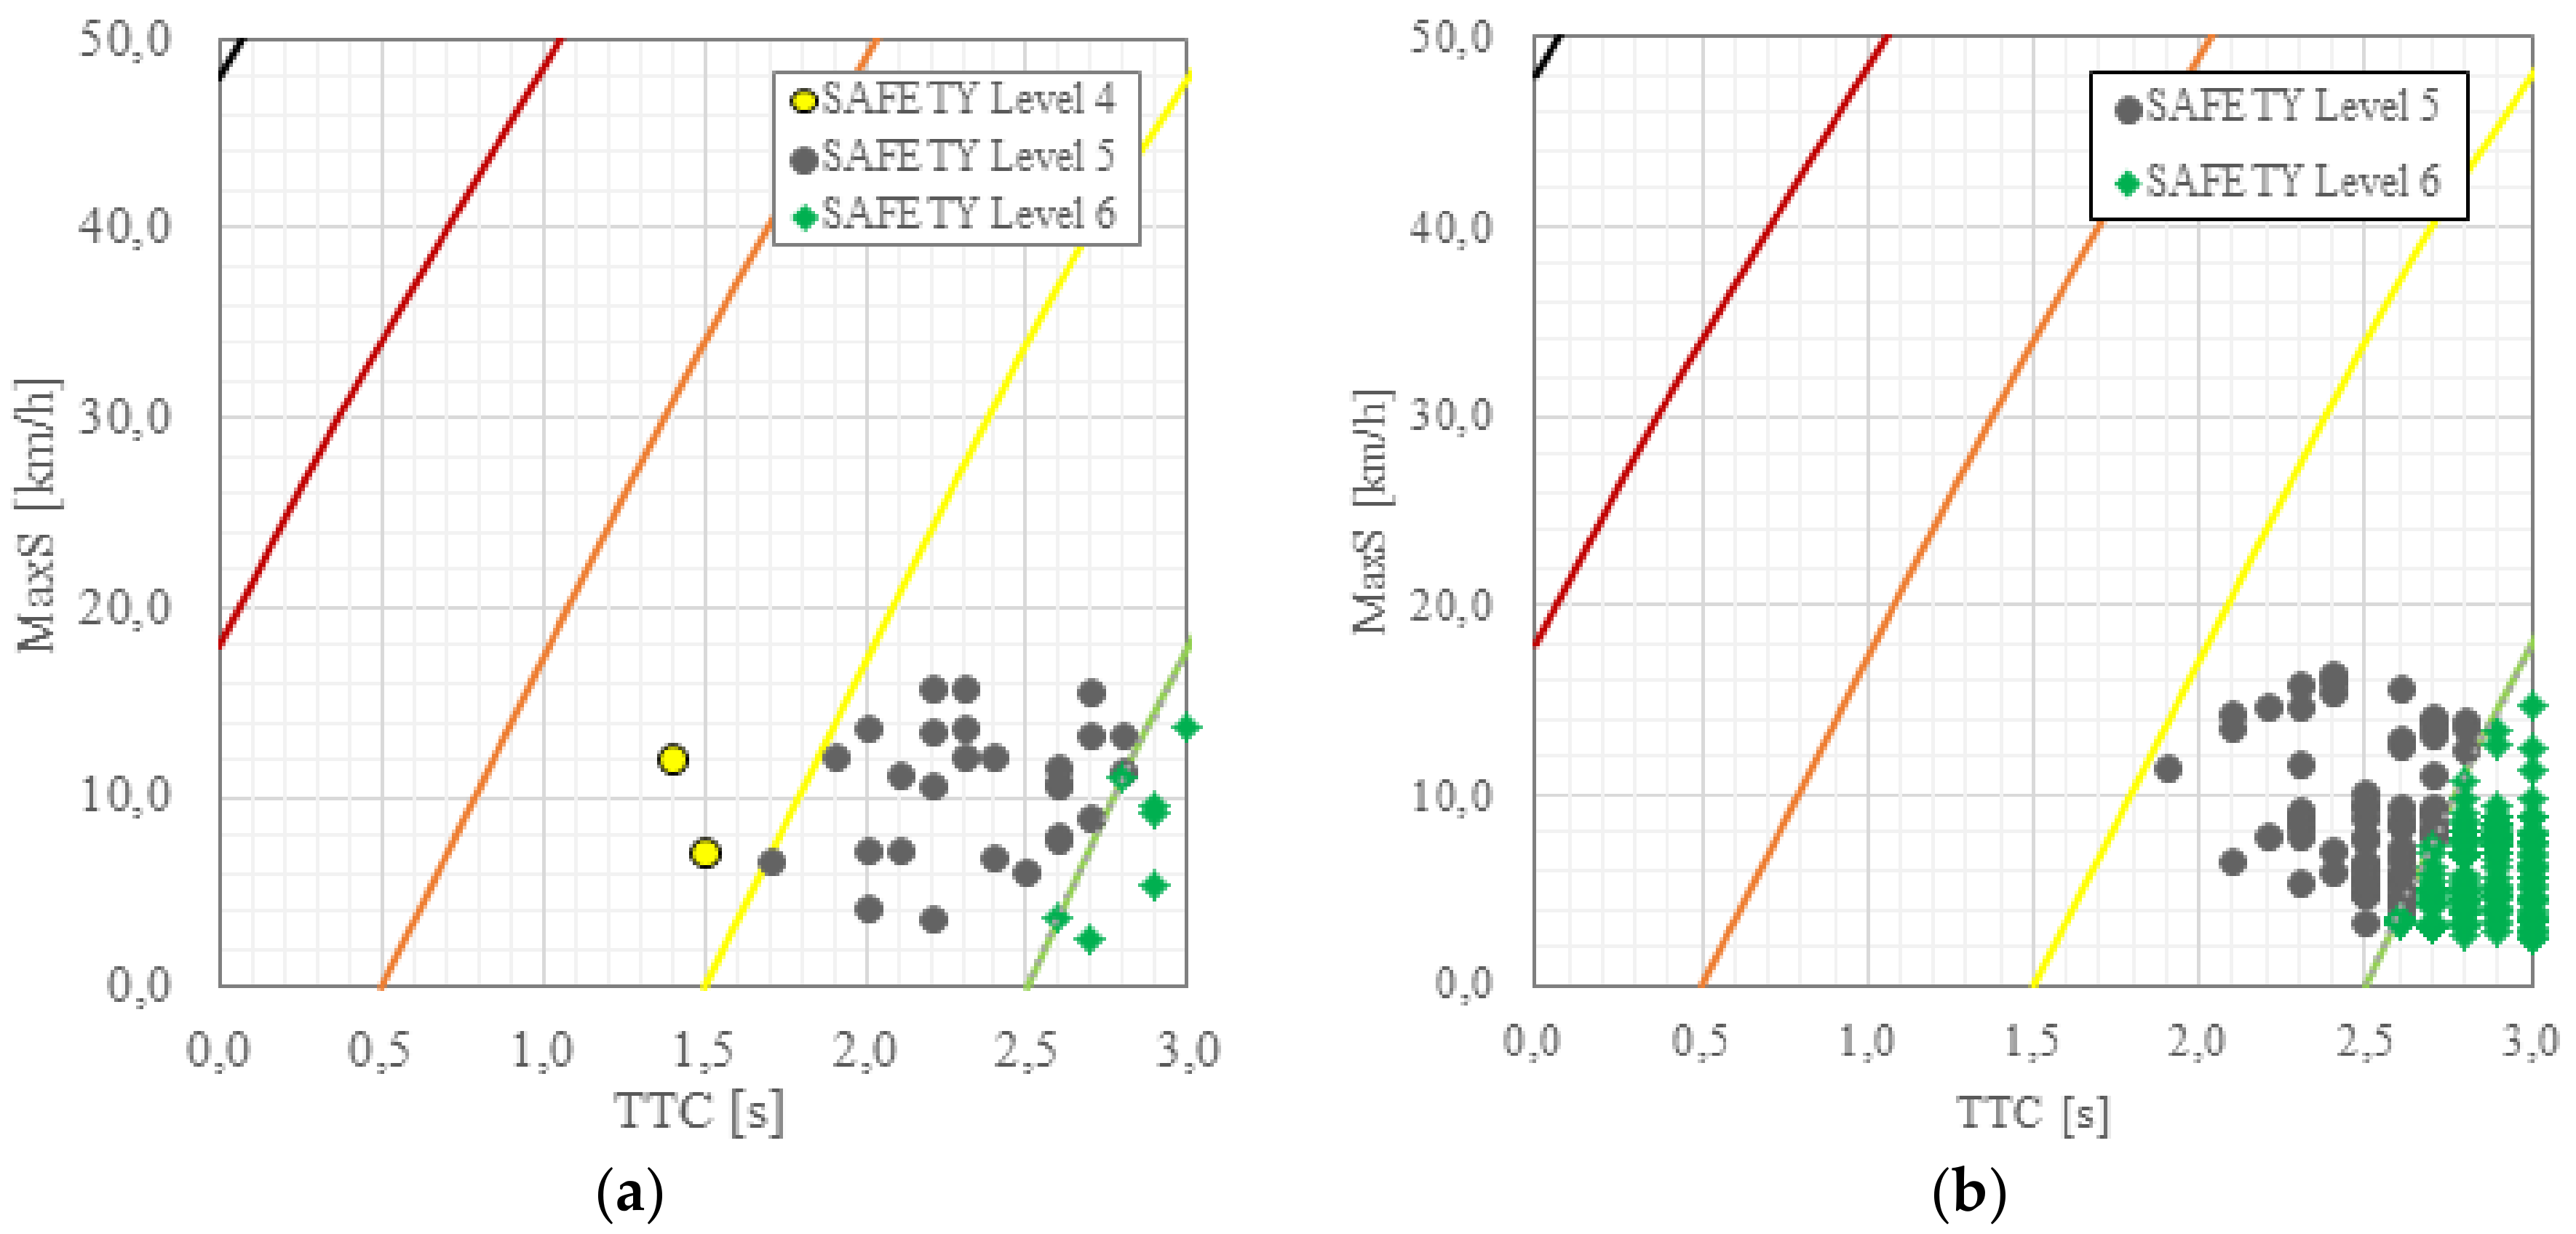
The Hyden approach [14] was considered for the analysis. The severity zones were approximated graphically by MaxS (the maximum speed of each vehicle during the conflict event in kilometres per hour) versus minimum Time To Collision (TTC) when it is given the conflict speed (the speed of the vehicle taking evasive action just before evasive action is initiated) and the time-to-accident (the TTC is the time separation value at the moment when the evasive action begins between two vehicles if both continue at their actual speed along their respective trajectories) (see Figure 3).
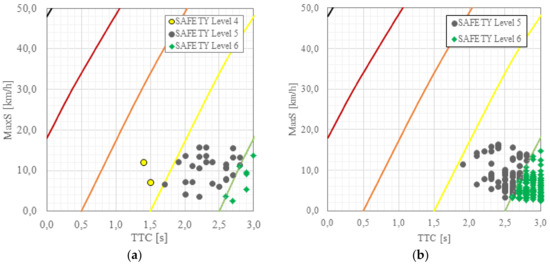
Figure 3.
MaxS versus TTC for (a) Omisalj roundabout and (b) Malinska roundabout.
Applying the output data for analysed roundabouts from the VISSIM to the SSAM and by applying the Hyden approach [14], it is possible to draw six gravity zones (Figure 3):
- Extreme Risk (y = −1.9333 x2 + 27.647x + 48.202);
- High Risk (y = −2.4186 x2 + 32.886x + 18.067);
- Moderate Risk (y = 0.0857 x4 − 0.7861 x3 − 0.5433 x2 + 37.352x − 18.467);
- Medium-Low Risk (y = −2.689 x2 + 44.32x − 60.362);
- Low Risk (y = 0.8 x3 − 11.6 x2 + 81.6x − 144);
- Not classified.
In the roundabout schemes considered there are relatively low average speeds of (V < 20 km/h). From the results for the analysed roundabouts, it is evident that there are no conflicts in severity zones 1, 2 or 3. All conflicts are falling in severity zone 5 and 6, which are not considered as they do not increase a real conflict.
3. Microsimulation Methodology
Several literature studies emphasized the importance of the calibration and validation process that allows micro simulation tools to provide reliable output [15]. This methodology enables comparison of data calculated through simulation for the specific road environment investigated with values estimated by meta-analytical models in the literature. In this case it was decided to calibrate the Wiedemann 74 car-following model (used by PTV VISSIM software—version 9.00-10 [16]) for Conventional Vehicles “CV”, in order to simulate reliable and realistic traffic operations for standard roundabouts in Croatia.
Data collected with a GNSS device, described in the previous chapter, were used for the model calibration. Statistical analysis was conducted for the collected data which included the determination of the average values, standard deviation “SD”, minimum and maximum values of speed and range of results (Table 5).
Table 5.
Statistical analysis of speed.
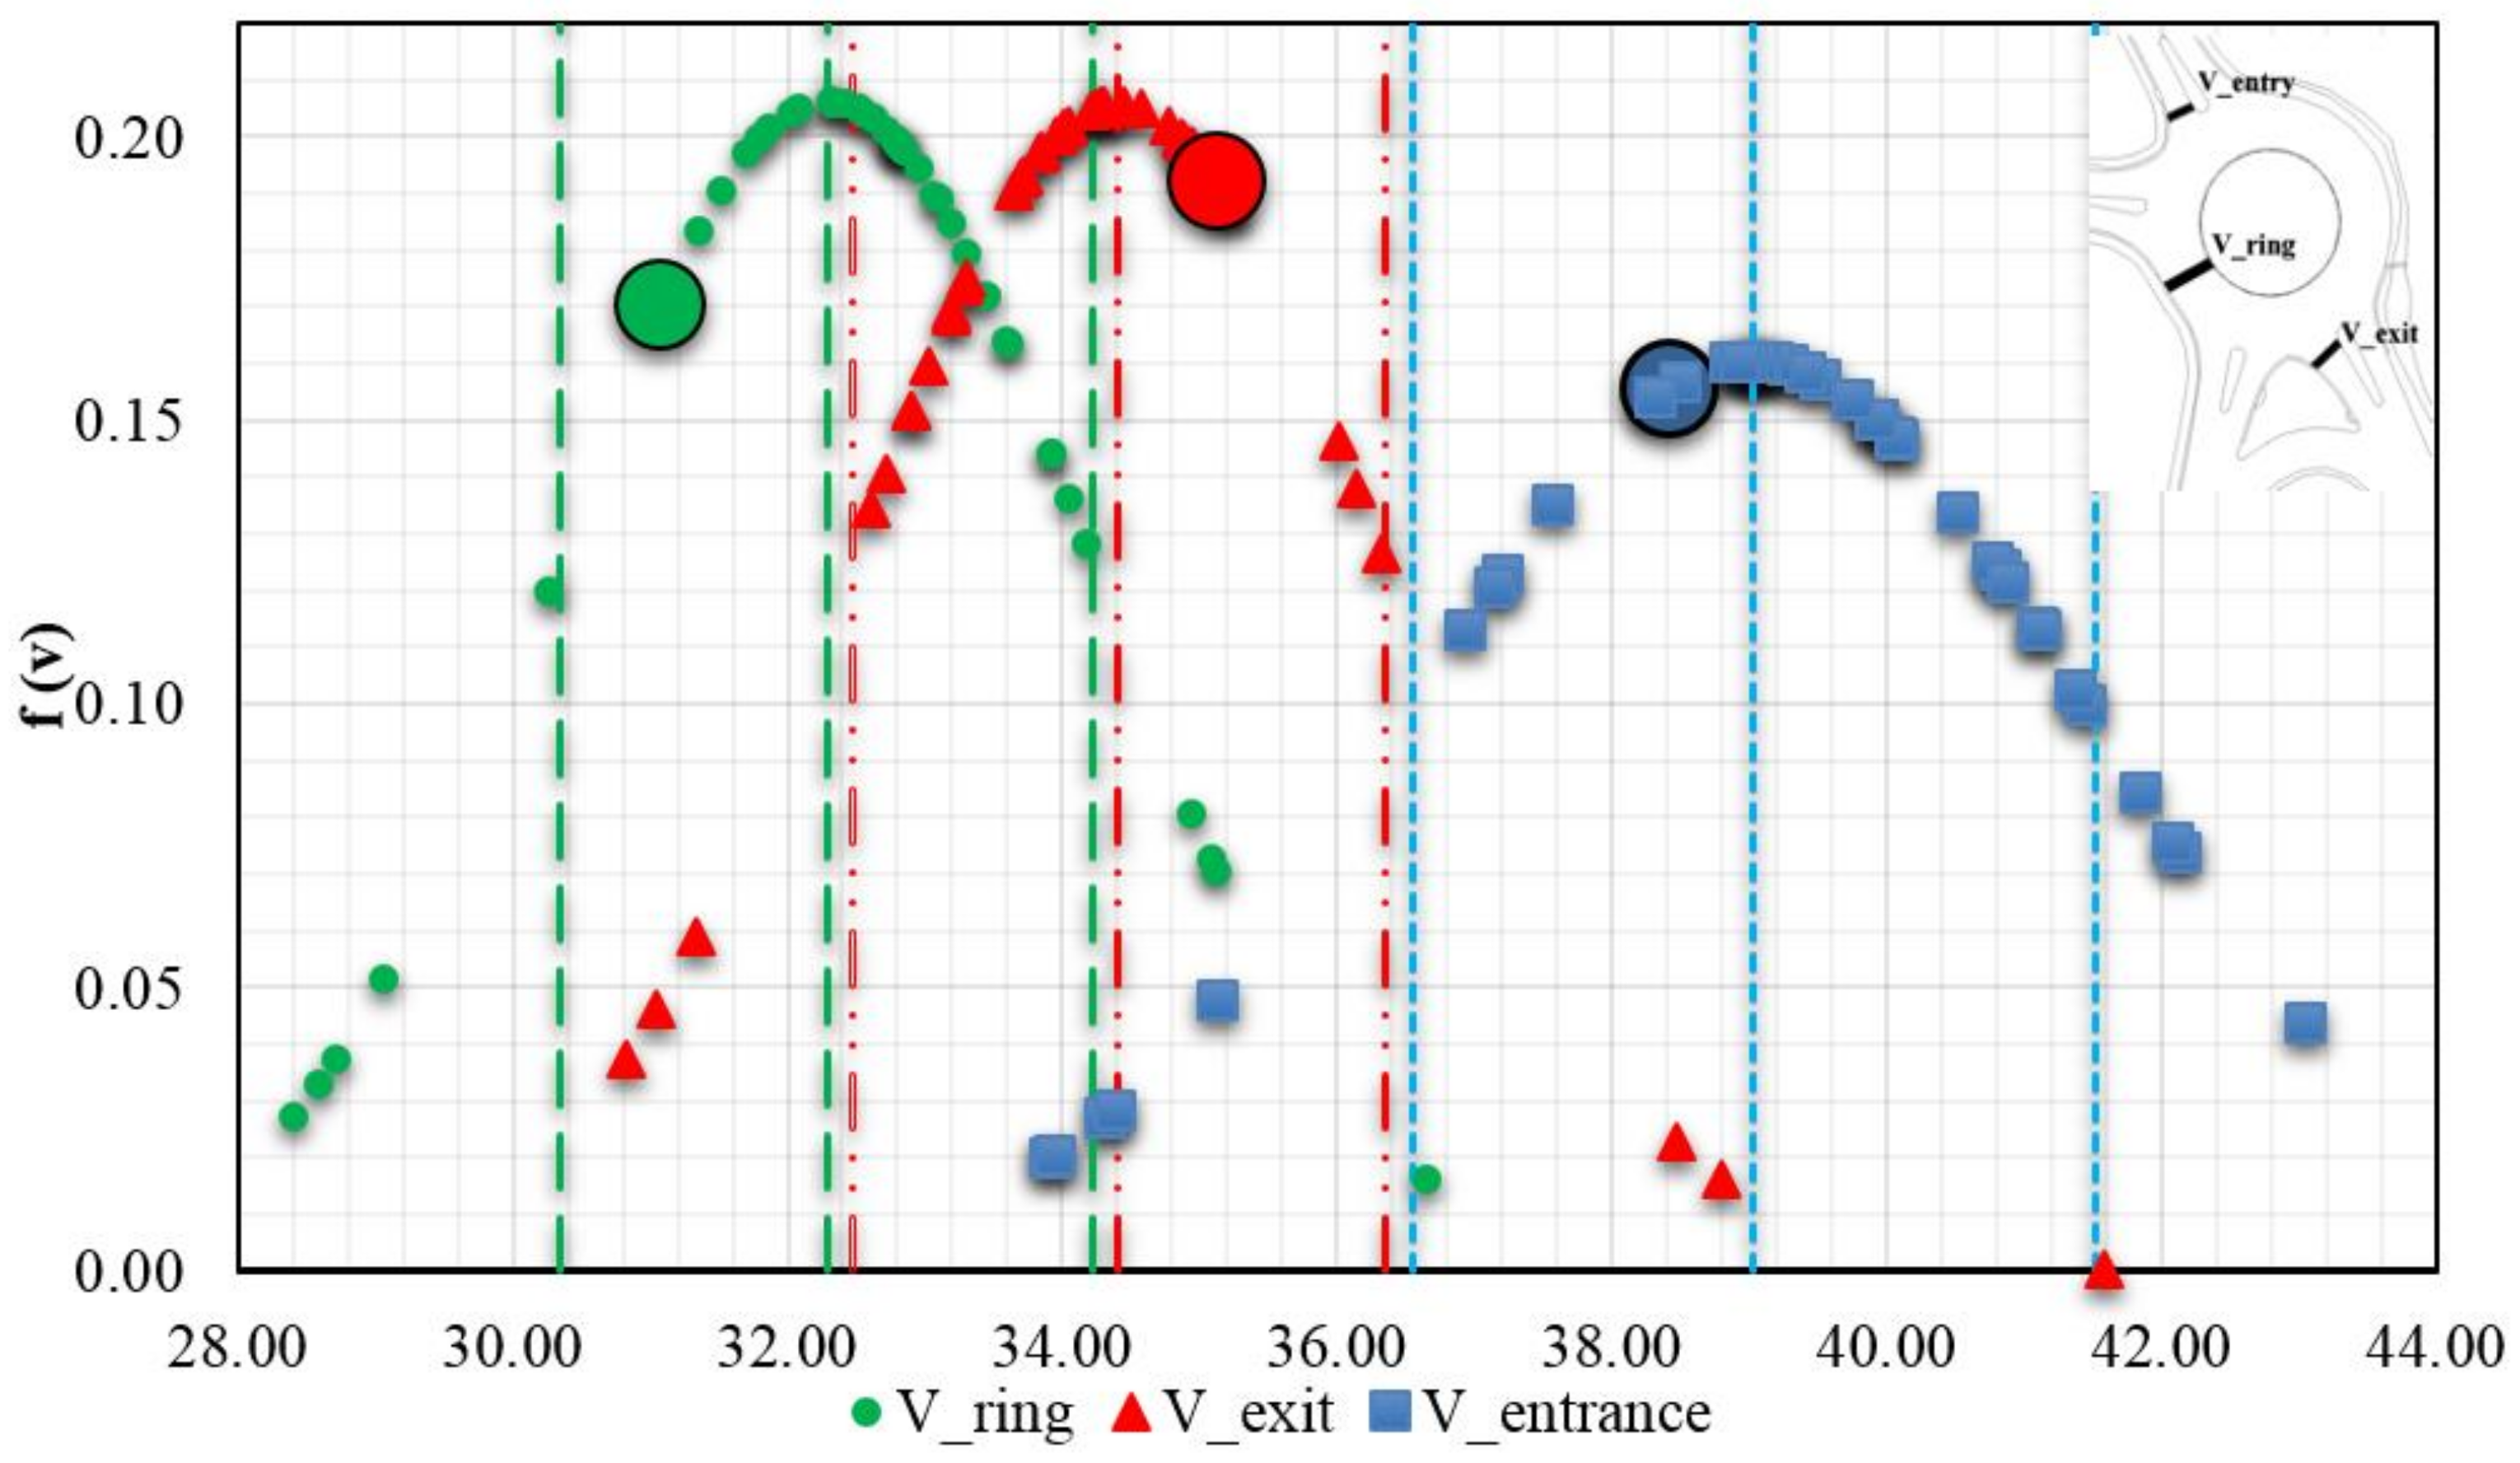
The Gaussian distribution graph was used to get the most probable speed values that the conventional vehicles achieve at the roundabout entrance, along the ring and at the exit of the roundabout. Therefore, it was possible to calibrate the micro-simulator tool, in such a way that the simulated speed for isolated vehicle measured at the same directions as shown in Table 2 is equal to Vave ± SD. In Table 5 it is possible to see the average speed obtained at the field tests and the average speeds obtained in the virtual environment.
Below on Figure 4, the normal Gaussian distributions and the average values of the speed with regards to the enter, middle and exit position obtained by the VISSIM micro-simulator, for the Omišalj roundabout (direction 1–4) are presented. In Figure 4 the speed probability density function—f(v) is presented—as described by Equation (1) for each speed value considered (enter, middle and exit):
where = isolated vehicle’s speed; SD = isolated vehicle’s speed Standard Deviation; = isolated vehicle’s speed average value.

Figure 4.
Normal Gauss distribution at roundabout Omišalj (direction 1–4).
This approach was used for the model calibration at the roundabout Omisalj and subsequently verified at the roundabouts Malinska, St. Vodopija and Šikići obtaining excellent results, as shown in Table 6.
Table 6.
Average speeds in real condition and average speeds obtained in virtual environment.
The values calibrated and used for CVs simulation (the existing scenario “TC1”) were obtained by changing the VISSIM parameter set for the “Driving Behaviour Parameter Set\Wiedemann 74\Following” for the conventional vehicle. Another very important setting parameter—in order to enhance the simulation—was the insertion of Desired Speed Decision at 30 km/h, placed 15 m before the roundabout along each arm. The Autonomous Vehicles (AVs) calibration was done by using and adjusting VISSIM parameter set for the “Driving Behaviour Parameter Set\Wiedemann 99\Following” according to the assumptions made by [9,16,17].
Specifically, the optimal combination obtained by calibration for CVs was:
- Look ahead distance: max 105 m instead of the default value equal to 250 m;
- Look back distance: set to 30 m longer than the default value equal to 250 m;
- Temporary lack of attention: duration 1 s; probability 8%;
- Flagging “Smooth Close-up Behaviour;
- Average standstill distance: set value equal to 5.10 instead of default value equal to 2.00;
- Additives part of safety distance: set value equal to 3.6 instead of the default value equal to 2.00;
- Multiple of safety distance: set value equal to 1.80 instead of the default value equal to 3.00 (see Figure 5).
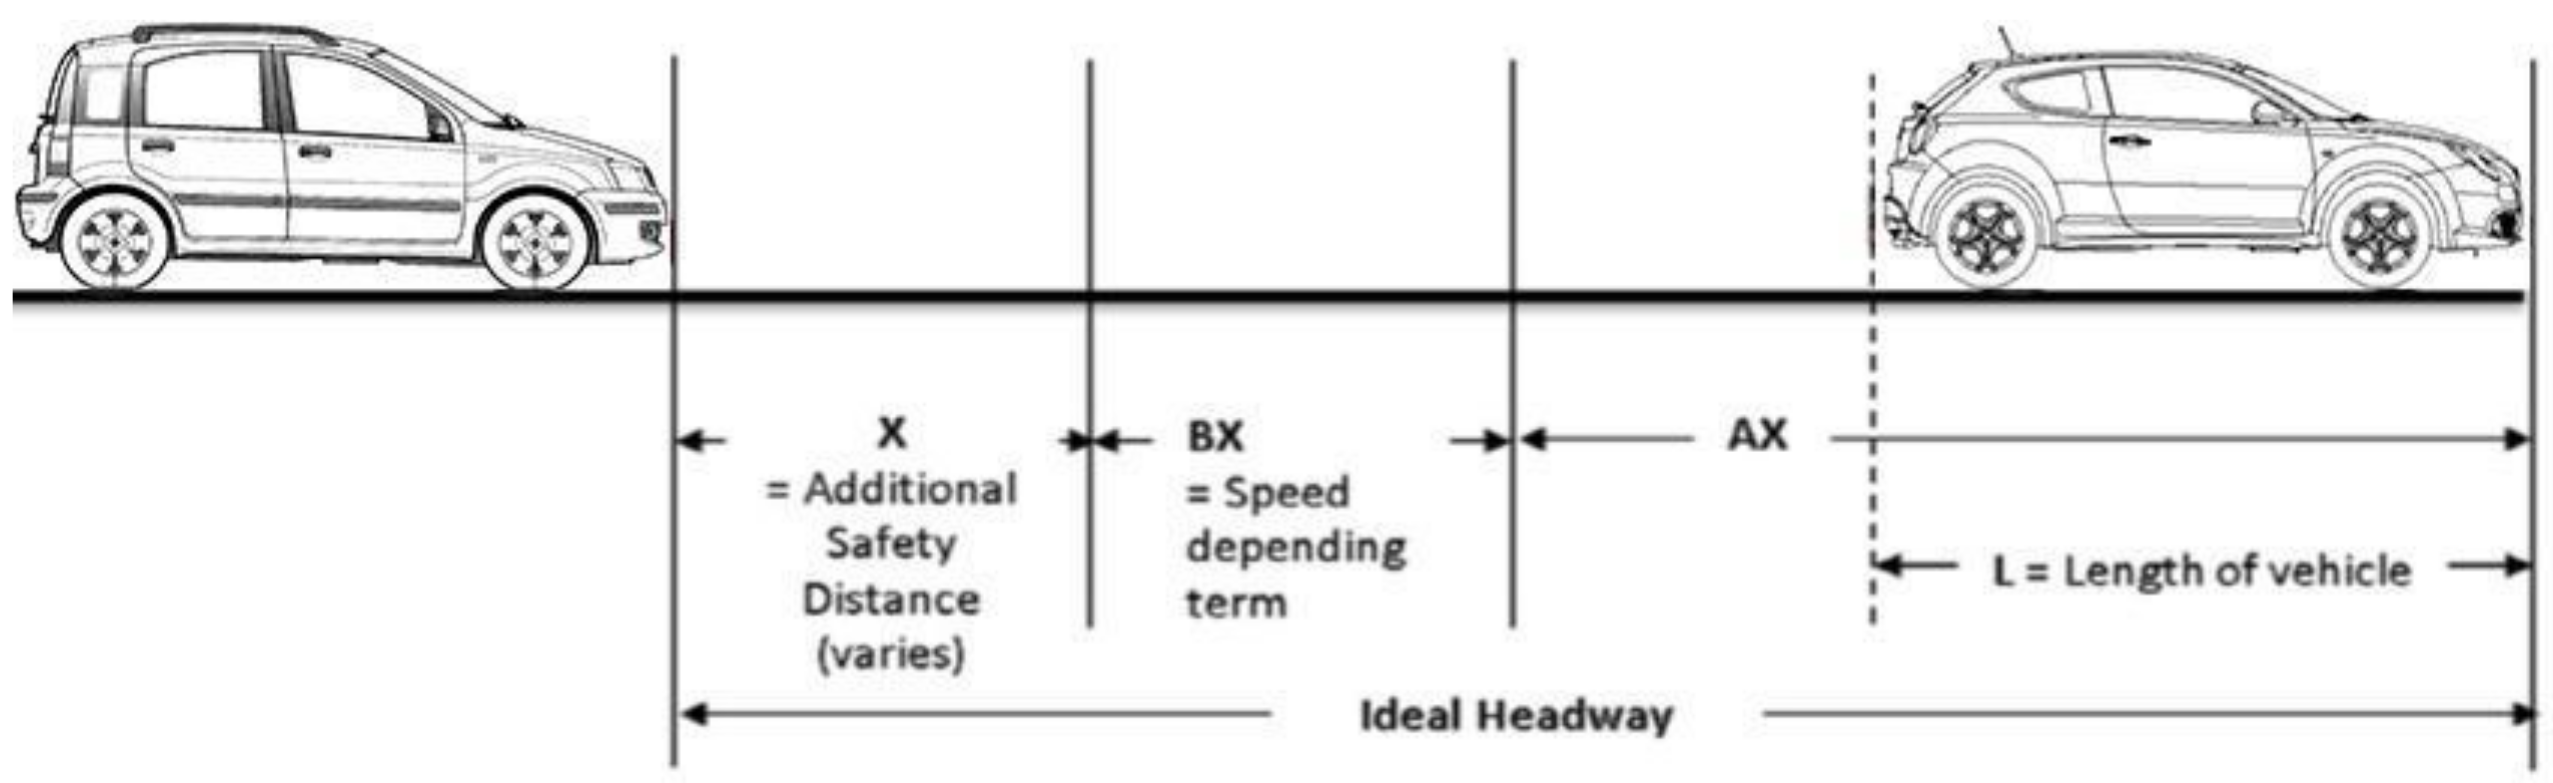
 Figure 5. Description of car-following model Wiedemann 74 parameters.
Furthermore, the optimal setting obtained by 10 calibration parameters for AVs, all labeled with a “CC” prefix—each of the parameters controls a unique aspect of the car following model as illustrated in Figure 6 was [17,18]:
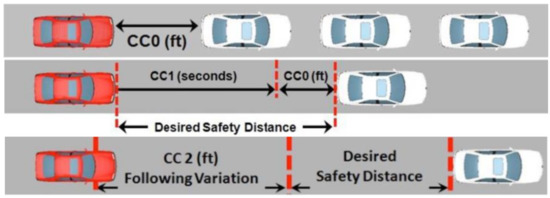
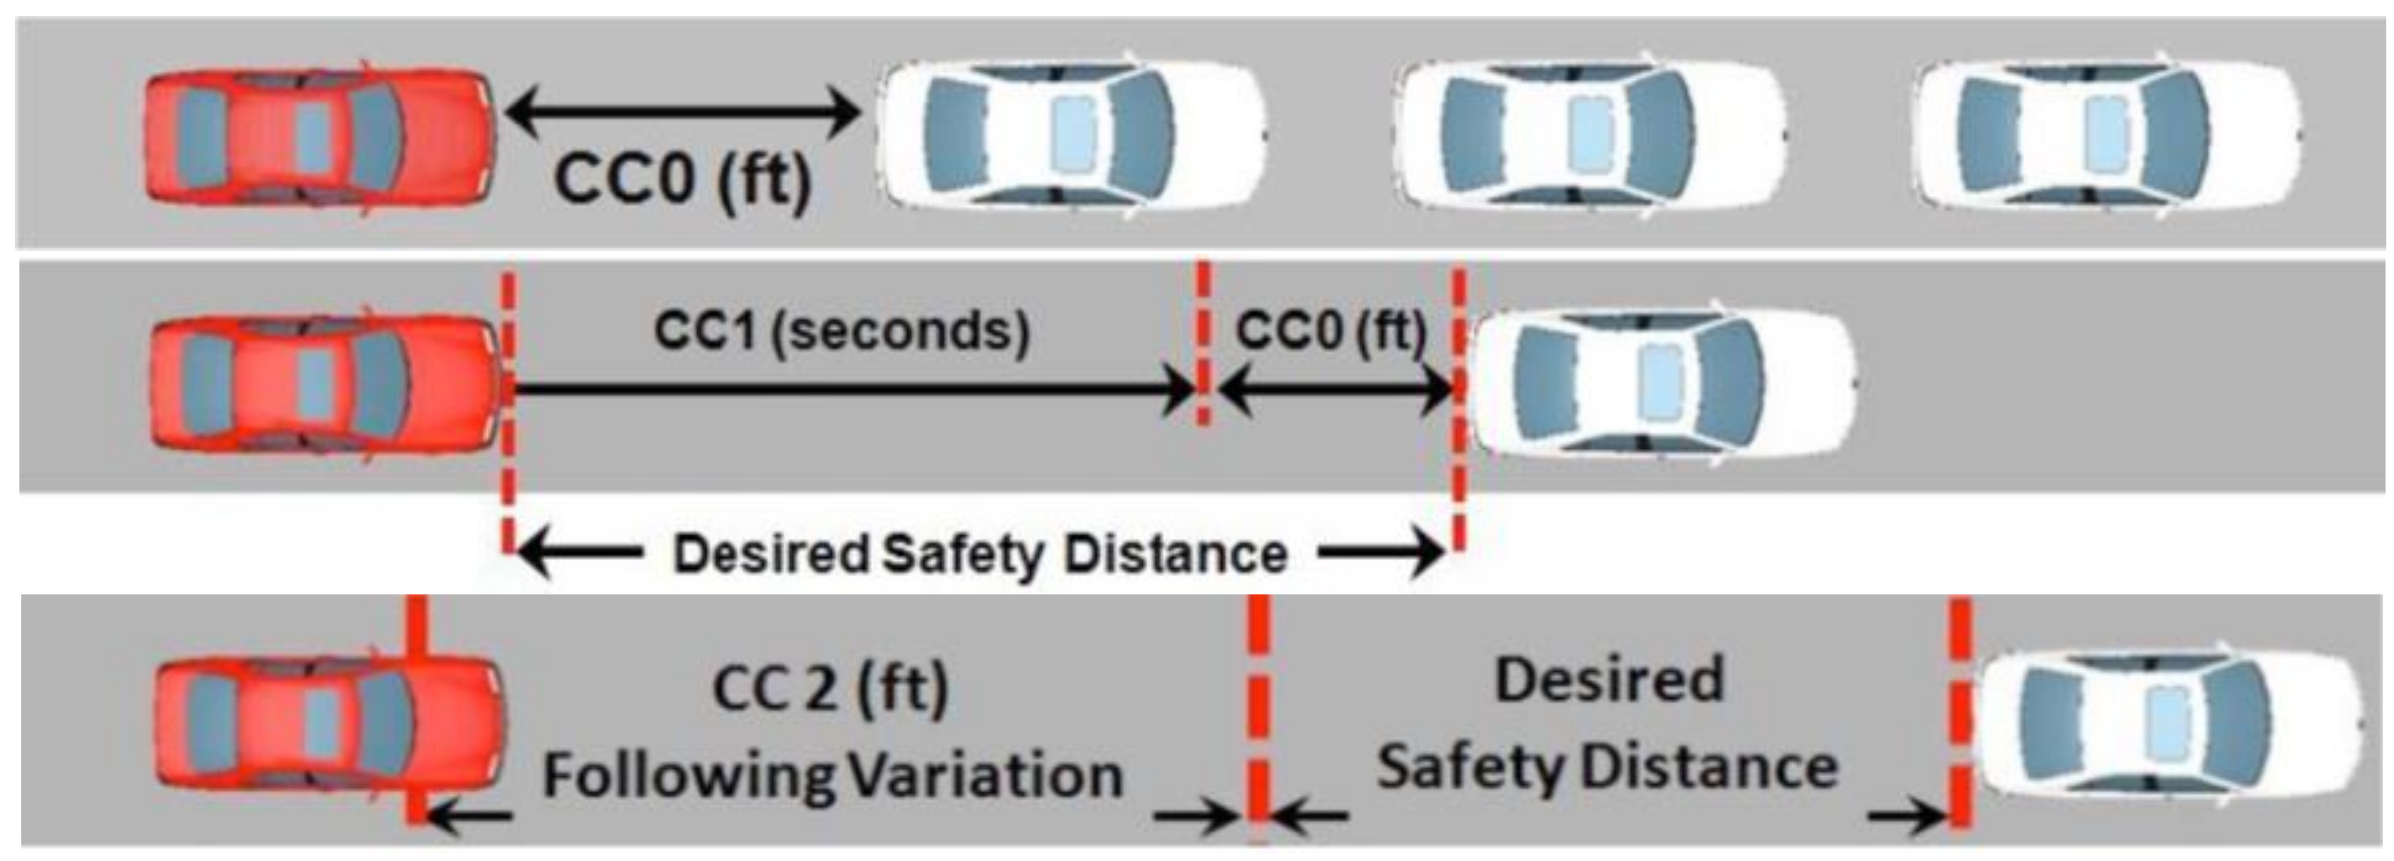
Figure 6.
Example of parameter set for Wiedemann 99 model.
- CC0: the default value is equal to 1.5 s; the calibrated value is 1.0 s;
- CC1: the default value is equal to 2.0 s; the calibrated value is 0.5 s;
- CC2: the default value is equal to 4.00 s; the calibrated value is 1.00 s;
- CC3: the default value is equal to −8.00 s; the calibrated value is unchanged;
- CC4: default value is equal to −0.35, the calibrated value is −0.10;
- CC5: default value is equal to 0.35, the calibrated value is 0.10;
- CC6: the default value is equal to 11.44, the calibrated value is 0.00;
- CC7: the default value is equal to 0.25 m/s2, the calibrated value is 0.40 m/s2;
- CC8: the default value is equal to 3.5 m/s2, the calibrated value is 4.00 m/s2;
- CC9: the default value is equal to 1.50 m/s2, the calibrated value is 2.00 m/s2;
For the above reported roundabout schemes, Omisalj and Malinska, four different traffic configurations (TC) were considered:
- TC1: 97% Conventional Vehicle “CV”, 3% Heavy Commercial Vehicles “HGV”, 0% Autonomous Vehicles “AVs”;
- TC2: 87% CV, 3% HGV, 10% AVs;
- TC3: 72% CV, 3% HGV, 25% AVs;
- TC4: 47% CV, 3% HGV, 50% AVs.
4. Findings
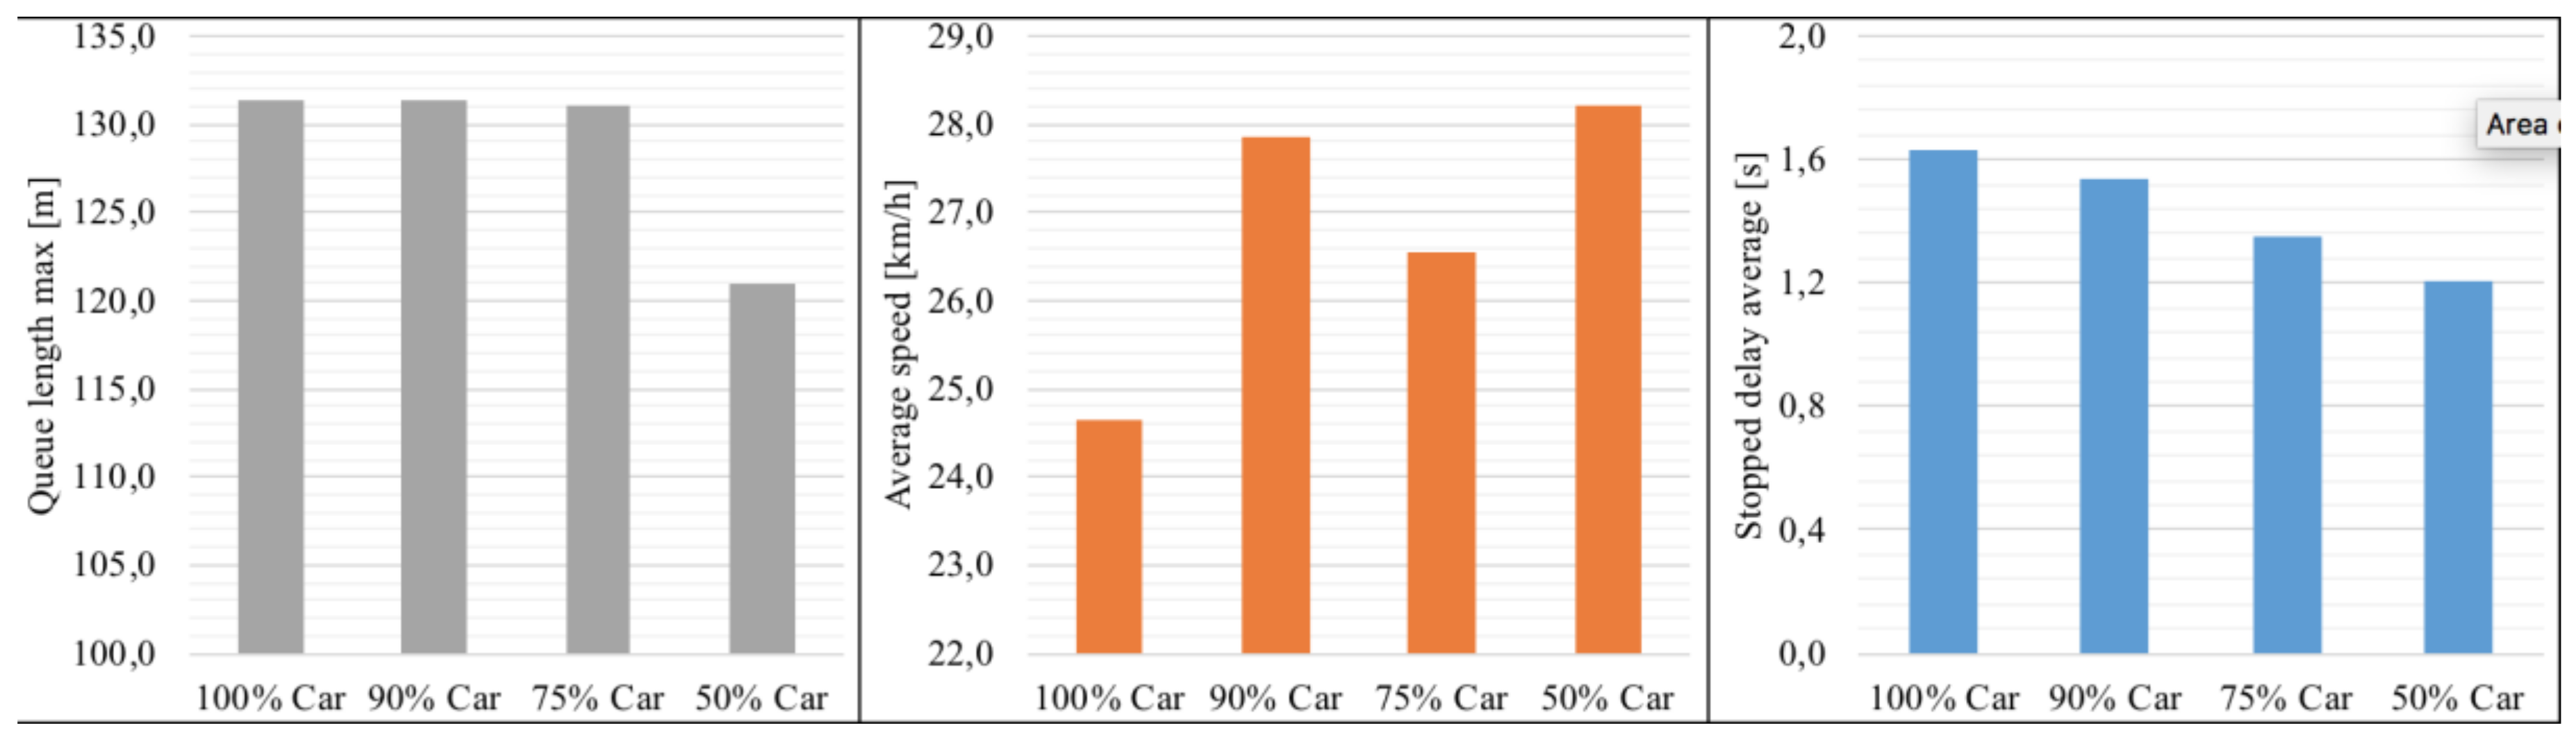
The microsimulations for both roundabouts, Omisalj and Malinska, were done according to previously defined traffic configurations. The results are presented in Figure 7 and Figure 8. The comparison of the results obtained from the simulation revealed significant differences between the roundabouts studied and to highlight some changes in traffic parameters when AVs are introduced.
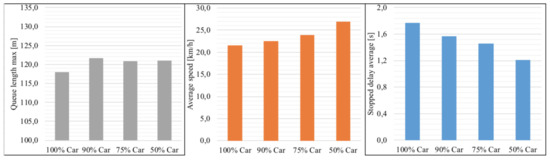
Figure 7.
Microsimulation results for Omisalj roundabout.

Figure 8.
Microsimulation results for Malinska roundabout.
From Figure 7 and Figure 8 it is evident that with the introduction of AVs the average travel speed increases (by about 20%). The increase of speed is more significant with the increase of percentage of AVs and it can be explained or connected with better performance of traffic conflicts management by AVs. The results for the average speed were additionally confirmed and they were also complementary to the decrease of the average stop delay. The stop delay is at both roundabouts on average 20% lower when 50% of AVs are introduced. The previous observations can be considered consistent with the “average expectations” of road designers, managers and drivers: higher traffic flow, also in the intersections, connected to the progressive increase of AVs penetration.
However, the estimated queue lengths, reported in Figure 7 and Figure 8, highlighted an aspect that appears crucial, unlike the average operating performance of each vehicle measured by speed and delay, the introduction of AVs can cause a significant increase or a considerable decrease in the queue length, depending on the specific geometric layout of the roundabout (including detailed approach features) and on number of arms or traffic distribution. This result can be attributed on the one hand to the higher capacity of the arm due to the better platooning of AVs. On the other hand, the increase or decrease of the queue length at the approach can be attributed to the geometric standards of the roundabout and to the geometric parameters of the arms. This, in the first instance, will entail a foreseeable differentiation of the operational performance of the AVs between an existing and another roundabout with similar characteristics.
5. Safety Analysis Evaluation
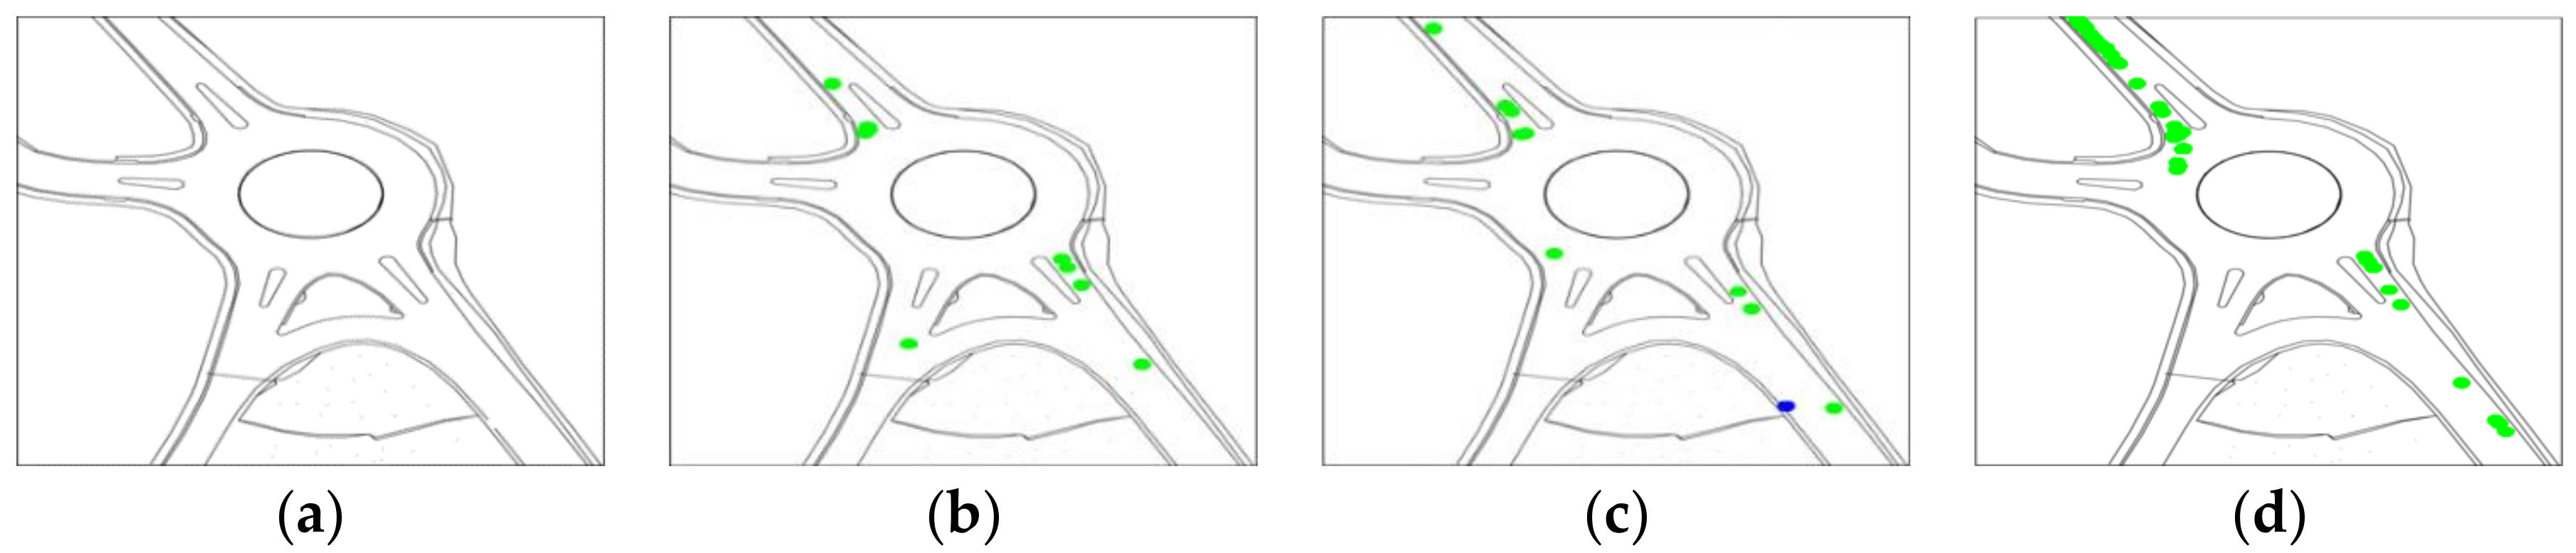
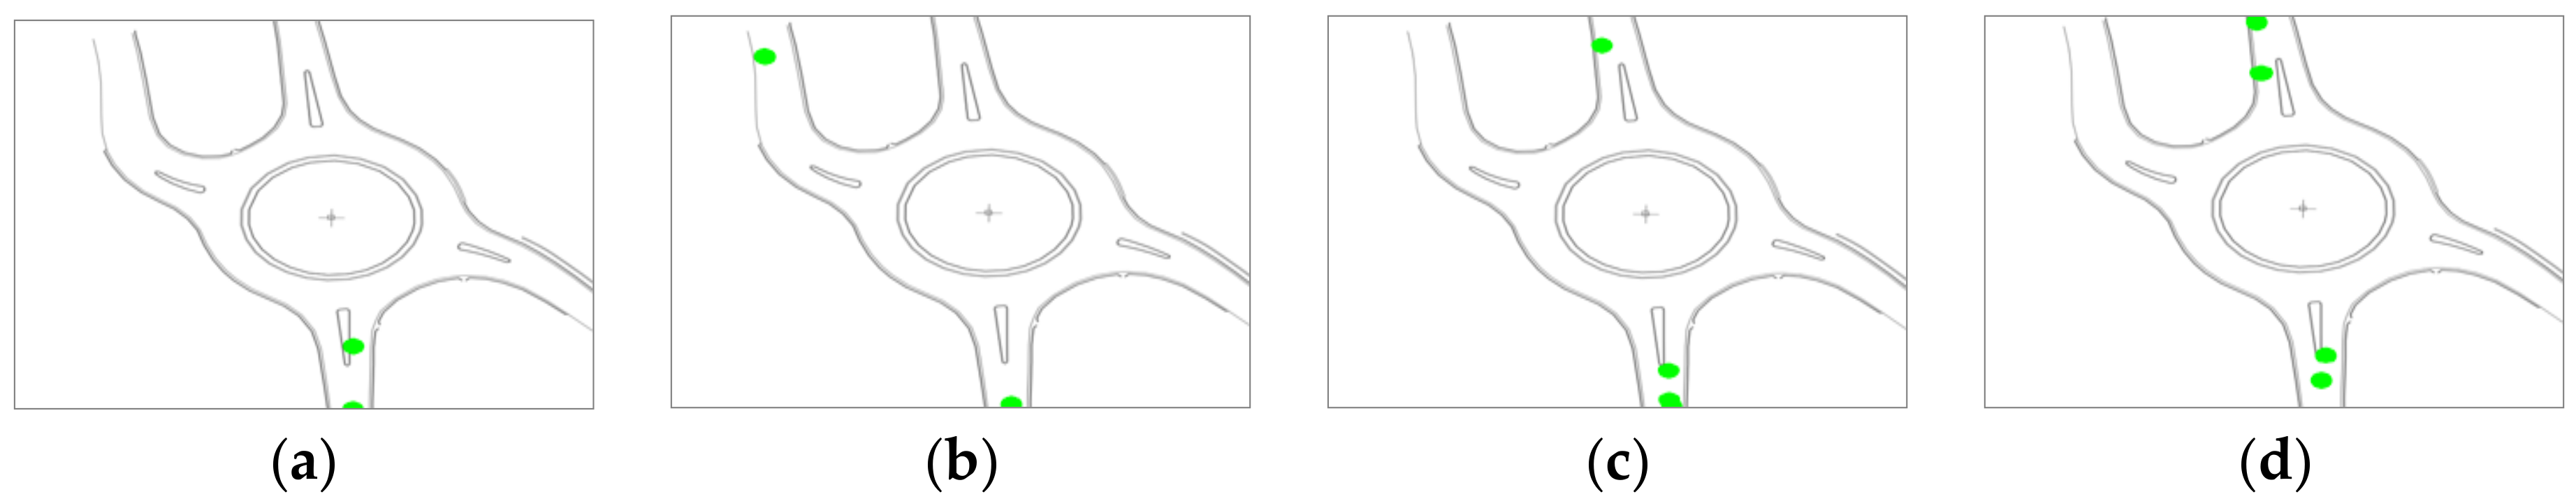
For the safety analysis, the software SSAM was used. Figure 9 and Table 7 show the exact position and typology of each potential traffic conflict for the Omisalj roundabout. The results show that by applying different TCs the number of potential traffic conflicts increases with the increase of AVs percentage. The increase is more evident for rear-end type crashes and they are concentrated along the main traffic direction.
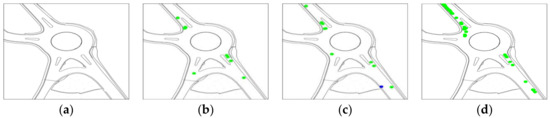
Figure 9.
Position and typology of potential conflict in four different TC, (a) TC1; (b) TC2; (c) TC3; (d) TC4 in Omisalj roundabout.
Table 7.
Type of conflicts for Omisalj roundabout.
Figure 10 and Table 8 show the exact position and typology of each potential traffic conflict for the second roundabout, Malinska. When different TCs are applied at this roundabout, the number of potential traffic conflicts also increases. The main type of crash is again rear-ended but in this case they are not concentrated only on the main direction but equally on both main and secondary directions. This can be the result of different traffic distributions where the secondary directions have more traffic load than those on the Omisalj roundabout.
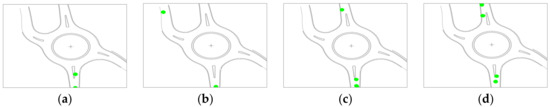
Figure 10.
Position and typology of potential conflict in four different TC, (a) TC1; (b) TC2; (c) TC3; (d) TC4 in Malinska roundabout.
Table 8.
Type of conflicts for Malinska roundabout.
The conflict analysis results obtained with VISSIM-SSAM for these intersections were then used in crash estimating model based on the predictive capabilities of the peak hour conflicts. The result of the model is the number of potential traffic conflicts which can be compared with the real crash number presented in Table 4.
Comparisons were done for three potential traffic conflict types: total accidents from total conflicts, angle accidents from crossing conflicts and rear-end accidents from rear-end conflicts.
The SSAM’s linear and non-linear models are adopted from Islam et al. [19] as follows:
where β0 = 0.099; β1 = 0.145.
crash/year = eβ0 × log(conflict/hour) β1
The above model retrieved in the literature did not refer to roundabout environment specifically, but more in general it was calibrated on urban road intersection. For the purpose of this preliminary investigation, the adoption of Equation (2) was assumed almost suitable, even if it would be challenging to develop a new model able to link the potential traffic conflict to the estimated crash specific for roundabouts. The results of the conversion using Equation (2) for the Omisalj an Malinska roundabouts are shown in Figure 11 and Figure 12.
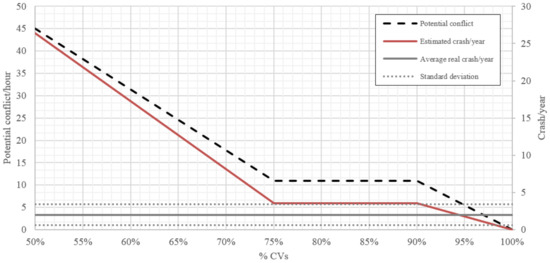
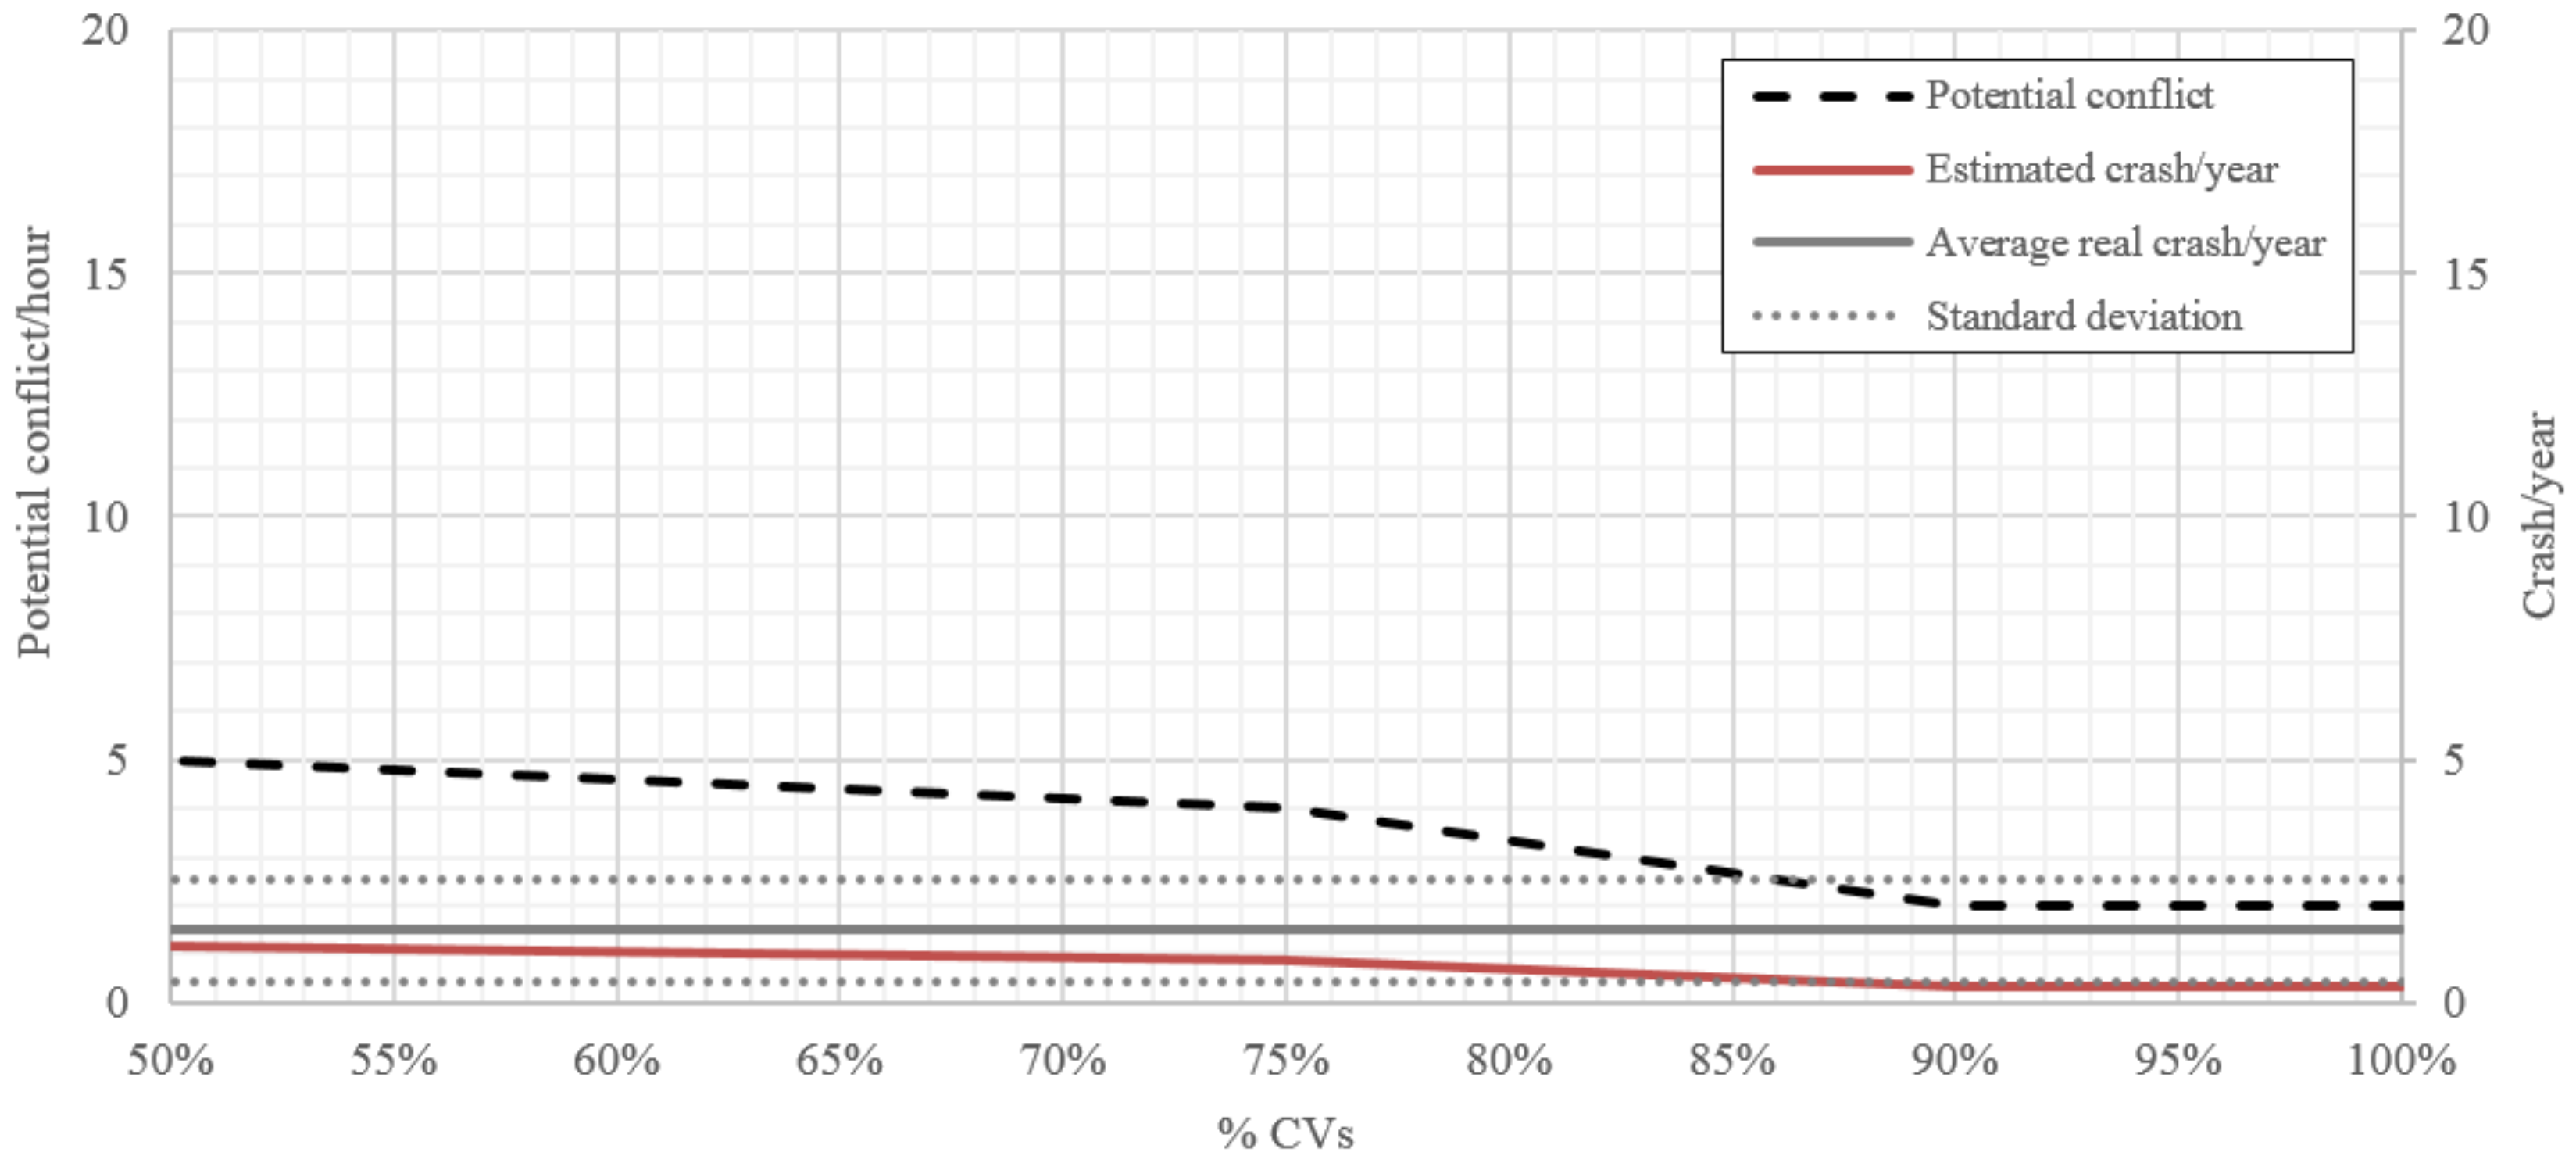
Figure 11.
Variation of potential conflict and estimated crashes for the different TCs at Omisalj roundabout.
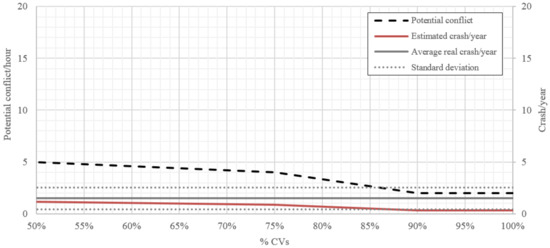
Figure 12.
Variation of potential conflict and estimated crashes for the different TCs at Malinska roundabout.
Considering the graphs presented in Figure 11, the increase of AVs percentage does not fit with the variation around the average crash data. In other words, it seems necessary to understand better which kind of safety improvements have to be done at the Omisalj roundabout before the introduction of AVs. The considerations for Malinska roundabout are almost the same (see Figure 12). In this case, the estimated crash risk increases slowly with the tendency to be major more than the average crash data with the increase of AVs percentage.
6. Discussion
The simulations done give some relevant insight on how the introduction of AVs could change both operational and safety parameters at roundabouts. Even though only two roundabouts were considered, as they have different layouts but very similar operation features (speed, gap-acceptance range, delay, etc.), they can be estimated as a reliable sample.
When AVs are introduced in traffic, one of the relevant issues will be the vehicle occupant’s perception of the severity of traffic events. Technologically it might be possible to adopt small gaps safely, but the question is whether people will accept that. Generally, people seem to accept smaller safety margins when they are in control themselves. If larger margins need to be applied to make autonomous vehicles acceptable for people, the overall traffic flow (or capacity) might get worse instead of improving [20]. This kind of hypotheses, encouraged by the microsimulation effort, should stimulate the interest about the study of new road networks, including new roundabout design standards. The need to upgrade the existing roundabout layout, Croatian and elsewhere, should be addressed together with in depth analysis about the national and local policy effects on different levels of AVs introduction.
Referring to the safety evaluation highlighted by the current research, it is possible to say that the number of potential conflicts will increase with the introduction of AVs. As shown in Figure 11 and Figure 12, the increase depends on the share of AVs circulating in the roundabout (as described for the different TC considered); it could address both the condition of major interference between CVs and AVs and the higher driving performance of AVs (less headway distance, higher average speed, platoons configuration, environment awareness, etc.). Anyway, considering the specific potential conflict type, as shown in Table 7 and Table 8, it is clear that the increase is referred to just in terms of rear-end conflict. In other words, it is possible to declare that the shift from potential conflicts to real crashes could be in terms of not serious damages and perhaps without injures.
The increase in these types of crashes is not a fully acceptable situation since it can lead to an undesirable level of safety for the specific roundabout. So, there is a need to understand how to improve the roundabout design standards in order to better adjust the road environment to the introduction of AVs. For example, some ITS application could be necessary in order to adapt the existing intersection and to minimize the AVs fall of performance or the probability of crash occurrence. It might be suitable to introduce new AVs behavioural parameters within some roundabout design standards (right turn organization, approach visibility, etc.) or to use the machine learning (e.g., neural networks) approach, which can be trained on a dataset of severe and less severe traffic conflicts to obtain some suitable Crash Modification Factors (CMF).
To further explore the effects on safety of roundabouts with the introduction of different levels of AVs, hypothetical safety treatments could be tested to explore whether their effects may change, leading to the estimation of a new set of CMF. The treatments, as noted earlier, will target rear-end collisions or include changing the right-turn lane from permissive to permissive protected.
7. Conclusions
The study presented in this paper, based on microsimulation tools, illustrates how the introduction of different levels of AVs (10–50%) will affect traffic conditions and safety level at a single-lane roundabout. The microsimulation model was developed using VISSIM software for two suburban roundabouts in Croatia. Real geometric layout, traffic data and speed measured at the field were used for model calibration. Simulated speeds and speeds recorded on four roundabouts were equal in 66% of the trial.
The CVs calibration was done by using and adjusting the Wiedemann 74 car-following model and the AVs calibration was done by using and adjusting VISSIM parameter set for the Driving Behaviour Parameter Set\Wiedemann 99\Following such as: CC0, CC1, CC2, etc. Four traffic configurations (TCs) with different traffic distribution (CV, HGV, AV amount) were considered. The microsimulation result showed that in all cases there was an increase of travel speed and decrease of average stop delay with the increase of percentage of AVs. At the same time, the results of queue length for two analysed roundabouts of the same size are different. It can be concluded that approach design or traffic distribution can affect the increase of queue length. It is an important parameter which should be analysed further to establish possible correlation among these and other elements/inputs in order to enhance roundabout performance when AVs are introduced.
The same TCs were used to conduct safety analyses by using SSAM software. The results showed increases in estimated crash number at roundabouts when AVs percentage is increased. For the most part, there are rear-end crashes that can be considered as not critical but still cannot be neglected when changes in roundabout design connected with the introduction of AVs will occur. To evaluate the limitations of this study, it is possible to highlight the use of the SSAM model linking potential traffic conflict to the estimated crash due to the lack of specific model for a roundabout. It is recommended to develop a new model to estimate the expected crash starting from potential traffic conflict if an adequate roundabout sample is available.
Author Contributions
T.G. and A.D.T. designed the experiments; S.T. and S.S. performed the experiments; all of the authors analysed the data; T.G. and S.S. wrote the paper; A.D.T. provided oversight for the safety analysis methodology and high level editorial review of the paper.
Conflicts of Interest
The authors declare no conflict of interest.
References
- Elvik, R. Effects on Road Safety of Converting Intersections to Roundabouts: Review of Evidence from Non-U.S. Studies. Transp. Res. Rec. J. Transp. Res. Board 1997, 1595, 14–19. [Google Scholar] [CrossRef]
- Ambros, J.; Novák, J.; Borsos, A.; Hóz, E.; Kiec, M.; Machciník, S.; Ondrejka, R. Central European Comparative Study of Traffic Safety on Roundabouts. Transp. Res. Proced. 2016, 14, 4200–4208. [Google Scholar] [CrossRef]
- Rodegerdts, L. Roundabouts in the United States; NCHRP Report 572; NCHRP: Washington, DC, USA, 2007. [Google Scholar]
- Montella, A. Identifying crash contributory factors at urban roundabouts and using association rules to explore their relationships to different crash types. Accid. Anal. Prev. 2011, 43, 1451–1463. [Google Scholar] [CrossRef] [PubMed]
- Chen, Y.; Persaud, B.; Sacchi, E.; Bassani, M. Investigation of models for relating roundabout safety to predicted speed. Accid. Anal. Prev. 2013, 50, 196–203. [Google Scholar] [CrossRef] [PubMed]
- González, D.; Pérez, J.; Milanés, V. Parametric-based path generation for automated vehicles at roundabouts. Expert Syst. Appl. 2017, 71, 332–341. [Google Scholar] [CrossRef]
- Friedrich, B. The Effect of Autonomous Vehicles on Traffic. In Autonomous Driving. Technical, Legal and Social Aspects; Springer: Berlin, Germany, 2016; pp. 317–334. [Google Scholar]
- Giuffrè, T.; Di Dio, S. Smart transportation as a driver of transition: Big data management, behavioural change and the shift to automated vehicles. In Smart Cities: Technologies, Challenges and Future Prospects; Barton, A., Manning, R., Eds.; Novapublishers: Hauppauge, NY, USA, 2017. [Google Scholar]
- Giuffrè, T.; Trubia, S.; Canale, A.; Persaud, B. Using Microsimulation to Evaluate Safety and Operational Implications of Newer Roundabout Layouts for European Road Networks. Sustainability 2017, 9, 84. [Google Scholar] [CrossRef]
- Bassani, M.; Persaud, B.; Saulino, G. Calibration and Application of Crash Prediction Models for Safety Assessment of Roundabouts Based on Simulated Conflicts; Transportation Research Board TRB; National Academy of Science: Washington, DC, USA, 2015. [Google Scholar]
- Shahdah, U.; Saccomanno, F.; Persaud, B. Integrated Traffic Conflict Model for Estimating Crash Modification Factors. Accid. Anal. Prev. 2014, 71, 228–235. [Google Scholar] [CrossRef] [PubMed]
- IOWA State University. Development of a Conflict Analysis Methodology Using SSAM; Institute for Transportation: Ames, IA, USA, 2012. [Google Scholar]
- Aria, E.; Olstam, J.; Schweitering, C. Investigation of Automated Vehicle Effects on Driver’s Behavior and Traffic Performance. Trans. Res. Proced. 2016, 15, 761–770. [Google Scholar] [CrossRef]
- Hydén, C. The Development of a Method for Traffic Safety Evaluation: The Swedish Traffic Conflicts Technique Front Cover; Lund Institute of Technology Department of Traffic Planning and Engineering: Lund, Sweden, 1987. [Google Scholar]
- Giuffrè, O.; Granà, A.; Tumminello, M.L. Exploring the uncertainty in capacity estimation at roundabouts. Eur. Transp. Res. Rev. 2017, 18, 633–645. [Google Scholar] [CrossRef]
- VISSIM 2011, Version 5.30; User Manual PTV Planug Transport Verkehr AG, Innovative Transportation Concepts. Manufacture: Karlsruhe, Germany, April 2011. Available online: https://www.et.byu.edu/msaito/CE662MS/Labs/VISSIM_530_e.pdf (accessed on 30 November 2017).
- Aria, E. Investigation of Automated Vehicle Effects on Driver’s Behavior and Traffic Performance. Ph.D. Thesis, Linköpings Universitet, Linköping, Sweden, 2016. [Google Scholar]
- Granados, M.E.; Persaud, B.; Rajeswaran, T.; Saleem, T. Using Microsimulation to Evaluate the Impact of Automated Vehicles on Safety Performance of Signalized Intersections. Proceeding of the Transportation Research Board 97th Annual Meeting, Washington, DC, USA, 7–11 January 2018. [Google Scholar]
- Islam, N.; Faruk, O.; Shimu, T.H.; Hadiuzzaman, M.; Musabbir, S.R.; Rahman, F. Safety assessment of heterogeneous traffic at urban intersections using simulated conflicts. In Proceedings of the Transportation Research Board 96th Annual Meeting, Washington, DC, USA, 8–12 January 2017. [Google Scholar]
- Research on the Impacts of Connected and Autonomous Vehicles (CAVs) on Traffic Flow: Evidence Review. Atkins, May 2016. Available online: https://www.gov.uk/government/uploads/system/uploads/attachment_data/file/530091/impacts-of-connected-and-autonomous-vehicles-on-traffic-flow-summary-report.pdf (accessed on 25 May 2017).


© 2018 by the authors. Licensee MDPI, Basel, Switzerland. This article is an open access article distributed under the terms and conditions of the Creative Commons Attribution (CC BY) license (http://creativecommons.org/licenses/by/4.0/).