3.2. Thematic Areas and Journals
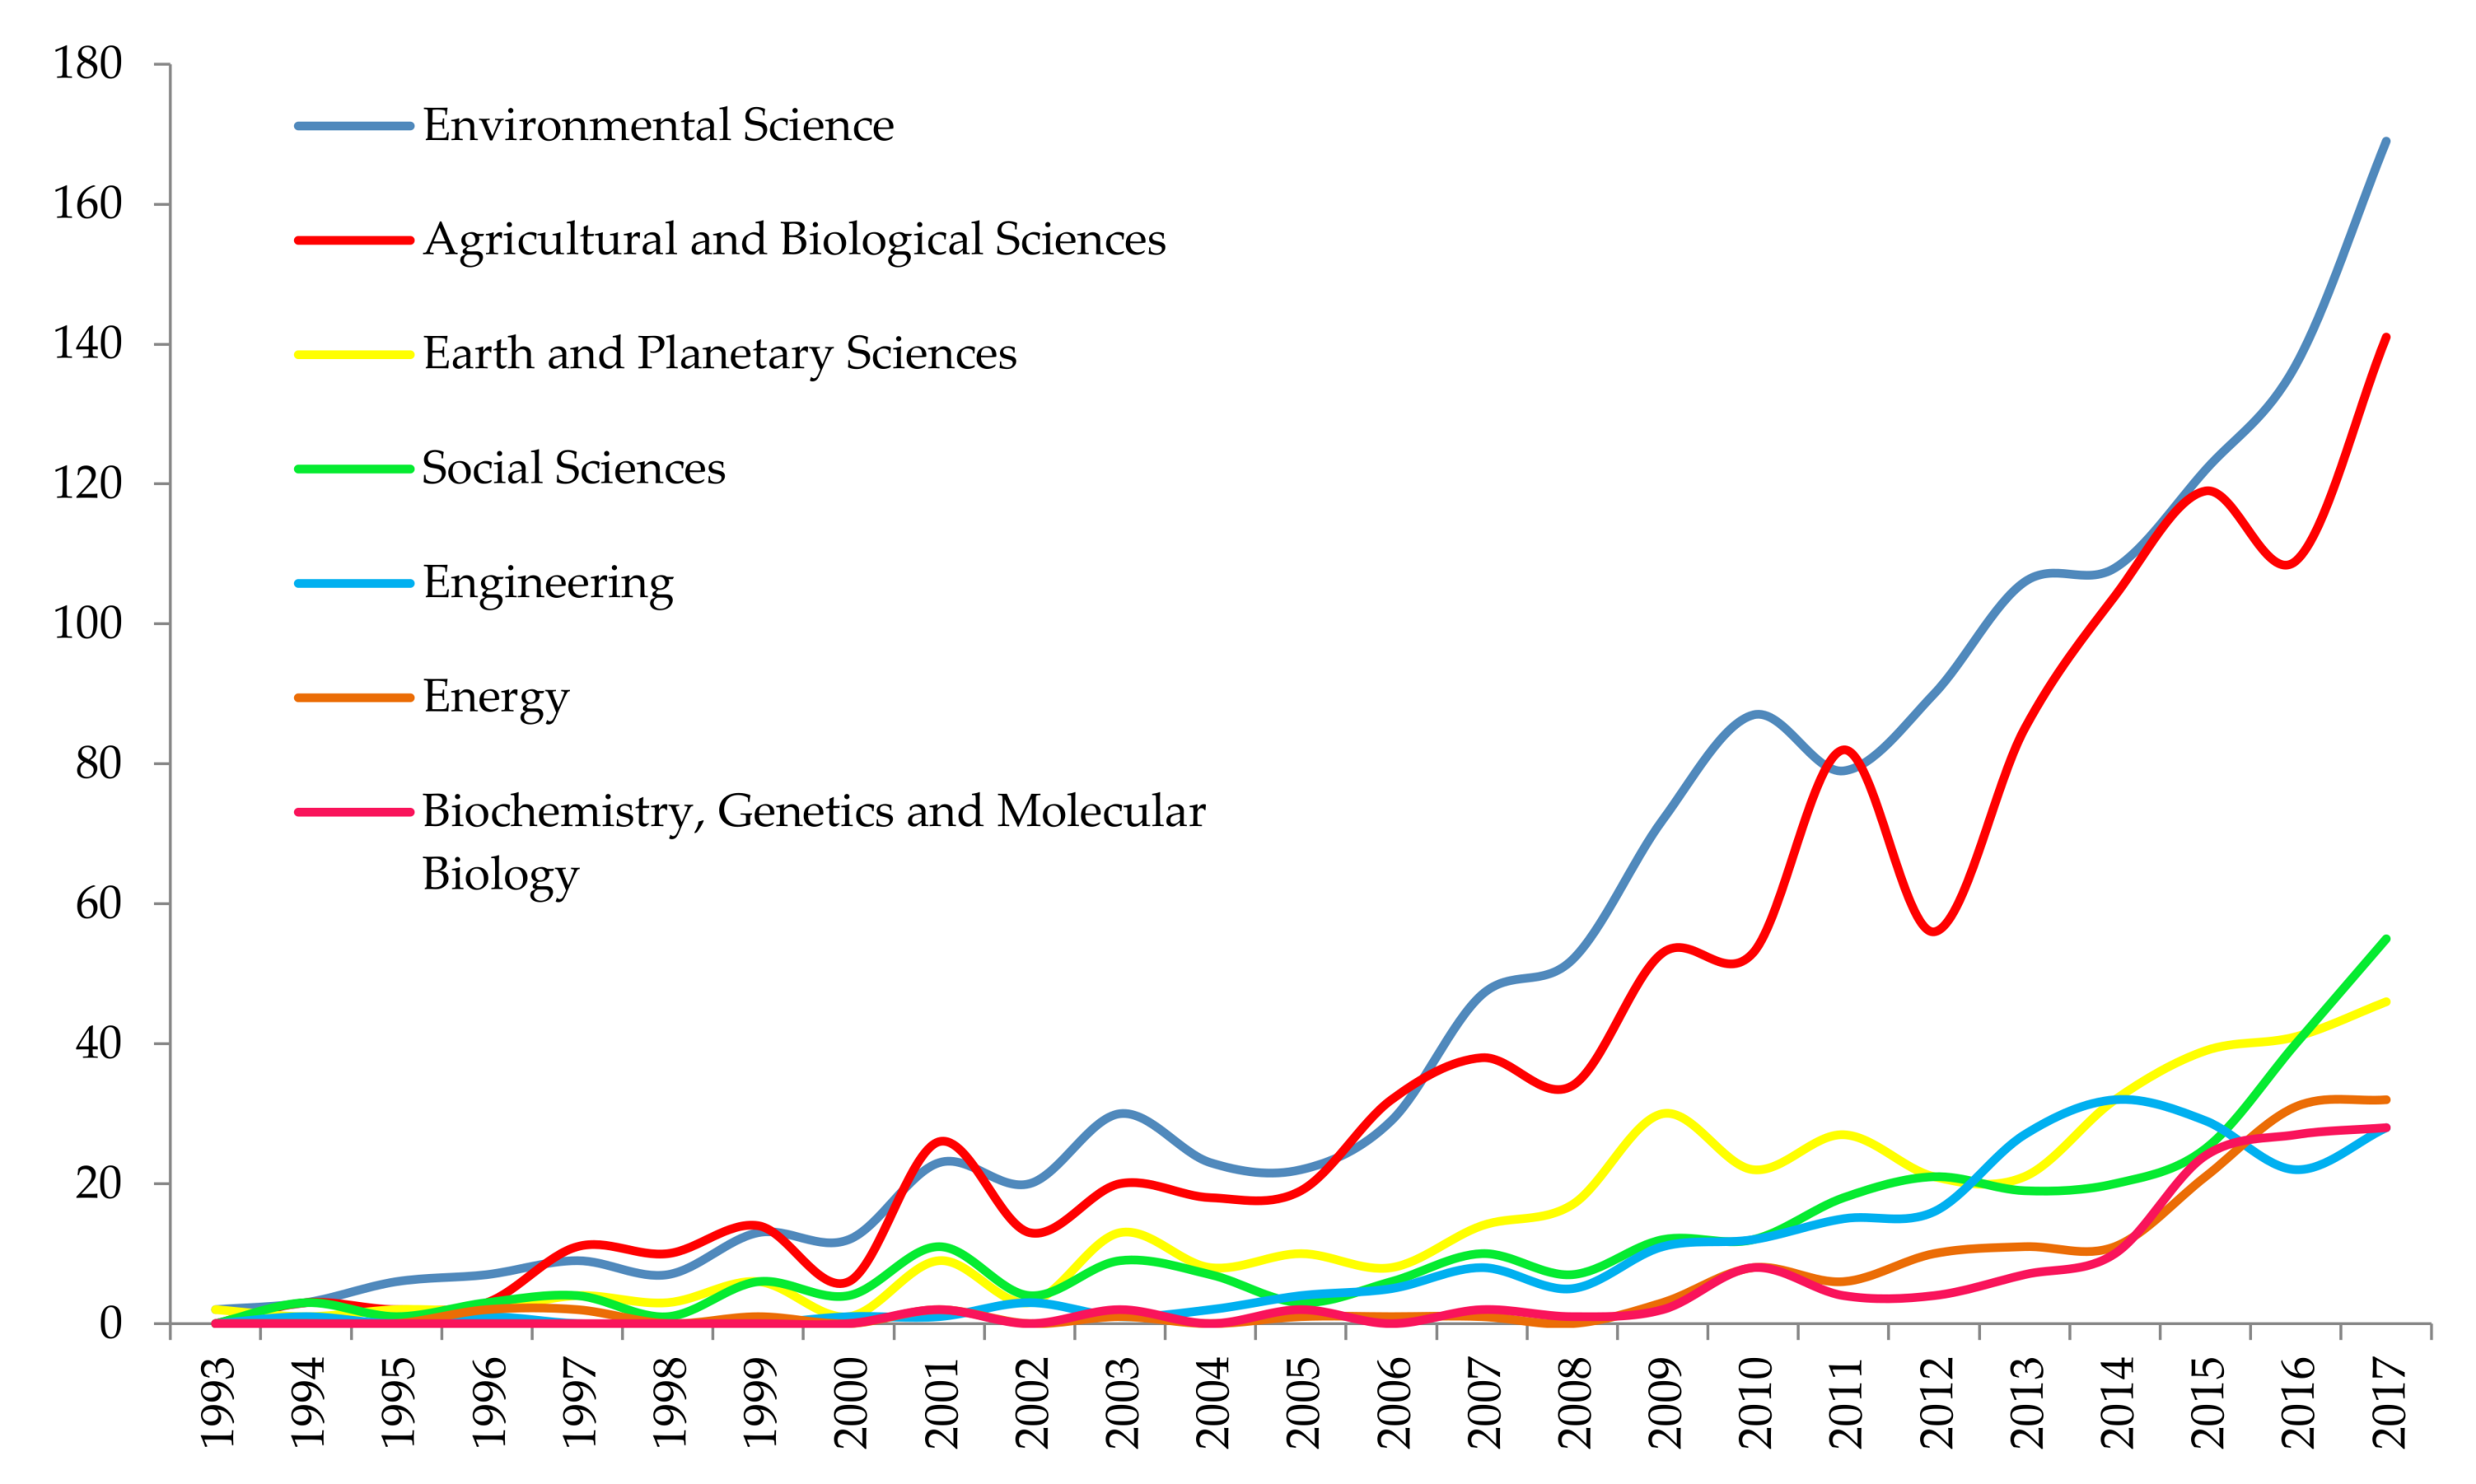
The articles published on SWUA were classified in 25 different categories, although an article can be simultaneously classified into different thematic areas. During the entire study period, the main categories were Environmental Sciences as well as Agricultural and Biological Sciences, which published 61.2% and 50.5% of the total number of published articles, respectively. This was followed by Earth and Planetary Sciences with 18.3%, Social Sciences with 14.5%, Engineering with 10.8% and Energy with 7%. Sustainability is an inherently multidisciplinary concept, which needs the intervention of Natural and Social Sciences for its analysis [
1,
49]. The Social Sciences category only included 14.5% of the total number of articles of the sample, while Economics, Econometrics and Finance represented 2.7%. Business, Management and Accounting represented 2.6%, Multidisciplinary 1.2% and Decision Sciences 0.6%.
Figure 3 shows the evolution of the main subject areas according to the Scopus classification for the period of 1993–2017.
Table 2 shows the most productive journals for SWUA research. In these journals, the different indicators related with production and impact are displayed. This group of journals accumulated 27.1% of the total of articles published, indicating that a wide variety of journals publish articles on SWUA. The journal with the highest number of articles published in this research field was Agricultural Water Management, with a total of 159 articles. Since the beginning of the period chosen, this journal led the ranking. There is a group of journals that was published on this field recently (they published their first article on SWUA in 2011–2013). Nevertheless, they were first in terms of the most productive journals. For example, the journal Sustainability joined the SWUA publications most recently, but achieved the seventh position in the entire period and the third position in the last five-year period (2013–2017), thus surpassing journals with a longer history of SWUA research.
With respect to impact indicators, Agricultural Water Management is the journal that accumulated the highest total number of citations of 4367, followed by Agriculture Ecosystems and Environment with 1101, Water Resources Management with 1020 and Field Crops Research with 942. The journals with the highest number of citations per article are Agriculture Ecosystems and Environment with 45.9, Agricultural Water Management with 27.5, Field Crops Research with 26.2 and Journal of Environmental Management with 25.8. As the H index is conditioned by the number of articles, the comparison between some of these journals according to this index does highlight interesting cases, although there is no clarification. Despite publishing a relatively high volume of articles, journals that joined this thematic area more recently have not accumulated enough citations to increase their H index yet, as an article will not generate a high number of citations until some years after publication. This is the case for journals such as Sustainability, Water or Science of the Total Environment. However, there are journals with a high number of articles and higher tradition in this topic that also showed relatively reduced indexes. This is the case for journals, such as Wit Transactions on Ecology and the Environment, Shengtai Xuebao and Irrigation and Drainage. With respect to the SJR index, the most important publication is the Journal of Hydrology, followed by Science of the Total Environment, Journal of Cleaner Production as well as Agriculture, Ecosystem and Environment. The journals in which more articles on SWUA were published were high quality, as all of them occupied the first and second quartile of their categories within the SJR, with the exception of one journal.
Regarding the group composition of journals that publish most on SWUA, it is interesting to point out that they come from very different theme categories. We can find journals devoted to agriculture, water, management and ecology. This diversity lies in the multidisciplinary character of the water sustainability study in agriculture. The concepts of efficiency and ecosystemic services are tightly linked to the sustainable management of water for irrigation. In fact, it is necessary to improve efficiency in order to reach sustainability. Moreover, efficiency should guarantee services beyond food supply and assure erosion prevention, CO
2 capture and improvement of water quality. The study of these current questions requires the use of new methodologies and the establishment of collaborations among disciplines like Agronomy, Biology, Ecology, Economics and Social Sciences [
50].
3.3. Countries, Institutions and Authors
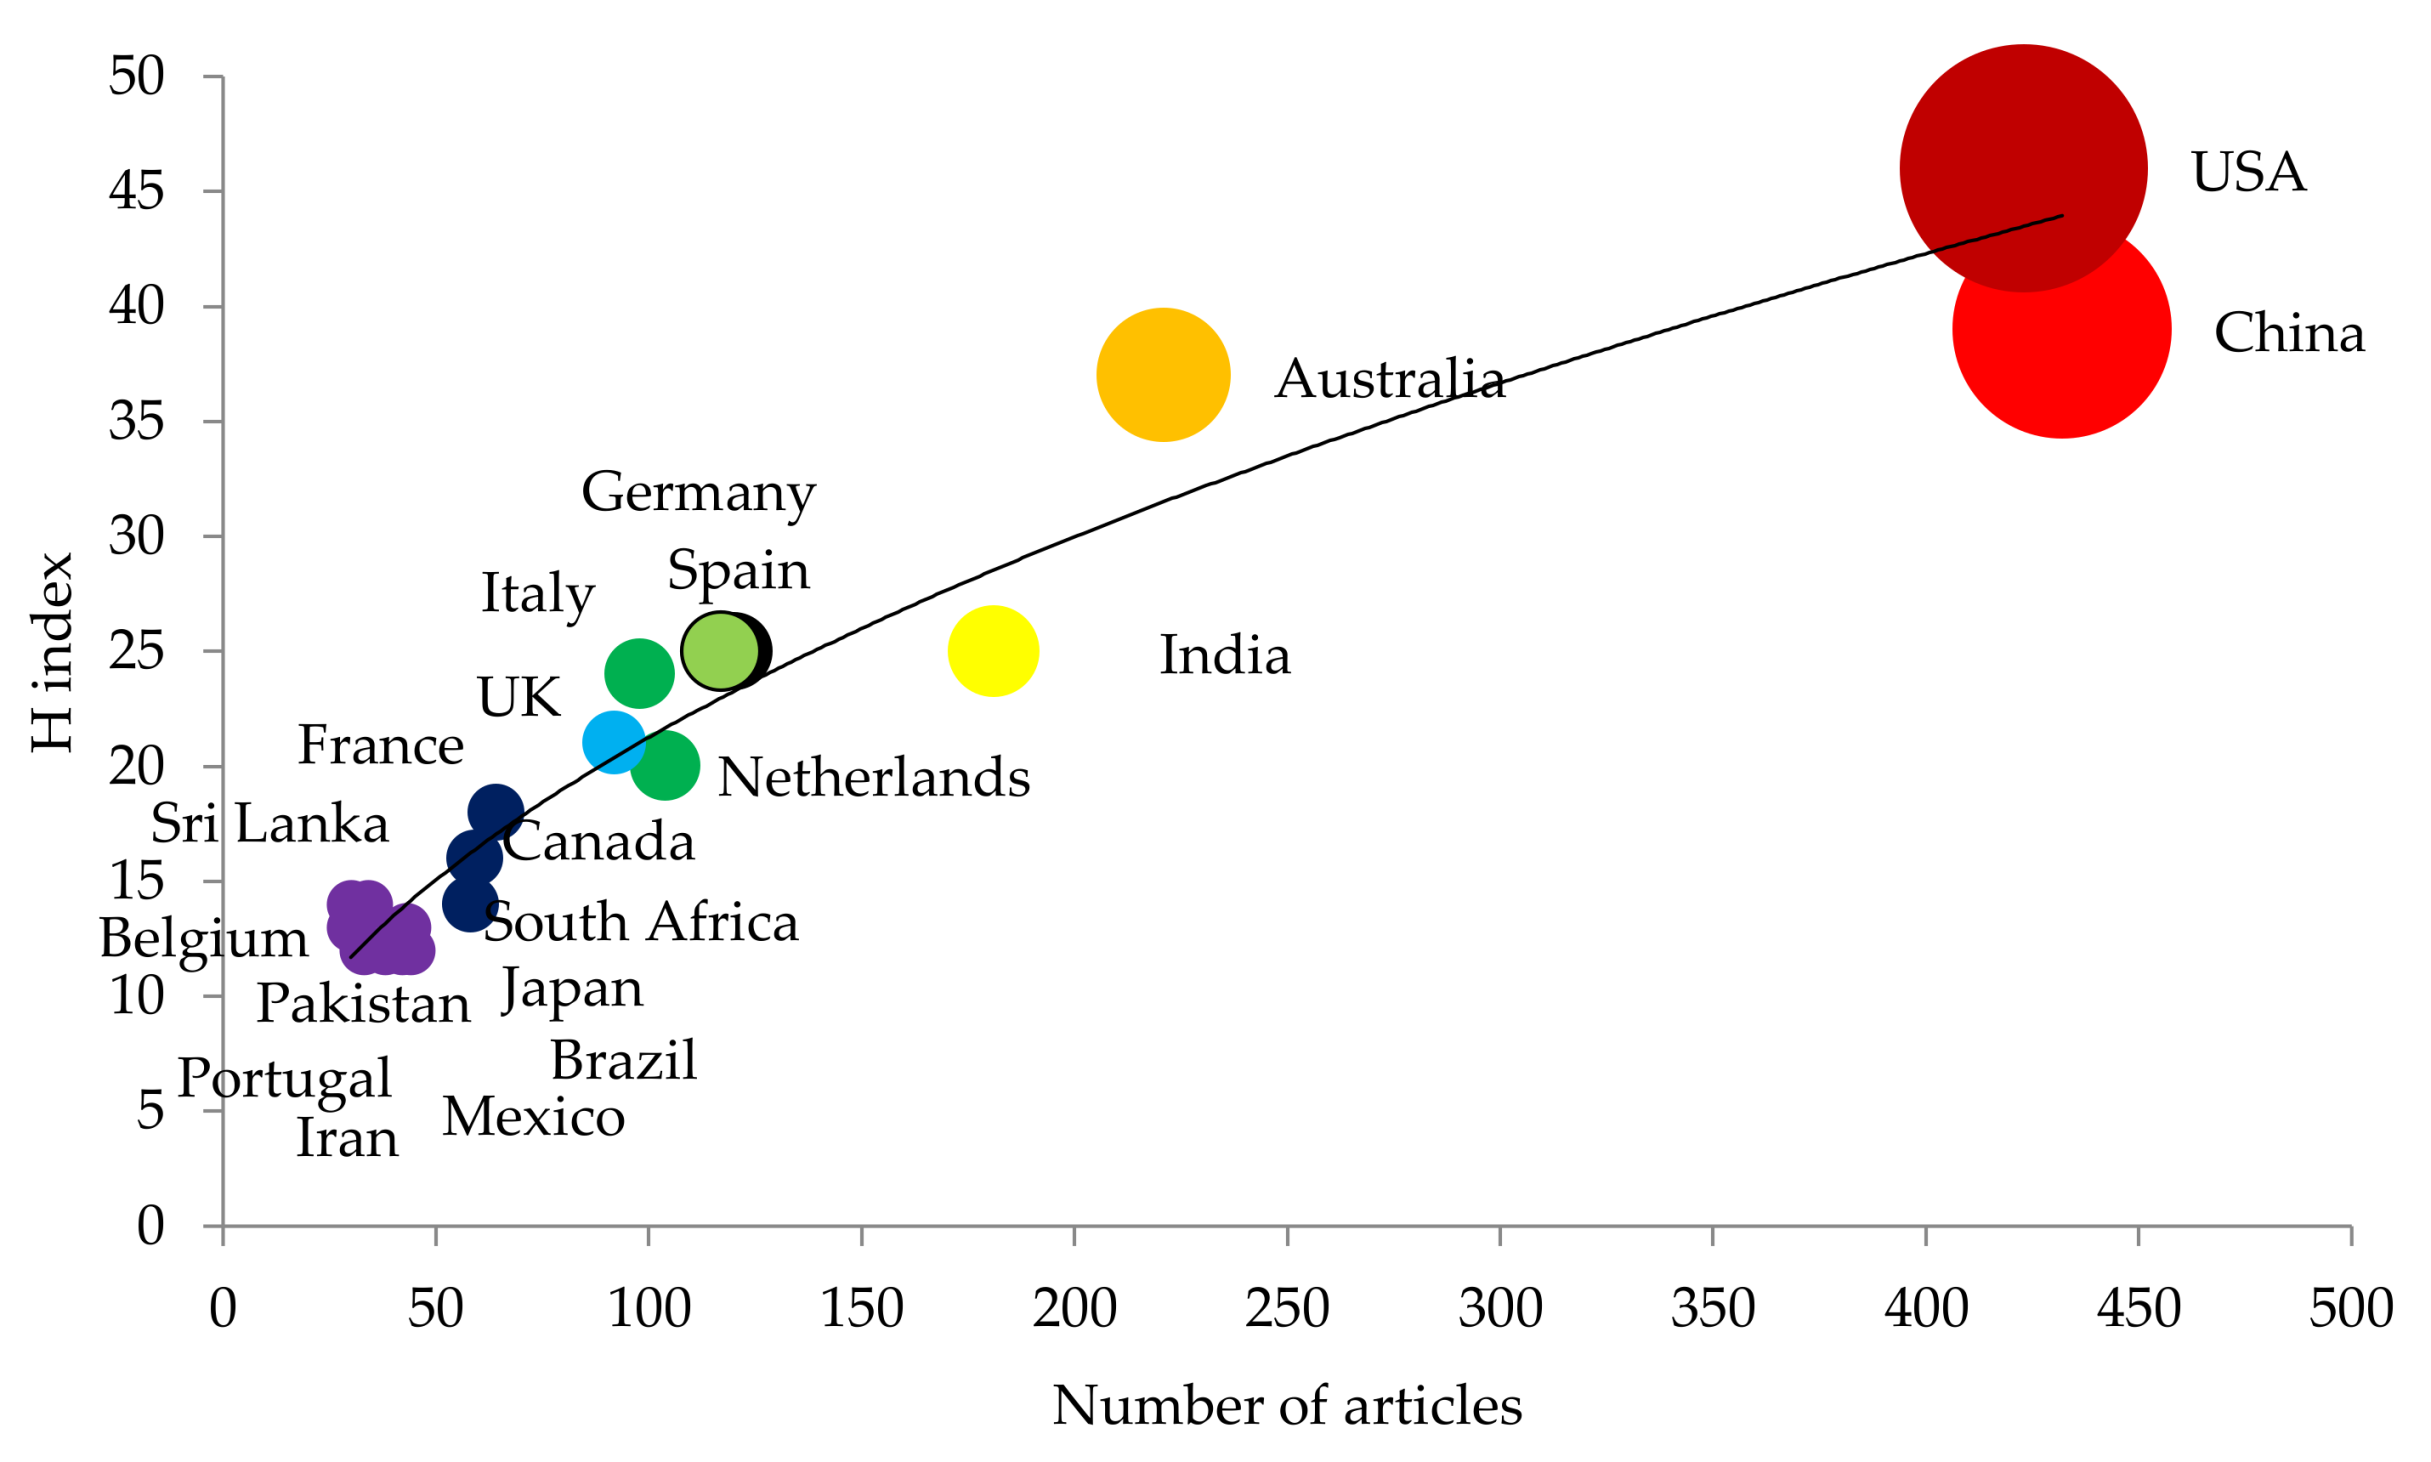
Table 3 shows the main productivity and impact indicators in the 10 countries with the highest number of articles published on SWUA. China ranked first with 432 articles, followed by the U.S. with 423, Australia with 221, India with 181 and Germany with 120. The U.S. was the country with the highest total number of articles published on SWUA during the study period until 2013 when China became the leading country for this ranking. The rest of the countries alternated in other positions within the leading group, except for France, which occupied the eleventh position in the last five-year period and Canada, which occupied the tenth position before joining the top ten group. The table also shows the number of published articles on SWUA per million inhabitants in each country (APC: number of articles per 1 mill. inhabitants). If we weight the number of published articles regarding the country population, in the first position, we can find Australia, followed by The Netherlands and Spain, whereas the last positions are occupied by China and India.
With respect to impact indicator, the U.S. is the country with the highest number of accumulated citations in its articles on SWUA with a total of 9315 citations. It is followed by China with 5382, Australia with 4583, India with 2813 and The Netherlands with 2617. However, if the average number of citations per article is considered, The Netherlands ranked first with a total of 26.7 citations. It is followed by France with 23.2, the U.S. with 22, Italy with 20.8 and Australia with 20.7 citations per article. To visualize the correlation between H index and the number of articles published by each country,
Figure 4 shows the regression model that links these two variables.
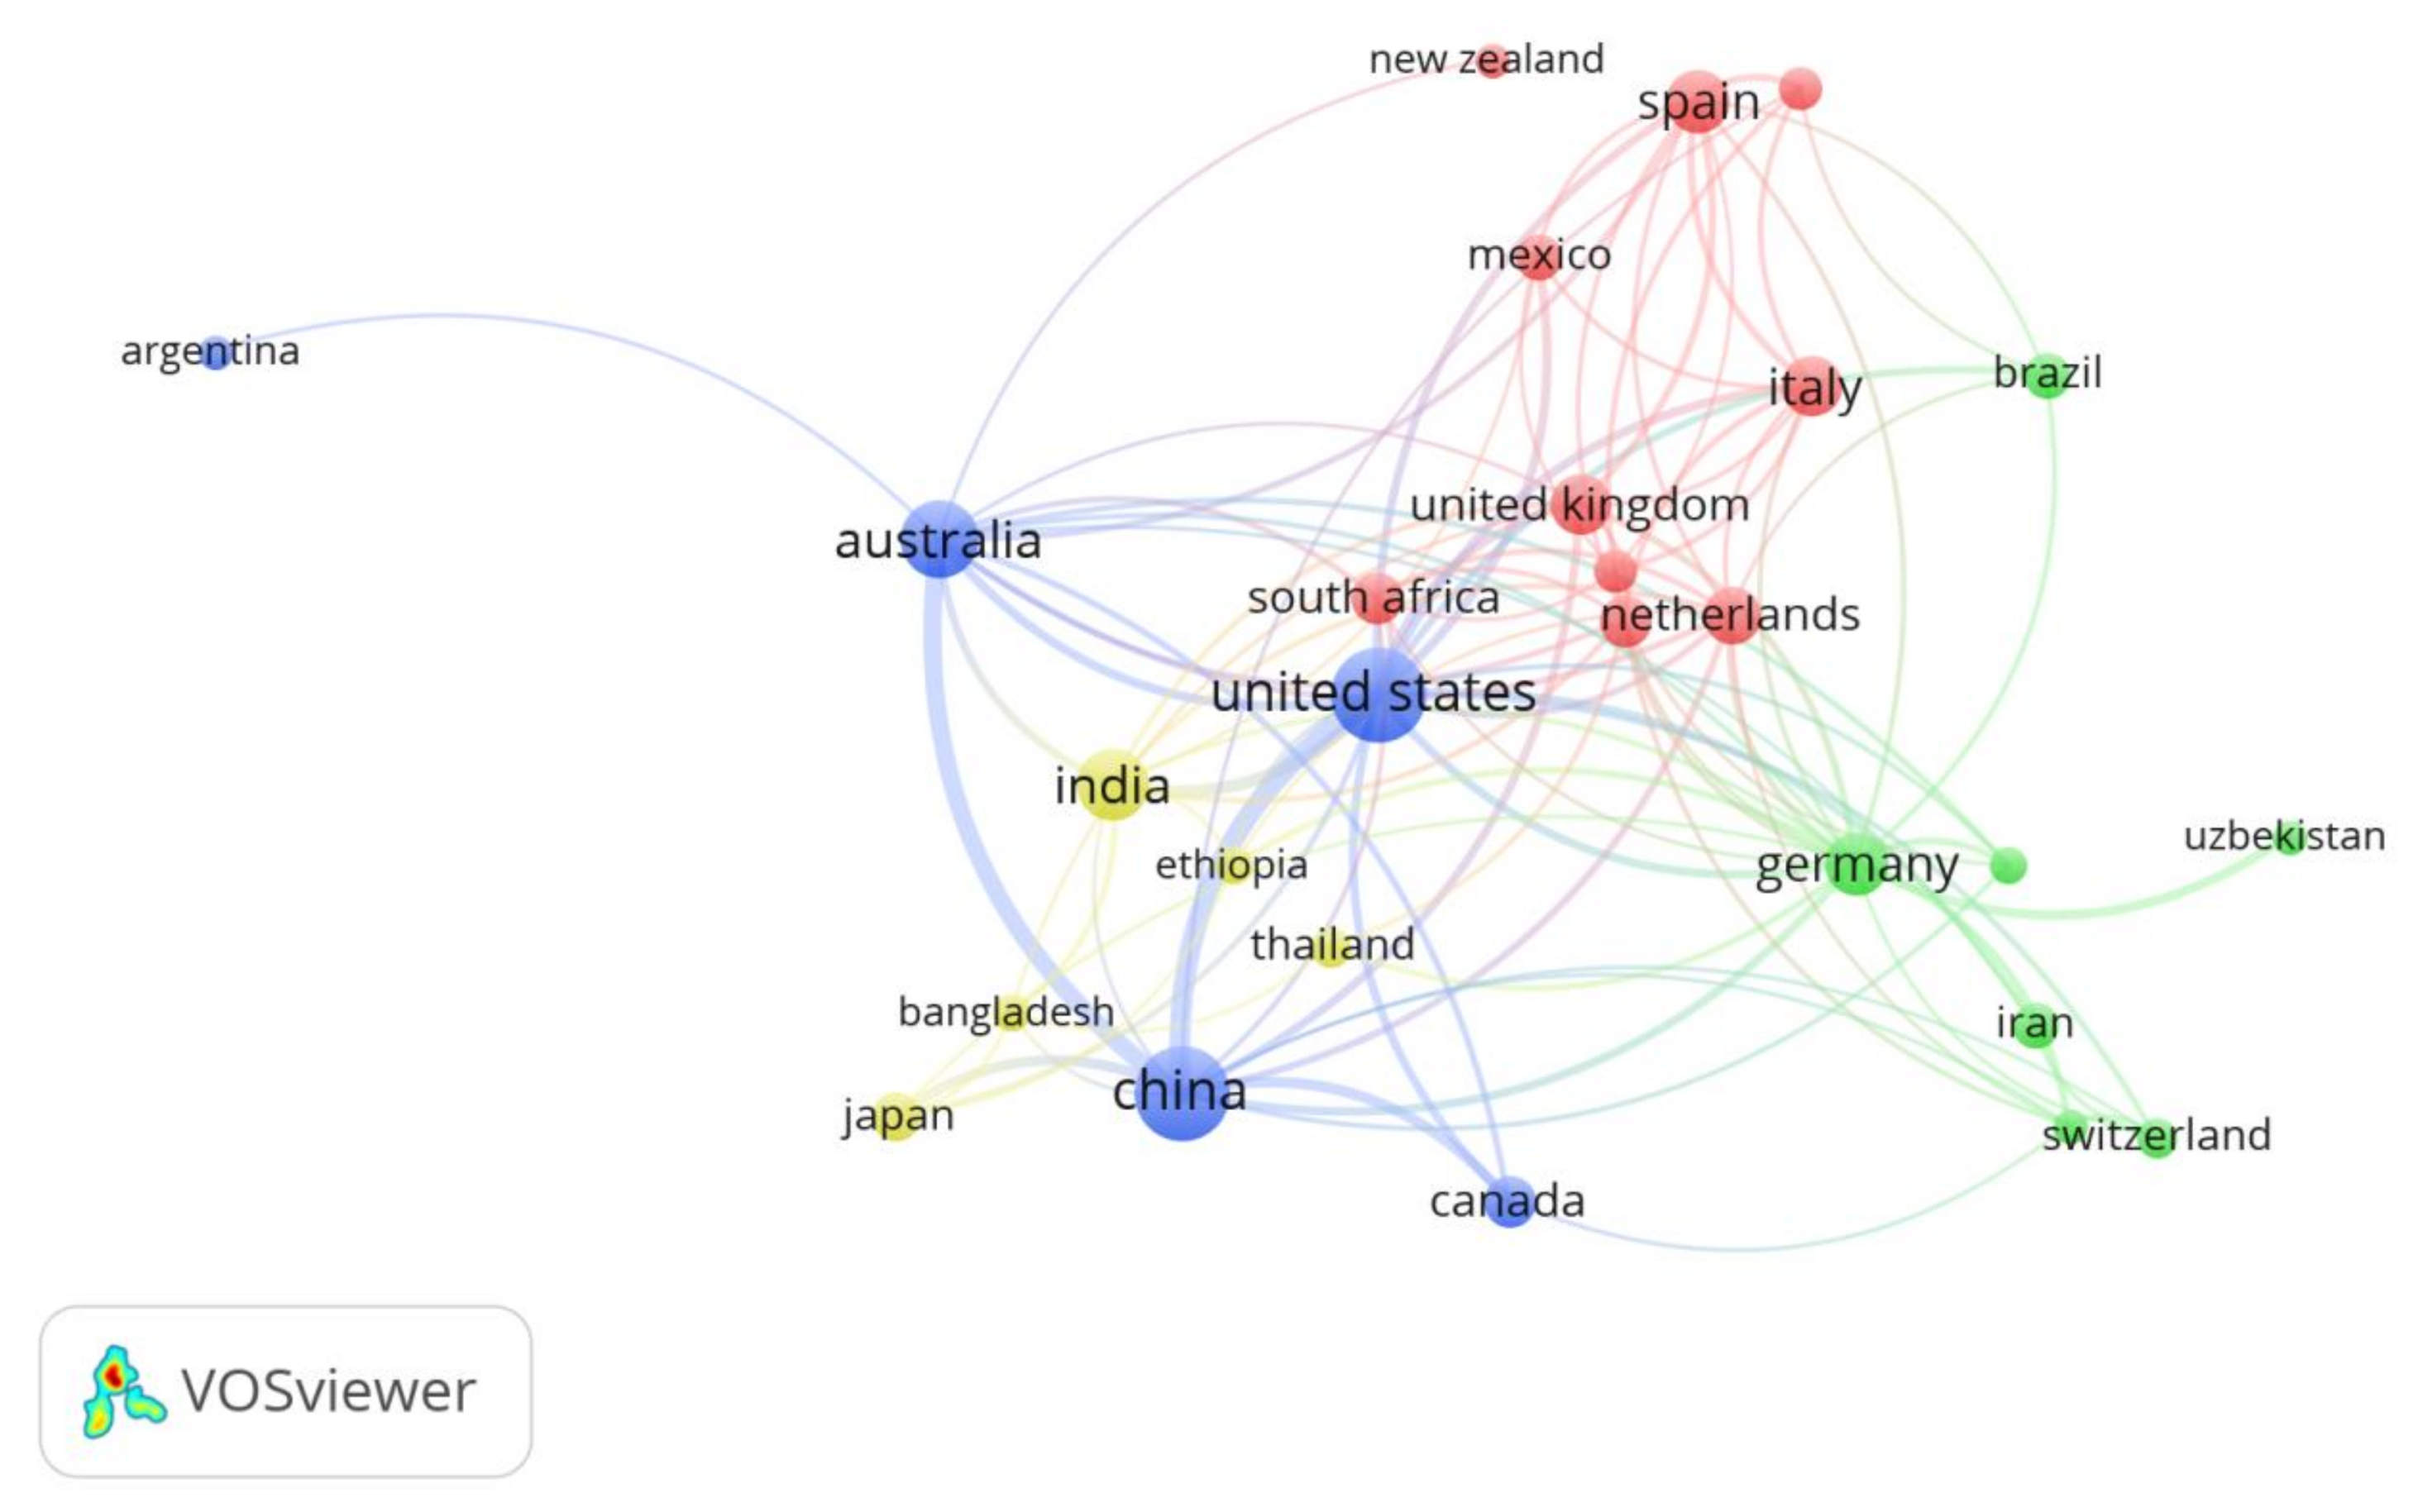
Table 4 shows the percentage of international collaboration (IC), the number of countries forming a collaboration network (NC) and the five main collaborators from each of the most productive countries (classified in descending order with respect to the number of collaborations). France had the highest percentage of works with international collaboration at 68.75% of the total, followed by Germany at 68.33%, The Netherlands at 65.31% and the United Kingdom at 63.04%. The U.S. had the largest network of collaborations, with a total of 55 different collaborating countries, followed by Germany with 50 and China with 43. The table also includes the average number of citations of each country (TC/A) for articles completed with international collaboration (IC) and without international collaboration (NIC). International collaboration created higher impact for the articles published (measured through the number of citations) in all of the cases except for The Netherlands, the United Kingdom and France.
Figure 5 shows a network map of the different collaborations between countries. The set of countries with the highest number of connections was chosen to make the map. The size of each circle represents the number of articles of each country. The thickness of each line represents the number of collaborations between countries. The different colors group the different clusters formed by sets of countries. Four clusters can be differentiated. The first cluster (Blue) is formed by the main productive countries, which are China, the U.S. and Australia, together with Argentina and Canada. The second cluster (Yellow) is formed by India, Ethiopia, Thailand, Bangladesh and Japan. The third cluster (Green) represents Germany with Brazil, Iran, Uzbekistan, Sweden and Switzerland. The fourth cluster (Red) includes the set of Western Europe countries (The Netherlands, Belgium, Portugal, Spain, the UK, France and Italy) together with South Africa, Mexico and New Zealand.
In order to detect the main differences between research trends, articles in collaboration with the leading researching countries—China and the United States—have been reviewed. Regarding China, articles in collaboration with the group built by Australia and the United States have been firstly analysed; and, secondly, those written together with its main European partners—Germany, The Netherlands and the United Kingdom. In both cases, most articles are devoted to domestic Chinese issues, 83% and 95%, respectively. Within the first group (China with Australia and the United States), researchers focus on the efficient use of water, whereas in the second group (China and European countries), the main topic is groundwater. Regarding the collaboration between the United States and its main European partners—Germany, Italy, Spain and the United Kingdom—a balance of the study territory has been found. They are equally devoted to American and European areas, as well as to third countries. The research focus varies from water use and supply to water management for irrigation and sustainability.
Table 5 shows the main production and impact indicators of the institutions with the highest number of publications on SWUA. The Chinese Academy of Sciences ranked first with a total of 134 articles published between 1993–2017. It is followed by the China Agricultural University with 63, the Northwest A&F University (from China) with 59 and the Wageningen University and Research Centre of The Netherlands with 46. With respect to the number of citations, the Chinese Academy of Science had 2195 citations, followed by the Wageningen University and Research Centre of The Netherlands with 1243, the United States Department of Agriculture (USDA) Agricultural Research Service with 1058 and China Agricultural University with 1032. If we consider the average number of citations per article, the USDA Agricultural Research Service ranked first with 27.8 citations. The Wageningen University and Research Centre occupied the second position with 27 citations per article and the CSIRO Land and Water of Australia had the third position with 26.6 citations. Similar to the case found with countries, the H index was not a determining indicator due to the difference in the number of articles published by the different institutions. However, the Chinese Academy of Sciences also showed the highest H index (27). The Wageningen University and Research Centre is the institution that had articles with the most international collaboration (73.91%), followed by the University of Western Australia (56%) and the China Agricultural University (52.38%). In all of the cases, except the University of Western Australia, the articles published by these institutions with international collaboration had a higher impact when measured through the number of citations received.
Table 6 includes the most productive authors on SWUA and shows the main variables related to production (A) and the impact of their articles (TC) in addition to the affiliation, the country (C), the year of publication of their first (1st A) and last article on this topic (Last A). Half of these authors belong to Chinese research centers and, generally, are frequently the recent members of the SWUA research cohort. The author with the oldest publication is Luis S. Pereira from Portugal, who published his first article on SWUA in 1996. All authors published their last article in SWUA between 2015 and 2017, indicating that they continue to work on this topic. The only exception is the case of Frank A. Ward, whose last article is dated from 2012.
Bradley G. Ridoutt is the author with the highest number of articles published on SWUA. His work on the water footprint is the most relevant with respect to the number of citations [
51,
52,
53]. The author with the second highest number of articles is Arjen Y. Hoekstra, who stands out for his works on water footprint and for the large number of countries he has studied, such as China, Kenya, France, the UK, Malawi and Latin America. His more relevant articles are available in references [
54,
55,
56]. Xiying Zhang has the same number of articles published, but his work in the North China Plain is more agronomic. His most cited articles are references [
57,
58,
59]. These three authors have the highest number of citations, have accumulated the highest average number of citations per article and have the highest H index. Based on these data, these three authors are considered as models in this line of research.
3.4. Keyword Analysis
An analysis of the keywords was used to identify hotspots within a research field. The 20 most frequently used keywords in articles on SWUA are displayed in
Table 7 for the period of 1993–2017. The period was divided into five-year sub-periods, which show the evolution of keywords. The values that appear in the table refer to the position that keywords occupied in each sub-period compared with the total number of keywords of the sample, the number of articles in which it appeared [R (A)] and the repetition percentage (%). The 20 most frequently used keywords included terms related to water (Water-Use, Water-Management, Water-Supply, Water-Resources, Water-Use-Efficiency, Water-Conservation, Groundwater and Groundwater-Resources); sustainability (Sustainability, Sustainable-Development and Climate Change); crops and agricultural practices (Irrigation, Agriculture, Crops, Irrigation-System, Crop-Yield, Crop-Production, Triticum-Aestivum, Evapotranspiration and Zea-Mays).
Irrigation ranked first for most of the period. The group formed by these 20 keywords was the set of most frequently used terms in articles on SWUA, although they changed their position according to the relevance given to each one by research in the different sub-periods. The most repeated keywords in the 1993–1997 sub-period were: Irrigation, Water-Supply, Water-Management, Environmental-Protection, Sustainable-Development and Developing-Country. The most used geographical terms were Asia and the Middle East. In this first period, research was directed towards the conservation and environmental protection as well as the agricultural development in developing countries, mainly in the Middle East and Asia. Outstanding methodological terms did not appear.
In the second five-year period (1998–2002), research preferences for keywords changed. In the 1993–1997 period, the focus was on developing regions, whereas, in the 1998–2002 period, specific countries appear among the first positions of the most used terms (India in the 10th position, Australia in the 11th position, China in the 12th position and the U.S. in the 13th position). Unlike the first period, terms referring to arid and semi-arid regions were highlighted in the second period. Terms related to sustainability continue to appear between the two periods. However, terms referring to crops, which were barely used previously, increased in importance during the second period, including Triticum-Aestivum, Crops, Crop-Yield and Crop-Production. Research focused on more agronomic aspects and the field of study was set at the watershed and exploitation level.
The period of 2003–2007 signified the current configuration of the framework with respect to keywords. In addition to the terms already mentioned and related with sustainability and agronomy, words related with hydric resources were diversified (Water, Groundwater, Groundwater-Resources, Catchments, Rain, Aquifers and Rivers). The main crops were Zea-Mays and Wheat. By region, Eurasia, Asia and Europe were respectively ranked in the fifth, ninth and sixteenth positions in the entire keywords sample. By country, China occupied the 16th position and Australia the 19th position. The term World appeared for the first time in the 17th position, which referred to the global scale of the topic analyzed. Mathematical-Models was the most repeated methodological term. The link between Economic and Social Sciences in this field of study was relevant in this period because the term Economic-And-Social-Effects was frequently used.
Trends from 2003–2007 continued through 2008–2012. The main difference was the appearance of terms, such as Drought, Water-Stress and Water-Scarcity. These appeared as a consequence of increasing concerns about the consequences of climate change. This situation was extended to the next period (2013–2017), in which Climate-Change was within the group of the twenty most used words for the first time. Food security was a priority in this field, represented by the terms Food-Security and Food-Supply. The studied crops were Zea-Mays, Wheat and Rice, while the field of study was focused on the watershed level. The most mentioned methodology among the keywords was Water-Footprint.
As far as the keyword evolution is concerned, the term Climate Change stands out. It has moved forward from the 81st to the 15th place. In order to picture the term trends, 192 articles with this keyword have been analysed. The main reason for the increase of its use lies in the growing social interest in the effects of climate change on various fields. One of the key milestones that fostered research on climate change was the creation of the Intergovernmental Panel on Climate Change in 1988. Since then, this platform has published reports about the state of climate change that serve as guidelines for the research needs. The coming into force of the Kyoto Protocol in 2005 meant another huge impulse for the research on climate change. The growing interest in climate change has brought about some research trends on SWUA, the most relevant ones being: sustainability of food and water supply for the growing world population; soil management sustainability based on hydrographic basins; climate change impacts on crops and their sustainability; and planning measures and decision-making processes related to the effects of climate change on the effective use of water for agriculture.
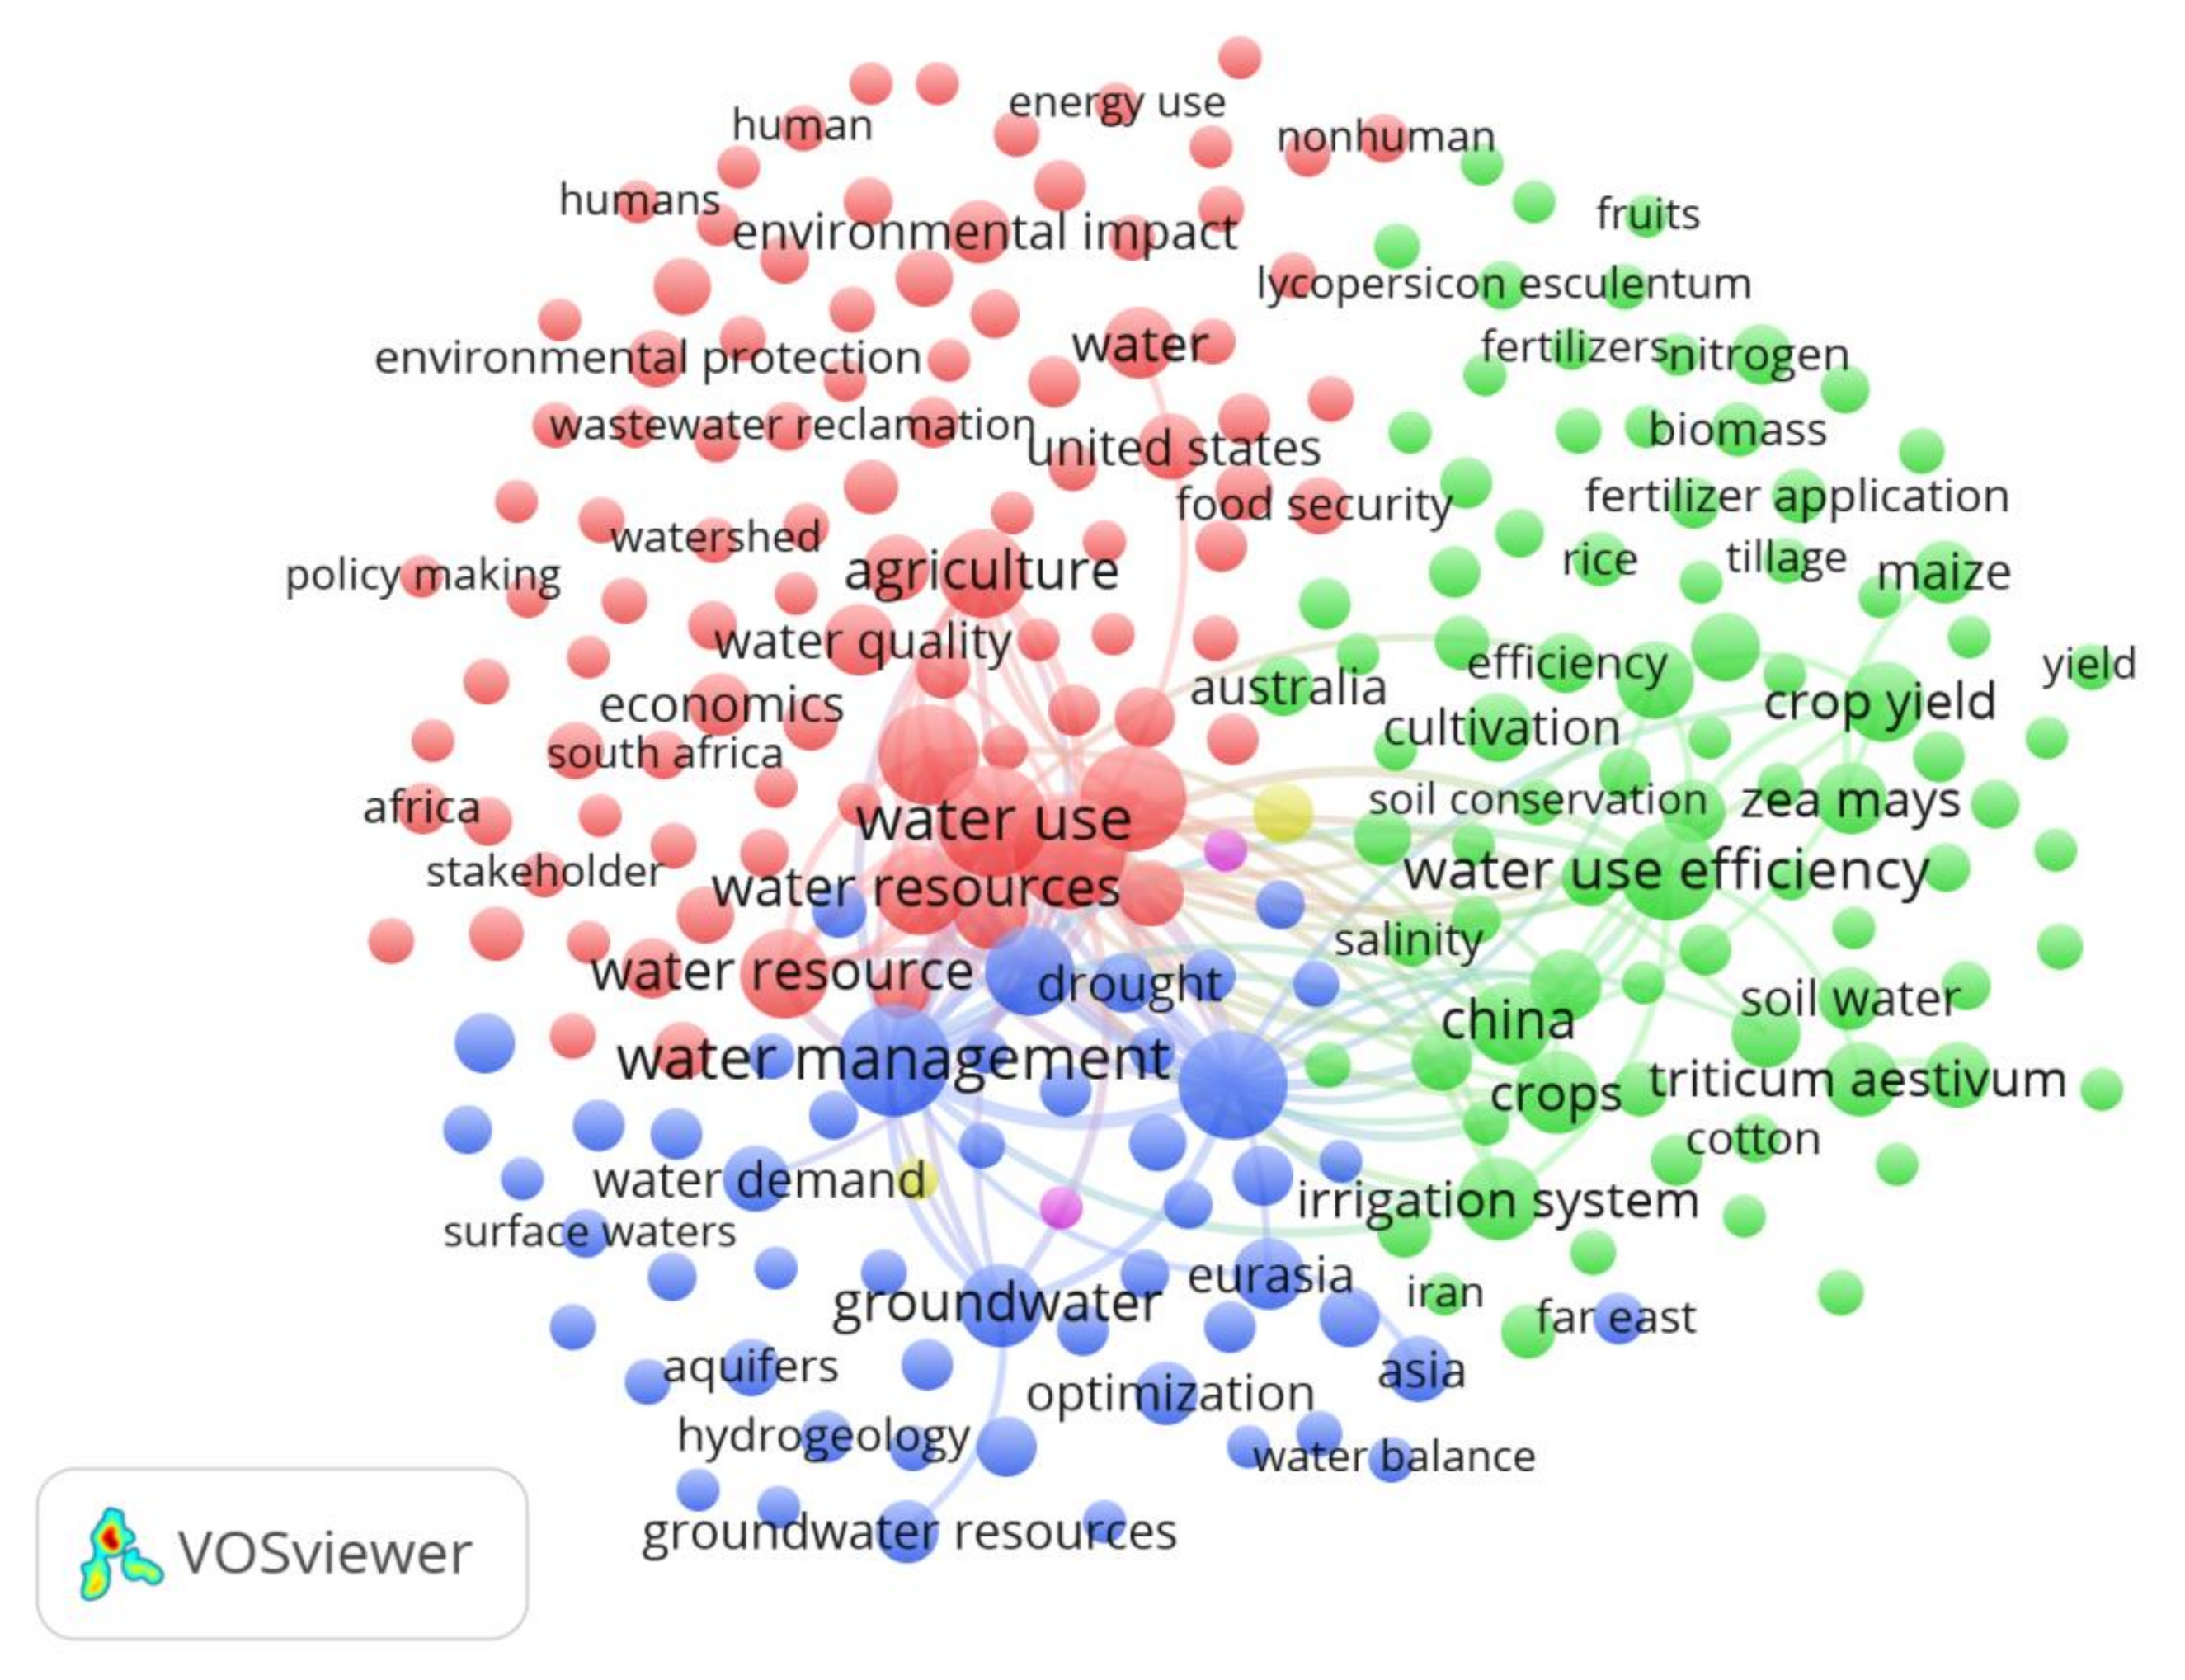
Figure 6 shows the network map that links the keywords to the entire sample of the articles analyzed. The size of the circle represents the number of articles in which each keyword appears and the color represents the cluster in which the keyword is included based on the number of co-appearances. There are three main clusters that represent three different viewpoints on SWUA. The first (Red) is focused on environmental aspects, including terms related to environmental protection and conservation. It is closely related to the socio-economic aspect of sustainability and is associated with the U.S. and Africa. The second (Green) represents the largest agronomic trend on SWUA. It includes different crops and agricultural management practices that influence agricultural sustainability and is associated with China and Australia. The third (Blue) represents hydric resources management that follows resource optimization and the balance between the source availability and the satisfaction of the different demands. This trend is associated with the European and Asian regions.
Table 8 shows the five most frequently used keywords by the five most productive countries on SWUA. These terms signify the main hotspots for each of these countries. This analysis permits identification of the different research trends based on the features of each country. In general, all of the countries shared the same keywords, although there are some differences. The U.S., Australia and Germany displayed differences only on one keyword. The U.S. and Germany had the same keywords, while Australia included the name of the country among the most used keywords and did not include Water-Supply. For China and India, the most repeated keyword was the name of its country itself. China is the only country that included Water-Resources and the country that gave less importance to Water-Management and Sustainability. Chinese works were focused on water availability and water use efficiency. India was the only country that did not include Irrigation, but it was focused on the sustainable management of water use and its efficiency.
In order to verify underlying trends, 432 articles from China and 181 from India have been studied. It has been proven that 91.7% of the Chinese articles focus on domestic issues as well as 83.6% of the Indian ones. This highlights the fact that Indian and Chinese authors concentrate almost exclusively on domestic issues.

 ,
, 


