Abstract
The assessment of the impact of European Structural and Investment Funds (ESIF) on Portuguese local government and which factors determine it is important given the magnitude of funds involved. As part of this larger question, this paper considers whether the holistic sustainability of local authorities—as measured by a Council Sustainability Index—can influence the impact of ESIF on the performance of Portuguese councils and which factors best explain these performance differences. Using a geometric distance function jointly with the Hicks-Moorsteen index, we investigate and present a conclusion on the differential impact of ESIF on sustainable and non-sustainable Portuguese councils over the period 2000 to 2014. Our findings also suggest that ESIF should continue fostering economic and social development at the local level regardless of council size or regional location since overall development will flow from this economic and social structural adjustment strategy.
1. Introduction
As in many European countries, Portuguese local government is responsible for major public investments, as well as for a wide range of local services. They deal with a range of public policy issues and functions that support economic development and improve the quality of life [1]. Local council performance is thus especially important in an era of economic uncertainty and increasing complexity [2]. Moreover, performance measurement and benchmarking in local government help to align the goals of governments with the goals of citizens [3]. Portuguese councils play a pivotal role since they are responsible for almost 30% of total investment, 15% of public employment, and 3% of public debt [4].
The European Structural and Investment Funds (ESIF), established in 1986, plays a crucial role in the economic and social development of Portugal, especially at the local level. An important question in this regard hinges on determining whether ESIF have resulted in significant improvements in municipality performance and in the quality of life of residents. A thorough survey on the 308 Portuguese councils over the period 2000 to 2014, corresponding to the two final European Structural and Investment Funds (ESIF) (ESIF III and National Strategic Reference Framework (NSRF)), identified those aspects of EU programs which improved the performance and sustainability of Portuguese local government, namely competitiveness, territory development, and education factors [5]. Moreover, it highlighted the significance of this impact given the context of major productivity divergences between countries [6] and increasing political integration to guarantee, in the medium term, economic and social cohesion between all European Countries [7].
By contrast, council size and regional location had no direct influence on performance. However, development “catch up” and “growth convergence” seemed significant [8].
In view of previous analysis, the current research analyzes the impact of the ESIF on the 308 Portuguese councils for the period 2000 to 2014 [9]. In an empirical contribution to existing literature on this question, the paper investigates whether the holistic sustainability level of Portuguese local councils influenced that uneven impact. Put clearly, do significant differences exist between sustainable and non-sustainable councils with respect to the impact of EU funding programs? Using a rigorous model embodying a geometric distance function (GDF) and the Hicks-Moorsteen Index (HMI), we investigate the different impact of ESIF on sustainable and non-sustainable Portuguese councils.
We have reached some interesting conclusions: first, for both EU programs, the difference in the investment impact was not significant regardless of whether a council exhibited higher or lower levels of sustainability, notwithstanding the importance of the EU programs to the structural adjustment of the Portuguese economy. Second, the size and regional location of local authorities seem to have no direct influence on the impact of EU investments. Finally, we found that both efficiency and productivity are higher on ESIF III (2000–2006) than under NSRF (2007–2013)—for sustainable and non-sustainable councils alike—because of the stronger effects of ESIF III on the economic and social circumstances of residents, including increased competitiveness, spatial development, and the human potential of individual councils and specific regions.
The paper is divided into six main sections. Section 2 considers the ESIF contribution to Portuguese local authority performance and sustainability. Section 3 presents a holistic sustainability perspective of local government evaluation by means of a new Council Sustainability Index (CSI), which was recently applied to Portuguese local government. Section 4 outlines the model used to test different council investment impacts based on sustainability. Section 5 analyzes the Portuguese council EU program impact on key performance and sustainability indicators, distinguishing between sustainable and non-sustainable councils for ESIF III (2000–2006) and NSRF (2007–2013). The paper concludes with some brief comments in Section 5.
2. European Structural Investment and Funds Impact on Municipal Performance and Sustainability
2.1. European Structural Investment and Funds Impact on Municipal Performance
European structural investment funds (ESIF) represent one of the main instruments which the EU uses to sustain regional development and eliminate disparities between member states [8].
In Portugal, public investment has seen an increase of competitiveness and an improvement in the quality of life made over the past three decades which would have been impossible without ESIF. Table A1 in the Appendix summarizes the ESIF implemented over 1986–2013 in Portugal.
Structural and cohesion programs are implemented under a common regulatory framework, but in widely differing national and regional circumstances. Programs comprise a range of interventions, targeting physical infrastructure, economic development, human resources, innovation, and technology, as well as environmental improvement, through a mix of financial instruments and many different types of beneficiary. In addition, there is also co-financing of EU funds through national public or private funding which originates from several different organisations and schemes [10].
EU cohesion policy effects have been considered mainly by empirical work on the investment impact on citizens’ economic and social conditions, regional growth, and global convergence. Table 1 provides a synopsis of empirical research to date.

Table 1.
Research literature on EU investment impact and economic and social convergence.
Using cross-sectional regressions, Sala-i-Martin [11] found that regional growth and convergence patterns in the EU were not markedly different from those in other federations which lacked such an extensive cohesion program. Several other authors, including Boldrin et al. [13], Ederveen et al. [15], Cappelen et al. [16], Beugelsdijk and Eiffnger [17], Dall’erba and Le Gallo [18], Fritsche and Kuzin [19], and Bartkowska and Riedl [20], using different parametric and non-parametric methods, empirically examined ESIF expenditure and GDP per capita growth, with inconclusive results about growth convergence, but almost all of them highlighted the importance of institutional capacity, as demonstrated above.
Delhey [12] analysed Ireland, Greece, Portugal, and Spain, concluding that EU integration facilitates processes of catching up but it does not guarantee them. This was demonstrated by using three indicators: (1) GDP per capita adjusted for purchasing power; (2) social security spending in relation to GDP (proxing the level of social protection); and (3) citizen satisfaction with life in general and living conditions. In general, EU policy aims to improve economic and social conditions, as well as life circumstances in a broader sense, using a wider perspective by employing quality of life concepts [21,22].
Atkinson et al. [14] measured specific social outcomes in EU member states, suggesting various extensions and alternatives to existing EU indicators for social inclusion (distribution of income, social transfers, regional disparities, persistence of poverty, unemployment, and educational rate), including housing, health, access to essential services, and social participation.
Borsi and Metiu [8] concluded that economic “catch up” exists, but it depends on institutional changes and macroeconomic adjustment. They did not find any overall economic convergence, but instead distinct sub-groups of countries which converged to different steady states. The main conclusion of this study is that EU cohesion policy contributes to improving development in different EU countries, but in a varied way, based on differences in community budget, institutional capacity, the structure of national economies, and the kind of investments chosen.
To sum up, the findings synthetically presented above demonstrated that the “Catch-up” process is facilitated by EU integration policies, but not guaranteed. Moreover, differentiated EU investment impact and economic and social convergence depend, in most cases, on the “proper institutional capacity” of each country and region to absorb and convert EU programs and funds intervention into economic and social sustainable growth. In Portugal, EU adhesion contributed to economic, social, and cultural openness, perhaps even to a rupture through structural modernization after fifty years of dictatorship in Portugal (until 1974).
2.2. Understanding the Importance of “Holistic” Sustainability
Performance assessment is nonetheless important, because it allows for an effective inter-council comparison in terms of value for money of the service provision on the one hand, and management performance in terms of happiness and community satisfaction on the other hand [23]. Efficiency focuses attention on the inputs and outputs used and produced, whereas effectiveness concentrates on community satisfaction with the council services and investment capacity for sustainable development.
Sustainable development forms a capstone of the approach we advocate for local government. In this scope, Bartelmus [24] presented the foundations of sustainable development, contending that after repeated failure of the International Development Strategies of the United Nations, an alternative development concept was necessary. The World Conservation Strategy was the first to define “sustainable development” by means of conserving living resources [25]. The United Nations later established the World Commission on Environment and Development (WCED) in 1985 to investigate the causes and remedies of development failures. The WCED defined “sustainable development” as a process which meets the needs of the present without compromising the ability of future generations to meet their own needs, thereby joining environmental objectives and economic growth objectives [26].
This general definition of sustainability forms the basis for our local government evaluation approach. Thus, in contrast to the narrow financial viability, community sustainability would embrace wider economic, political, and sociological attributes. In its broader connotation, “holistic sustainability is the ability of a local authority to function effectively over the long term” [27].
In Europe, several conceptual frameworks or methods to develop local sustainability indicators have been carried out (for an overview of similar projects, see Pires et al. [28]).
Key financial performance indicators, ratios, and indexes are only broadly indicative of the real situation of individual councils. Local government sustainability should be assessed in a broader perspective, in terms of a council’s ability to perform effectively over the long term and the satisfaction of community interests, as presented below in Table 2 [23].
Table 2.
Different holistic sustainability definitions.
The concept of local government sustainability is indeed much broader than simple financial sustainability. Communities or “holistic” sustainability really matters concerning local government evaluation [36].
Councils currently compete for practical and tangible issues, such as financial resources and new investments. However, financial and investment decisions, transparency, corruption control, and public participation and satisfaction gained an objective pathway and a trustful local government assessment tool.
Therefore, a fresh approach, conceptualizing and implementing a Councils’ Sustainability Index (CSI), is required to address the problems of strategic management, in addition to funding and sustainable development in local government.
2.3. A Portuguese Council Sustainability Index (CSI)
The development and application of a new CSI to Portuguese local government represented an important step forward in improving the informational basis for future policymaking.
The CSI constructed by Caldas et al. [23] developed weighted evaluation criteria in conjunction with a range of stakeholders, including municipal officeholders and empirical experts on local government. Four major aspects of council sustainability were combined (governance, government effectiveness, economic and social development, as well as financial sustainability) containing 25 specific criteria. Figure 1—the “value tree”—summarizes all the elements comprising the CSI, together with their respective weights [23]. Caldas et al. argued that their CSI approach, which was applied to Portuguese local government, can be employed for the evaluation of any local government system mutatis mutandis [37].
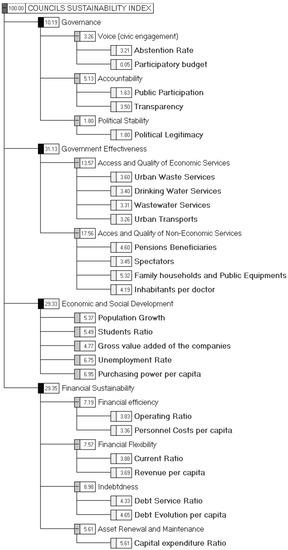
Figure 1.
CSI Value Tree with CSI weights (source: [23]).
Several dimensions of local government are aggregated in CSI using a Multi-criteria Decision Analysis model, encompassing council management, stakeholders, and community objectives. Integrating different stakeholders’ interests contributes to an accurate evaluation of council sustainability, needs, and performance, and provides guidelines for better local government decision-making. Alternative methods (e.g., direct scoring methods or other probabilistic, empirical, and knowledge-based techniques) would have resulted in failure of the main goal of this investigation (i.e., to determine overall assessment of Portuguese local government performance and sustainability).
It is important to recognize, however, that the CSI model possesses various limitations, requiring further attention. While this paper considered financial sustainability, governance, and sustainable development, other variables could also be assessed (or weighted in a different manner) to measure “holistic sustainability”. Additionally, the prospect of applying the CSI beyond Portugal is important from a policy perspective. The crucial issue on this matter is that institutional framework and contextual information of the region/country analyzed is imperative to determine the most adequate DMG, as well as the variables selection. Consideration of different forms of governance and different local modus operandi should determine a customized CSI. This could address different institutional realities. We would, then, be able to compare holistic sustainability ratios and local government performance. Simultaneously, we could assess the effectiveness of CSI format to evaluate local government performance and sustainability worldwide.
Table A2 and Table A3 in the Appendix detail the most sustainable councils (best 10% of performers) and non-sustainable councils (worst 10% of performers), respectively. These groupings form the two different clusters examined in this paper with respect to EU funding program impact. Considering decile (top and bottom line of CSI), rather than, for example, quartile, allowed us to catch more significant differences on the level of council sustainability, based on financial and non-financial factors. Thus, this option allowed a clearer distinction of the potential capacity each council might have for investments and funds absorption and development (conceiving that a priori top sustainability predetermines higher EU impact and bottom sustainability lower EU impact).
3. Methodological Considerations
The methodology employed in the present study follows Ferreira and Marques [38]. Consider a council whose performance relative to a set of different groups (or clusters) is being assessed. Because one should compare likes with likes, those authors proposed a three-cycle Monte Carlo procedure to search for comparable potential benchmarks (best practices) in the different clusters. This procedure avoids the endogeneity problem, which can be very serious. Gaps between achieved benchmarks disentangle potential frontier shifts, and efficiency spreads. The former discloses which cluster is the most productive, whereas the latter reflects the consistency of the efficiency levels of each group. Hence, Ferreira and Marques [38] augmented the radial HMI to account for any inefficiency source and benchmarking adopted model. The new index of productivity HMI was, then, coupled with the three-cycle Monte Carlo procedure to obtain a large set of efficiency estimates and, for that reason, if offers robust and statistical tools for efficiency and productivity analysis. The framework is summarized in Figure 2 and detailed hereinafter.
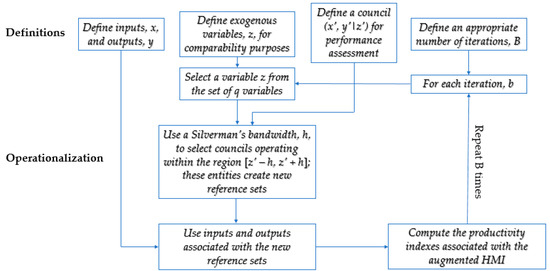
Figure 2.
Summary of the Monte-Carlo procedure for efficiency and productivity assessment of clusters.
In general, empirical studies rely either on parametric or nonparametric methods, creating full frontiers. In other words, entire samples are considered in these analyses. However, and regarding nonparametric methods—data envelopment analysis (DEA) and free disposal hull (FDH) [39]—full frontiers are particularly prone to the presence of outliers, extreme values, and the curse of dimensionality, which biases the results by overestimating the extent of inefficiency. The adoption of partial frontiers, like order-m and order-α [40], seems to be more appropriate for (in) efficiency assessment in local government since they are less sensitive to these effects. Furthermore, the advantage of GDF-HMI is that it is a true measure of the total factor productivity and it is model-free because it is defined by means of targets (instead of direct measures of efficiency, like Shephard’s radial distances). Thus, any model able to compute efficient targets can be utilized with GDF-HMI. One example of such a model is the directional order-α, as mentioned.
After a cluster has been selected as the reference, say A, we then seek comparable decision-making units (councils) in another cluster, say B. Comparability is based on a set of variables, like demographic variables, the scope of services, and the like. In the present context, we use a single variable: population size. Statistical robustness is ensured through bootstrapping iterations (15,000 iterations in our case) (see Ferreira and Marques [38] for details of this procedure).
It is important to distinguish between the two main performance measures: efficiency and productivity.
Definition 0 (Efficiency and productivity).
Consider two groups (clusters) of councils, whose performance is being assessed. Each group has a specific frontier characterizing its underlying production technology. Benchmarks (or best practices) of each technology are placed onto the corresponding frontier. Thus:
- Efficiency focuses on the relative position of the councils from a group with respect to their own corresponding frontier; the more below the frontier, the more inefficient these councils.
- Productivity concerns the relative position of both frontiers (i.e., technologies); one cluster is more productive than the other if the former benchmarks can produce more outputs with fewer inputs than the best practices of the other group [41]. Let us consider two clusters, A = {non-sustainable councils} and B = {sustainable councils}, as achieved through the CSI approach (vide supra). Each cluster is totally characterized by a set of m inputs (consumed resources), Xi, i = 1…, m, and s produced outputs (goods and/or services), Yr, r = 1, …, s. Suppose these clusters have sizes and , respectively. These councils are responsible for the production process, say and , and at the same time they face a set of q exogenous variables, Zp, p = 1, …, q. Some of those councils are more efficient than the others in the very same cluster. The Pareto-efficient councils are placed in the efficient frontier (or technology), and , which in turn can be constructed via non/semi-parametric tools, such as data envelopment analysis (DEA)-like methods. Now, consider a single council0 from a specific cluster, say A, and denote it by . We intend to achieve its targets on the frontier of another cluster, say B. is the set of m+s targets of council0 with respect to the frontier of that cluster, , and is a directional vector controlling for the direction in which council0 is projected on . Targets can be pre-defined or empirically determined. In the latter case, if DEA-like methods are employed, a linear combination of (at least, one) Pareto-efficient councils in is used to compute . Assessing these values assumes a prominent role in Ferreira and Marques’ approach, as shown later. The next subsection describes how these targets can be computed through a very robust semi-parametric frontier-based method.
Assessing Targets.
This paper adopts the bidirectional order-α (BDO-α) method, as introduced by Daraio and Simar [42]. Unlike standard DEA programs, BDO-α is less sensitive to outliers, extreme values, and the so-called curse of dimensionality, which results from many variables (either inputs or outputs) alongside a very low number of councils. It constructs an empirical nonconvex frontier by fixing the value of 1–α, which measures the probability of observing points above that frontier. These points are likely outliers or extreme values. Another advantage of this method (over its standard input- and output-oriented versions) is that it allows both input contraction and output expansion following the direction path defined by .
Hypothesis 1(H1) (Parameters).
In this study, we select α = 0.99, i.e., assuming the existence of 1% of potential outliers. Furthermore, is adopted. This choice of directional vector imposes that the input contraction and output expansion occur at the same rate.
Definition 1 (BDO-α).
Consider the transformation [42], and the equation:
where is the indicator function. Let us denote by the th order statistic of the councils, such that . The radial order-α based distance of council with respect to is given as follows:
Council is technically efficient regarding the α-level frontier of , say , if . It is technically inefficient if and super-efficient if . Targets of council are, then, computed through Equation (3) [because of Hypothesis 1].
where . Mutatis mutandis, it is easy to obtain the targets of councils in A with respect to the frontier of B, and vice-versa.
Assessing the Relative Performance of Clusters.
This paper uses the decomposition of the Total Factor Productivity (TFP), as proposed by Ferreira and Marques [38], to evaluate the relative performance of a set of four different clusters:
For what follows, let us consider the Definition 2 of TFP between two councils. Definition 1 and Hypothesis 1 will be employed henceforth. From Definition 1, we can state that when council2 (read sustainable councils) is more productive than council1 (read non-sustainable councils). Furthermore, this TFP formulation is decomposable into several terms, see Definitions 3 up to 6.
Definition 2 (TFP).
The total factor productivity (TFP) between two councils, and is defined by , with and .
Hypothesis 2(H2) (TFP).
If both and functions are the geometric mean of their own arguments (vectors), then the previous measure of TFP is multiplicatively complete [25], i.e., it confirms the axioms of positivity, continuity, monotonicity, homogeneity, identity, commensurability, and reversal property. The TFP is then given by the following equation [43]:
Now, let us define a function, , which aggregates the values of the -sized vector . If the vector is, for instance, the ith vector of inputs targets of all the councils from with respect to , then its aggregation is simply . Suppose that is the geometric mean. Then, . TFP is decomposable into three main terms: efficiency spread, technology gap, and returns-to-scale. Their aggregated versions are defined as follows, which provides an overview of the relative performance of clusters.
Definition 3 (Efficiency spread, ES).
Let us consider two directional vectors, and , where is a positive non-Archimedean number (as small as possible, say ). Using these vectors, we can employ Equations (1)–(3) for targets assessment. In view of that, Equation (5) is a measure of the efficiency spread of the two clusters. Particularly, the technical efficiency of councils from cluster B is, on average, higher than the one of councils from A (with respect to their own frontier) if and only if . No technical efficiency differences are expected whenever .
Definition 4. (Technological gap, TG).
There is a technological gap (TG) between two technologies, and , if one of them can produce more outputs with fewer resources than the other one. Considering the same directional vectors as in Definition 3, is more productive than if its benchmarks consume fewer resources than the ones in , i.e., , and/or those benchmarks produce more goods/services than their counterparts from , i.e., . Additionally, . Thus, when is more productive than , being:
Definition 5 (Returns-to-scale, RTS).
The returns-to-scale (RTS) index measures how close councils are from their own most productive scale size (MPSS), when compared to other councils from another cluster. Councils from B are closer to their own MPSS than councils in A if and:
Hypothesis 3(H3) (Aggregating function).
This paper adopts the geometric mean as the aggregating function, i.e., .
Definition 6 (HMI).
Based on Hypothesis 3, the HMI [44] is a true measure of TFP, can be computed by means of Equation (4), and it is multiplicatively decomposable into the terms , , , and [38]. In other words, the product of Equations (5)–(7) returns the aggregated version of Equation (1).
4. Empirical Evidence on Impact of EU Programs on Portuguese Councils
4.1. Portuguese Local Government
Portuguese local government is composed of administrative regions, local councils, and civil parishes, with local authorities responsible for delivering local public services to residents. Council responsibilities are regulated (Law 75/2013 of 12 September 2013) and are diverse: rural and urban infrastructure, energy, transport and communication, education, local assets, culture and science, leisure and sports, health, social welfare, housing, civil protection, water supply, wastewater and urban waste, consumer protection, development promotion, planning, local police and, finally, intergovernmental relations [45]. Councils can cooperate with each other through various institutional arrangements and are free to choose governance structures for local public service production and provision [46].
As we can see from Figure 3, most of the Portuguese councils are small (185) and medium size (99) in terms of population and thus size may be an important determinant of council administration and technical capacity. The average size is 34,500 inhabitants—aligned with the European Union average—and councils are located unevenly by region [4].
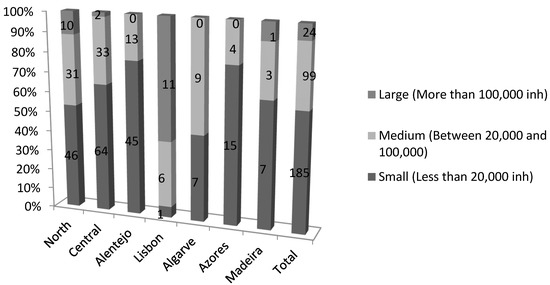
Figure 3.
Portuguese councils’ size by population and region.
Table 3 presents weighting of local functions in Portugal and EU average. Most of municipal expenditure is spent on General Functions (36%), Other (26%), and Economic Activity (22%), as opposed to EU Average at 24%, 15%, and 12%, respectively.
Table 3.
Weight of local functions in Portugal relative to European Union (EU) average.
4.2. Does High Sustainability Means High EU Investments Performance?
Our main hypothesis holds that the impact of ESIF, ESIF III (2000–2006), and NSRF (2007–2013) on key performance and sustainability indicators for Portuguese sustainable councils and non-sustainable councils was varied. The research period was between 2000 and 2014 (i.e., 15 years) and covered the most sustainable and the least sustainable Portuguese councils.
Council investment and funds data for each year of the research period were collected from the National Agency for Development and Cohesion (NADC), which is the entity responsible for the management and evaluation of the Portuguese execution of EU cohesion funds. Moreover, council key performance and sustainability indicators data for each year of the research period were collected from the National Institute of Statistics.
The analysis considered the variables presented in Table 4, in view of the type of investment/funds and the three main thematic objectives of EU programs: competitiveness factors, territory development, and human potential.
Table 4.
Variables description and references (2010—ESIF III and 2015—NSRF).
Clusters.
This paper used the following clusters:
- A—Non-sustainable councils, ESIF III
- B—Sustainable councils, ESIF III
- C—Non-sustainable councils, NSRF
- D—Sustainable councils, NSRF
The clusters result from the application of the CSI to the 308 Portuguese councils and the specific councils that integrate each cluster—which are provided in Table A2 and Table A3 in the Appendix—distinguishing between sustainable councils (best 10% performers) and non-sustainable councils (worst 10% performers).
Research hypotheses.
We considered the following research hypotheses:
- H1: Sustainable councils are more efficient than non-sustainable councils.
- H2: Sustainable councils are more productive than non-sustainable councils.
- H3: Worst/best performers in NSRF are more efficient than the worst/best ones under ESIF III.
- H4: Worst/best performers in NSRF are more productive than the worst/best ones under ESIF III.
- H5: Worst/best performers in NSRF are more efficient than the best/worst ones under ESIF III.
- H6: Worst/best performers in NSRF are more productive than the best/worst ones under ESIF III.
By testing differentiated efficiency and productivity, these hypotheses’ cover councils’ higher/lower sustainability level is based on four specific broad dimensions—governance, government effectiveness, economic and social development, and financial sustainability—as well as including the ESIF III and NSRF characteristics considered earlier. This allows for differential council behaviour in each period.
4.3. Results
Table 5 is provided to assist readers in the following discussion of the study findings. Table 6 provides the comparison between sustainable and non-sustainable councils covering both EU Programs (ESIF III and NSRF). From these results, we can observe that sustainable councils are indeed more efficient than councils that have been considered as non-sustainable on the CSI. Given this outcome, Hypothesis H1 cannot be rejected at the 95% confidence level. It is important to note that differences in terms of technical efficiency are clearer in ESIF III than in the NSRF. Nevertheless, in none of these scenarios were productivity gaps statistically meaningful, as predicted by the Hicks-Moorsteen index, which is a measure of total factor productivity (see Definition 6). In other words, Hypothesis H2 is rejected. This results from the non-existence of significant technology gaps between clusters. In other words, benchmarks from both worst and best council clusters (in terms of the CSI-related sustainability) can produce similar amounts of outputs accounting for comparable levels of inputs. As to the returns to scale, the best councils with respect to sustainability seem to be closer to their optimal (most productive) scale size than the worst ones under the ESIF III program. It is no longer true under NSRF that both best and worst councils share similar positions regarding their own most productive scale size. It seems there was a convergence of councils through time regarding their scale efficiency.
Table 5.
Definitions of the productivity indexes.
Table 6.
Comparison between sustainable and non-sustainable councils, in both ESIF III and NSRF scenarios. (Expected values, 95% confidence intervals, and comments).
Table 7 compares the efficiency and productivity results for the ESIF III and NSRF clusters. The transition from ESIF III to NSRF has promoted a slight decrease (2–3%) of technical efficiency in both the worst and best councils. This can be seen in the confidence intervals of ES ** in the second and the fifth columns of Table 5. The interval upper bound is lower than 1; thus, clusters A and B exhibit lower efficiency spreads (higher consistency) than C and D, respectively. Put differently, Hypothesis H3 is rejected at the 95% confidence level. This transition has also seen a poorer utilization of resources for comparable levels of produced goods/services. According to the values of both RPAC and RPBD, on average, benchmarks from NSRF-based clusters consume about 4–6% more resources than their counterparts in ESIF III-based groups, for the same amounts of outputs. Since no differences on the output-based index, GPAC and GPBD, have been detected (i.e., the corresponding confidence intervals), no technological gaps, TGAC and TGBD, were detected. However, there was a substantial withdrawal from the optimal scale due to the transition of ESIF III-NSRF, as observed by the reduced values of RTSAC and RTSBD. This means that the overall productivity of both best and worst councils concerning sustainability has decreased over time (HMIAC, HMIBD < 1). Since these councils have become less productive, Hypothesis H4 is rejected at the 95% level. Similar and consistent conclusions arise by comparing cluster A with D and B with C. On the one hand, the best councils in NSRF are considerably less productive than the worst councils in ESIF III. On the other hand, the best councils in ESIF III are more productive than the worst councils in the NSRF, which is an expected outcome and discards Hypothesis H6. Accordingly, a circular condition can be observed, in line with both Hypothesis 2 and Definition 6. This condition is illustrated in Figure 4, which encompasses the results shown in Table 6 and Table 7, highlighting in both periods which council group (sustainable and non-sustainable) is more productive.
Table 7.
ESIF III vs. NSRF comparison results (Expected values and 95% confidence intervals).
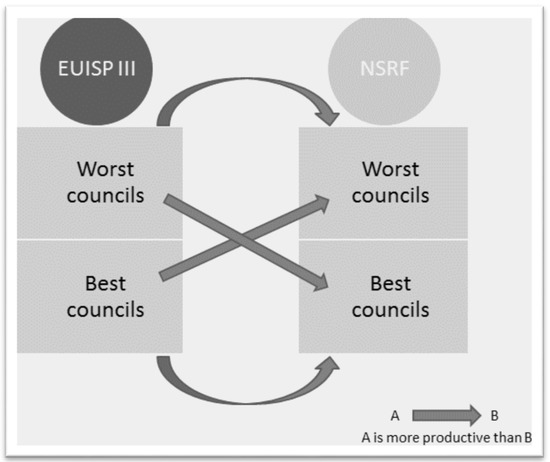
Figure 4.
Productivity relationships between councils’ groups.
5. Concluding Remarks
Established in 1986, the ESIF played a crucial role in the economic and social development of Portugal, especially on the finance provided at the local level. This paper has focused on the differential impact of EU investments and funds programs by applying the CSI, a new local government evaluation model developed by Caldas et al. [23].
The empirical analysis conducted in this paper allows us to draw four major conclusions. In the first place, we found that sustainable councils are more efficient due to sound levels of governance, government effectiveness, economic and social development, and/or financial sustainability. However, they are not more productive than councils which were determined to be non-sustainable under the CSI. In sum, for both EU programs, the difference in investment impact was not significant regardless of whether a council exhibited higher or lower levels of sustainability.
Secondly, the importance of EU programs to the structural adjustment of the Portuguese economy is recognised and continuity of EU cohesion policies seems imperative to guarantee sustainable development.
Finally, we found that both efficiency and productivity are higher on ESIF III (2000–2006) than under NSRF (2007–2013)—for sustainable and non-sustainable councils alike—because of the stronger effects of ESIF III on the economic and social circumstances of residents, including increased competitiveness, spatial development, and the human potential of individual councils and specific regions.
From a policy perspective, our findings suggest that ESIF should continue fostering economic and social development at the local level regardless of council size or regional location since overall development will flow from this economic and social structural adjustment strategy. More generally, we conclude that ESIF strategies have made a positive contribution to Portuguese development contribution whilst respecting the principle of subsidiarity [5].
Further empirical investigation is required on the specific investment impact under the ESIF using different output indicators. In addition, the CSI could be fruitfully applied to council performance and sustainability throughout Europe. Importantly, a new CSI including environmental dimensions should be constructed, a benchmarking exercise should be carried out, and its outcomes should be compared with the ones achieved in the current research.
Acknowledgments
This work was financially supported by UNERA scholarship and by the Portuguese Foundation for Science and Technology (FCT) and the European Social Fund: SFRH/BD/113038/2015. Furthermore, we would like to thank to three anonymous referees who kindly and significantly have improved the paper quality, clarity, and structure, due to their beneficial comments. Any errors are our own responsibility.
Author Contributions
All authors have contributed equally to this paper development. Paulo Caldas collected data and wrote Section 1, Section 2, Section 3, and Section 5; Diogo Cunha Ferreira analyzed data, and performed the experiments, and wrote Section 4 and Section 5; Paulo Caldas and Diogo Cunha Ferreira wrote Section 5; Brian Dollery and Rui Cunha Marques both designed the experiments (case study), reviewed, and made substantial criticisms and changes on the entire manuscript.
Conflicts of Interest
The authors declare no conflict of interest.
Appendix A
Please consider Table A1 and Table A2. The former details the European structural and investment funds within the period 1986 and 2013. The latter presents the 10% best and 10% worst performers (councils) according to the CSI Sustainability Index.
Table A1.
European Structural and Investment Funds (1986–2013).
Table A1.
European Structural and Investment Funds (1986–2013).
| Previous Regulation 1986–1988 (Exclusive Funding of Public Infrastructures) | European Structural and Investment Funds I (1989–1993) | European Structural and Investment Funds II (1994–1999) | European Structural and Investment Funds III (2000–2006) | National Strategic Reference Program—NSRF (2007–2013) | |
|---|---|---|---|---|---|
| Total Investment | 1185 million euros | 4600 million euros | 14,589 million euros | 20,528 million euros | 21,500 million euros |
| Programs—Strategic Axes and Projects | Four Specific Programs—National Program of community interest of incentives to productive activity; specific program for telecommunications (STAR) and energy (VALOREN); integrated operation of the northern development Alentejo Region. | Several territorial and sectorial specific projects. | Axes of intervention: qualify human resources and employment; strengthen the factors of competitiveness of the economy; promote the quality of life and social cohesion; and strengthen the regional economic base. There was also a diversity of programs by sector and region assigned operational interventions. | Four strategic Axes: raise the level of qualification of the Portuguese, promote the employment and social cohesion (about 24% of the public expenditure); change the profile productive towards the activities of the future (20% of public expenditure); affirm the value of the territory and of the geo position of the economic country (10% of the public expenditure); and promote the sustainable development of the regions and the national cohesion (46% of public expenditure). | Three Thematic Programs—operational program of territorial development OPTD; operational program of human potential OPHP; and the program CFOP—competitiveness factors operational Program. Seven Regional Programs, corresponding to each of the regions as part of the mainland and Regions. |
| Major Contributions | Innovative principles of the 1988 Reform: concentration (in a limited number objectives and application to regions whose development is lagging behind), the additionality (community expenditure complemented by national expenditure), the partnership (involvement of all levels of national and community administration and social partners in the preparation and implementation of programs) and programming (refusal of financing of individual projects and their pluri-annual programs and pluri-sectorial framework and, preferably, interregional). The word evaluation appears for the first time. | Notwithstanding the efforts, it was not possible to efficiently mobilize and achieve the corporate sector, in terms of its management and competitiveness. | It fulfilled the objectives of output growth, the employment, real convergence with the other countries of the community, and of convergence between internal regions. High performance and adaptation of the programs to the operating context and social evolution—the increasing economic effectiveness of the structural funds. | Based on the National Plan for Economic and Social Development, the Program outlined the purlins of the medium- and long-term development of Portugal: Atlantic economy border of Europe; privilege of activities, competitiveness factors and technologies more structural dynamic of the global economy; a National Strategy for nature conservation and biodiversity, protection and enhancement of the natural heritage, and enhancement of solidarity and cohesion as regards the social development model. | It surpassed the multiplicity of existing sectorial programs in the EU Investment and Funds Program III and the fact that management should be made through the centralized level of Operational Programs instead of being made, as in the past, at the project level. |
Source: Elaborated by the authors, based on EU Structural Funds Execution Reports.
Table A2.
CSI sustainability results (Top 10% best performers).
Table A2.
CSI sustainability results (Top 10% best performers).
| Sustainable Councils—Best 10% Performers | ||||||||||||
|---|---|---|---|---|---|---|---|---|---|---|---|---|
| Regions | Size | Councils | Global Ranking | Council Position | Governance Ranking | Council Position | Government Effectiveness Ranking | Council Position | Economic and Social Development Ranking | Council Position | Financial Sustainability Ranking | Council Position |
| Lisbon | L | Lisboa | 235.86 | 1 | 5.41 | 173 | 29.54 | 93 | 179.50 | 1 | 21.41 | 241 |
| Lisbon | L | Oeiras | 221.98 | 2 | 6.06 | 146 | 42.80 | 47 | 134.34 | 2 | 38.78 | 117 |
| Algarve | M | Loulé | 177.85 | 3 | 6.61 | 126 | 56.64 | 25 | 20.00 | 62 | 94.60 | 8 |
| North | M | São João da Madeira | 171.22 | 4 | 0.64 | 301 | 56.16 | 26 | 69.77 | 4 | 44.64 | 82 |
| Azores | S | Corvo | 166.12 | 5 | 1.30 | 293 | 21.96 | 134 | −8.00 | 244 | 150.85 | 1 |
| Central | M | Entroncamento | 162.71 | 6 | 6.47 | 134 | 97.23 | 2 | 24.22 | 39 | 34.80 | 148 |
| Central | M | Águeda | 160.14 | 7 | 8.69 | 56 | 86.24 | 5 | 26.82 | 31 | 38.38 | 119 |
| Central | S | Constância | 158.64 | 8 | 8.36 | 73 | 85.46 | 7 | 23.85 | 40 | 40.96 | 98 |
| Alentejo | S | Sines | 150.09 | 9 | 6.34 | 139 | 32.75 | 82 | 65.93 | 5 | 45.07 | 76 |
| Central | S | Figueira de Castelo Rodrigo | 145.27 | 10 | 6.57 | 130 | 9.12 | 212 | −0.70 | 196 | 130.28 | 2 |
| Lisbon | L | Vila Franca de Xira | 141.74 | 11 | 2.82 | 260 | 85.85 | 6 | 25.58 | 34 | 27.49 | 199 |
| North | L | Maia | 140.45 | 12 | 4.70 | 206 | 70.91 | 14 | 36.85 | 14 | 27.98 | 192 |
| North | M | Vale de Cambra | 140.26 | 13 | 8.24 | 75 | 52.86 | 29 | 27.78 | 28 | 51.38 | 53 |
| North | M | Bragança | 139.39 | 14 | 2.36 | 275 | 91.58 | 4 | 12.30 | 98 | 33.14 | 154 |
| Azores | S | Lajes das Flores | 138.27 | 15 | 10.82 | 19 | 17.85 | 166 | −9.20 | 249 | 118.80 | 4 |
| Central | M | Torres Vedras | 138.23 | 16 | 6.38 | 136 | 95.80 | 3 | 22.72 | 45 | 13.33 | 278 |
| North | L | Porto | 136.44 | 17 | 5.88 | 156 | 39.80 | 54 | 58.68 | 6 | 32.09 | 162 |
| Alentejo | S | Vendas Novas | 133.99 | 18 | 3.86 | 236 | 99.67 | 1 | 17.42 | 70 | 13.04 | 280 |
| Central | M | Pombal | 132.74 | 19 | 8.60 | 61 | 39.20 | 56 | 18.15 | 66 | 66.80 | 23 |
| Alentejo | S | Ourique | 129.98 | 20 | 8.98 | 46 | 26.14 | 108 | −4.42 | 222 | 99.27 | 6 |
| North | S | Valença | 127.61 | 21 | 7.81 | 84 | 80.92 | 9 | 8.58 | 120 | 30.30 | 175 |
| Central | S | Oliveira de Frades | 127.30 | 22 | 7.49 | 88 | 19.60 | 152 | 35.68 | 18 | 64.53 | 29 |
| Alentejo | S | Grândola | 127.29 | 23 | 6.21 | 141 | 75.61 | 11 | 14.41 | 81 | 31.06 | 172 |
| North | S | Melgaço | 127.22 | 24 | 5.61 | 166 | 47.43 | 36 | 17.10 | 72 | 57.08 | 40 |
| Algarve | M | Albufeira | 125.33 | 25 | 1.69 | 288 | 38.87 | 58 | 7.06 | 126 | 77.71 | 11 |
| Central | S | Vila Velha de Ródão | 124.03 | 26 | 8.91 | 50 | 36.74 | 67 | 34.89 | 19 | 43.48 | 89 |
| Central | L | Leiria | 123.82 | 27 | 8.91 | 49 | 38.97 | 57 | 34.26 | 21 | 41.67 | 94 |
| Central | M | Viseu | 122.53 | 28 | 8.06 | 79 | 71.46 | 13 | 15.85 | 75 | 27.16 | 201 |
| Central | S | Vouzela | 121.62 | 29 | 8.64 | 58 | 50.74 | 32 | 0.84 | 175 | 61.39 | 34 |
| Alentejo | M | Azambuja | 118.55 | 30 | 6.91 | 109 | 46.76 | 37 | 35.78 | 16 | 29.10 | 185 |
| Central | M | Aveiro | 117.65 | 31 | 5.02 | 193 | 74.93 | 12 | 40.99 | 9 | −3.29 | 293 |
Table A3.
CSI sustainability results (Top 10% worst performers).
Table A3.
CSI sustainability results (Top 10% worst performers).
| Non-Sustainable Councils—Worst 10% Performers | ||||||||||||
|---|---|---|---|---|---|---|---|---|---|---|---|---|
| Regions | Size | Councils | Global Ranking | Council Position | Governance Ranking | Council Position | Government Effectiveness Ranking | Council Position | Economic and Social Development Ranking | Council Position | Financial Sustainability Ranking | Council Position |
| Algarve | S | Vila Real de Santo António | −898.68 | 308 | 6.36 | 138 | 45.41 | 41 | 4.00 | 155 | −954.45 | 308 |
| North | S | Alijó | −289.57 | 307 | 4.05 | 227 | −42.28 | 297 | −6.76 | 238 | −244.59 | 307 |
| Alentejo | S | Mourão | −131.47 | 306 | 5.10 | 190 | −61.12 | 304 | −39.06 | 305 | −36.40 | 298 |
| Central | S | Góis | −103.42 | 305 | 6.66 | 125 | −147.61 | 308 | −2.94 | 215 | 40.47 | 104 |
| North | S | Freixo de Espada à Cinta | −76.70 | 304 | 5.78 | 160 | −5.16 | 264 | −20.70 | 290 | −56.62 | 301 |
| North | S | Santa Marta de Penaguião | −76.38 | 303 | 10.02 | 27 | −100.17 | 305 | −27.52 | 299 | 41.29 | 95 |
| Central | S | Ferreira do Zêzere | −75.78 | 302 | 8.68 | 57 | −134.41 | 307 | 11.11 | 106 | 38.84 | 116 |
| Madeira | M | Santa Cruz | −66.80 | 301 | 6.79 | 118 | 29.69 | 92 | −0.09 | 188 | −103.18 | 306 |
| North | M | Chaves | −44.63 | 300 | 5.43 | 172 | 33.48 | 79 | −2.58 | 213 | −80.97 | 304 |
| Central | S | Celorico da Beira | −43.30 | 299 | 3.81 | 240 | −112.24 | 306 | −1.86 | 204 | 66.99 | 22 |
| North | S | Alfândega da Fé | −40.46 | 298 | 15.41 | 1 | 11.03 | 203 | −26.55 | 295 | −40.35 | 299 |
| Alentejo | S | Gavião | −27.92 | 297 | 4.88 | 197 | −59.80 | 302 | −15.42 | 278 | 42.42 | 92 |
| Azores | S | Nordeste | −27.29 | 296 | 9.47 | 38 | 6.06 | 226 | −7.99 | 243 | −34.84 | 296 |
| Central | S | Idanha-a-Nova | −26.72 | 295 | 4.55 | 210 | −36.58 | 294 | −17.30 | 283 | 22.62 | 234 |
| Lisbon | L | Seixal | −24.90 | 294 | 1.15 | 297 | 17.49 | 169 | 13.17 | 90 | −56.71 | 302 |
| Central | S | Cadaval | −24.87 | 293 | 1.58 | 290 | −51.80 | 301 | 9.07 | 119 | 16.28 | 265 |
| Madeira | S | Santana | −19.69 | 292 | 3.82 | 238 | −60.78 | 303 | −14.01 | 271 | 51.28 | 55 |
| North | S | Vinhais | −19.02 | 291 | 8.69 | 55 | −33.34 | 292 | −24.16 | 294 | 29.79 | 179 |
| Madeira | S | Ponta do Sol | −16.50 | 290 | 0.68 | 300 | −40.37 | 296 | −13.30 | 268 | 36.48 | 132 |
| Central | S | Pedrógão Grande | −13.57 | 289 | 4.83 | 203 | −47.10 | 299 | −6.64 | 234 | 35.33 | 141 |
| Algarve | S | Alcoutim | −13.13 | 288 | 8.54 | 65 | −16.07 | 280 | −6.79 | 239 | 1.18 | 292 |
| North | M | Vizela | −12.61 | 287 | 11.07 | 16 | 39.92 | 53 | 10.60 | 110 | −74.19 | 303 |
| Central | S | Santa Comba Dão | −12.31 | 286 | 4.34 | 218 | 17.77 | 167 | 1.83 | 167 | −36.25 | 297 |
| North | S | Terras de Bouro | −10.51 | 285 | 3.99 | 230 | −17.47 | 281 | −28.48 | 300 | 31.45 | 170 |
| North | S | Baião | −6.88 | 284 | 11.48 | 13 | −3.86 | 261 | −40.57 | 306 | 26.07 | 214 |
| North | S | Cinfães | −5.73 | 283 | 5.52 | 170 | 6.69 | 222 | −44.10 | 307 | 26.16 | 213 |
| Central | S | Vila Nova de Poiares | −3.35 | 282 | 9.76 | 31 | −14.32 | 279 | 7.02 | 128 | −5.80 | 294 |
| Algarve | M | Faro | −3.01 | 281 | 1.79 | 285 | 57.72 | 24 | 35.74 | 17 | −98.26 | 305 |
| Alentejo | S | Alandroal | −2.66 | 280 | 9.71 | 34 | −11.48 | 275 | −17.94 | 284 | 17.05 | 263 |
| Central | S | Mação | 1.51 | 279 | 9.22 | 42 | −32.86 | 291 | 0.72 | 176 | 24.44 | 221 |
| Alentejo | S | Viana do Alentejo | 5.07 | 278 | 7.56 | 87 | −25.33 | 285 | 1.98 | 165 | 20.86 | 246 |
References
- United Cities and Local Governments. Local Government Finance: The Challenges of the 21st Century; Second Global Report on Decentralization and Local Democracy; United Cities and Local Governments: Barcelona, Spain, 2010. Available online: https://www.citiesalliance.org/sites/citiesalliance.org/files/CA_Images/UCLG_GOLDII_ExecutiveSummary.pdf (accessed on 28 December 2018).
- Devas, N.; Delay, S. Local democracy and the challenges of decentralising the state: An international perspective. Local Gov. Stud. 2006, 32, 677–2007. [Google Scholar] [CrossRef]
- Cruz, N.; Marques, R. Scorecards for sustainable local governments. Cities 2014, 39, 165–170. [Google Scholar] [CrossRef]
- Portugal. Documento Verde da Reforma da Administração Local: Uma Reforma de Gestão, uma Reforma de Território e uma Reforma Política (in Portuguese); Minister of Parliamentary Affairs: Lisbon, Portugal, 2011.
- NADC. European Union Funds; Annual Report 2014; National Agency for Development and Cohesion: Lisbon, Portugal, 2016. [Google Scholar]
- Monfort, M.; Cuestas, J.C.; Ordonez, J. Real convergence in Europe: A cluster analysis. Econ. Model. 2013, 33, 689–694. [Google Scholar] [CrossRef]
- Moro, B. Lessons from the European economic and financial great crisis: A survey. Eur. J. Political Econ. 2014, 34, S9–S24. [Google Scholar] [CrossRef]
- Borsi, M.T.; Metiu, N. The evolution of economic convergence in the European Union. Empir. Econ. 2015, 48, 657–681. [Google Scholar] [CrossRef]
- Scipioni, A.; Mazzi, A.; Zuliani, F.; Mason, M. The ISO 14031 standard to guide the urban sustainability measurement process: An Italian experience. J. Clean. Prod. 2008, 16, 1247–1257. [Google Scholar] [CrossRef]
- Bachtler, J.; Wren, C. Evaluation of European Union cohesion policy: Research questions and policy challenges. Reg. Stud. 2006, 40, 143–153. [Google Scholar] [CrossRef]
- Sala-i-Martin, X.X. Regional cohesion: Evidence and theories of regional growth and convergence. Eur. Econ. Rev. 1996, 40, 1325–1352. [Google Scholar] [CrossRef]
- Delhey, J. The prospects of catching up for new EU members lessons for the accession countries to the European Union from previous enlargements. Soc. Ind. Res. 2001, 56, 205–231. [Google Scholar] [CrossRef]
- Boldrin, M.; Canova, F.; Pischke, J.S.; Puga, D. Inequality and convergence in Europe’s regions: Reconsidering European regional policies. Econ. Policy 2001, 16, 205 and 207–253. [Google Scholar] [CrossRef]
- Atkinson, T.; Cantillon, B.; Marlier, E.; Nolan, B. Social Indicators: The EU and Social Inclusion; Oxford University Press: Oxford, UK, 2002. [Google Scholar]
- Ederveen, S.; de Groot, H.L.F.; Nahuis, R. Fertile Soil for the Structural Funds? A Panel Data Analysis of the Conditional Effectiveness of European Cohesion Policy; CPB Netherlands Bureau for Economic Policy Analysis: The Hague, The Netherlands, 2002. [Google Scholar]
- Cappelen, A.; Castellacci, F.; Fagerberg, J.; Verspagen, B. The impact of EU regional support on growth and convergence in the European Union. JCMS 2003, 41, 621–644. [Google Scholar] [CrossRef]
- Beugelsdijk, M.; Eijffinger, S.C. The effectiveness of structural policy in the European Union: An empirical analysis for the EU-15 in 1995–2001. JCMS 2005, 43, 37–51. [Google Scholar] [CrossRef]
- Dall’Erba, S.; Le Gallo, J. Regional convergence and the impact of European structural funds over 1989–1999: A spatial econometric analysis. Pap. Reg. Sci. 2008, 87, 219–244. [Google Scholar] [CrossRef]
- Fritsche, U.; Kuzin, V. Analysing convergence in Europe using the non-linear single factor model. Empir. Econ. 2011, 41, 343–369. [Google Scholar] [CrossRef]
- Bartkowska, M.; Riedl, A. Regional convergence clubs in Europe: Identification and conditioning factors. Econ. Model. 2012, 29, 22–31. [Google Scholar] [CrossRef]
- Christoph, B.; Noll, H.H. Subjective well-being in the European Union during the 90s. In European Welfare Production; Springer: Dordrecht, The Netherlands, 2003; pp. 197–222. [Google Scholar]
- Diener, E.; Suh, E. Measuring quality of life: Economic, social, and subjective indicators. Soc. Ind. Res. 1997, 40, 189–216. [Google Scholar] [CrossRef]
- Caldas, P.; Dollery, B.; Marques, R.C. What really matters concerning local government evaluation: Community Sustainability? Lex Localis J. Local Self-Gov. 2016, 14, 279–304. [Google Scholar] [CrossRef]
- Bartelmus, P. Use and usefulness of sustainability economics. Ecol. Econ. 2010, 69, 2053–2055. [Google Scholar] [CrossRef]
- IUCN, U. World Conservation Strategy: Living Resource Conservation for Sustainable Development; International Union for the Conservation of Nature and Natural Resources (IUCN): Gland, Switzerland, 1980. [Google Scholar]
- Brundtland, G.H. World commission on environment and development. Environ. Policy Law 1985, 14, 26–30. [Google Scholar]
- Dollery, B.E.; Kortt, M.; Grant, B. Funding the Future, Financial Sustainability and Infrastructure Finance in Australian Local Government; The Federation Press: Sydney, Australia, 2013. [Google Scholar]
- Pires, S.M.; Fidélis, T. Local sustainability indicators in Portugal: Assessing implementation and use in governance contexts. J. Clean. Prod. 2015, 86, 289–300. [Google Scholar] [CrossRef]
- Vetter, A.; Kersting, N. Democracy versus efficiency? Comparing local government reforms across Europe. In Reforming Local Government in Europe; VS Verlag für Sozialwissenschaften: Wiesbaden, Germany, 2003; pp. 11–28. [Google Scholar]
- Aulich, C. Australia: Still a tale of Cinderella? In Comparing Local Governance: Trends and Developments; Palgrave Macmillan: Basingstoke, UK, 2005; pp. 193–210. [Google Scholar]
- Dollery, B.E.; Garcea, J.; Lesage, E. Local Government Reform: A Comparative Analysis of Advanced Anglo-American Countries; Edward Elgar: Cheltenham, UK, 2008. [Google Scholar]
- Dollery, B.E.; Crase, L.; Grant, B. The local capacity, local community and local governance dimensions of sustainability in Australian local government. Commonw. J. Local Gov. 2011. [Google Scholar] [CrossRef]
- Bell, S.; Morse, S. Measuring Sustainability: Learning from Doing; Routledge: London, UK, 2013. [Google Scholar]
- Warburton, D. Community and Sustainable Development: Participation in the Future; Routledge: London, UK, 2013. [Google Scholar]
- Wates, N. The Community Planning Handbook: How People Can Shape Their Cities, Towns & Villages in Any Part of the World; Routledge: London, UK, 2014. [Google Scholar]
- Ammons, D. Municipal Benchmarks: Assessing Local Performance and Establishing Community Standards; M.E. Sharpe: Armonk, NY, USA, 2012. [Google Scholar]
- Andrews, M.; Hay, R.; Myers, J. Can governance indicators make sense? Towards a new approach to sector-specific measures of governance. Oxf. Dev. Stud. 2010, 38, 391–410. [Google Scholar] [CrossRef]
- Ferreira, D.C.; Marques, R.C. Malmquist and Hicks–Moorsteen Productivity Indexes for Clusters Performance Evaluation. Int. J. Inf. Technol. Decis. Mak. 2016, 15, 1015–1053. [Google Scholar] [CrossRef]
- Charnes, A.; Cooper, W.W.; Lewin, A.Y.; Morey, R.C.; Rousseau, J. Sensitivity and stability analysis in DEA. Ann. Oper. Res. 1985, 2, 139–150. [Google Scholar] [CrossRef]
- Aragon, Y.; Daouia, A.; Thomas-Agnan, C. Nonparametric frontier estimation: A Conditional quantile-based approach. Econ. Theory 2005, 21, 358–389. [Google Scholar] [CrossRef]
- Ferreira, D.C.; Marques, R.C. Did the corporatization of Portuguese hospitals significantly change their productivity? Eur. J. Health Econ. 2015, 16, 289–303. [Google Scholar] [CrossRef] [PubMed]
- Daraio, C.; Simar, L. Directional distances and their robust versions: Computational and testing issues. Eur. J. Oper. Res. 2014, 237, 358–369. [Google Scholar] [CrossRef]
- Portela, M.C.A.S.; Thanassoulis, E. Malmquist indexes using a Geometric Distance Function (GDF). Application to a sample of Portuguese bank branches. J. Prod. Anal. 2006, 25, 25–41. [Google Scholar] [CrossRef]
- Moorsteen, R.H. On measuring productive potential and relative efficiency. Q. J. Econ. 1961, 75, 451–467. [Google Scholar] [CrossRef]
- Minister of Parliamentary Affairs. Livro Branco do Sector Empresarial Local (in Portuguese); Minister of Parliamentary Affairs: Lisbon, Portugal, 2011.
- Pinto, F.; Da Cruz, N.; Marques, R.C. Contracting water services with public and private partners: A case study approach. J. Water Supply Res. Technol. AQUA 2015, 64, 194–210. [Google Scholar] [CrossRef]
- European Commission. A New Partnership for Cohesion: Convergence, Competitiveness, Cooperation; Third Report on Economic and Social Cohesion; Office for Official Publications of the European Communities: Luxembourg, 2004. [Google Scholar]
- Afonso, A.; Fernandes, S. Assessing and explaining the relative efficiency of local government. J. Socio-Econ. 2008, 37, 1946–1979. [Google Scholar] [CrossRef]
- Troschinetz, A.M.; Mihelcic, J.R. Sustainable recycling of municipal solid waste in developing countries. Waste Manag. 2009, 29, 915–923. [Google Scholar] [CrossRef] [PubMed]
- Caragliu, A.; Del Bo, C.; Nijkamp, P. Smart cities in Europe. J. Urban Technol. 2011, 18, 65–82. [Google Scholar] [CrossRef]
- Ache, P.; Andersen, H.T.; Maloutas, T.; Raco, M.; Tasan-Kok, T. Cities between Competitiveness and Cohesion: Discourses, Realities and Implementation; Springer: New York, NY, USA, 2008. [Google Scholar]
- Sapelli, C.; Vial, B. The performance of private and public schools in the Chilean voucher system. Cuad. Econ. 2002, 39, 423–454. [Google Scholar] [CrossRef]
- Zeller, M.; Sharma, M.; Henry, C.; Lapenu, C. An operational method for assessing the poverty outreach performance of development policies and projects: Results of case studies in Africa, Asia, and Latin America. World Dev. 2006, 34, 446–464. [Google Scholar] [CrossRef]
- Nyhan, R.C.; Martin, L.L. Assessing the performance of municipal police services using data envelopment analysis: An exploratory study. State Local Gov. Rev. 1999, 31, 18–30. [Google Scholar] [CrossRef]
- Benito, B.; Bastida, F. The determinants of the municipal debt policy in Spain. J. Public Budg. Account. Financ. Manag. 2004, 16, 492–525. [Google Scholar] [CrossRef]
- Buettner, T.; Wildasin, D.E. The dynamics of municipal fiscal adjustment. J. Public Econ. 2006, 90, 1115–1132. [Google Scholar] [CrossRef]


© 2018 by the authors. Licensee MDPI, Basel, Switzerland. This article is an open access article distributed under the terms and conditions of the Creative Commons Attribution (CC BY) license (http://creativecommons.org/licenses/by/4.0/).