Article

Identifying the Impacts of Social, Economic, and Environmental Factors on Population Aging in the Yangtze River Delta Using the Geographical Detector Technique

1
School of Geographic Science, Nanjing Normal University, Nanjing 210023, China
2
Ginling College, Nanjing Normal University, Nanjing 210097, China
3
Jiangsu Center for Collaborative Innovation in Geographical Information Resource Development and Application, Nanjing 210023, China
4
Key Laboratory of Virtual Geographic Environment (Nanjing Normal University), Ministry of Education, Nanjing 210023, China
5
International Center for Aging and Health Studies (Nanjing Normal University), Nanjing 210097, China
*
Author to whom correspondence should be addressed.
Sustainability 2018, 10(5), 1528; https://doi.org/10.3390/su10051528
Submission received: 11 April 2018 / Revised: 8 May 2018 / Accepted: 8 May 2018 / Published: 11 May 2018

Abstract

:
Under the background of social transformation and space reconstruction, population aging in China is becoming more and more diverse and complex. “Aging before getting rich”, a notion in population and economic development, has been a serious threat to sustainable development in China. On the basis of town- and street block-scale data from the Fifth and Sixth National Census in the Yangtze River Delta, we studied spatial distribution characteristics of population aging using global Moran’s I and hotspot analysis, and applied the geographical detector technique to explain the spatial heterogeneity of population aging. Several conclusions were drawn. (1) The promotion and replacement of aging coexist. Cluster of aging degree exhibits an increasing trend. Population aging is more severe in suburban areas than urban areas. (2) Migration is the main factor affecting the spatial heterogeneity of population aging. Per capital GDP and road network density are the second most influential factors. By contrast, the relief degree of land surface and the air quality index minimally influence population aging. The mechanisms of aging in various regions are affected by varying development levels. (3) The interaction among social, economic, and environmental factors enhances their effects and, thus, interacting factors have a greater influence on population aging than any single factor. The findings of this study have significant implications for local inhabitants and policy makers to address the population aging challenge in achieving sustainability of society, economy, and environment.

1. Introduction

Population aging in China has changed significantly with the implementation of one-child policy since the 1970s. The proportion of persons aged 60 or over rose from 7.63% in 1981 to 9.43% in 2000, which indicates that China has basically entered aging society from 2000. Data from the Sixth National Census (2010) has also shown that the proportion of individuals who are over 60 years in China is above 13.26%, which is 2.93% higher than its corresponding value in the Fifth National Census (2000) [1,2]. According to Organization for Economic Co-operation and Development (OECD) population forecast, by 2030, China will become the highest-aged country in the world [3]. Under the background of social transformation and space reconstruction, the aging of China is becoming more and more complex. “Aging before getting rich” and “demographic dividend disappeared”, the notion in population and economic development, has been a serious threat to social sustainable development. On the other hand, an aging acceleration significantly affects the urban structure, urban formation, and land use of a city, all of which bring about new challenges for urban planning, especially with regard to the allocation of adequate facilities for an increasing number of elderly people [4]. Under such a circumstance, the aging issue has become a common and fundamental subject for local inhabitants, scholars, and governments all over the world. In the Yangtze River Delta in 2010, as an important economically developed area, the proportion of individuals who were over 60 years was 10.45%, which was significantly higher than the national average. Meanwhile, the Yangtze River Delta is a core area for rapid urbanization. In 2010, the region’s gross domestic product (GDP) increased to 7.07 trillion RMB, accounting for 16.42% of the national total. It is not only an economically developed region but also an area where interaction occurs between nature and humans, which has resulted in various environmental and ecological problems and brought great challenges to regional sustainable development. Rapid socioeconomic development and deterioration of the ecological environment have elicited our attention about the aging process and its driving mechanism, thus accurately identifying the urban agglomeration aging stage. Its pattern has vital theoretical and practical significance in urban and rural China.
Scholars began to study population aging from the fields of sociology, demography, economics, and psychology during the 1980s. They focused on the influence of aging on the economy and society [5,6,7] and old-age security countermeasures [8] from the macro level, and the psychological needs of the elderly [9,10], social support [11,12], and behavioral activities [13,14] from the micro level. As an academic discipline, geographical gerontology is different from the above disciplines. Researchers from fields of social geography, population geography, and gerontology carried out related studies. Studies have included topics such as spatial differentiation of aging [15,16,17], older people access to healthcare [18,19,20], and residential location and spatial behavior of the elderly [21,22,23,24]. The pattern and process of geographical things and their space–time characteristics are scale-dependent. Spatial distribution of aging also varies with scale. Several geographers have studied the spatial differentiations of aging at the international, intercontinental, national, and regional scales [25,26,27,28,29]. For example, Flynn (1980) focused on the regional differences of the distribution of the elderly population and found that the elderly population in the United States was concentrated in the central urban area and remote rural settlements, thereby forming a typical “retirement” center for polarization [30]. Rogerson (1998) investigated the geographical distribution of ethnic minorities and determined that ethnic minorities tended to be more isolated than the non-elderly population from multispatial scales [31]. Smith (1998) studied the agglomeration and segregation of the elderly in urban areas in Canada and found a moderate level of segregation in these areas. However, the following trends were also observed: an increase in the proportion of the elderly living in the suburbs and a decrease in age segregation in the census areas [32]. Somenahalli et al. (2010) conducted hotspot analysis to examine the population distribution in Adelaide, Australia. They confirmed the conclusions of the aforementioned scholars [33].
Scholars have also studied the factors that influence the distribution of the elderly population. However, a possible shortcoming is that the spatial dynamics of aging are mostly determined from a large scale, such as international, intercontinental, and national. However, aging differences include interregional and intraregional. Interregional difference can reflect the heterogeneity of the distribution of population in different regions. After the larger spatial scale is divided into several small scales, more detailed population distribution results can be obtained and the population distribution will show different patterns, which is more favorable for mechanism detection. At present, research on intraregional population differences in a typical area in China remains in its infancy, particularly at the small scale such as town and street block. In terms of research method, scholars used various quantitative models to analyze aging mechanisms. For instance, Lv et al. (2011) performed statistical analysis to determine the spatial pattern of China’s longevity population and its environmental factors [34]. Song (2015) used stepwise regression and geographically weighted regression methods to examine the association between public health outcomes and environmental/social factors [35]. However, research on the influencing factors of aging mainly starts from the economic angle [36]. Only a few articles have considered the impact of environmental factors on aging problems. Under the background of global environmental change, the role of environmental factors in aging is worth discussing. Consequently, a comprehensive understanding of the driving factors from the social, economic, and environmental perspectives of spatial interaction effects is necessary. The geographical detector technique was put forward by Wang et al. (2010) [37]. Its hypothesis is that if an independent variable has a significant effect on a dependent variable, the spatial distribution of the independent variable and the dependent variable should be similar. The geographical detector model can reflect spatial relationships or interactive effects. Both numerical and qualitative data can be detected, which is one of the advantages of geographical detector; another unique advantage is detecting the interaction of two factors on dependent variables [38].
Thus, on the basis of the Fifth and Sixth Census in China, we selected 16 major cities in the Yangtze River Delta as research objects and focused on the spatial distribution of population aging using global Moran’s I and Getis–Ord Gi to determine the spatial distribution of population aging. Then, we applied a geographical detector model to analyze the driving factors of the spatial distribution of regional aging degree from the framework of society, economy, and environment. Under the context of social and economic transformation, as well as global environmental change, the results will contribute to a better understanding of the postsocialist aging spatial mechanism in urban and rural China and provide favorable conditions for the sustainable development of urban and rural areas.

2. Materials and Methods
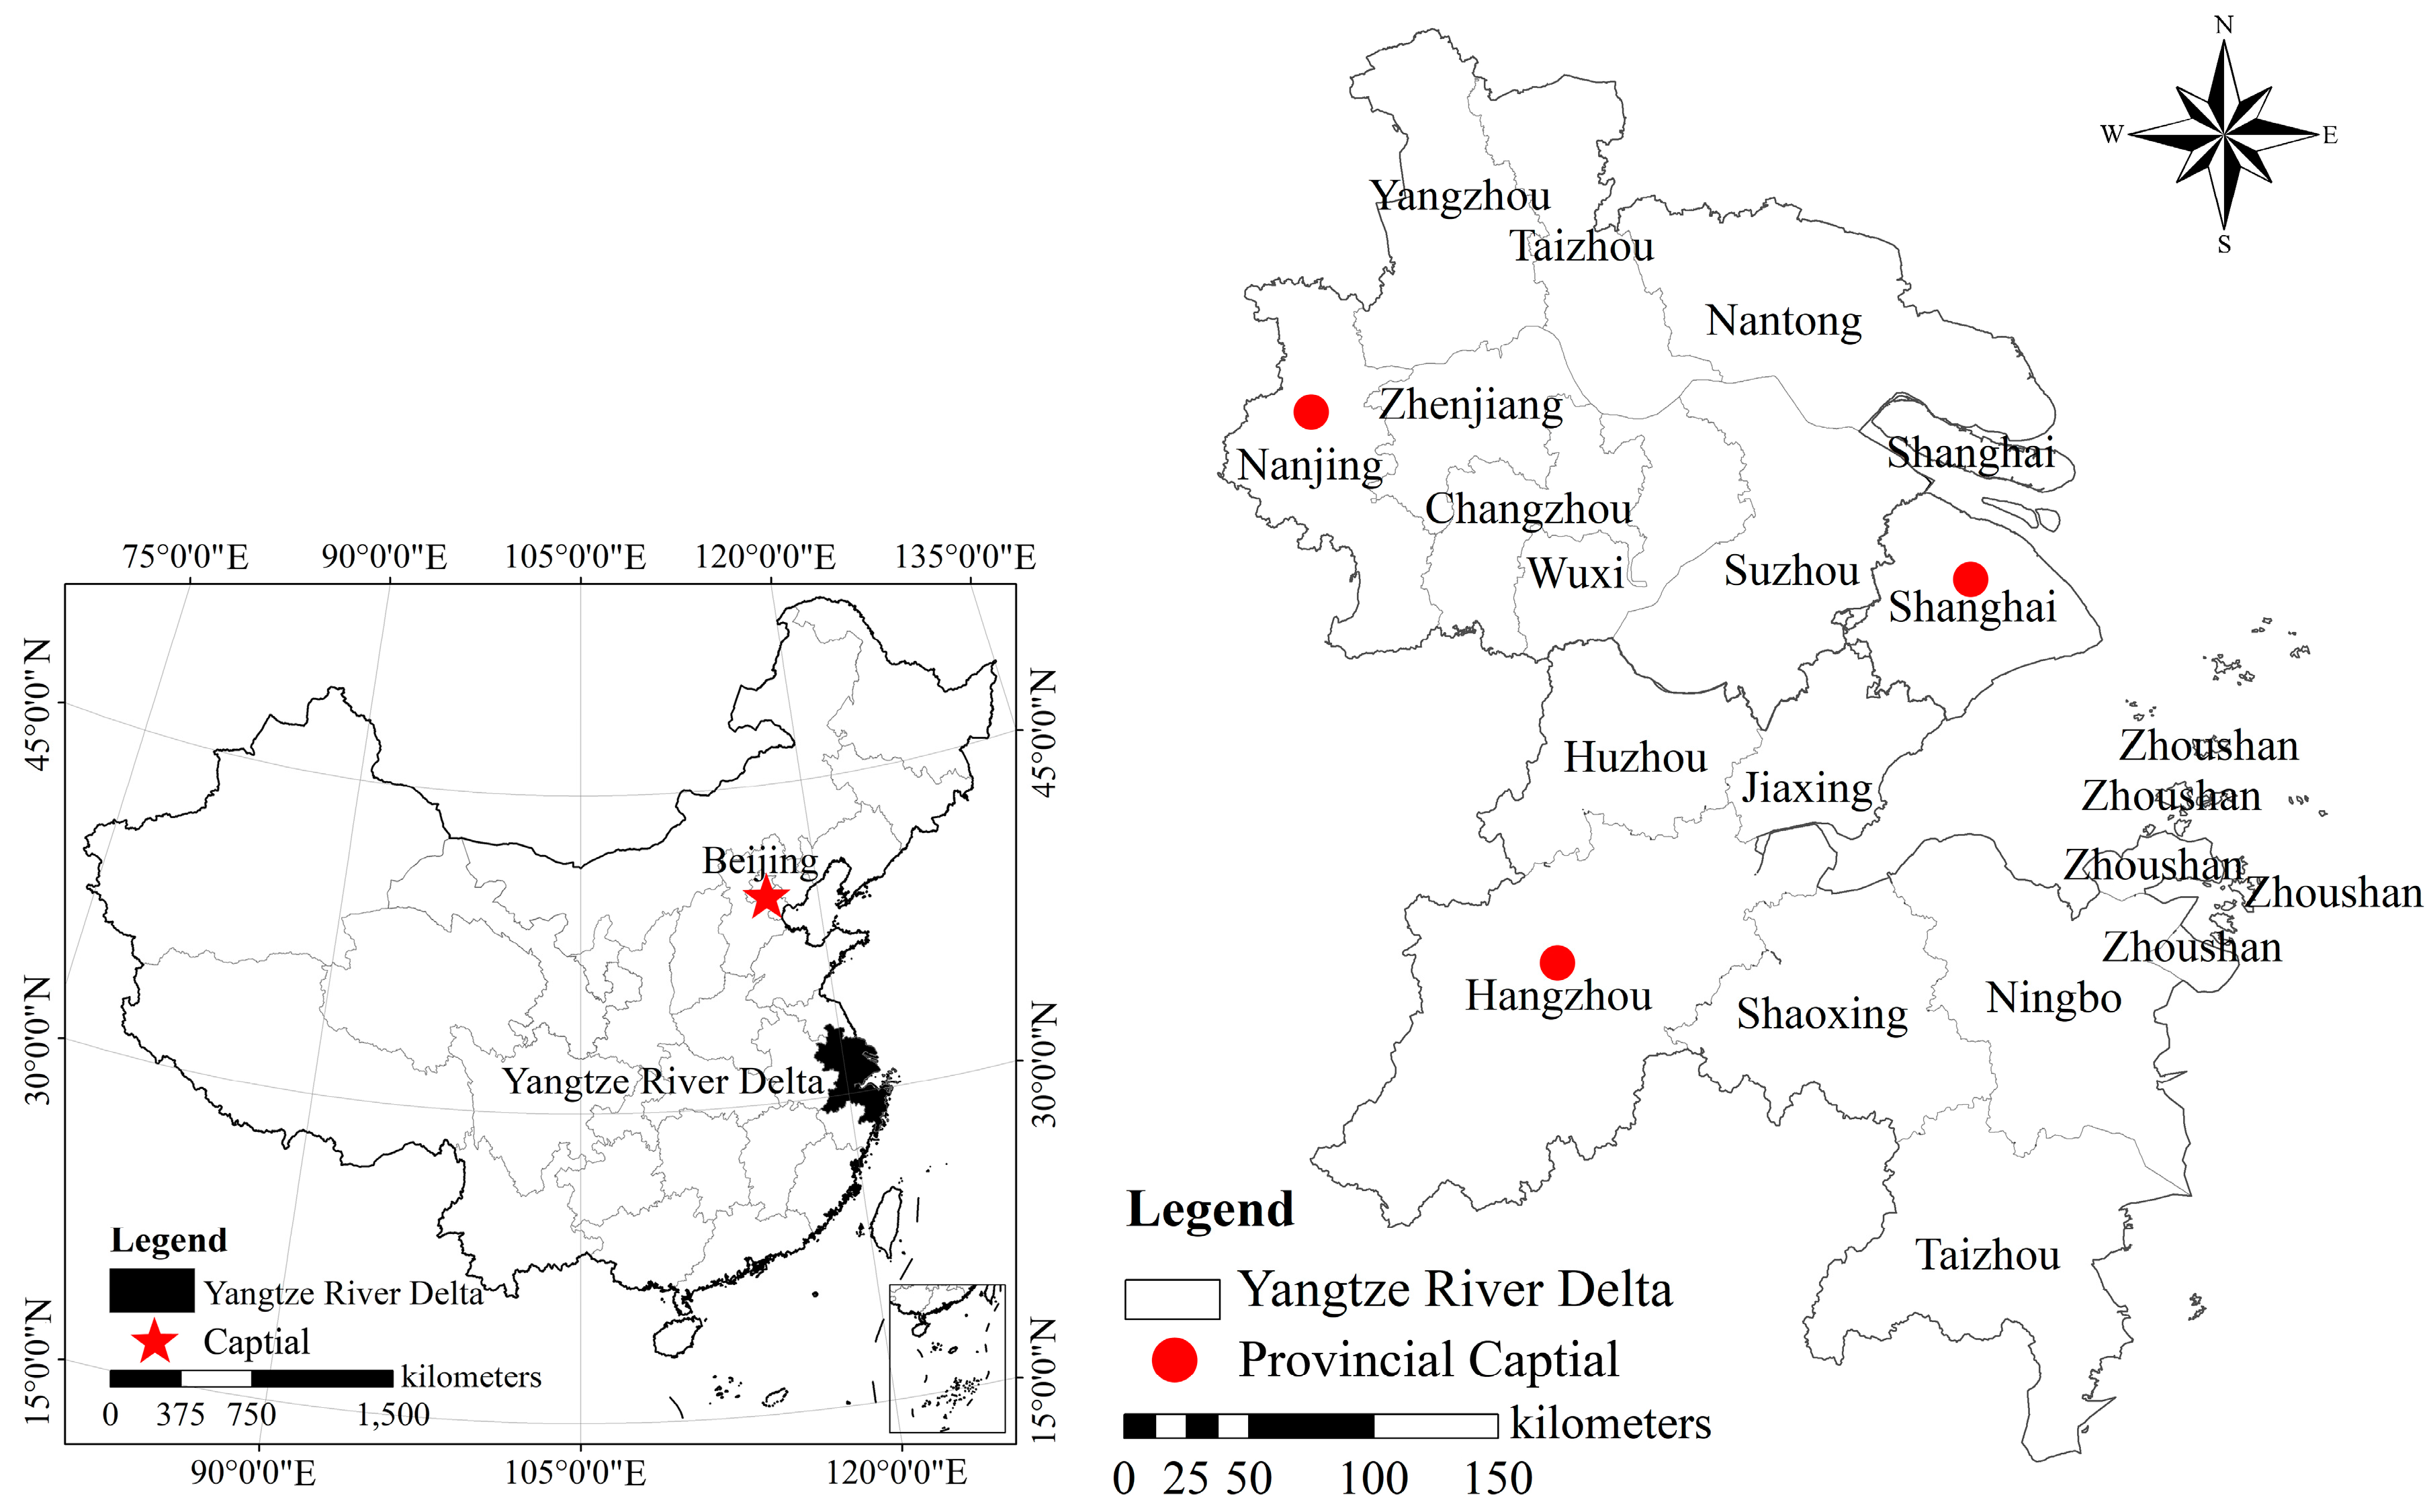
2.1. Study Area

This research was performed in the Yangtze River Delta (118°22′–123°25′ E, 27°01′–32°39′ N), which is located along the eastern coast of China (Figure 1). The Yangtze River Delta has an area of 113,000 km2. It covers 16 cities and 1706 towns and street blocks and has a population of 1.3 billion. Shanghai is the center of the Yangtze River Delta, and the Shanghai–Nanjing–Hangzhou agglomeration comprises the main region, which includes Shanghai, Hangzhou, Ningbo, Shaoxing, Jiaxing, Huzhou, Taizhou, and Zhoushan in Zhejiang Province and Nanjing, Zhenjiang, Suzhou, Wuxi, Changzhou, Yangzhou, Nantong, and Taizhou in Jiangsu Province. In this study, Jiangsu was divided into two areas: southern Jiangsu (Nanjing, Suzhou, Wuxi, Changzhou, and Zhenjiang) and central Jiangsu (Nantong, Taizhou, and Yangzhou).
The population statistics used in this study were obtained from the National Census 2000 and 2010 in China, which include street block population and total population. In accordance with the United Nations standards, this study mainly measured aging level using the Aging Degree Index, which is defined as the ratio of individuals aged over 65 years among the total population. Then, the aging structure was divided into five types: Growth (G), Early-aged (L1), Mid-aged (L2), Late-aged (L3), and Super-aged (S). If the aging index was below 4%, then the area was defined as G; between 4% and 7%, the area was L1; above 7% but below 10%, the area was L2; between 10% and 14%, the area was L3; and above 14%, the area was S.

2.2. Global Moran’s I

Moran’s I is a commonly used indicator of spatial autocorrelation among neighboring regions. In this study, global Moran’s I was used as the first measure of the overall spatial autocorrelation [39,40,41]. The global Moran’s I index can be represented as follows:
I = n i = 1 n j = 1 n W i j ( X i X ) ( X j X ) i = 1 n j = 1 n ( W i j i = 1 n ( X i X ) 2 ) ,
where n is the total number of regions; Xi and Xj are the Aging Degree Index of regions i and j, respectively; X is the average Aging Degree Index of all the regions; and Wij is the spatial weight matrix that can be defined as the inverse of the distance between locations i and j. Weight Wij can be determined using a distance band. The values of global Moran’s I are between −1 and 1. A high positive local Moran’s I value implies that the location being studied has similarly high or low values as its neighbors; thus, the locations are spatial clusters. When 0 < Moran < 1, the values of similar properties in the geospatial distribution tend to gather in one area; when Moran’s I = 0, the value indicates spatial randomness; when −1 < Moran < 0, different property values tend to cluster in one area [42].

2.3. Hotspot Analysis

Moran’s I can identify global spatial association and autocorrelation [43]. However, the local patterns of influence that can be used to describe spatial distribution cannot be effectively implemented. Local influence of spatial autocorrelation methods is applied locally and is useful for identifying local spatial clustering or “hotspots” [40,44]. Hotspot analysis calculates the Getis–Ord Gi*(Gi) statistic to identify spatial clusters of high Aging Degree Index (hotspot) and low Aging Degree Index (cold spot) within the context of neighboring features. The Getis–Ord Gi* is defined as follows:
G i = j = 1 n w i j y j X ¯ j = 1 n w i j S [ n j = 1 n w i j 2 ( j = 1 n w i j ) 2 ] n 1 ,
where xj is the attribute value for feature j, wij is the spatial weight between features i and j, n is equal to the total number of features, and
X ¯ = j = 1 n x j n ,
s = j = 1 n x j 2 X ¯ 2 n ,
The Gi* statistic is expressed in the form of a statistically significant Z-score; when the Z-score is high, the clustering of the high value will be intense [45].

2.4. Geographical Detector Model

Spatial heterogeneity is the major feature of ecological and geographical phenomena [46]. Controlling the functions of nature and the social process and providing clues about the distinct mechanisms in the strata are important aspects of geography research [47]. The geographical detector technique, which was introduced by Wang (2010), has been extensively used to analyze the effects of driving determinants on local disease risks [37]. This detector is used to explain the extent of factor X’s effect on the spatial differentiation of factor Y.
The geodetector is based on the power of the determinant value ( P D , U ), which is expressed by the following equation:
P D , U = 1 1 n σ U 2 i = 1 m n D , i σ U D , i 2 ,
where P D , U is the power of the determinant of factor D . The study area is stratified into M subareas, which are denoted by m = 1,…, M. n denotes the number of street blocks in the study area; n D , i denotes the number of street blocks in the subareas; σ U 2 is the global variance of the Aging Degree Index in the study area; and σ U D , i 2 is the variance of the Aging Degree Index in the subareas, which is typically P D , U ∈ [0.1]. When P D , U is large, the influence of X will be great.
The interaction detector is used to identify the interactions or independent influences among different risk factors, which can be evaluated using the following methods:
Weaken and nonlinear: P ( X 1 X 2 ) < M i n ( P ( X 1 ) , P ( X 2 ) )
Weaken and univariate: M i n ( P ( X 1 ) , P ( X 2 ) ) < P ( X 1 X 2 ) < M a x ( P ( X 1 ) , P ( X 2 ) )
Enhanced and bivariate: P ( X 1 X 2 ) > M a x ( P ( X 1 ) , P ( X 2 ) )
Enhanced and nonlinear: P ( X 1 X 2 ) > ( P ( X 1 ) + P ( X 2 ) )
Independent: P ( X 1 X 2 ) = ( P ( X 1 ) + P ( X 2 ) )
The symbol “∩” denotes the interaction between A and B. We used ArcGIS software to overlay layers A and B and to obtain a new layer C. We can determine the influence of an interaction by comparing the P values of A, B, and C [48,49].

3. Results and Discussions

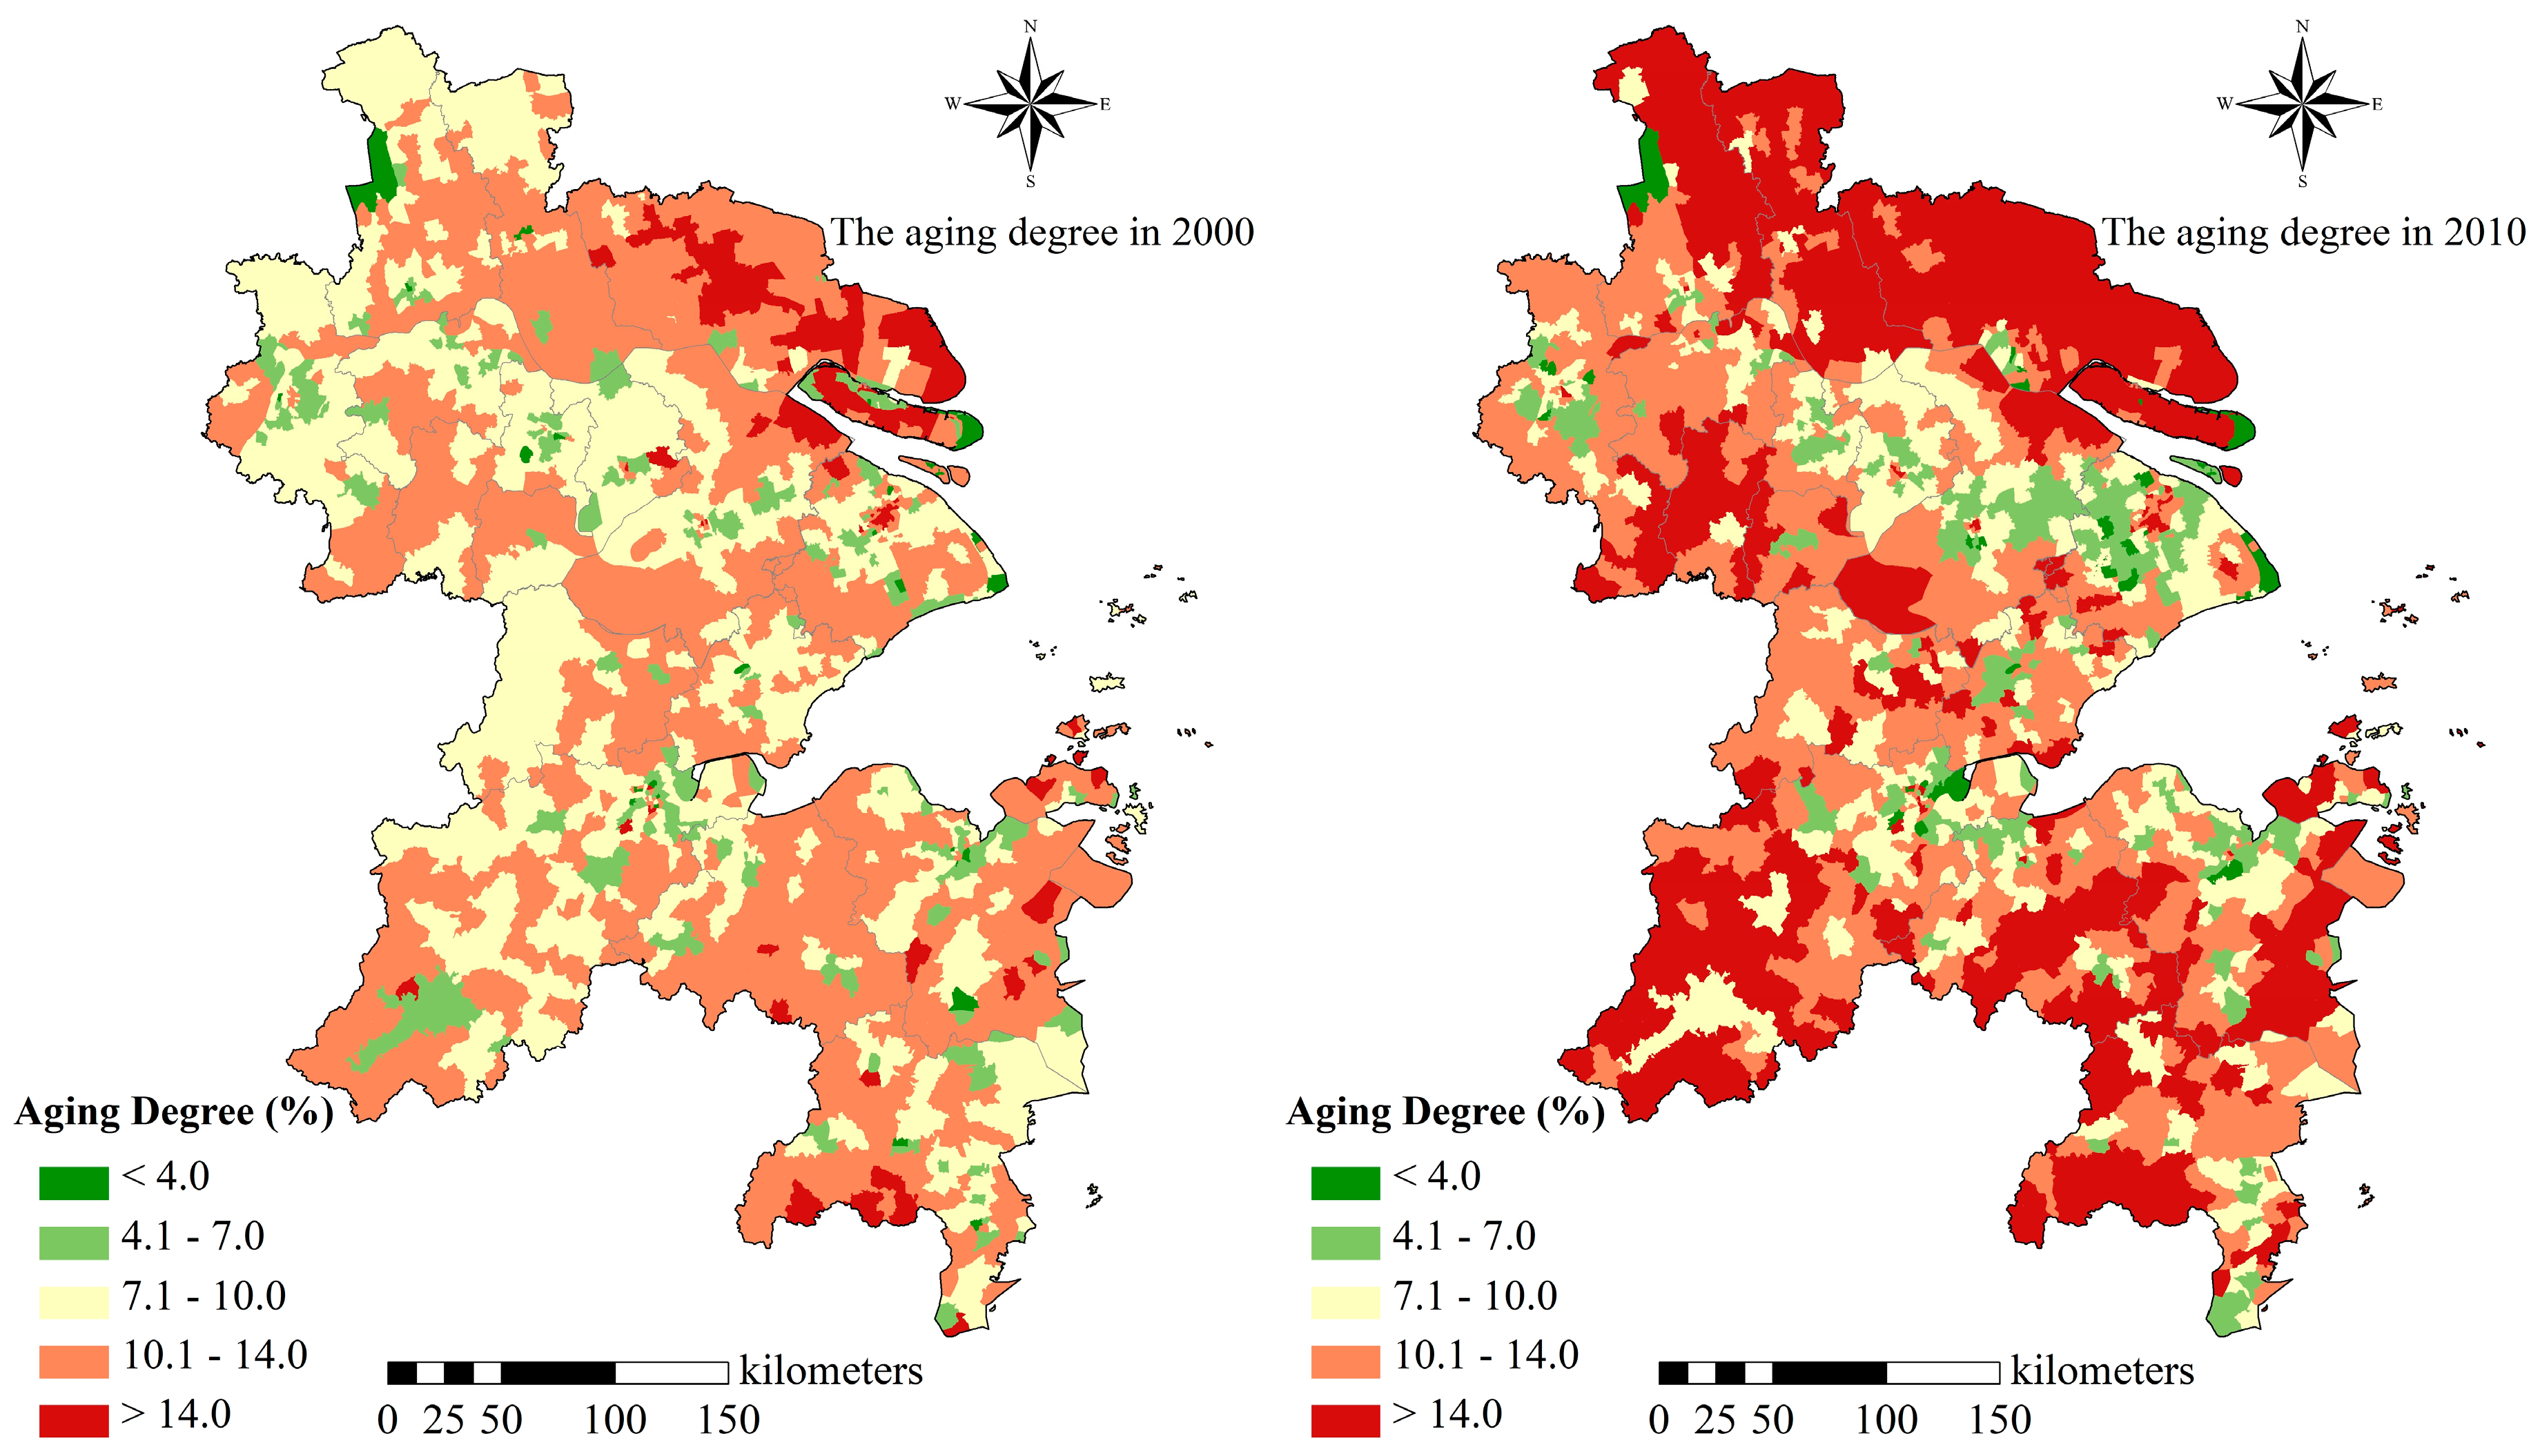
3.1. Spatial Pattern of the Aging Degree Index

As shown in Figure 2, the Aging Degree Index in the Yangtze River Delta was increasing. In 2000, the overall aging degree was 9.66%. It increased to 10.45% in 2010, from L2 to L3. From 2000 to 2010, the type of aging degree changed. S increased considerably, whereas L2 significantly decreased. The number of G streets increased from 24 to 33, L1 increased from 210 to 218, L2 decreased from 621 to 340, L3 decreased from 747 to 565, and S increased from 112 to 552. Overall, 819 streets were upgraded, accounting for 47.95% of the total. Among them, 390 L3 streets changed into S, accounting for the highest proportion, followed by L2 transforming into L3. A total of 671 invariant types, mainly L3 (276 streets), were found, followed by L2 (194 streets). The number of retrogressive streets (217 streets) was less, mostly L2 back to L1, and then L3 back to L2. The aforementioned results show that the promotion and replacement of aging coexist, the degree of aging is deepening, and the number of aging regions is constantly increasing.
In 2000, the S streets in the Yangtze River Delta were mainly distributed in Nantong, Shanghai, and the southernmost area of Taizhou (Zhejiang). Simultaneously, the highest value appeared in West Nanjing Road, Ruian Gold Road, and Hunan Road in Shanghai City, with the aging rate exceeding 21.0%. Most areas in Nantong entered the S type, such as Changle, Qian, Shuxun, and Xindian, with an aging rate above 15.0%. Meanwhile, areas with low aging degrees were located in the streets of urban areas. Suburban areas also entered L3. In 2010, S streets were located along the Nantong–Taizhou–Yangzhou agglomeration in central Jiangsu Province and southwestern Zhejiang Province. The highest value appeared in the towns of Taiping and Peace, with an aging rate of over 30.0%. Moreover, 69.23% of the towns and streets that changed into S were located in the Nantong–Taizhou–Yangzhou agglomeration of central Jiangsu. The L2 Shanghai–Suzhou–Nanjing–Hangzhou–Ningbo metropolitan area has become a “Z”-shaped structure due to its expanding younger population. This pattern of change has been associated with the migration of a large number of people, particularly the new generation of young and middle-aged members of the labor force.

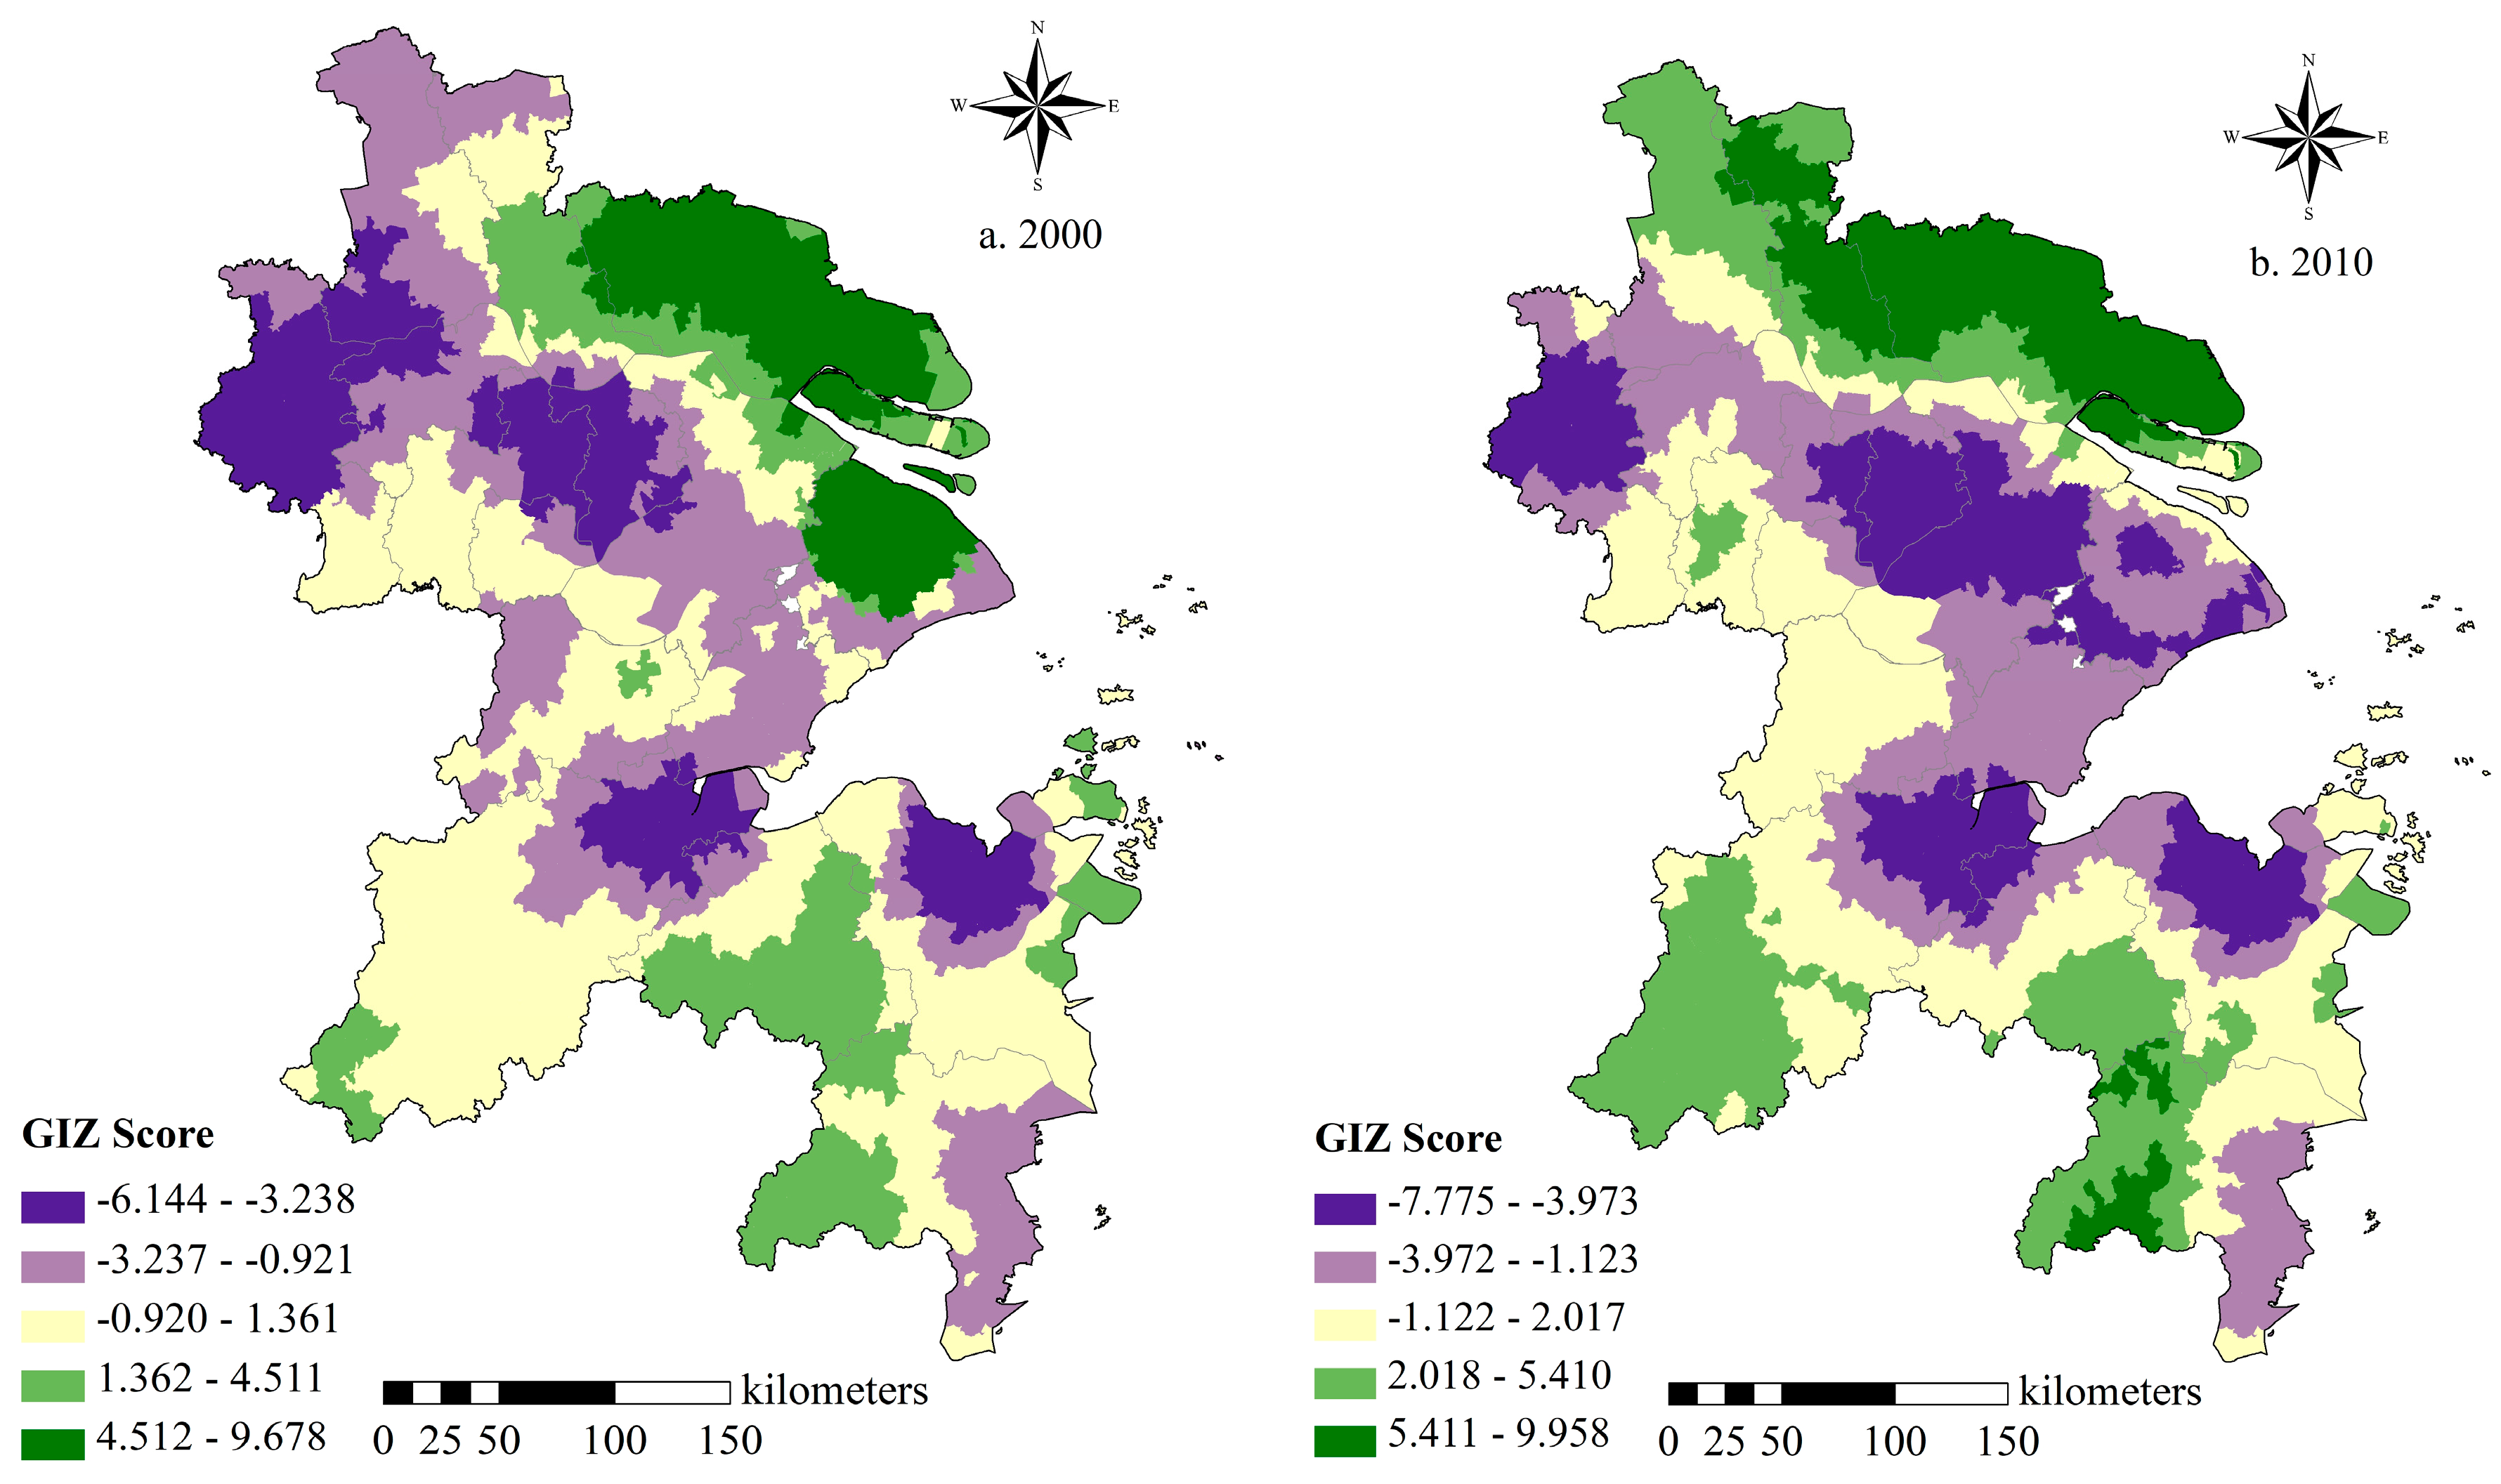
3.2. Spatial Cluster Analysis

In general, when the value of Moran’s I is high, a strong spatial autocorrelation exists. Town and street blocks were used as research units. The global Moran’s I values for 2000 and 2010 were positive, and the normal statistics p passed the 5% significance level test (Table 1), thereby indicating that spatial autocorrelation existed in the aging degree. That is, a high-aging area gathers to a high-aging area, whereas a low-aging area gathers to a low-aging area. Within 10 years, the value of Moran’s I increased, with fluctuations from 0.449 in 2000 to 0.558 in 2010, which indicated that the cluster degree of aging exhibited an increasing trend. Regional differences increased, and the uneven development of space was prominent.
To further determine the regional cluster situation, Getis–Ord Gi* was used to analyze the local cluster patterns of the regional aging degrees in 2000 and 2010. As shown in Figure 3, hotspots are mainly located in central Jiangsu and southwestern Zhejiang, thereby indicating that their neighboring regions were high-aging degree areas. Meanwhile, cold spots are distributed in metropolitan areas, such as the urban areas in Nanjing–Suzhou–Zhejiang–Ningbo. This finding indicates that the urban aging degree is lower than the suburban aging degree. In 2000 and 2010, the regional hotspot in central Jiangsu increased from southeast to northwest, and Yangzhou evolved from a cold spot area to a hotspot area. The hotspot in southwestern Zhejiang was enhanced. The regional cold spot in the Nanjing–Suzhou–Zhejiang–Ningbo agglomeration increased, and Shanghai evolved from a hotspot area to a cold spot area.

3.3. Influences of Driving Factors

The distribution of the elderly population reflects “man–land relationship” in the specific social, economic, and environmental contexts, which is directly and deeply influenced by environmental elements but indirectly affected by social and economic factors. Therefore, we selected per capita GDP (PGDP) to reflect the level of regional economic development. Meanwhile, road network density (RND) was used to explore traffic convenience, which indicated the speed of economic development. The two indicators are categorized as economic factors. Then, we applied the relief degree of land surface (RDLS) to identify geomorphology and landform type, whereas the air quality index (AQI) was used to determine air pollution. The two indicators are categorized as environmental factors. Finally, we used inflow (IPR) and outflow population rates (OPR) to indicate the level of social development. These factors and their explanations are listed in Table 2, based on the literature review and available data.

3.3.1. Overall Factor Detection

The factor detector was used to calculate the P D , U values to represent the relative importance of the potential factors of the Aging Degree Index. In 2000, the driving factors were ranked as follows: OPR (0.169) > IPR (0.102) > PGDP (0.087) > RND (0.073) > AQI (0.068) > RDLS (0.040). In 2010, the driving factors were ranked as follows: OPR (0.482) > IPR (0.301) > PGDP (0.276) > RND (0.110) > RDLS (0.093) > AQI (0.034). This ranking denoted that social factors, such as IPR and OPR, exerted the greatest effects on aging, followed by economic factors, whereas natural factors had minimal effects on aging. Overall, the influences of social, economic, and environmental factors on aging degree are consistent with a previous research [34]. We obtained the following conclusions through factor detection.
(1) Social factors
IPR and OPR are the main factors that affect the spatial heterogeneity of population aging. OPR exert greater effect on aging than IPR. Population aging in China has changed significantly with the development of urbanization. In 1978, China remained overwhelmingly rural, with only 18% of the population residing in urban areas. During the last four decades, however, the government has allowed workers to migrate to towns and cities, which cause spatial imbalance of aging between urban and rural areas [52]. Since 2005, large-scale and rapid urbanization has led to the redistribution of population. The rapid urbanization process during the past 10 years has considerably increased interprovincial population flow, which is reflected by the inflow of new generations of young laborers from rural areas into cities. The age structure of the population in outflow and inflow areas has changed, and the aging rate of outflow areas has accelerated, which explains that the impact of OPR is higher than that of IPR. The influence of IPR is reflected in the dilution effect on aging. The inflow of a large number of floating populations has transformed urban areas into young age centers. In 2003, the establishment of the metropolitan areas of Nanjing and Suzhou–Wuxi–Changzhou aggravated the labor migration rate and the formation of young age centers in urban areas. The age structures of urban and suburban populations reflect different migration patterns. The rapid development of urban areas has caused the aging of surrounding suburbs to increase and the aging of cities to decrease.
(2) Economic factors
PGDP and RND are the second most influential factors. PGDP has a stronger and deeper impact on aging than RND. Economic development plays a two-way regulatory role in aging. On the one hand, economic acceleration improves the quality of life of the people, along with medical and hygienic conditions, which increases life expectancy. On the other hand, economic development will attract the inflow of population in underdeveloped areas and dilute the level of local aging. Since China joined the World Trade Organization in 2001, the economy of China has gained new opportunities for development, and the Yangtze River Delta has become the center of economically developed areas. For example, the establishment of Shanghai’s special economic zones and the implementation of the Hangzhou Bay industrial development strategy since 2000, both of which fully promote rapid economic and social development in the region, PGDP has increased dramatically in the past 10 years. RND reflects the capability of a region to communicate with the outside world and to exhibit internal accessibility. The road network dense area and the aging cold spot area demonstrate relative consistency and present a “Z”-shaped structure. From 2000 to 2010, the influence of RND on aging was enhanced due to the establishment of high-speed railways in Shanghai–Nanjing, Shanghai–Hangzhou, and Hangzhou–Ningbo and the construction of Suzhou-Nantong Bridge. The increasing complexity of interurban road networks and accessibility of roads strengthen regional links and provide infrastructure conditions for the interregional mobility of populations. The surrounding suburban road network development retards the migration of immigrants and worsens the empty nest syndrome.
(3) Environmental factors
The minimal factors influencing population aging are RDLS and AQI. AQI exerted greater effect on aging than RDLS in 2000, whereas the effect of RDLS was greater than that of AQI in 2010. The highest value of AQI was observed in the Shanghai–Suzhou-Nantong region. This area comprises important industry development bases. The environmental pollution caused by the construction industry reduces air quality and does not match the geographical distribution of the elderly population. Consequently, the effect of AQI has weakened in recent years. The effect of RDLS on the elderly population is enhanced. It presents the pattern of southwestern high and northeastern low, coupled with the aging of the southwestern Zhejiang population in 2010. The influence of RDLS on the elderly population was significant. Promoting the rational redistribution of the elderly population with a large relief and poor barren land to expandable areas or focusing on developing plains is possible by quantitatively depicting the relationships among land surface degree, environmental quality, regional resources, and environmental carrying capacity. Such action will help alleviate poverty in mountainous areas and provide ecological environment protection.

3.3.2. Different Types of Area Factor Detection

To clarify the similarities and differences among aging mechanisms in different regions in the Yangtze River Delta, we used factors in G, L1, L2, L3, and S townships and street blocks. The results are provided in Table 3.
(1) The G areas are the social economic centers and population inflow gathering zones in the Yangtze River Delta. Geographical detection showed that the PD,G values of aging in 2010 were ranked as follows: OPR (0.607), IPR (0.533), RND (0.453), PGDP (0.409), AQI (0.183), and RDLS (0.160). With the growth area located at the center of the city, urbanization and economic development caused a large number of people to migrate from rural areas to urban areas. Advantageous medical insurance, elderly care services, and improved quality of life in downtown areas have increased life expectancy per capita. Real estate developments in suburban areas provide young workers with additional housing options and encourage people to migrate to the periphery. This condition has accelerated the aging process in urban areas. The influential effect of economic factors, which was over 0.40, was observed based on the aforementioned reasons.
(2) The L1 regions are located in the suburban areas of cities and are considered the industrialization and urbanization transfer areas. The factors that affect aging were ranked as follows: OPR (0.080), IPR (0.035), RND (0.021), AQI (0.019), PGDP (0.018), and RDLS (0.014). As an urban subcenter, this district acquires a large number of industrial transfers in urban areas and provides economic support and contribution to the central urban area. In recent years, serious industrial pollution has occurred during the development of real estate and housing businesses and, thus, AQI has risen as the fourth most influential factor. The effects of all the factors have been considerably reduced compared with the growth area because the level of social and economic development is lower than that in the central urban area.
(3) L2 areas are far suburbs, where RDLS is larger in rural counties, such as Water Town, Thousand Island Lake Town and Yanchi Town. Geographical detection showed that the PD,G values of aging factors were ranked as follows: OPR (0.034), RDLS (0.033), PGDP (0.021), IPR (0.017), AQI (0.017), and RND (0.009). Industrialization brings about improvement of rural productivity, which produces a large number of rural surplus workers. In addition, the relaxation of the urban and rural household registration system has led to the migration of a large number of young laborers from townships to cities to seek jobs. The remaining population in townships has increased the local aging process. Mountainous areas with a large terrain relief are economically underdeveloped regions. Under the “pulling force” of the urban economy, population flow is generated. Besides, these areas are located in underdeveloped sections of road networks. Geographic location and the convergence effects of RND constrain the aging process and, thus, the impact of RND on aging is not prominent.
(4) L3 areas are located along the urban–rural boundary and the urban transition zone. Geographical detection results showed that OPR (0.065), RND (0.021), RDLS (0.020), and IPR (0.016) were the main factors that influenced the spatial differentiation of aging. Road networks play a role in connecting people, capital, and materials between urban and rural areas. In the process of urbanization, urban and rural transport conditions have been improved, intercity railways have become operational, and the digital upgrading of urban and rural road networks have increased the possibility of interprovincial migration to a certain extent. Therefore, road network density has emerged as the second most important factor of aging. Land use transformation in the urban expansion process tends to flatten the urban terrain, the urban–rural junction has become a large area of undulating terrain, and the mobility of the population in this region has caused the spatial redistribution of aging, thereby making RDLS the third most influential aging factor.
(5) S regions are located in the north and south of the study area and are the regions in the Yangtze River Delta where aging is the highest. AQI (0.126), PGDP (0.058), OPR (0.044), RND (0.041), IPR (0.040), and RDLS (0.021) were the main factors that affected the spatial distribution of aging. Nantong City and Suzhou City in the north of the Yangtze River Delta are industrial development clusters. The construction of secondary industries has developed rapidly in recent years, and the industrial pollutants fine particulate matter (PM2.5) and inhalable particles (PM10) have exceeded the standards, thereby prompting the relocation of the population and aggravating the aging process. Moreover, the rapid development of the economy also provides improved life security for the elderly and extends the life expectancy of the population. Southwestern Zhejiang Province is an economically underdeveloped township area. Social factors (OPR and IPR) play a leading role.

3.4. Interaction Detection among Driving Factors

Interaction detection was used to analyze whether an interaction exists among social, economic, and environmental factors or whether they can independently influence the spatial heterogeneity of the Aging Degree Index. As shown in Table 4 and Table 5, an interaction relationship can be divided into three types: enhanced and bivariate, enhanced and nonlinear, and independent. The enhanced and bivariate type indicates that the interaction influence of each two factors is greater than the maximum of their separate influences. The enhanced and nonlinear type indicates that the interaction influence of each of the two factors is greater than the sum of the influences of the two factors. The independent type indicates that two factors do not affect each other.
The interactive values of AQI and RDLS, RND, PGDP, IPR, and OPR were greater than the sum of the influences of any two factors. The interactive values of RDLS and PGDP, IPR and OPR, RND and PGDP, IPR and OPR, PGDP and IPR and OPR, and IPR and OPR were greater than the maximum of their separate influences. Among these, the maximum factor explanatory power after the interaction between IPR and OPR was 0.775, and the minimum explanatory power of RDLS and AQI was 0.126. These values show that IPR and OPR significantly affect the aging degree, whereas RDLS and AQI have minimal influence on the aging degree. This finding is consistent with the result of the factor detector. Overall, the interaction among social, economic, and environmental factors influences population aging. The explanatory power of any two factors after interaction is manifested as a nonlinear or bilinear enhancement. The results indicate that the internal differences in an aging area will be reduced under any two factors, which also confirms the triple effects of social, economic, and environmental factors on aging.

4. Conclusions and Recommendations

We first studied the spatial–temporal dynamics of the Aging Degree Index using global Moran’s I and hotspot analysis and then applied the geographical detector model to explain the spatial variation of population aging. We draw the following conclusions.
(1)
The aging degree in the Yangtze River Delta changed from L2 to L3. The promotion and replacement of aging coexist, the degree of aging is deepening, and the number of aging regions is constantly increasing. Urban aging degree is lower than suburban aging degree, which is associated with the migration of a large number of people, particularly the new generation of young and middle-aged members of the labor force.
(2)
The cluster degree of aging exhibited an increasing trend. Population aging is higher in Nantong–Taizhou–Yangzhou in central Jiangsu Province and southwestern Zhejiang Province than in Shanghai–Nanjing–Suzhou–Zhejiang–Ningbo metropolitan areas. From 2000 to 2010, Yangzhou transformed from a cold spot into a hotspot, whereas Shanghai transformed from a hotspot into a cold spot.
(3)
Several factors cause changes in regional aging, namely, social, economic, and environment factors. The results of the interaction detection can be divided into three types: enhanced and nonlinear, enhanced and bivariate, and independent. The Yangtze River Delta is an important population flow area in China. Social factors are the main driving forces that affect aging in townships/streets, followed by economic factors, whereas the non-heterogeneity of the natural environment has a limited impact on aging. The G type is an important population agglomeration, and IPR and OPR are the main factors that influence the spatial pattern of aging. The L1 type is the subcore and industrialization and urbanization transfer areas. Secondary industrial development has significantly influenced air quality. The L2 type is located in the outskirts of towns and villages. The increase in special terrain conditions and rural productivity, and the relaxation of the household registration system have intensified the local aging process in this type. OPR, RND, and RDLS are the main factors that influence the L3 type. The S type is affected by social, economic, and environmental factors. The interaction among these factors enhances their effects, which indicates that interacting factors have a greater effect on population aging than any single factor. Interaction among social, economic, and environmental factors significantly influences population aging. Therefore, a comprehensive consideration of natural, social, economic, and environmental factors is the key to understanding the causal mechanism of aging.
The results of this study have several important implications:
(1)
China is experiencing a significantly aging population, and this phenomenon will become more serious in the coming decades. However, this phenomenon is not new or unique. On the basis of the findings of this study, we determine that research on the spatial pattern of population aging remains a popular issue in geography, which is rooted in national and provincial differences and its response. However, the differences in economic development, social foundation, and cultural ideas in various regions make the existing research representative, but lacking universality, thus, different types of areas and mechanisms should be further studied. The deepening aging of urban agglomeration has put forward higher requirements for the sustainability of public service facilities, living space, and social security. Thus, geographers should use advantages of their own discipline to observe the changes in the elderly population within urban agglomerations from the perspective of dynamic characteristics—so as to meet the forward-looking requirements of the elderly’s space needs—and laying the foundation for adapting to the sustainable development of an aging society.
(2)
In addition, we cannot access the impact of migrants on aging in metropolitan areas. The mechanism of aging should be further studied because of the lack of migration data for the elderly population at the town and street block levels. With the accelerating pace of urbanization in China, the population aging problem in population inflow areas will become critical to the sustainable development of different regions. The process of systematically evaluating the aging of inflow and outflow populations requires the attention of scholars.
(3)
At last, although environmental factors have limited effects on aging, they still exert strong influence under the interaction influence of social and economic. This tells us that we cannot ignore the indirect effects of the environment on human activities in pursuit of the rapid development of social economy. Seek social, economic, and environmental sustainability among cities is a common appeal of human society.

Author Contributions

All authors contributed equal to this work. In particular, X.X. developed the original idea for the study and conceived of the designed the experiments. X.X. drafted the manuscript, which was revised by Y.Z., X.Z. and S.X. All authors have read and approved the final manuscript.

Acknowledgments

This study was financially supported by the Key Projects of the National Natural Science Foundation of China (Grant No. 41430635). Thanks for the data support from the Jiangsu Center for Collaboration Innovation in Geographical Information Resource Development and Application, the Yangtze River Delta Science Data Center, National Earth System Science Data Sharing Infrastructure, and National Science & Technology Infrastructure of China.

Conflicts of Interest

The author(s) declared no potential conflict of interest with respect to the research, authorship, and/or publication of this article.

References

  1. National Bureau of Statistic of China. The Data Bulletin of the Fifth National Census; Chinese Statistic Press: Beijing, China, 2001. (In Chinese)
  2. National Bureau of Statistic of China. The Data Bulletin of the Fifth National Census; Chinese Statistic Press: Beijing, China, 2011. (In Chinese)
  3. Zhao, D.X.; Han, Z.L.; Wang, L. The spatial pattern of aging population distribution and its generating mechanism in China. Acta Geogr. Sin. 2017, 72, 1762–1775. (In Chinese) [Google Scholar]
  4. Zhou, S.; Xie, M.; Kwan, M.P. Ageing in place and ageing with migration in the transitional context of urban China: A case study of ageing communities in Guangzhou. Habitat Int. 2015, 49, 177–186. [Google Scholar] [CrossRef]
  5. Foug, R.M.; Mrette, M. Population ageing and economic growth in seven OECD countries. Econ. Model. 1999, 16, 411–427. [Google Scholar] [CrossRef]
  6. Bloom, D.E.; Canning, D.; Fink, G. Implications of population ageing for economic growth. Oxf. Rev. Econ. Policy 2010, 26, 583–612. [Google Scholar] [CrossRef]
  7. Herrmann, M. Population Aging and Economic Development: Anxieties and Policy Responses. J. Popul. Ageing 2012, 5, 23–46. [Google Scholar] [CrossRef]
  8. Gonzalez-Eiras, M.; Niepelt, D. Ageing, government budgets, retirement, and growth. Eur. Econ. Rev. 2012, 56, 97–115. [Google Scholar] [CrossRef] [Green Version]
  9. Woo, J.; Lynn, H.; Lau, W.Y.; Leung, J.; Lau, E.; Wong, S.Y.; Kwok, T.C.Y. Nutrient intake and psychological health in an elderly Chinese population. Int. J. Geriatr. Psychiatr. 2006, 21, 1036–1043. [Google Scholar] [CrossRef] [PubMed]
  10. Resnick, B.; Klinedinst, N.J.; Yergesarmstrong, L.; Yergesarmstrong, L.; Choi, E.Y.; Dorsey, S.G. The Impact of Genetics on Physical Resilience and Successful Aging. J. Aging Health 2015, 27, 1084–1104. [Google Scholar] [CrossRef] [PubMed]
  11. Krause, N. Life stress, social support, and self-esteem in an elderly population. Psychol. Aging 1987, 2, 349–356. [Google Scholar] [CrossRef] [PubMed]
  12. Berg, P.V.D.; Kemperman, A.; Kleijn, B.D.; Boegers, A. Locations that support social activity participation of the aging population. Int. J. Environ. Res. Public Health 2015, 12, 10432–10449. [Google Scholar] [CrossRef] [PubMed]
  13. Rosenbloom, S. Sustainability and automobility among the elderly: An international assessment. Transportation 2001, 28, 375–408. [Google Scholar] [CrossRef]
  14. Schwanen, T.; Pea, A. The mobility of older people–an introduction. J. Transp. Geogr. 2010, 18, 591–595. [Google Scholar] [CrossRef]
  15. Cowgill, D.O. Residential segregation by age in American metropolitan areas. J. Gerontol. 1978, 33, 446–453. [Google Scholar] [CrossRef] [PubMed]
  16. Goodman, A.C. Using lorenz curves to characterize urban elderly populations. Urban Stud. 1987, 24, 77–80. [Google Scholar] [CrossRef]
  17. Serow, W.J.; Cowart, M.E. Demographic transition and population aging with Caribbean nation states. J. Cross-Cult. Gerontol. 1998, 13, 201–213. [Google Scholar] [CrossRef] [PubMed]
  18. Yamada, T.; Chen, C.C.; Murata, C.; Hirai, H.; Ojima, T.; Kondo, K.; Harris, J.R., III. Access disparity and health inequality of the elderly: Unmet needs and delayed healthcare. Int. J. Environ. Res. Public Health 2015, 12, 1745–1772. [Google Scholar] [CrossRef] [PubMed]
  19. Gu, D.; Zhang, Z.; Zeng, Y. Access to healthcare services makes a difference in healthy longevity among older Chinese adults. Soc. Sci. Med. 2009, 68, 210–219. [Google Scholar] [CrossRef] [PubMed]
  20. Low, L.F.; Fletcher, J.; Gresham, M.; Brodaty, H. Community care for the elderly: Needs and service use study (CENSUS): Who receives home care packages and what are the outcomes? Aust. J. Ageing 2014, 34, 1–8. [Google Scholar] [CrossRef] [PubMed]
  21. Golant, S.M. The Residential Location and Spatial Behavior of the Elderly: A Canadian Example; University of Chicago: Chicago, IL, USA, 1972. [Google Scholar] [CrossRef]
  22. Smith, G.C. Change in elderly residential segregation in Canadian metropolitan areas, 1981–1991. Can. J. Aging 1998, 17, 59–82. [Google Scholar] [CrossRef]
  23. Hikida, A.; Ishikawa, T. Elderly people’s spatial behavior in terms of the ability to interrelate maps and real spaces. J. City Plan. Inst. Jpn. 2011, 46, 125–131. [Google Scholar] [CrossRef]
  24. Lee, H.; Park, S.J.; Kim, M.J.; Jung, J.Y.; Lim, H.W.; Kim, J.T. The service pattern-oriented smart bedroom based on elderly spatial behaviour patterns. Indoor Built Environ. 2013, 22, 299–308. [Google Scholar] [CrossRef]
  25. Rogers, A.; Watkins, J.F.; Woodward, J.A. Interregional elderly migration and population redistribution in four industrialized countries. A comparative analysis. Res. Aging 1990, 12, 251–293. [Google Scholar] [CrossRef] [PubMed]
  26. Naganuma, S.; Arai, Y.; Esaki, Y. The aging population in the suburbs of metropolitan Tokyo. Jpn. J. Hum. Geogr. 2006, 58, 63–76. [Google Scholar] [CrossRef]
  27. Walford, N.S.; Kurek, S. A comparative analysis of population ageing in urban and rural areas of England and Wales, and Poland over the last three census intervals. Popul. Space Place 2008, 14, 365–386. [Google Scholar] [CrossRef]
  28. Shiode, N.; Morita, M.; Shiode, S.; Okunuki, K. Urban and rural geographies of aging: A local spatial correlation analysis of aging population measures. Urban Geogr. 2014, 35, 608–628. [Google Scholar] [CrossRef]
  29. Xie, B.; Zhou, J.; Luo, X. Mapping spatial variation of population aging in China’s mega cities. J. Maps 2016, 12, 181–192. [Google Scholar] [CrossRef]
  30. Flynn, C.B. General versus aged interstate migration 1965–1970. Res. Aging 1980, 2, 165–176. [Google Scholar] [CrossRef]
  31. Rogerson, P.A. The geography of elderly minority populations in the United States. Int. J. Geogr. Inf. 1998, 12, 687–698. [Google Scholar] [CrossRef] [PubMed]
  32. Smith, G.C. The spatial shopping behaviour of the urban elderly: A review of the literature. Geoforum 1988, 19, 189–200. [Google Scholar] [CrossRef]
  33. Somenahalli, S.V.C.; Shipton, M.D.; Bruce, D. Investigating the spatial distribution of the elderly and its implications for service provision in Adelaide Metropolitan Area. In Proceedings of the 33rd Australasian Transport Research Forum, Canberra, Australia, 29 September–1 October 2010. [Google Scholar]
  34. Lv, J.; Wang, W.; Li, Y. Effects of environmental factors on the longevous people in China. Arch. Gerontol. Geriatr. 2011, 53, 200–205. [Google Scholar] [CrossRef] [PubMed]
  35. Song, W.; Li, Y.; Hao, Z.; Li, H.; Wang, W.Y. Public health in China: An environmental and socio-economic perspective. Atmos. Environ. 2016, 129, 9–17. [Google Scholar] [CrossRef]
  36. Shi, Y.; Xu, N. Analysis of influence of population aging on urban economic growth. Open Cybern. Syst. J. 2015, 9, 2847–2852. [Google Scholar] [CrossRef]
  37. Wang, J.F.; Li, X.H.; Christakos, G.; Liao, Y.L.; Zhang, T.; Gu, X.; Zheng, X.Y. Geographical detectors-based health risk assessment and its application in the neural tube defects study of the Heshun region, China. Int. J. Geogr. Inf. Sci. 2010, 24, 107–127. [Google Scholar] [CrossRef]
  38. Wang, J.F.; Xu, C.D. Geodetector: Principal and prospective. Acta Geogr. Sin. 2017, 72, 116–134. (In Chinese) [Google Scholar]
  39. Cliff, A.D.; Ord, J.K. Spatial and temporal analysis: Autocorrelation in space and time. In Quantitative Geography: A British View; Pion: London, UK, 1981; pp. 127–144. [Google Scholar]
  40. Anselin, L. Local indicators of spatial association—LISA. Geogr. Anal. 1995, 27, 93–115. [Google Scholar] [CrossRef]
  41. Waldhör, T. The spatial autocorrelation coefficient Moran’s I under heteroscedasticity. Stat. Med. 1996, 15, 887–892. [Google Scholar] [CrossRef]
  42. Zhang, X.L.; Zhao, Y. Identification of the driving factors’ influences on regional energy-related carbon emissions in China based on geographical detector method. Environ. Sci. Pollut. Res. 2018, 25, 9626–9635. [Google Scholar] [CrossRef] [PubMed]
  43. Bartlett, M.S. Notes on continuous stochastic phenomena. Biometrika 1950, 37, 17–23. [Google Scholar] [CrossRef]
  44. Getis, A.; Ord, J.K. Local spatial statistics: An overview. In Spatial Analysis: Modelling in a GIS Environment; Longley, P., Batty, M., Eds.; GeoInformation International: Cambridge, UK, 1996; pp. 261–271. [Google Scholar]
  45. Yunus, A.P.; Dou, J.; Sravanthi, N. Remote sensing of chlorophyll-a as a measure of red tide in Tokyo Bay using hotspot analysis. Remote Sens. Appl. Soc. Environ. 2015, 2, 11–25. [Google Scholar] [CrossRef]
  46. Tobler, W. A computer movie simulating urban growth in the Detroit region. Econ. Geogr. 1970, 46, 234–240. [Google Scholar] [CrossRef]
  47. Wang, J.F.; Zhang, T.L.; Fu, B.J. A measure of spatial stratified heterogeneity. Ecol. Indic. 2016, 67, 250–256. [Google Scholar] [CrossRef]
  48. Ju, H.; Zhang, Z.; Zuo, L.; Wang, J.F.; Zhang, S.R.; Wang, X.; Zhao, X.L. Driving forces and their interactions of built-up land expansion based on the geographical detector-a case study of Beijing, China. Int. J. Geogr. Inf. Sci. 2016, 30, 2188–2207. [Google Scholar] [CrossRef]
  49. Wu, R.; Zhang, J.; Bao, Y.; Zhang, F. Geographical Detector Model for Influencing Factors of Industrial Sector Carbon Dioxide Emissions in Inner Mongolia, China. Sustainability 2016, 8, 149. [Google Scholar] [CrossRef]
  50. Wang, L.; Chen, L. Spatiotemporal dataset on Chinese population distribution and its driving factors from 1949 to 2013. Sci. Data 2016, 3, 160047–160062. [Google Scholar] [CrossRef] [PubMed]
  51. Jassim, M.S.; Coskuner, G. Assessment of spatial variations of particulate matter (PM 10, and PM 2.5) in Bahrain identified by air quality index (AQI). Arab. J. Geosci. 2017, 10, 19–32. [Google Scholar] [CrossRef]
  52. Banister, J.; Bloom, D.E.; Rosenberg, L. Population aging and economic growth in China. PGDA Work. Pap. 2010, 23, 61–89. [Google Scholar]
Figure 1. Location of the Yangtze River Delta in China.
Sustainability 10 01528 g001
Figure 2. Change in the population aging degree at the town and street block levels of the Yangtze River Delta.
Sustainability 10 01528 g002
Figure 3. Maps showing the hotspot and cold spot areas over the years (2000–2010) in the Yangtze River Delta.
Sustainability 10 01528 g003
Table 1. The estimates of global Moran’s I of aging rate in Yangtze River Delta in 2000 and 2010.
YearMoran’s IZ(I)p Value
20000.448930.76920.001
20100.558237.18230.001
Table 2. Factors used in the analysis and their explanations.
Factor ClassificationFactor SystemFactor ExplanationResolutionAbbreviation
Economic factorsPer capita GDPGross domestic product per capita1 km × 1 km gridPGDP
Road network densityLength of road network per km2Town/street block unitRND
Environmental factorsRelief degree of land surfaceDifference between the highest and lowest altitudes [50]1 km × 1 km gridRDLS
Air quality indexReducing PM2.5, PM10, SO2, NO2, O3, and CO to a single conceptual index value [51]1 km × 1 km gridAQI
Social factorsInflow population rateRatio of inflow individuals among the total populationTown/street block unitIPR
Outflow population rateRatio of outflow individuals among the total populationTown/street block unitOPR
Table 3. PD,G values of different aging regions in the Yangtze River Delta from 2000 to 2010.
Aging TypeRelief Degree of Land Surface (RDLS)Air Quality Index (AQI)Road Network Density (RND)Per Capita GDP (PGDP) Inflow Population Rate (IPR)Outflow Population Rate (OPR)
G0.1600.1830.4530.4090.5330.607
L10.0140.0190.0210.0180.0350.080
L20.0330.0170.0090.0210.0170.034
L30.0200.0080.0210.0140.0160.065
S0.0210.1260.0410.0580.0400.044
Table 4. Results of the interaction detections in 2010.
p ValueRDLSAQIRNDPGDPIPROPR
RDLS0.093
AQI0.1410.034
RND0.1730.1490.110
PGDP0.3340.3370.3200.275
IPR0.3480.3590.3600.4120.301
OPR0.5250.5570.5340.5150.5670.482
Table 5. Interactive impact of economic and environment factors on population aging index.
C = A ∩ BA + BCompareInteraction Relationship
RDLS ∩ AQI = 0.1410.093 + 0.034 = 0.127C > A + BEnhanced and nonlinear
RDLS ∩ RND = 0.1730.093 + 0.110 = 0.203C > A, B; C < A + BEnhanced and bivariate
RDLS ∩ PGDP = 0.3340.093 + 0.275 = 0.368C > A, B; C < A + BEnhanced and bivariate
RDLS ∩ IPR = 0.3480.093 + 0.301 = 0.394C > A, B; C < A + BEnhanced and bivariate
RDLS ∩ OPR = 0.5250.093 + 0.482 = 0.575C > A, B; C < A + BEnhanced and bivariate
AQI ∩ RND = 0.1490.034 + 0.110 = 0.144C > A + BEnhanced and nonlinear
AQI ∩ PGDP = 0.3370.034 + 0.275 = 0.309C > A + BEnhanced and nonlinear
AQI ∩ IPR = 0.3590.034 + 0.301 = 0.335C > A + BEnhanced and nonlinear
AQI ∩ OPR = 0.5570.034 + 0.482 = 0.516C > A + BEnhanced and nonlinear
RND ∩ PGDP = 0.3200.110 + 0.275 = 0.385C > A, B; C < A + BEnhanced and bivariate
RND ∩ IPR = 0.3600.110 + 0.301 = 0.411C > A, B; C < A + BEnhanced and bivariate
RND ∩ OPR = 0.5340.110 + 0.482 = 0.592C > A, B; C < A + BEnhanced and bivariate
PGDP ∩ IPR = 0.4120.275 + 0.301 = 0.576C > A, B; C < A + BEnhanced and bivariate
PGDP ∩ OPR = 0.5150.275 + 0.482 = 0.757C > A, B; C < A + BEnhanced and bivariate
IPR ∩ OPR = 0.5640.301 + 0.482 = 0.783C > A, B; C < A + BEnhanced and bivariate

