Sky Luminance Measurements Using CCD Camera and Comparisons with Calculation Models for Predicting Indoor Illuminance
Abstract
:1. Introduction
- Use date, time geographical site, irradiance data and zenith luminance to calculate luminance distribution of the sky. The CIE standard sky model, Perez model, and Igawa model were used for this calculation. Calculated luminance distributions were compared with luminance distribution measured with high dynamic range images (HDRI) to evaluate the accuracy of the sky distribution model.
- Calculate vertical illuminance of window surface by adding orientation of the window to luminance of each part of the sky calculated from the sky distribution model and compare it with the measured value.
- Calculate indoor illuminance by adding space data to vertical illuminance calculated in step 2. The calculated indoor illuminance was then verified against measured values
2. Theory
2.1. Sky Luminance Calculation Models
- Lγα is the luminance of the sky patch [cd/m2],
- Lz is the luminance of zenith [cd/m2].
- Zi is the zenith altitude angle of the sky patch [radians],
- Zs is the solar zenith angle [radians],
- a, b, c, d, and e are the coefficients applied differently for every calculation model,
- χ is an angular distance between the sky patch and the sun.
- αi is the azimuth angle of the sky element [radians],
- αs is the solar azimuth angle [radians].
2.1.1. CIE Standard General Sky Model
2.1.2. Perez Model
2.1.3. Igawa Model
2.2. Vertical and Interior Illuminance Prediction Algorithm
2.2.1. Sky Radiance Luminance Distribution Models for Vertical Illuminance
- Lγα is the sky luminance of a sky patch [cd/m2],
- γi is the altitude angle of a sky element [radians],
- αi is the azimuth angle of a sky element [radians],
- αn is the azimuth angle of a window normal [radians].
- EDN is the direct normal illuminance,
- J is the Julian date, the value of which is from 1 to 365,
- γs is the solar altitude angle [radians],
- av, the mean extinction coefficient [34].
= EdH, otherwise
2.2.2. Algorithm of DeLight
- Ei is the horizontal illuminance of the daylight entering a room [lx],
- EDi is the interior horizontal direct illuminance [lx],
- Edi is the interior horizontal diffuse illuminance [lx],
- Eri is the interior horizontal reflected illuminance [lx].
- τw (θi) is the light transmittance of the window with the angle of incidence γi [%].
- θi is the light transmittance of the window with the angle of incidence [37].
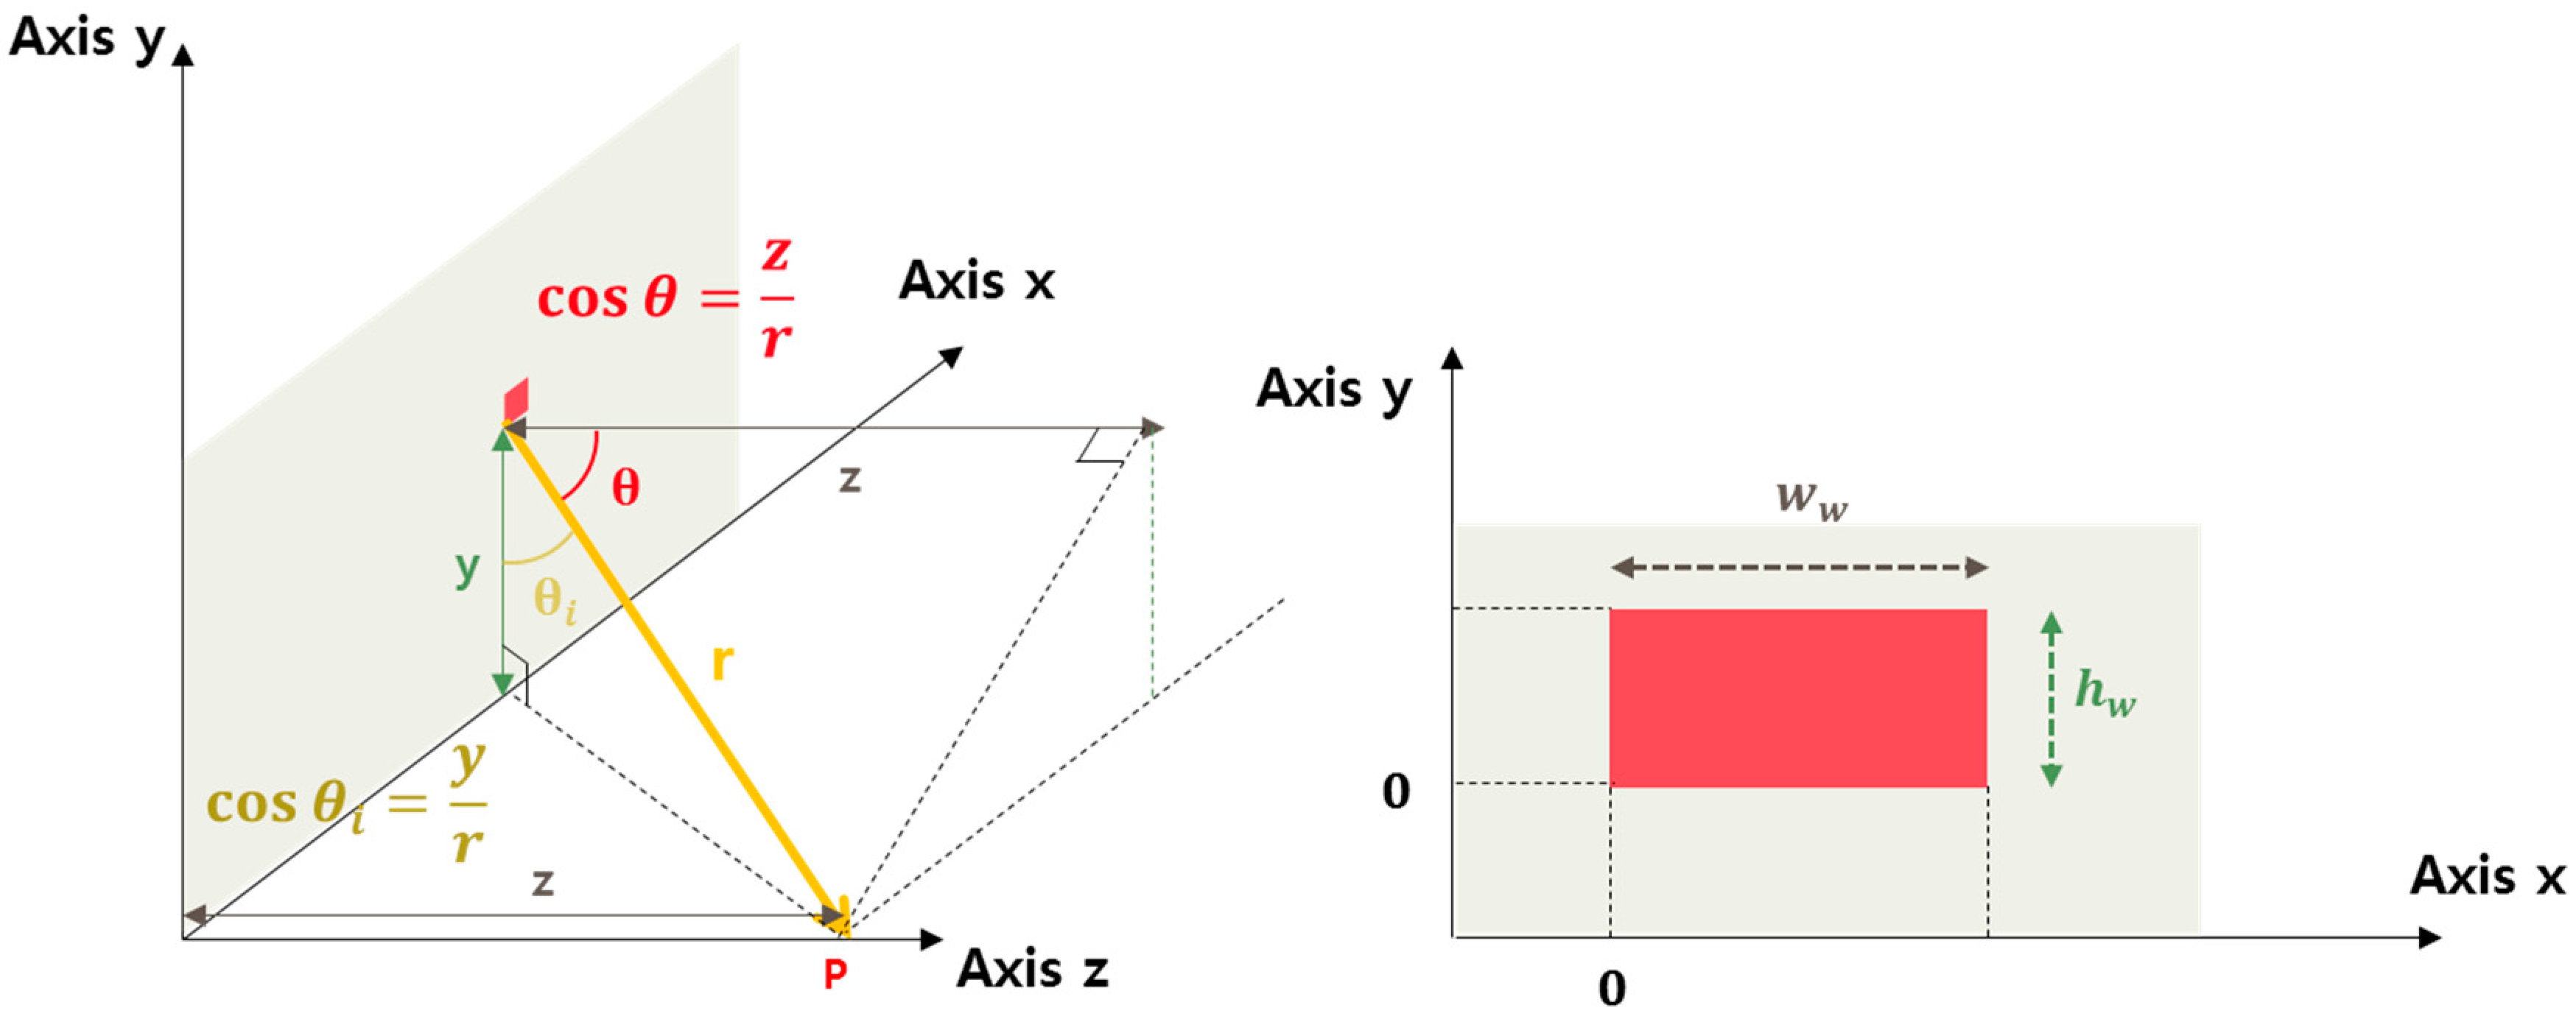
- Lv is the luminance of the radiating surface [cd/m2],
- x is the horizontal distance of the surface element from the left edge of the window [m],
- y is the vertical distance of the surface element from the lower edge of the window [m],
- z is the perpendicular distance of point P from the window [m],
- r is the distance between point P and the surface element [m],
- ww is the width of the window [m],
- hw is the height of the window [m],
3. Methodology and Measurement
3.1. Measurement Method
3.2. Description of the Methodology
3.2.1. The Process of Analyzing Measurements
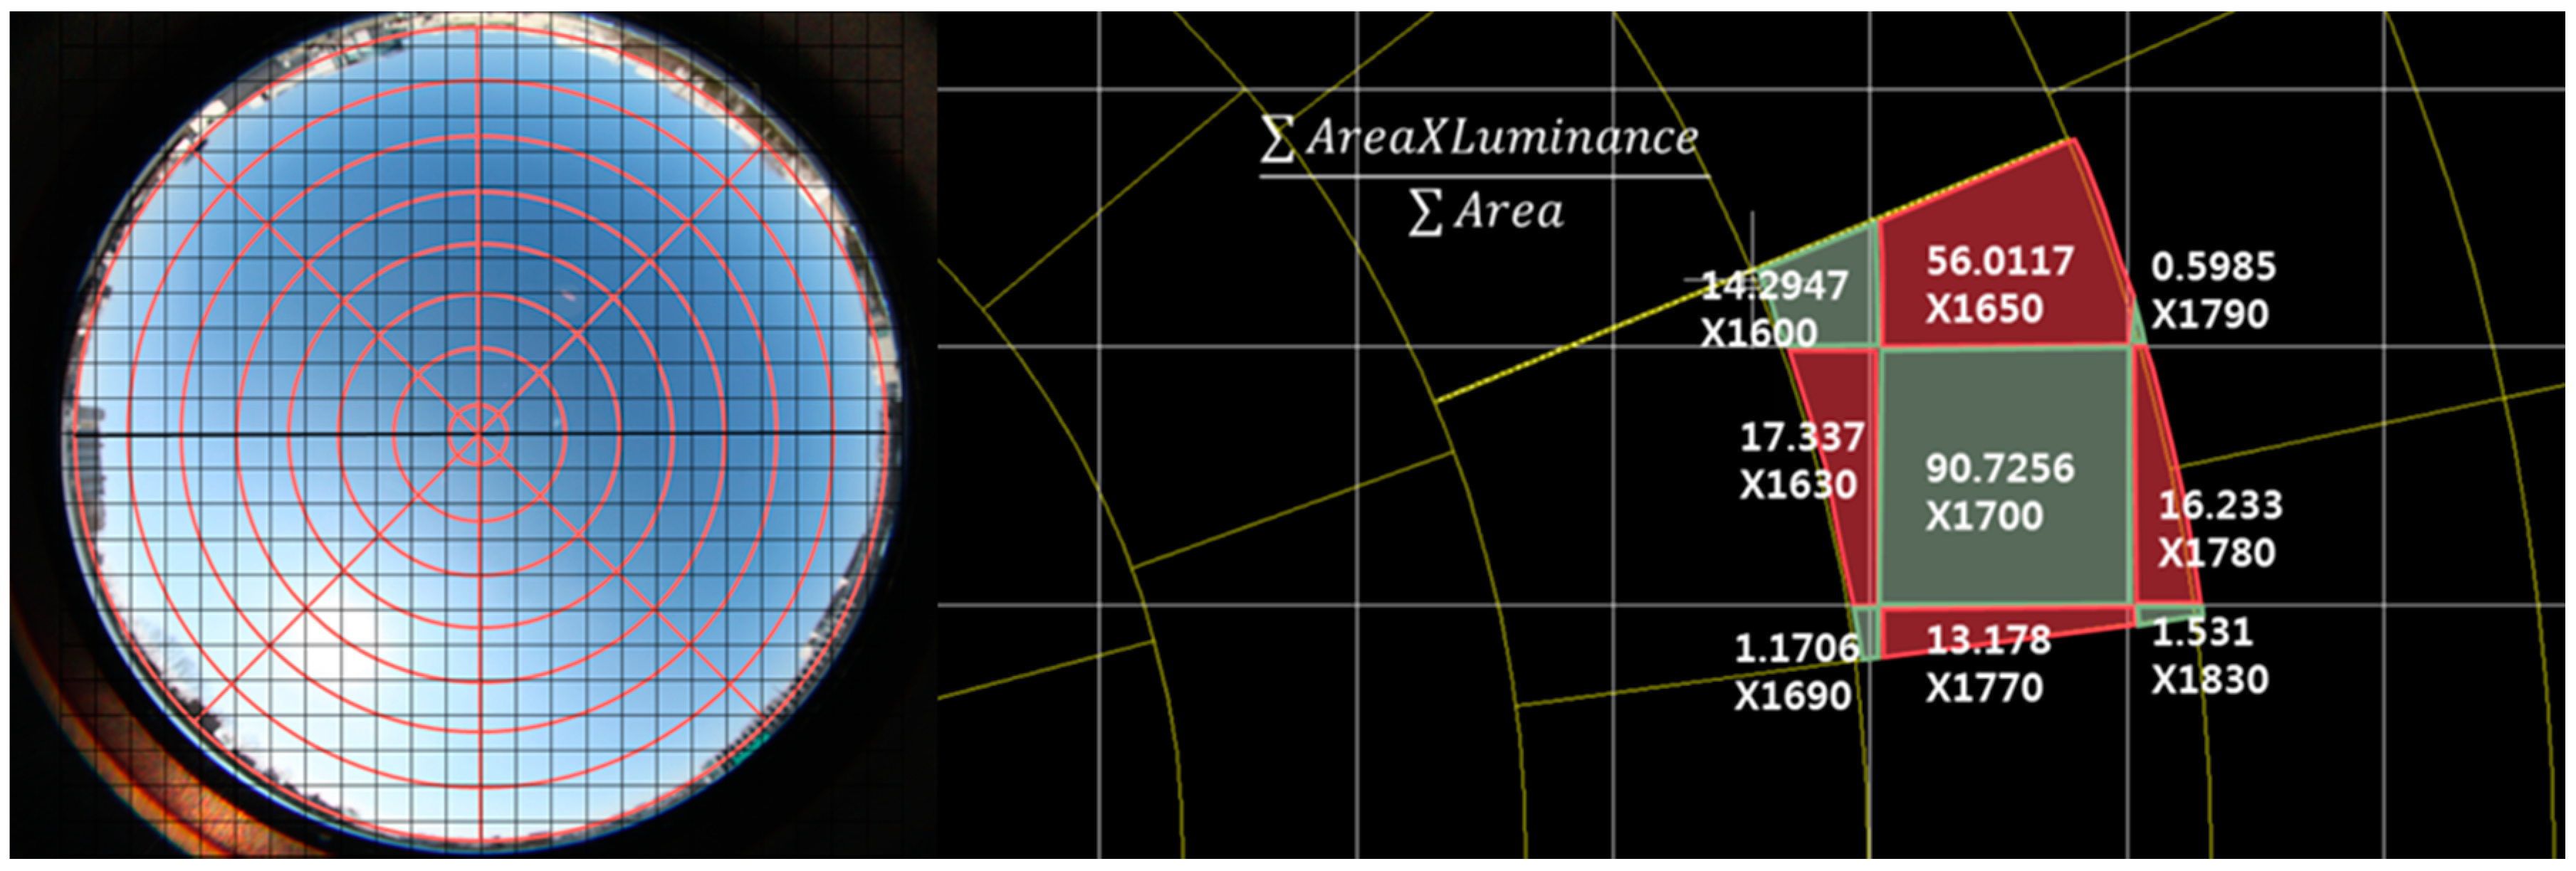
3.2.2. Analysis of Sky Luminance Distribution Using HDRI
3.2.3. Analysis of Sun Shade Necessity
3.3. Comparison Methods
- M is measured data,
- S is simulated data.
- Ninterval is the number of time intervals in the monitoring period.
4. Results
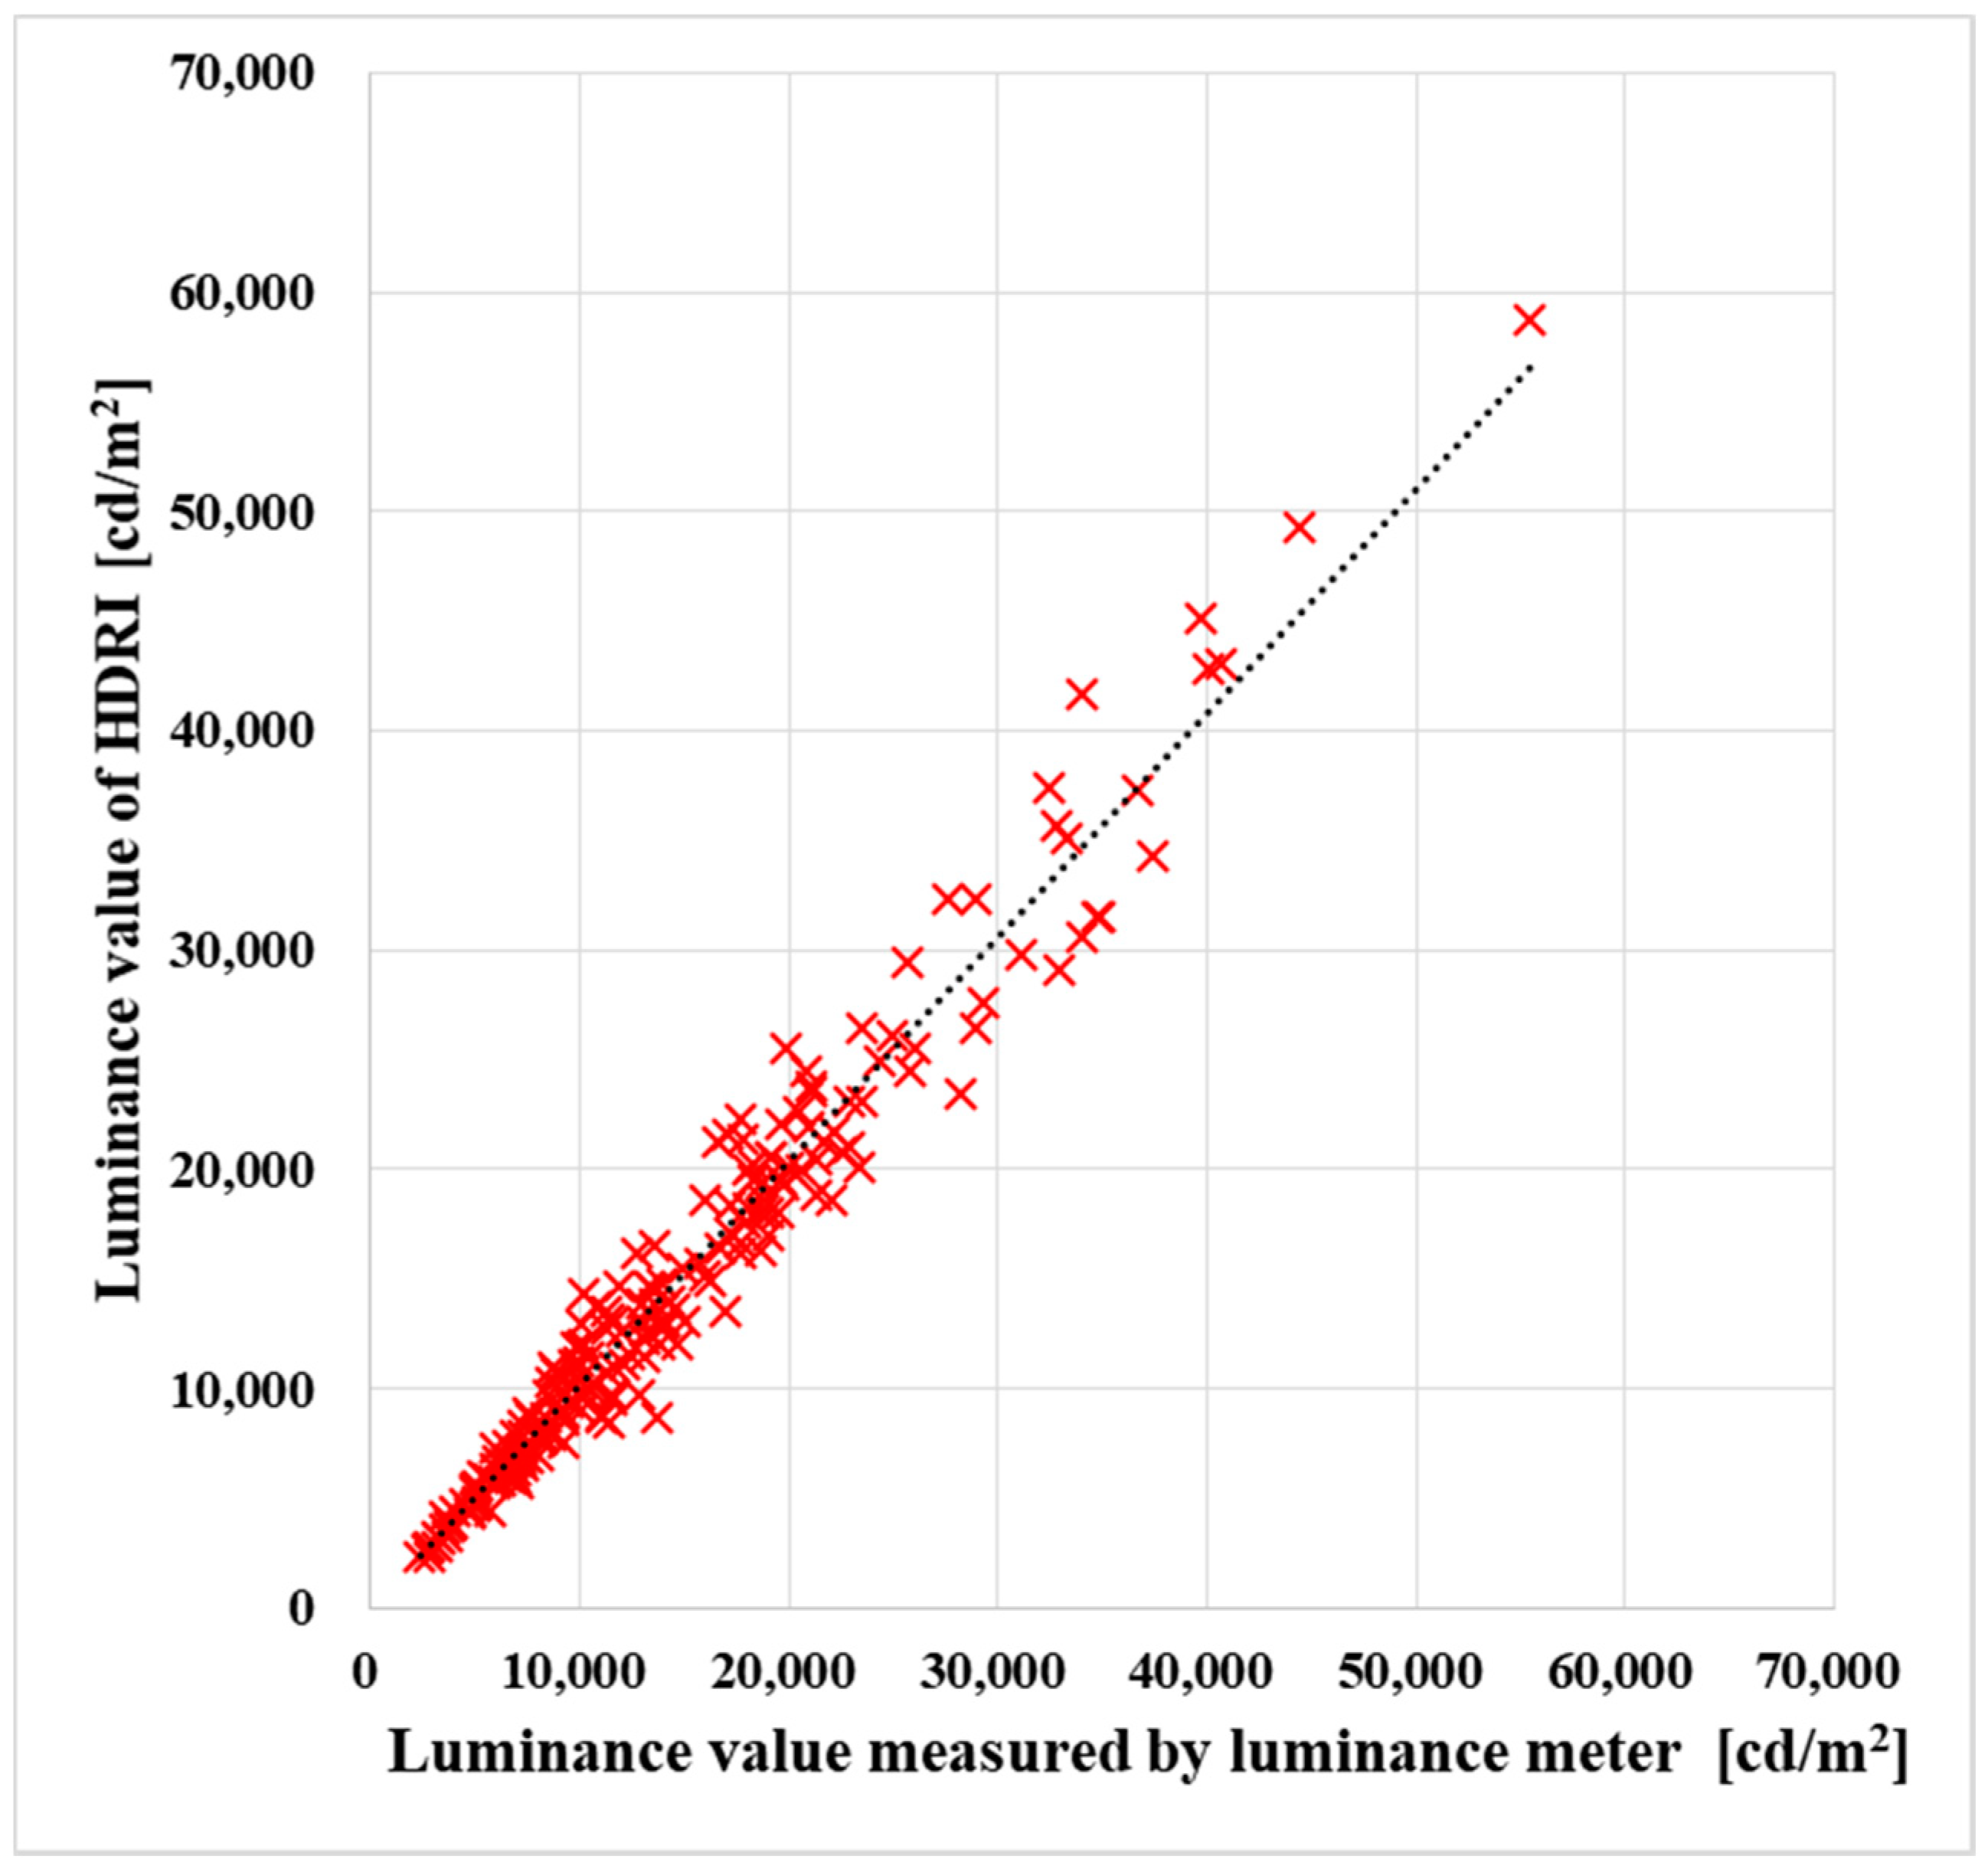
4.1. HDRI Verification Using Zenith Luminance
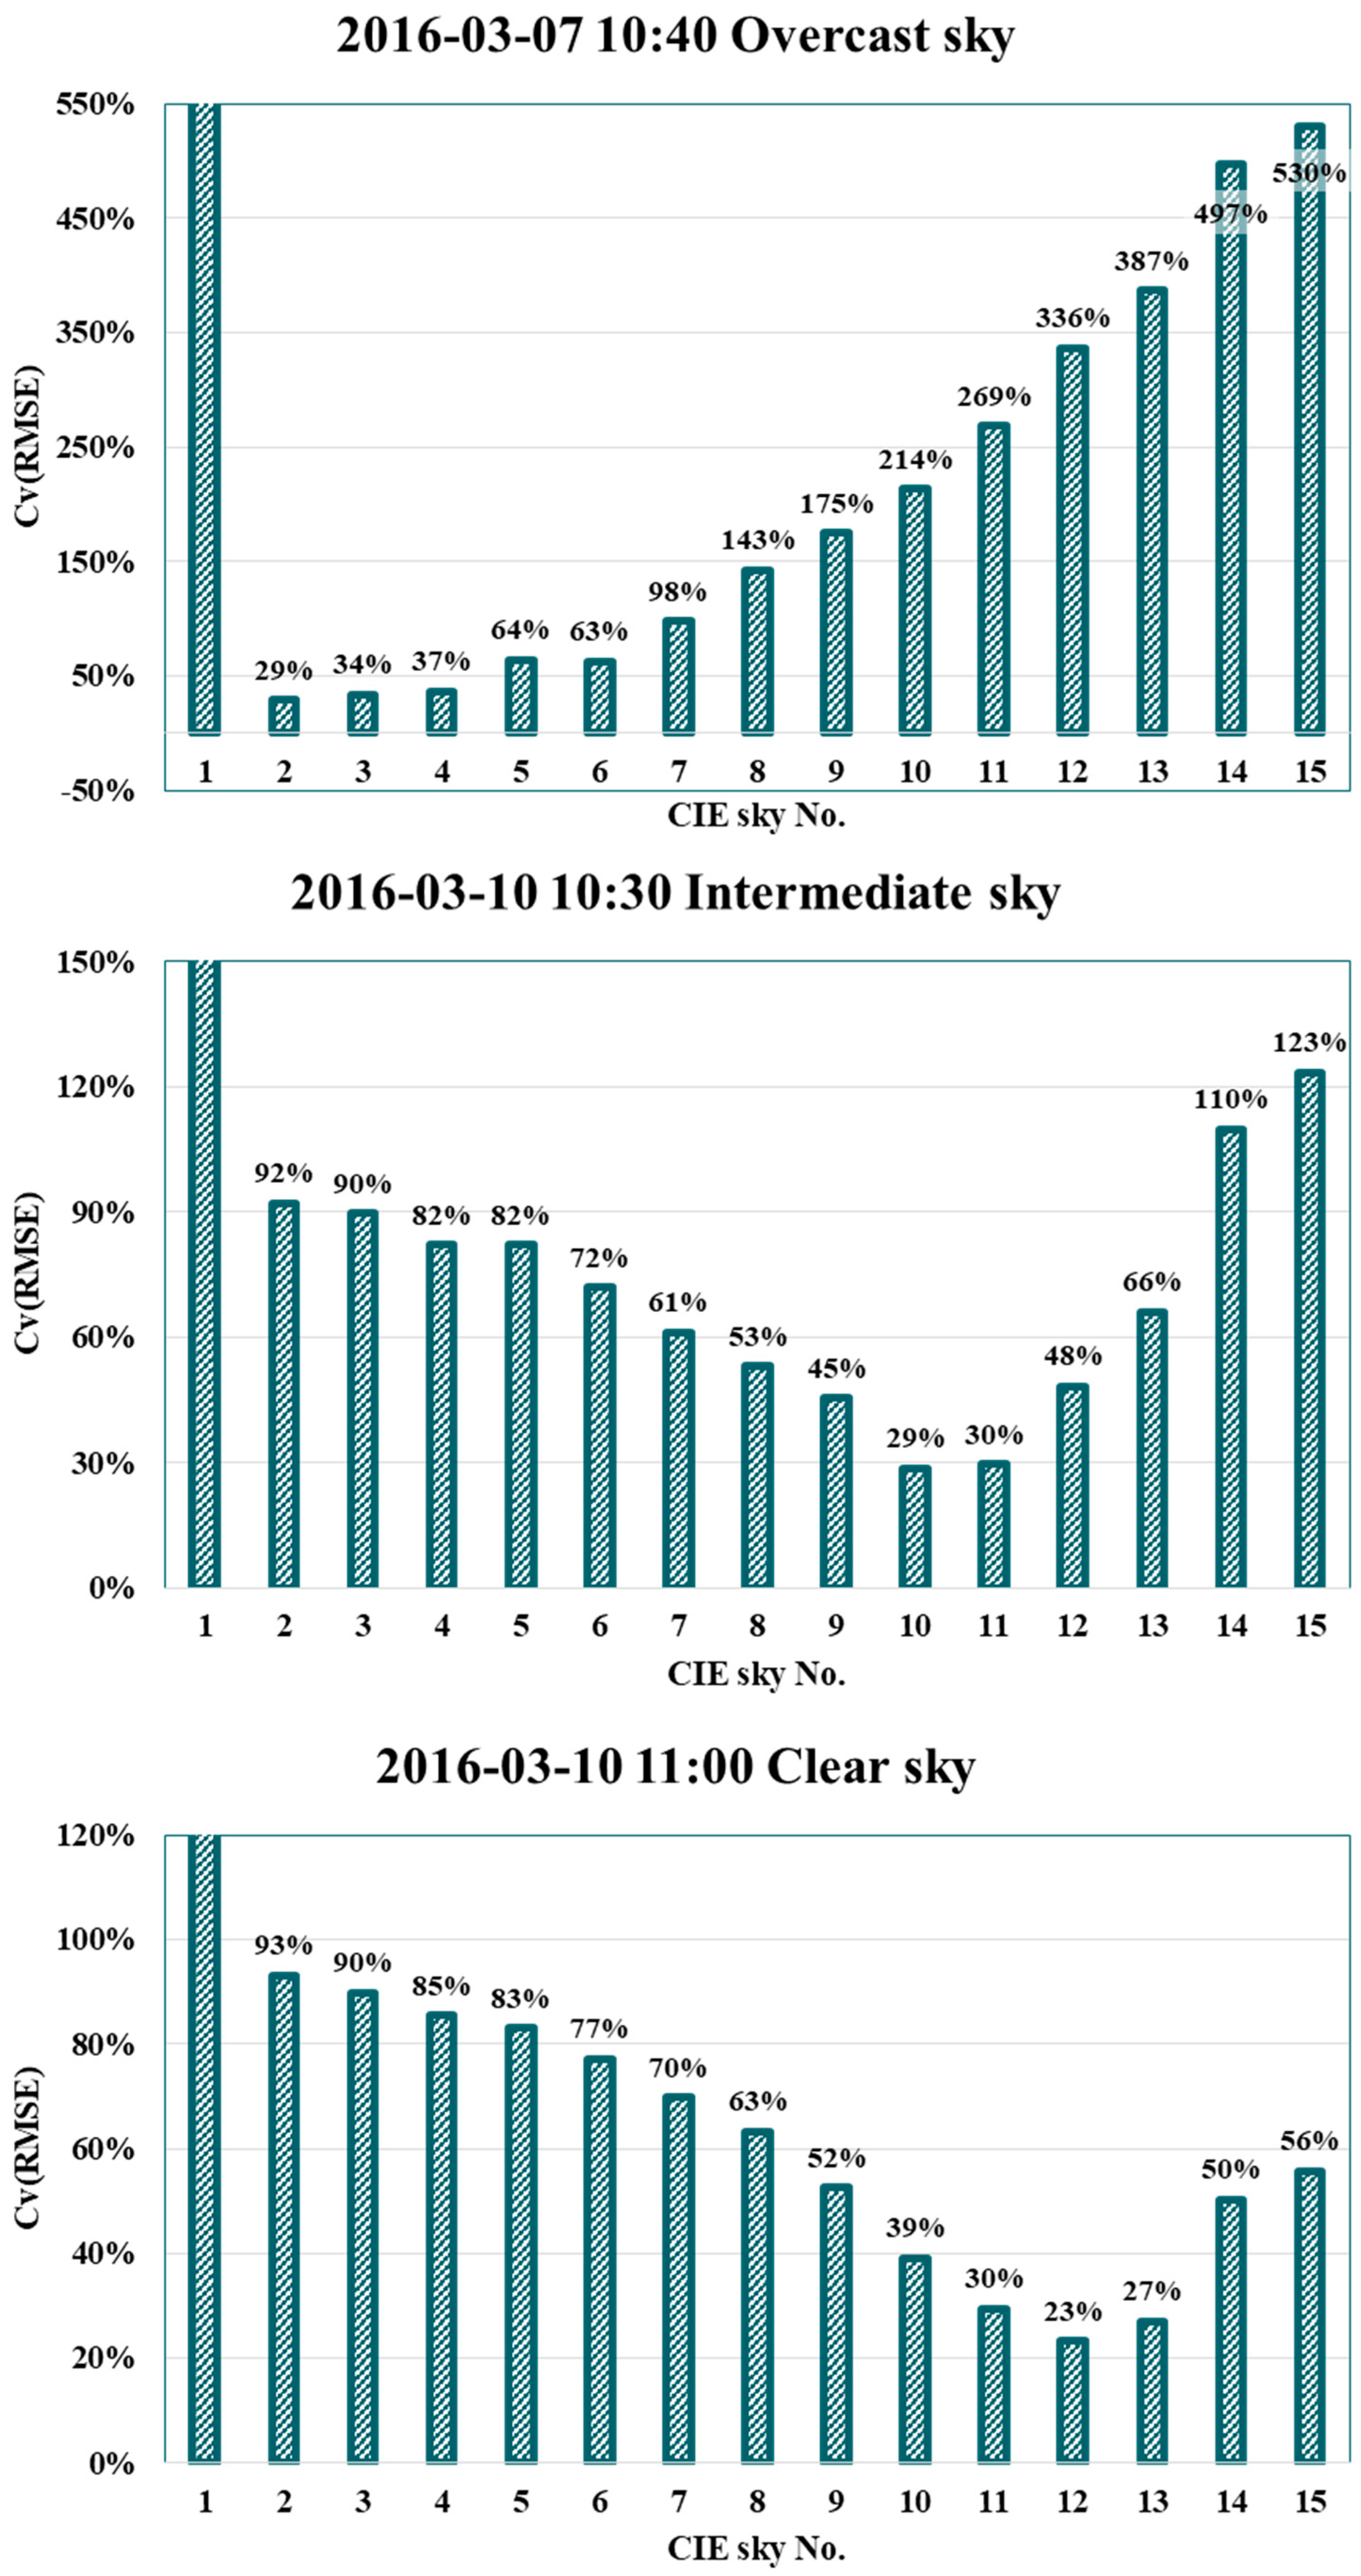
4.2. Calculation Method of CIE Standard Sky Model
4.3. Analysis of Sky Luminance Distribution Calculation Method
4.4. Analysis of Calculated Vertical Illuminances
4.5. Analysis of Calculated Interior Illuminance
5. Discussion and Conclusions
- Since the luminance near the sun is relatively large in the sky luminance measurement using a CCD camera, it may be necessary to cover the sun or use a filter to measure it. HDRI with a sun shade and HDRI without a sun shade were compared with each other. We used HDRI without a sun shade for the analysis because the error was not large.
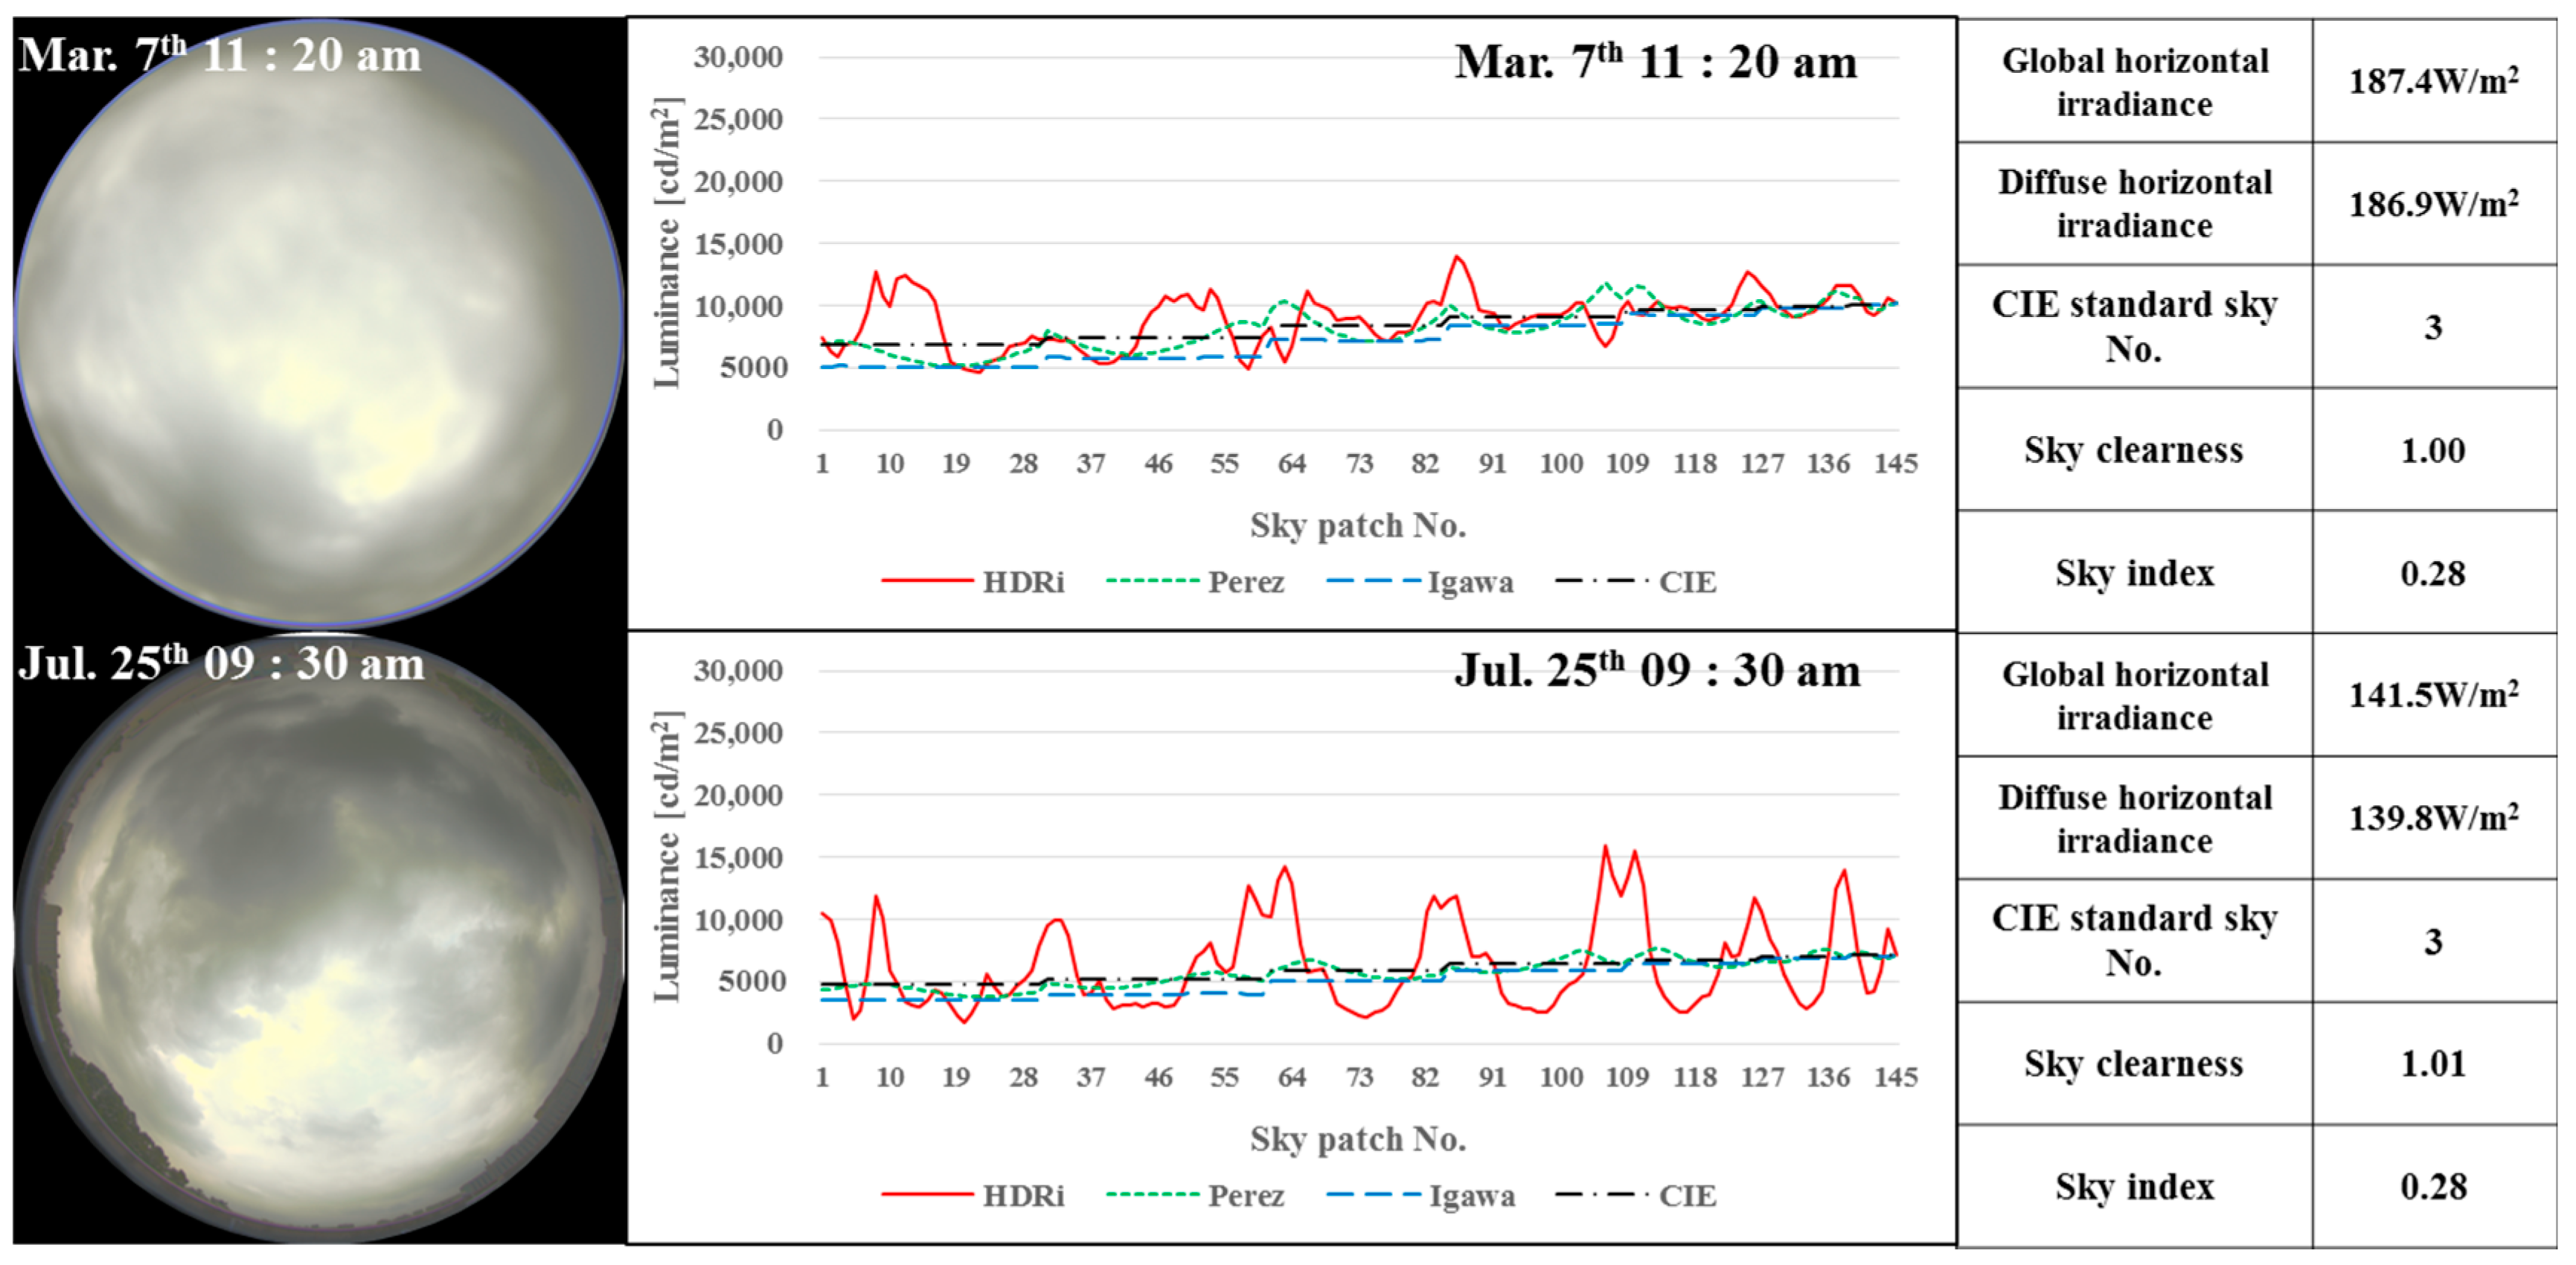
- When comparing March and July measurements with the sky luminance distribution model, the Igawa sky luminance distribution model and the Perez sky luminance distribution model both had higher error rates in July than in March. High solar altitude is known to increase the error of prediction results. Such result might be due to the high solar altitude in July. However, the result when meridian altitude was lower than 45.5 degrees was not verified by measurement. Therefore, additional verification is required when the meridian altitude is lower than 45.5 degrees.
- When intermediate skies based on the CIE standard sky model were analyzed, most sky conditions in March were calculated as intermediate sky in the Perez model and the Igawa model. However, in July, when the solar altitude was high, the CIE standard sky model was often closer to a clear sky than the Perez or Igawa model. The Igawa model was often closer to a clear sky than the Perez model.
- For R2, MBE, and Cv(RMSE) analysis, the CIE standard sky model showed the highest agreement rate and the lowest error rate. Between the Perez model and Igawa model, the Igawa model showed a lower error rate when HDRI was compared. However, the CIE standard sky model could only be used for calculation by knowing the luminance of the sky as a whole. Therefore, the Igawa model is the most suitable option for predicting sky luminance distribution with measured solar irradiance.
- Perez and Igawa models were used to calculate the vertical illuminance and internal illuminance. When comparing all sky conditions, the error between the Perez model and Igawa model did not differ greatly. This is due to the influence of the direct illuminance component. Because only diffuse illuminance was obtained by luminance distributions of the sky model, only overcast sky was compared. In vertical illuminance calculation, the error rate of the Igawa model was lower than that of the Perez model. This trend is consistent when comparing the measured HDRI to calculated sky model luminance distribution.
- Additional errors in sky luminance distribution might be due to the simplified measurement method, especially when it is near the horizontal plane because buildings could interfere with the analysis by being photographed in the HDRI.
- The Igawa model is better to use than the Perez model for diffuse illuminance calculations. The formula for calculating the vertical and the interior illuminance from sky luminance distributions continuously needs to be verified with more data. The CCD camera, which can measure in a relatively easy way, can help to collect this data.
Author Contributions
Acknowledgments
Conflicts of Interest
References
- Alrubaih, M.S.; Zain, M.F.M.; Alghoul, M.A.; Ibrahim, N.L.N.; Shameri, M.A.; Elayeb, O. Research and development on aspects of daylighting fundamentals. Renew. Sustain. Energy Rev. 2013, 21, 494–505. [Google Scholar] [CrossRef]
- Doulos, L.T.; Tsangrassoulis, A.; Topalis, F.V. Multi-criteria decision analysis to select the optimum position and proper field of view of a photosensor. Energy Convers. Manag. 2014, 86, 1069–1077. [Google Scholar] [CrossRef]
- Doulos, L.T.; Tsangrassoulis, A.; Kontaxis, P.A.; Kontadakis, A.; Topalis, F.V. Harvesting daylight with LED or T5 fluorescent lamps? The role of dimming. Energy Build. 2017, 140, 336–347. [Google Scholar] [CrossRef]
- Doulos, L.T.; Tsangrassoulis, A.; Topalis, F. Quantifying energy savings in daylight responsive systems: The role of dimming electronic ballasts. Energy Build. 2008, 40, 36–50. [Google Scholar] [CrossRef]
- Bellia, L.; Fragliasso, F.; Pedace, A. Evaluation of daylight availability for energy savings. J. Daylight. 2015, 2, 12–20. [Google Scholar] [CrossRef]
- Perez, R.; Seals, R.; Mechalsky, J. All-weather model for sky luminance distribution—Preliminary configuration and validation. Sol. Energy 1993, 50, 235–245. [Google Scholar] [CrossRef]
- Kittler, R.; Perez, R.; Darula, S. A new generation of sky standards. In Proceedings of the 8th European Lighting Conference (LUX Europa 1997), Amsterdam, The Netherlands, 11–14 May 1997; pp. 359–373. [Google Scholar]
- Igawa, N.; Koga, Y.; Matsuzawa, T.; Nakamura, H. Models of sky radiance distribution and sky luminance distribution. Sol. Energy 2004, 77, 137–157. [Google Scholar] [CrossRef]
- Brunger, A.P.; Hooper, F.C. Anisotropic sky radiance model based on narrow field of view measurements of shortwave radiance. Sol. Energy 1993, 51, 53–64. [Google Scholar] [CrossRef]
- Li, D.H.W.; Lau, C.C.S.; Lam, J.C. Evaluation of overcast-sky luminance models against measured Hong Kong data. Appl. Energy 2001, 70, 321–331. [Google Scholar] [CrossRef]
- Chirarattananon, S.; Chaiwiwatworakul, P. Distributions of sky luminance and radiance of North Bangkok under standard distributions. Renew. Energy 2007, 32, 1328–1345. [Google Scholar] [CrossRef]
- Markou, M.T.; Bartzokas, A.; Kambezidis, H.D. A new statistical methodology for classification of sky luminance distributions based on scan data. Atmos. Res. 2007, 86, 261–277. [Google Scholar] [CrossRef]
- Wittkopf, S.K.; Soon, L.K. Analysing sky luminance scans and predicting frequent sky patterns in Singapore. Light. Res. Technol. 2007, 39, 31–51. [Google Scholar] [CrossRef]
- Torres, J.L.; Blas, M.; Garcı’a, A.; Gracia, A.; Francisco, A. Sky luminance distribution in Pamplona (Spain) during the summer period. J. Atmos. Sol.-Terr. Phys. 2010, 72, 382–388. [Google Scholar] [CrossRef]
- Ferraro, V.; Mele, M.; Marinelli, V. Sky luminance measurements and comparisons with calculation models. J. Atmos. Sol.-Terr. Phys. 2011, 73, 1780–1789. [Google Scholar] [CrossRef]
- Ferraro, V.; Mele, M.; Marinelli, V. Analysis of sky luminance experimental data and comparison with calculation methods. Energy 2012, 37, 287–298. [Google Scholar] [CrossRef]
- Chauvin, R.; Nou, J.; Thil, S.; Grieu, S. Modelling the clear-sky intensity distribution using a sky imager. Sol. Energy 2015, 119, 1–17. [Google Scholar] [CrossRef]
- Li, D.H.W.; Lau, C.C.S.; Lam, J.C. Predicting daylight illuminance on inclined surfaces using sky luminance data. Energy 2005, 30, 1649–1665. [Google Scholar] [CrossRef]
- Li, D.H.W.; Cheung, G.H.W.; Cheung, K.L. Evaluation of Simplified Procedure for Indoor Daylight Illuminance Determination against Data in Scale Model Measurements. Indoor Built Environ. 2006, 15, 213–223. [Google Scholar] [CrossRef]
- CIE-Commision International de l’Eclairage. Spatial Distribution of Daylight––CIE Standard General Sky; International Commission on Illumination (CIE): Vienna, Austria, 2003. [Google Scholar]
- Pfster, G.; McKenzie, R.L.; Liley, J.B.; Thomas, A.; Forgan, B.W.; Long, C.N. Cloud Coverage Based on All-Sky Imaging and Its Impact on Surface Solar Irradiance. J. Appl. Meteorol. 2003, 42, 1421–1434. [Google Scholar] [CrossRef]
- Inman, R.H.; Pedro, H.T.C.; Coimbra, C.F.M. Solar forecasting methods for renewable energy integration. Prog. Energy Combust. Sci. 2013, 39, 535–576. [Google Scholar] [CrossRef]
- Kittler, R.; Darula, S. Perez, R. Advantages of new sky standards: More realistic modelling of daylight conditions in energy and environmental studies. Int. J. Energy Environ. Econ. 1999, 8, 65–71. [Google Scholar]
- Tregenza, PR. Analysing sky luminance scans to obtain frequency distributions of CIE Standard General Skies. Light. Res. Technol. 2004, 36, 271–281. [Google Scholar] [CrossRef]
- Darula, S.; Kittler, R. CIE general sky standard defining luminance distributions. In Proceedings of the 2002 Bi-annual IBPSA Conference, Montreal, QC, Canada, 12–13 September 2002; pp. 1–8. [Google Scholar]
- International Standardisation Organisation (ISO). Spatial Distribution of Daylight: CIE Standard General Sky; ISO Standard 15469:2004; CIE: Vienna, Austria, 2003. [Google Scholar]
- Ferraro, V.; Marinelli, V.; Mele, M. A method for selecting the CIE standard general sky model with regard to calculating luminance distributions. J. Atmos. Sol.-Terr. Phys. 2013, 95, 59–64. [Google Scholar] [CrossRef]
- Li, D.H.W.; Tang, H.L. Standard skies classification in Hong Kong. J. Atmos. Sol.-Terr. Phys. 2008, 70, 1222–1230. [Google Scholar] [CrossRef]
- Kasten, F.; Young, A. Revised optical air mass tables and approximation formula. Appl. Opt. 1989, 28, 4735–4738. [Google Scholar] [CrossRef] [PubMed]
- Vartiainen, E. Daylight modelling with the simulation tool DeLight. In Technical Report TKK-F-A799; Helsinki University of Technology: Espoo, Finland, 2000; pp. 76–85. [Google Scholar]
- De Rosa, A.; Ferraro, V.; Kaliakatsos, D.; Marinelli, V. Simplified correlations of global, direct and diffuse luminous efficacy on horizontal and vertical surfaces. Energy Build. 2008, 40, 1991–2001. [Google Scholar] [CrossRef]
- Gillette, G.; Pierpoint, W.; Treado, S. A general illuminance model for daylight availability. J. Illum. Eng. Soc. 1984, 13, 330–340. [Google Scholar] [CrossRef]
- Darula, S.; Kittler, R.; Gueymard, C.A. Reference luminous solar constant and solar luminance for illuminance calculations. Sol. Energy 2005, 79, 559–565. [Google Scholar] [CrossRef]
- Navvab, M.; Karayel, M.; Ne’eman, E.; Selkowitz, S. Analysis of atmospheric turbidity for daylight calculations. Energy Build. 1984, 6, 293–303. [Google Scholar] [CrossRef]
- Tregenza, P.R. Mean daylight illuminance in rooms facing sunlit streets. Build. Environ. 1995, 30, 83–89. [Google Scholar] [CrossRef]
- United States Department of Energy (DOE, US). Energy Plus Engineering Reference; United States Department of Energy: Washington, DC, USA, 2016; pp. 251–253.
- Bryan, H.J.; Clear, R.D. Calculation interior daylight illuminance with a programmable hand calculator. J. Illum. Eng. Soc. 1981, 10, 219–227. [Google Scholar] [CrossRef]
- Muneer, T.; Zhang, X. A New Method for Correcting Shadow Band Diffuse Irradiance Data. J. Sol. Energy Eng. 2002, 124, 34–43. [Google Scholar] [CrossRef]
- Giarma, C.; Tsikaloudaki, K.; Aravantinos, D. Daylighting and Visual Comfort in Buildings’ Environmental Performance Assessment Tools: A Critical Review. Procedia Environ. Sci. 2017, 38, 522–529. [Google Scholar] [CrossRef]
- Rossini, E.; Krenzinger, A. Maps of sky relative radiance and luminance distributions acquired with a monochromatic CCD camera. Sol. Energy 2007, 81, 1323–1332. [Google Scholar] [CrossRef]
- Chamaidi, T. Calibrated Sky Luminance Maps for Daylight Simulation. Master’s Thesis, TU Wien, Vienna, Austria, 27 June 2006; pp. 6–26. [Google Scholar]
- Anaokar, S.; Moeck, M. Validation of High Dynamic Range Imaging to Luminance Measurement. J. Illum. Eng. Soc. 2005, 2, 133–144. [Google Scholar]
- Inanici, M. Evalution of High Dynamic Range Image-Based Sky Models in Lighting Simulation. Leukos 2010, 7, 69–84. [Google Scholar] [CrossRef]
- Department of Energy (DOE). M&V Guidelines Measurement and Verification for Federal Energy Projects; Department of Energy Office of Energy Efficiency and Renewable Energy: Washington, DC, USA, 2000; pp. 4–22.
- Khan, M.M.; Ahmad, M.J. Estimation of global solar radiation using clear sky radiation in Yemen. J. Eng. Sci. Technol. Rev. 2012, 5, 12–19. [Google Scholar]
- Bartzokas, A.; Kambezidis, H.D.; Darula, S.; Kittler, R. Comparison between winter and summer sky-luminance distribution in Central Europe and in the Eastern Mediterranean. J. Atmos. Sol.-Terr. Phys. 2005, 67, 709–718. [Google Scholar] [CrossRef]







| Sky Type | Criteria | a–e Constant Calculation Method | |
|---|---|---|---|
| CIE standard general sky model | 15 sky types | not give clear criteria | Use fixed values for every 15 categories |
| Perez model | 8 sky types | sky clearness ε = {(GdH + GND)/GdH + 1.041 Zs3}/(1 + 1.041 Zs3) | Calculated using fixed constant given by the category and sky brightness, depending on the state of the sky. |
| Igawa model | Continuous (5 sky types) | Sky index Si = Kc + Cle0.5 Kc = GgH/Seeg Cle = (1 − Ce)/(1 − Ces). | Calculated using the same formula regardless of category |
| No. | Quantities | Sensors and Manuf. | Interval | |
|---|---|---|---|---|
| 1 | Irradiance | Global Horizontal | LP-PYRA12, 02 | 1 s |
| 2 | Diffuse Horizontal | LP-PYRA12, 02 | 1 s | |
| 3 | Illuminance | Global Vertical | Minolta T-10 illuminance meter | 10 m |
| 4 | Internal center point | Minolta T-10 illuminance meter | 10 m | |
| 5 | Luminance | Zenith | Minolta luminance meter LS-110 | 10 m |
| 6 | Sky image | Canon EOS 5D | 10 m |
| Real Size of Room | 2.7 m(W) × 5 m(D) ×2.8 m(H) |
|---|---|
| Scale | 1:5 |
| Reflectance | Ceiling 71%, Wall 57.8%, Floor 21.7%, |
| WWR | 50% |
| Transmittance | 100% (no glass) |
| Direction | South |
| MBE | 0.9% |
| RMSE | 1761 (lx) |
| Cv(RMSE) | 12.1% |
| R2 | 0.99 |
| t-stat | 0.00007 |
| MBE | RMSE | Cv(RMSE) | R2 | ||
|---|---|---|---|---|---|
| CIE | March | −0.3% | 1861 (cd/m2) | 26.1% | 0.96 |
| July | 4.9% | 4988 (cd/m2) | 36.4% | 0.92 | |
| All data | 3.4% | 3944 (cd/m2) | 36.4% | 0.93 | |
| Perez | March | −7.8% | 2633 (cd/m2) | 37.0% | 0.92 |
| July | 19.3% | 8673 (cd/m2) | 63.2% | 0.82 | |
| All data | 11.6% | 6744 (cd/m2) | 62.2% | 0.83 | |
| Igawa | March | −16.7% | 2829 (cd/m2) | 39.7% | 0.91 |
| July | 0.1% | 5323 (cd/m2) | 38.8% | 0.91 | |
| All data | −4.7% | 4414 (cd/m2) | 40.7% | 0.91 |
| MBE | RMSE | Cv(RMSE) | R2 | t-Stat | |
|---|---|---|---|---|---|
| Perez | 11% | 8584 (lx) | 20% | 0.97 | 0.00031 |
| Igawa | 3% | 5868 (lx) | 14% | 0.99 | 0.00014 |
| MBE | RMSE | Cv(RMSE) | R2 | t-Stat | |
|---|---|---|---|---|---|
| Perez | 86% | 12,532 (lx) | 103% | 0.72 | 0.00082 |
| Igawa | 6% | 1993 (lx) | 22% | 1.00 | 0.00027 |
| MBE | RMSE | Cv(RMSE) | R2 | t-Stat | |
|---|---|---|---|---|---|
| Perez | 13% | 1174 (lx) | 22% | 0.97 | 0.00263 |
| Igawa | 6% | 982 (lx) | 18% | 0.98 | 0.00150 |
| MBE | RMSE | Cv(RMSE) | R2 | t-Stat | |
|---|---|---|---|---|---|
| Perez | 57% | 1364 (lx) | 70% | 0.92 | 0.00499 |
| Igawa | −4% | 210 (lx) | 15% | 0.98 | 0.00162 |
© 2018 by the authors. Licensee MDPI, Basel, Switzerland. This article is an open access article distributed under the terms and conditions of the Creative Commons Attribution (CC BY) license (http://creativecommons.org/licenses/by/4.0/).
Share and Cite
Yun, S.-I.; Kim, K.-S. Sky Luminance Measurements Using CCD Camera and Comparisons with Calculation Models for Predicting Indoor Illuminance. Sustainability 2018, 10, 1556. https://doi.org/10.3390/su10051556
Yun S-I, Kim K-S. Sky Luminance Measurements Using CCD Camera and Comparisons with Calculation Models for Predicting Indoor Illuminance. Sustainability. 2018; 10(5):1556. https://doi.org/10.3390/su10051556
Chicago/Turabian StyleYun, Su-In, and Kang-Soo Kim. 2018. "Sky Luminance Measurements Using CCD Camera and Comparisons with Calculation Models for Predicting Indoor Illuminance" Sustainability 10, no. 5: 1556. https://doi.org/10.3390/su10051556
APA StyleYun, S.-I., & Kim, K.-S. (2018). Sky Luminance Measurements Using CCD Camera and Comparisons with Calculation Models for Predicting Indoor Illuminance. Sustainability, 10(5), 1556. https://doi.org/10.3390/su10051556


