Abstract
This paper presents a cost optimal model of electric vehicle taxi systems based on the cost of electric vehicle taxi companies, charging or battery swap stations, passengers’ time, and emission costs. Considering the requirement of meeting passengers’ travel demands, an electric taxi demand model using transportation elasticity is formulated to optimize the number of electric taxis. The electric taxi demand model constitutes the measure of electric taxis, the cruise range, the amount of charging or battery swap stations, and other related factors. Simultaneously, to meet the charging requirements of electric taxis, a layout optimal model of EVSE (electric vehicle supply equipment) is designed using a Voronoi polygon method aimed at the cost of charging or battery swap stations and the range cost for changing. Finally, these aforementioned models are mixed to calculate the scale of electric taxis, the allocation of vehicle models, the optimizing level, and the site distribution of charging or battery swap stations. The key findings include the following: (1) the cost of the BEV(battery electric vehicle) taxi system is lower in the charging model than in the battery swap model, (2) the cost of the PHEV taxi system is lower than the BEV taxi system in the charging model, (3) in the Tongzhou District of Beijing, five charging or battery swap stations required being found to meet the charging demands of 5557 BEVs in the charging model or 5316 BEVs in the battery swap model, (4) according to the passengers’ travel demands and traffic conditions in Tongzhou, the BEV’s cruise range ought to be 250 km and BEV’s battery capacity should be 42.5 kW, the price of PHEV should be under 24,000 RMB and the electric-powered cruise range needs to be under 100 km, the daily operating time of EVs is around 16 h and the daily operating range is controlled under 380 km, and (5) a carbon tax is suggested to be imposed on ICEVs but the price should be under 20 RMB per ton.
1. Introduction
With increasing support of national policy, the domestic electric taxi scale has been expanding. Until October 2015, the total number of electric taxis has reached 7526 [1]. Several influential factors, such as methods of electric energy supply, charging time, and charging distance, must be considered, particularly on electric taxis. These factors are closely related to passengers’ traveling needs, charging facilities layout, the scale of electric taxis, vehicle performance, etc., indicating that the electric taxi operating system is quite complex. Therefore, it is necessary to seek an optimization for electric taxi system design, which can meet passengers’ travel demands, reduce the operating cost of electric taxi system, and improve the utilization rate of charging facilities.
2. Literature Review
In the past several years, researchers around the world have studied taxis, concentrating more on the path planning, travel demand calculation, forecast of taxis’ quantity, operational economic benefits, and so on. In the 1980s, Daganzo [2], University of California, proposed an optimization model of public transport system to predict the average waiting time of public transport and ride time. Seyed Mohammad Nourbakhsh [3] proposed a flexible route bus system model, which means that buses do not have fixed stops, allowing passengers to enter and leave from buses within a limited range. It has very similar characteristics to the taxi operating model. Douglas [4], De vany [5], Shrieber [6], and other researchers calculated the scale of taxis with the assumption that the taxi demand and supply is evenly distributed among particular day. Salanova [7] and Schaller [8] adopted the economic model to project the number of taxis in the cost-optimal cases. Tommy Carpenter [9] analyzed the investment and benefits of electric taxis from the perspective of electric taxi operators. Nakul Sathaye [10] calculated the operational economic benefits of the electric taxi system with the aim of minimizing the total cost of passengers, taxis, and charging stations under the assumption that demand and supply are evenly distributed.
There are many research projects in the field of traditional taxis focused on aspects of prediction on the scale of electric taxis, supply and demand balance research, service pricing, operation mode, etc. Research on electric taxis, in contrast, is mainly focused on business models, operating income, service pricing, and charging facilities optimization. By contrast, very few studies are conducted on the synthesis of electric taxi systems including parameters such as passengers, electric taxis, charging, or battery swap stations. Lu Jian and Wang Wei [11] proposed a method for forecasting the number of urban taxis. According to the taxi unloaded ratio, the average vehicle operating speed, the effective mileage, and average daily operating time, the number of taxis of current time and of a certain year can be predicted. Through an analysis of taxi drivers and passengers, Zhang Ying, Chen Zhan [12], and others calculated a reasonable taxi starting price, encouraging drivers to choose the shortest route to send passengers. Using the cash flow method and value chain theory, Cai Yixin and Wang Hewu [13] gave an analysis of two business models, which are electric taxi’s fast charge mode in Shenzhen and fast battery swap mode in the Hangzhou cities of China. Guo Ying’s [14] financial analysis shows that one necessary condition of electric taxi projects is whether the electric taxi has enough operating time, in which the shift operation time should be at least 10 h. Based on the whole life cycle cost model, the cost of charging or battery swap stations is included in the operating cost of the electric taxi system. The total operating cost of electric taxis and traditional taxis is analyzed and compared as well. Guided by the going-rate pricing method and supported by the break-even analysis method, Gong Zaiyan [15] established Shanghai electric taxi service prices. According to vehicle purchasing cost, vehicle using cost, drivers’ salary, and vehicle operating income, Wang Ning [16] and Fu Gangzhan established the electric taxis’ evaluation model of full life-cycle economic benefits. In addition, under the three following conditions: the rise of electricity price, the rise of gasoline price, and the drop of battery price, they analyzed the service price of the electric taxis. Zhang Di [17] established the electric taxi charging station service system model using the queuing theory, and constructed the optimal model of electric taxi charging piles, with the minimum cost of charging station service systems, as the objective function.
3. The Costs and Optimization Goal of Electric Taxi System
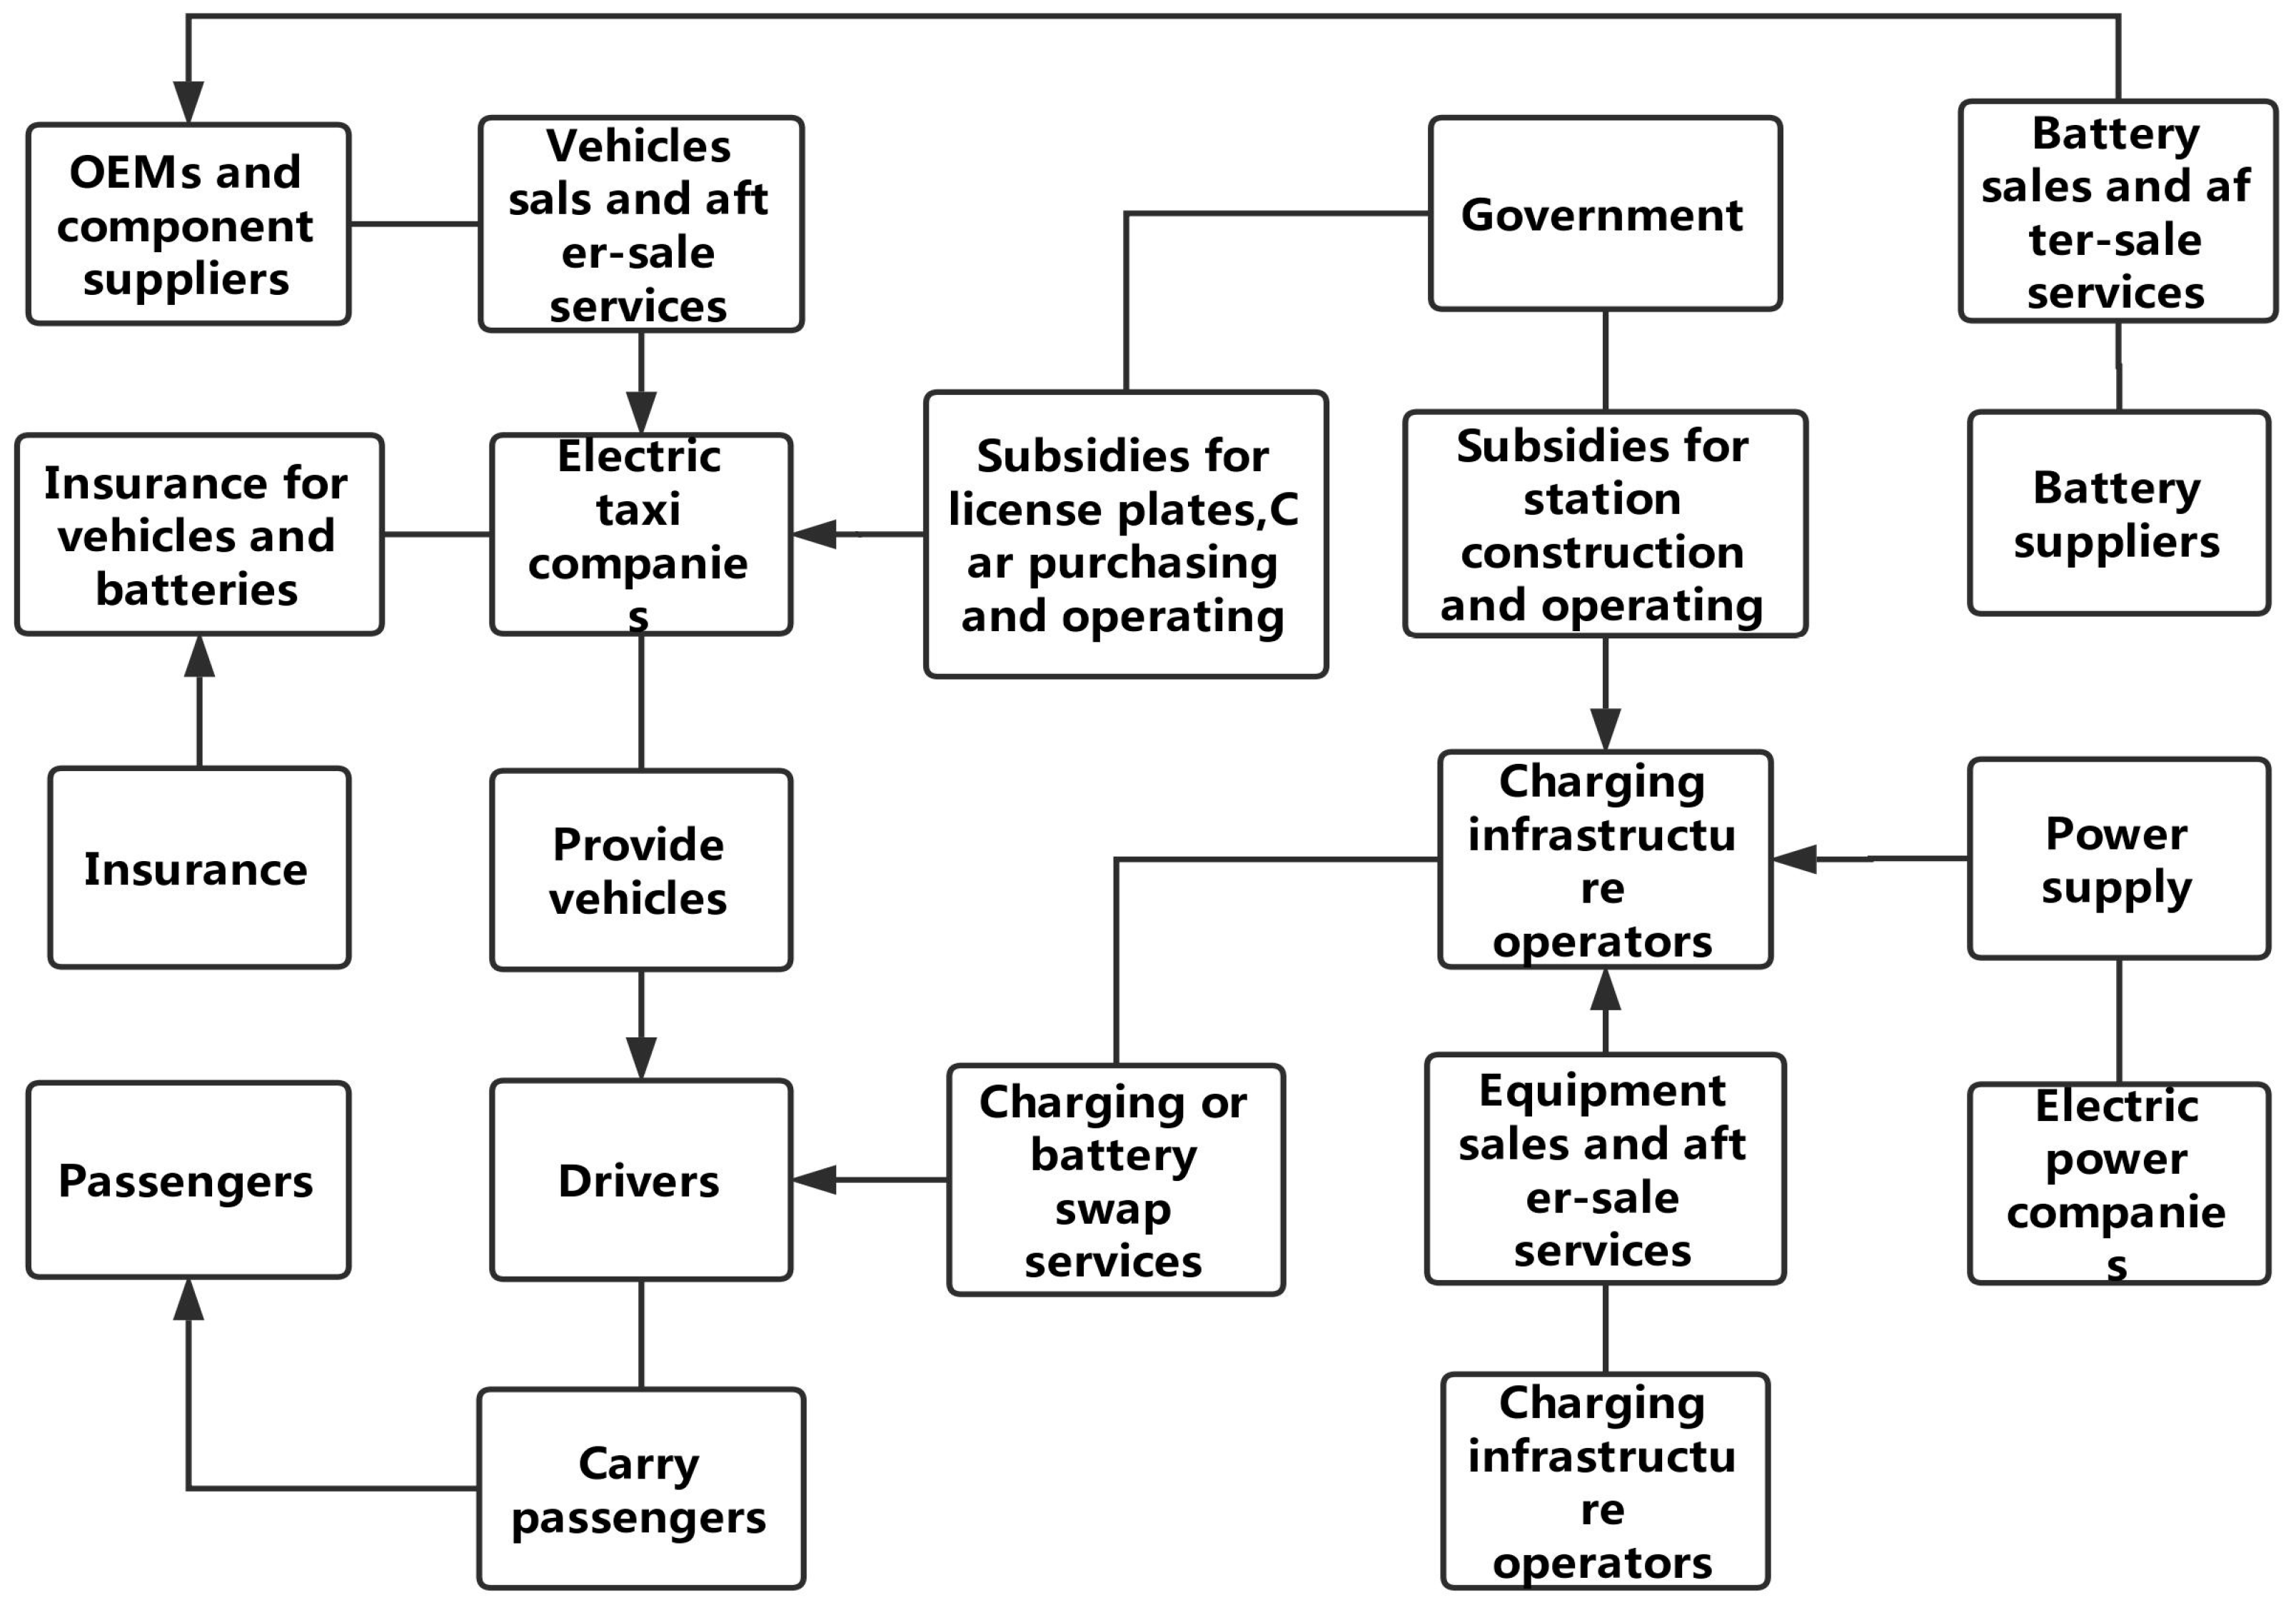
The main players behind the electric taxi system include the government, charging infrastructure operators, charging infrastructure suppliers, electric power companies, OEMs, and also component suppliers, battery suppliers, electric taxi companies, drivers, and passengers, as shown in Figure 1. The total costs of the system are shown from the perspective of different actors (see Table 1).

Figure 1.
The participants, actors, and relations of electric taxi systems.

Table 1.
The cost structure of electric taxi systems.
The cost of the electric taxi system in this paper covers the costs of electric-powered taxi companies, charging or battery swap stations, and passengers’ waiting times with those of the government, electric power companies, OEMs, and component suppliers temporarily excluded. In addition, the carbon emission cost of electric taxis is also taken into account in this paper as a way to display the beneficial emission reduction brought by the electric vehicles. A more complete cost system has taken shape.
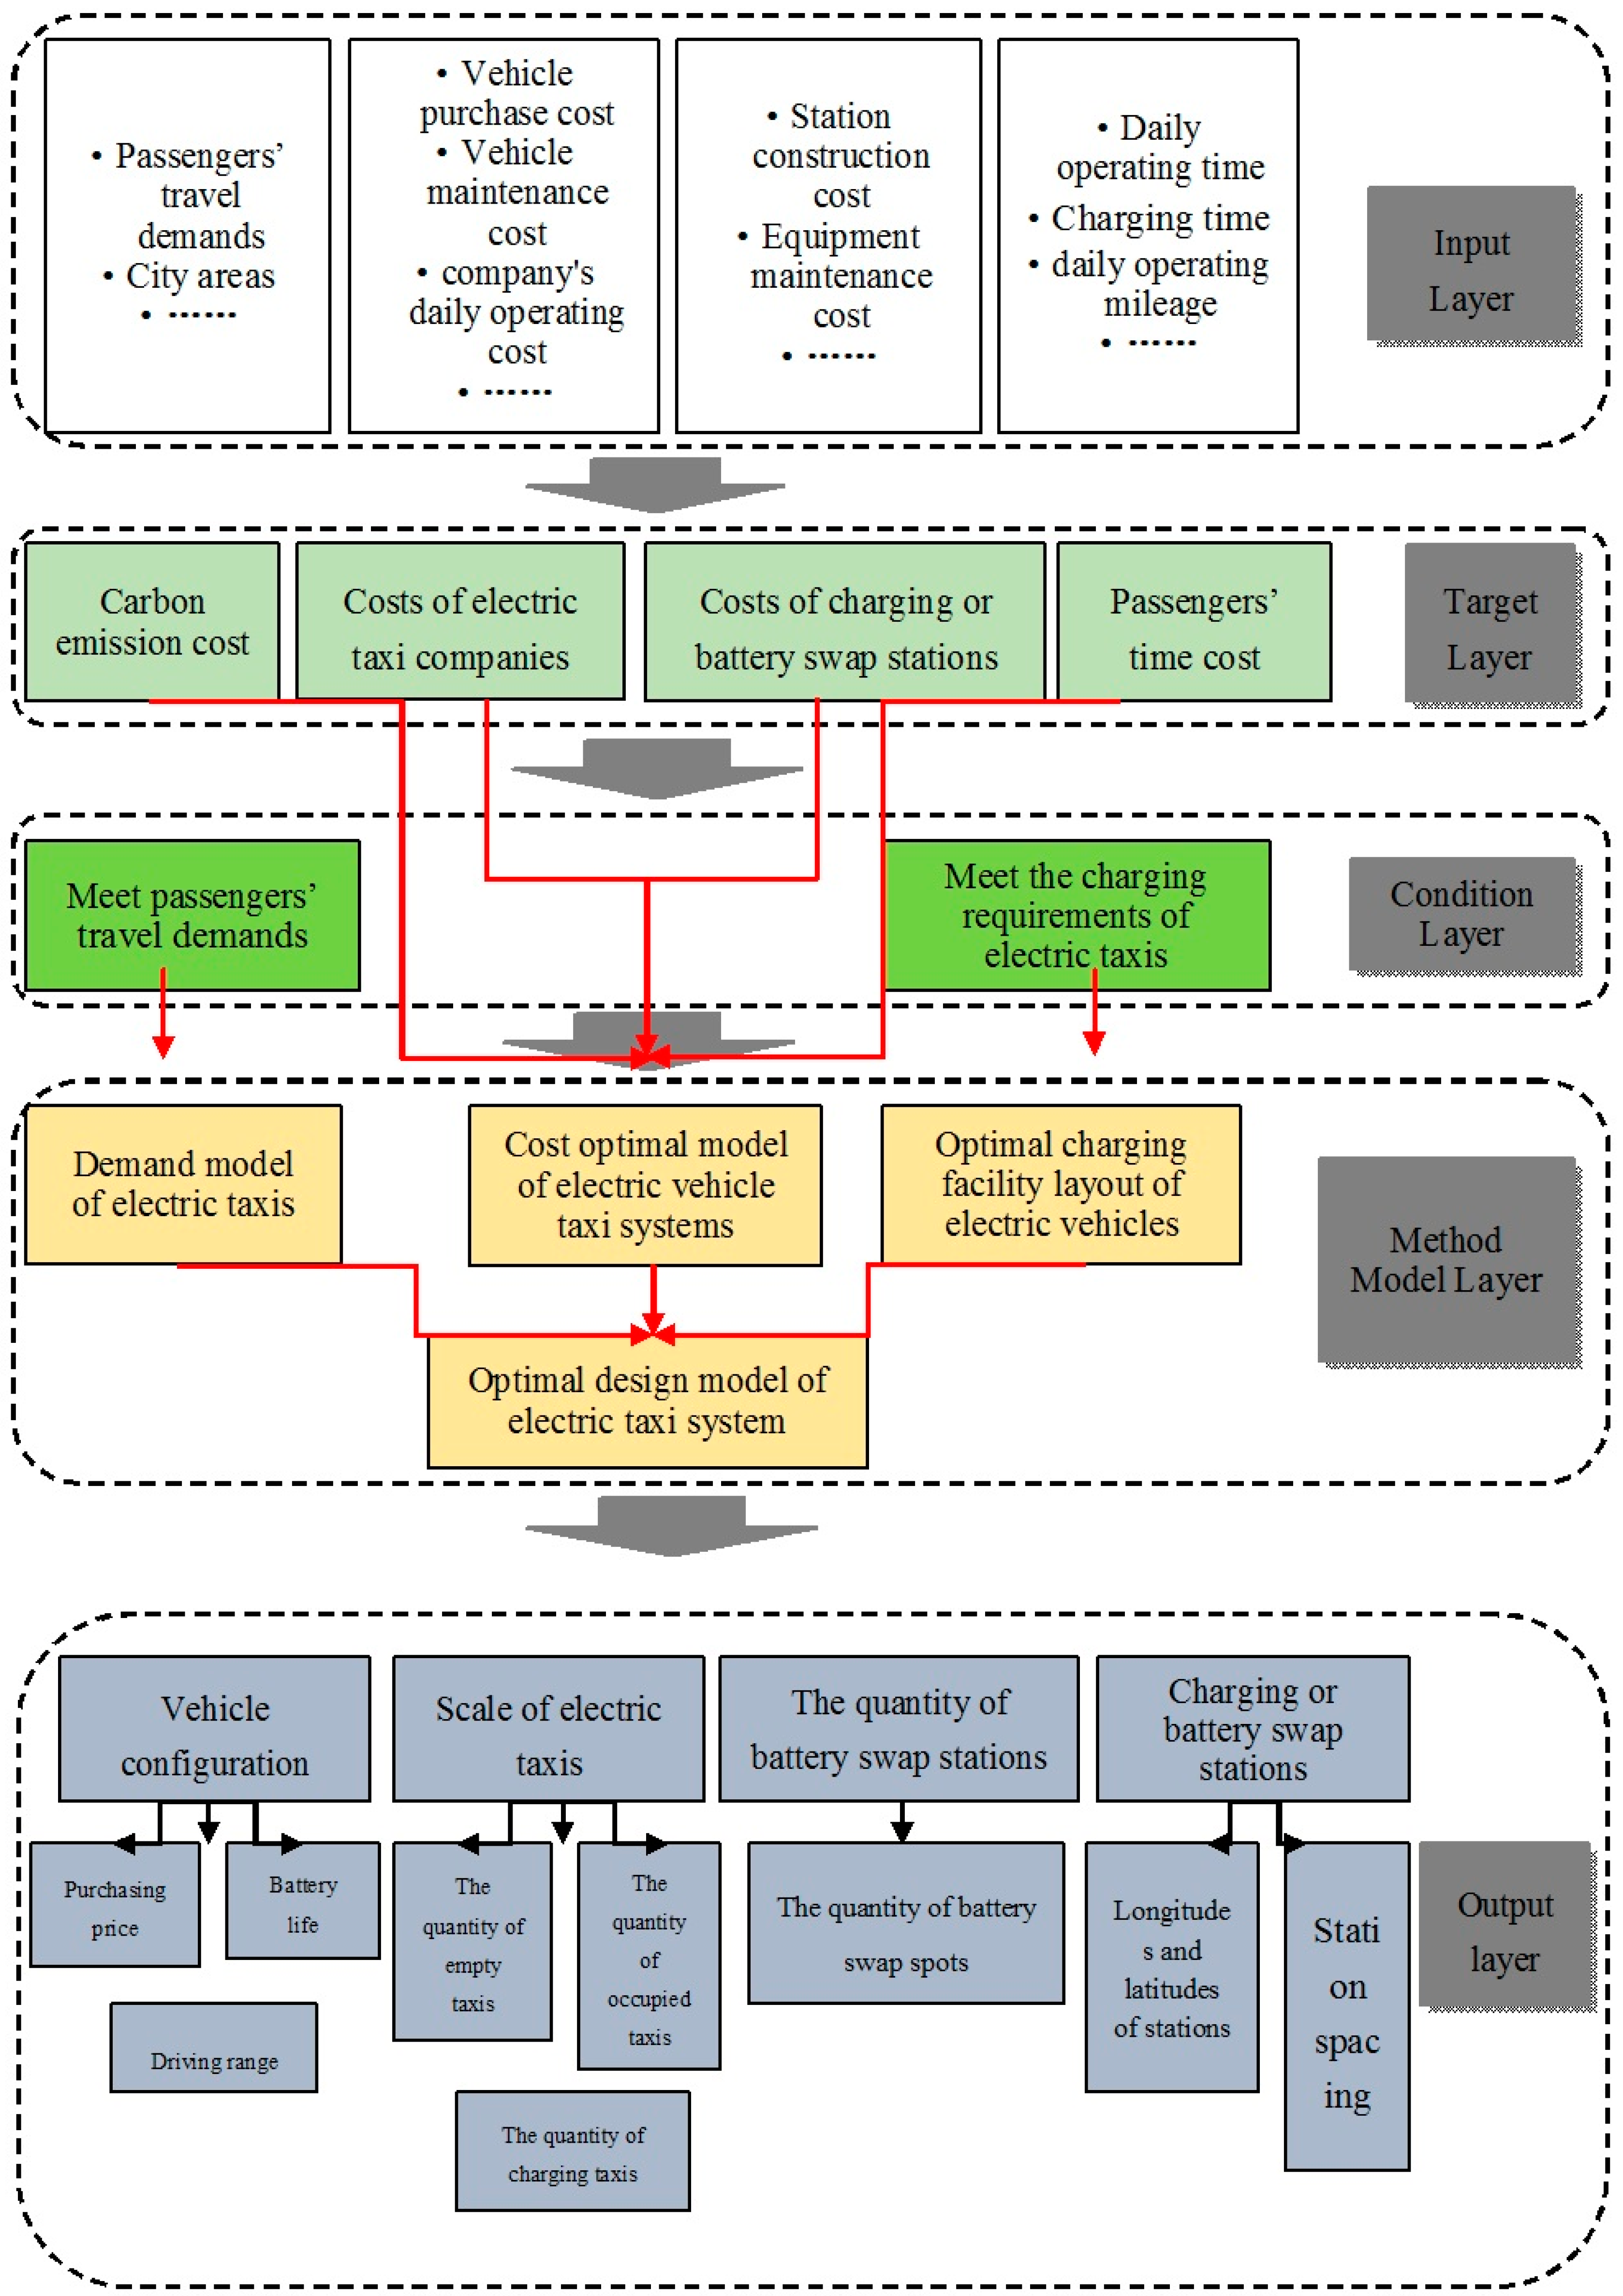
This paper aims to design a more reasonable electric system where passengers can get anywhere they need to and the vehicles can be timely charged with the objective of minimizing the total costs of electric-powered taxi companies, charging or battery swap stations, passengers’ time cost, and carbon emission cost. This entails optimizing the scale of electric taxis, vehicle allocation, quantity, and the locations of charging or battery swap stations. The optimization method and process are shown in Figure 2.

Figure 2.
The Optimization method and process of electric taxi systems.
4. The Optimal Design Model of Electric Vehicle Taxi System
The four unique taxi types, drive-ICEV, HEV, PHEV, and BEV, are chosen to make the comparison and analysis of their system costs.
The following are the assumptions of the research focus:
- (1)
- The passengers’ travel demands change from time to time. The number of taxis allocated in this paper is based on the passengers’ demands for travel in rush hours.
- (2)
- Drivers for hire regularly pick up passengers who are nearest to them in order to increase their frequency of picking up passengers.
- (3)
- Passengers can ask for taxi services either by waving their hands on the street or using taxi-locating Apps on their phones.
- (4)
- Not considering the temporary traffic jam conditions, an assumption is made that the vehicles travel at a uniform speed in the whole operating area.
- (5)
- Drivers always look for passengers in the least competitive area, i.e., the areas with the lowest density of cars for hire, but other driving behaviors are not taken into account.
Aimed at achieving the minimum total cost of electric vehicle taxi systems, and the realization of an optimal design model of electric vehicle taxi systems, this paper does not take into consideration the profit situations of vehicle taxis or the charging or battery swap stations.
4.1. The Cost Optimal Model of Electric Vehicle Taxi Systems
The cost of electric vehicle taxi systems can be divided into the four following units: the cost of electric vehicle taxi companies, the cost of charging or battery swap stations, the cost of passengers’ time, and the cost of emission. The cost of charging or battery swap stations is not included in the cost accounting of ICEV and HEV. Due to the fact that the cost of passengers’ travel is measured in hours, all the costs mentioned in this paper will be converted to and measured uniformly in a similar way.
- (1)
- The cost of electric vehicle taxi companies
The cost of electric vehicle taxi companies includes two sections. The first is the cost of energy consumption and taxis maintenance, both of which are related to the taxi’s travel distance, called the distance cost. The second one is the cost of the company’s daily operation and taxi depreciation, both of which are related to time, thus we call it the cost of operating hours.
The operating cost of ICEV, HEV, and PHEV taxi companies can be calculated with the following equations:
In the formula, is the cost of electric vehicle taxi companies, and its unit is hour. is the factor of distance cost, and its unit is . is the factor of cost of operating time, and its unit is hour/one car. M is the total number of taxis and its unit is the numbers of cars. is the number of cars carrying passengers and its unit is the number of cars. is the number of cars for hire and its unit is the number of cars. is the time spent in carrying one passenger and its unit is hour. is the distance of carrying passengers and its unit is km. is the distance of picking up passengers and its unit is km. is the cruising distance and its unit is km. is the percentage of passengers waving their hands on the street for taking cars. is the time of getting on a car and its unit is hour. is the time of getting off a car and its unit is hour. is the average travel speed of carrying passengers or picking up passengers, and its unit is km/h. is the average travel speed of cruising and its unit is km/h.
The factor of distance cost is:
In this formula, is the costs for vehicle fuel and its unit is RMB/km. is the costs for vehicle maintenance and its unit is RMB/km. is the value of per hour (per capita GDP/the average working hour annually), and its unit is RMB/h. means the passengers’ travel demand and its unit is one person*one time/h.
The factor of cost of operation time is:
In this formula, is the daily operating cost of the companies and its unit is RMB/h. means the taxis depreciation and its unit is RMB/h.
The operating cost for BEV taxi company is:
In this formula, is the total amount of time spent in rooms for charging or swapping batteries twice (including the time for charging and swapping battery) and its unit is hour. is the number of vehicles for charging. is the amount of serving numbers for carrying passengers in rooms for charging or swapping batteries. is the driving range of electric vehicle taxis and its unit is km. is the distance for charging and its unit is km. is the time for charging or swapping batteries and its unit is hour.
- (2)
- The cost of charging or battery swap stations.
The cost of charging or battery swap stations includes two subparts. The first is the construction cost of charging or battery swap stations, centering on construction, power distribution system, and monitoring communication system. The second is the construction cost of the charging potential or battery swap potential, centering on charging equipment, and battery replacement system. ICEV and HEV do not need to charge. Both of the construction costs of charging or battery swap stations and the construction costs of charging potential or battery swap potential are zero, and the construction cost of charging or battery swap stations is shown in Figure 3.
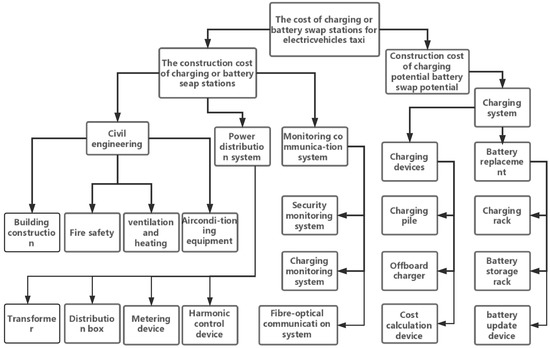
Figure 3.
The schematic of the construction of charging or battery swap stations.
The cost of charging or battery swap stations of BEV:
In this formula, is the cost of charging or battery swap stations and its unit is h. is the factor of the cost of charging or battery swap stations and its unit is h/each station. is the factor of the construction cost of charging potential or battery swap potential and its unit is h/each potential. is the number of charging or battery swap stations. is the number of charging potentials or battery swap potentials.
The factor of the cost of charging or battery swap station is:
In this formula, is the fixed construction cost of charging or battery swap stations and its unit is RMB/(h*one station). is the variable construction cost of charging or battery swap stations and its unit is RMB/(h*one station).
The fixed cost is the construction cost, which belongs to the primary input-cost. The variable cost represents the expenses on equipment maintenance and protection, staff salaries, and ordinary expenditures.
The factor of the construction cost of charging potential or battery swap potential is:
In this formula, is the fixed construction cost of charging potential or battery swap potential and its unit is RMB/(h*one potential). is the variable construction cost of charging potential or battery swap potential and its unit is RMB/(h*one potential).
The cost of charging stations of PHEV:
PHEV, with fewer demands of charging intensity and without any fixed charging time, only needs to be charged once a day. To cut the cost of constructing stations and to improve the utilization rate of charging stations, this paper makes the assumptions that there is only one charging station for PHEV within the taxi’s service area and the quantity demands for charging potentials is 5% of the total number of vehicles.
- (3)
- Time cost of passengers
The time cost of passengers’ travel is the cost of waiting time, and the time for taking a taxi is the same for each type of vehicle, thus it is excluded.
- (4)
- Carbon emission cost
Based on the type of GREET, this paper calculates the carbon dioxide emissions of “Well to Wheel, from oil well to vehicle wheel”, thus getting the carbon dioxide emissions directly and indirectly brought by vehicles [18]. “WTW” from oil well to vehicle wheel includes two phases: the first is from oil well to oil pump (WTP), and the second is from oil pump to vehicle wheel (PTW). The “WTP” is the first phase for the upstream production of fuels, including the exploration, transportation, production, distribution, storage, and filling process of fuels. The “PTW” is the second phase of the downstream stage for the fuel usage by vehicles.
The carbon emission cost of ICEV and HEV is calculated using the following:
In this formula, is carbon emission cost and its unit is h. is the factor of the cost of fuel carbon emission and its unit is .
The factor of the cost of fuel carbon emission is:
In this formula, is the fuel carbon emission value and its unit is ton/L. is the carbon trading value and its unit is RMB/ton. is the energy consumption that vehicles spent per km and its unit is L/km or kWh/km.
Carbon emission cost of PHEV:
PHEV consumes two kind of energy: gasoline and electric energy, which should be divided to calculate the amount of carbon emission.
In this formula, is the factor of the cost of electric energy carbon emission and its unit is is the ratio of driving distance of PHEV in electric energy to the total driving distance. is the driving range of PHEV in electric energy and its unit is km. is the cumulative time that taxis travel each day and its unit is h. is the number of times for carrying passengers of PHEV each day and its unit is time.
The factor of the cost of electric energy carbon emission is:
In this formula, is the value of electric energy carbon emission and its unit is ton/kWh.
The cost of BEV carbon emission:
4.2. The Demand Model of Electric Vehicle Taxi
In this paper, flexible transportation model is used to find out the number of electric taxis are needed. Considering that the urban area is square (or round) in the context of elastic transport model and assumed that the empty vehicle in operation is in a stable density state, that is, the passengers’ travel demand in the system is equal to the empty car rate as well as the rate of carrying passengers, thus we can use the smallest number of taxis to meet the passengers’ travel needs of the whole city. Thus the following equation is obtained:
In the formula, is the passengers’ travel demand, is the empty car rate, means rate of cars with passengers, and their unit is: one person*one time/h.
- (1)
- The demand model of ICEV, HEV, and PHEV taxis
There is no limitation to the driving range of HEV and PHEV, which means they are the same as ICEV. Therefore, the demand model of all of the three can be expressed with the same equation.
The empty car rate of taxis is equal to the number of empty cars divided by the driving time of empty cars:
The taxi’s rate of carrying passengers is equal to the number of cars carrying passengers divided by the driving time of cars carrying passengers. The driving time of cars carrying passengers consists of four parts: on-board time, get off time, pick-up time (pick-up distance divided by pick-up speed), and the time of carrying passengers (distance of carrying passengers divided by speed of carrying passengers). Since there is little difference between the speed of picking up passengers and that of carrying passengers, the average speed of carrying passengers is calculated in this paper via the following:
According to the fact that passengers’ travel demands are equal to the empty car rate of taxis and the car rate of carrying passengers, we can draw the following conclusion:
- (2)
- The demand model of BEV taxis
Because the driving time of BEV empty cars includes the driving time and cruising time of departing from charging or battery swap stations, the empty car rate of BEV equals to:
The calculation method of car rate of carrying passengers of BEV is the same as that of ICEV:
Simultaneously, in order to keep the empty vehicle in a stable density state, it is necessary to ensure that the vehicles for charging or battery swap stations can fill up the vehicles leaving the charging or battery swap station in time, that is, the charging or battery swap rate is equal to the empty car rate. The charging or battery swap rate is equal to the number of cars of charging or battery swap divided by the average time, which was distributed by the total time of charging or battery swap to each passenger service:
In this formula, is the rate of charging and battery swap and its unit is one person*one time/h.
According to the elastic transportation model, it is evident that passengers’ travel demand is equal to the empty car rate, the rate of carrying passengers, and the rate of car charging and battery swap:
According to the number of empty cars, we can get the average spacing of empty cars:
In this formula, is the average spacing of empty cars and its unit is km. is the coefficient of non-linear roads, and different roads have different values from the Internet [19]. is the whole serving area of the taxis, which is the city area and its unit is km2.
According to what is mentioned in the literature [20], the average waiting time of passengers follows the exponential distribution and the pick-up speed equals the speed of carrying passengers, both of which are constants, so the distance of picking up passengers also abides by the exponential distribution. The average waiting time for passengers is almost the same as the interval of the appearance of two empty vehicles [21]. According to the average intervals between the empty vehicles, the mathematical expectation of picking up passengers is:
The distance of carrying passengers has nothing to do with the type of vehicle but is rather decided by the trip distance of residence. So in this paper, the distance of carrying passengers is acquired according to data of actual survey.
By combining Equation (21) and Equation (28), we can obtain the cruising distance is:
4.3. The Optimal Design Model of Charging Facilities of Electric Vehicle Taxi
The charging spots of electric vehicle taxis are usually in the vicinity of the intersection of the road network. In this paper we assume that charging demands occur in the near of the road network in the nearest road network intersection. Considering that the number of electric vehicle taxis is fixed, the number of average daily charging times of the city is:
In this formula, represents the total daily charging times of cities and its unit is one car*one time/one day. is the probabilities by charging k times. is the highest frequency that one car can get charged in one day and its unit is one car*one time/one day.
Combined with the operating range of electric vehicle taxis, the intersection of the operating range is selected to serve as the charging demand point, where (j = 1, 2, 3 ..., n) is the charging demand point j. According to the proportion of traffic flow at each intersection to the total traffic flow ratio of the entire electric vehicle taxi operating range, we get the average number of daily charging at each intersection:
In this formula, is the number of average daily charging at the charging demand point and its unit is one car*one time/one day. is the total traffic flow in all directions of the intersection at the charging demand point , in which = 1, 2, 3 …, n,and its unit is the number of cars/day.
Voronoi diagram is an important algorithm in GIS spatial analysis. It successfully solves the problem of finding the nearest point and shortest path of charts in computers. The principle of the Voronoi diagram can be described as the distance from the arbitrary point in the Voronoi diagram polygon to the center point of the Voronoi diagram polygon if it is shorter than the distance of any other point to the center of the Voronoi diagram polygon. The center point is the generatrix of the Voronoi diagram polygon, and the generatrix of each space corresponds to one single Voronoi diagram polygon [22].
Definition: In a two-dimensional Euclidean plane, when the discrete point set , , we will get:
In this formula, the distribution of and is the Euclidean distance that any point X is to points and its unit is km. In addition, the given plane segmentation can be expressed as a Voronoi diagram, with being the generatrix.
This property of Voronoi diagrams is similar to the concept of the charging service range of electric vehicle taxis [23]. In the urban road network, the collection of charging and battery swap stations of electric vehicle taxis can be seen as a discrete point, which is the generatrix, on the plane. As a result, we can draw the Voronoi diagram and achieve the full segmentation of the charging service scope. Therefore, the distance of any charging demand point in some charging service scope to the charging and battery swap stations is shorter than that to any other charging and battery swap stations. As for the driver, the only way to decrease the charging distance and time spent in the charging distance to the charging and battery swap stations, corresponded with the charging demand point when the charging demand is generated in a certain charging demand point.
According to the distribution of the charge demand points, it is possible to determine the Voronoi diagram, which considers the charging and battery swap stations as the generatrix, and further determines the charging demand point in each charging service scope . It is stipulated that when the charging demand point generates the charging demand, it can only go to the corresponding charge and battery swap station . In order to better determine the spatial distribution and the service scope of charging facilities, an optimal design model of charging facilities, taking the distance cost of drives and the cost of charging and battery swap stations as the objective function, is established, based on the location planning of charging facilities in the Voronoi diagram, that is, the optimization of the distance cost and the charging and battery swap station cost of the costs of the taxi company in Section 4.1.
The charging distance of electric vehicle taxis:
In this formula, means the Euclidean distance between charging demand point and the charging and battery swap station and its unit is km.
4.4. The Optimal Design Model of Electric Vehicle Taxi Systems
Based on meeting passengers’ travel demands and the charging demand, this model is intended to calculate the number of empty trucks, passenger cars, storage battery cars, and charging and battery swap stations that should be configured in the whole electric vehicle taxi system, and to determine the location of the charging and battery swap station. Through constant optimization, we hope to minimize the total cost of the electric vehicle taxi system.
The objective function optimized in this paper is the minimum cost of electric vehicle taxi systems, and the equation of the objective function is:
By simplifying Equations (37)–(49) into Equation (36), we can obtain the simplified objective function, which only contains the two variables . The other parameters are already known. In order to get the design of electric vehicle taxi systems with minimum cost, what is needed is to constantly optimize the number of empty cars, charging and battery swap stations, and the station locations.
The way to get the objective function of ICEV, HEV, and PHEV, is the same as that of BEV taxi, and their variables are also after simplification, thus we do not list them here.
5. Case Application
In this section, we will get the design of the electric vehicle taxi systems of the Tongzhou District of Beijing city, which is taken as an example in this study, and the model acquired using Matlab software programming.
5.1. Input of Model Parameter
In 2014, the Tongzhou District had a population of 1.356 million in terms of the permanent resident population, of which the household population was 705,000. According to the Statistical Information Network of Beijing, the total GDP of Tongzhou District in 2014 was 54.89086 Billion RMB, and its per capita of GDP is 77,859 RMB, and therefore, the value of per unit time is 26.66 RMB/h (working 8 h a day, 365 days/year).
Passengers’ travel demand
At the end of 2010, the average daily travel volume of Beijing was 20.94 million, of which taxis accounted for 6.6% of the total [24]. The average speed of the motor vehicle at 6:00am–23:45pm is about 28.5 km/h. In September 2010, according to the fourth city comprehensive traffic survey of Beijing (46,900 households within the sixth ring road), the travel intensity of Beijing residents was 2.82 times/one person*one day.
According to the statistics of the fifth comprehensive traffic survey in Shanghai [25], the mathematical expectation distance of carrying passengers of taxis in Shanghai, after calculation, is 6.9 km. Both Shanghai and Beijing are megalopolises, and there is little difference between traffic development and residents travel distance. Therefore, the distance of carrying the passengers of taxis in Shanghai can be taken as that of the Tongzhou District.
Most of the urban fuel type taxis are 24 h in operation, but most passengers come from the 13 h, that is from 6:30 am to 19:30 pm, which focuses on 90% of the total passengers in the whole day [26,27,28]. Therefore, the calculation of the number of taxis should be based on the quantity that meets 90% of the daytime travel. The travel demand of passengers for choosing taxis in Tongzhou District is:
Charging demand point
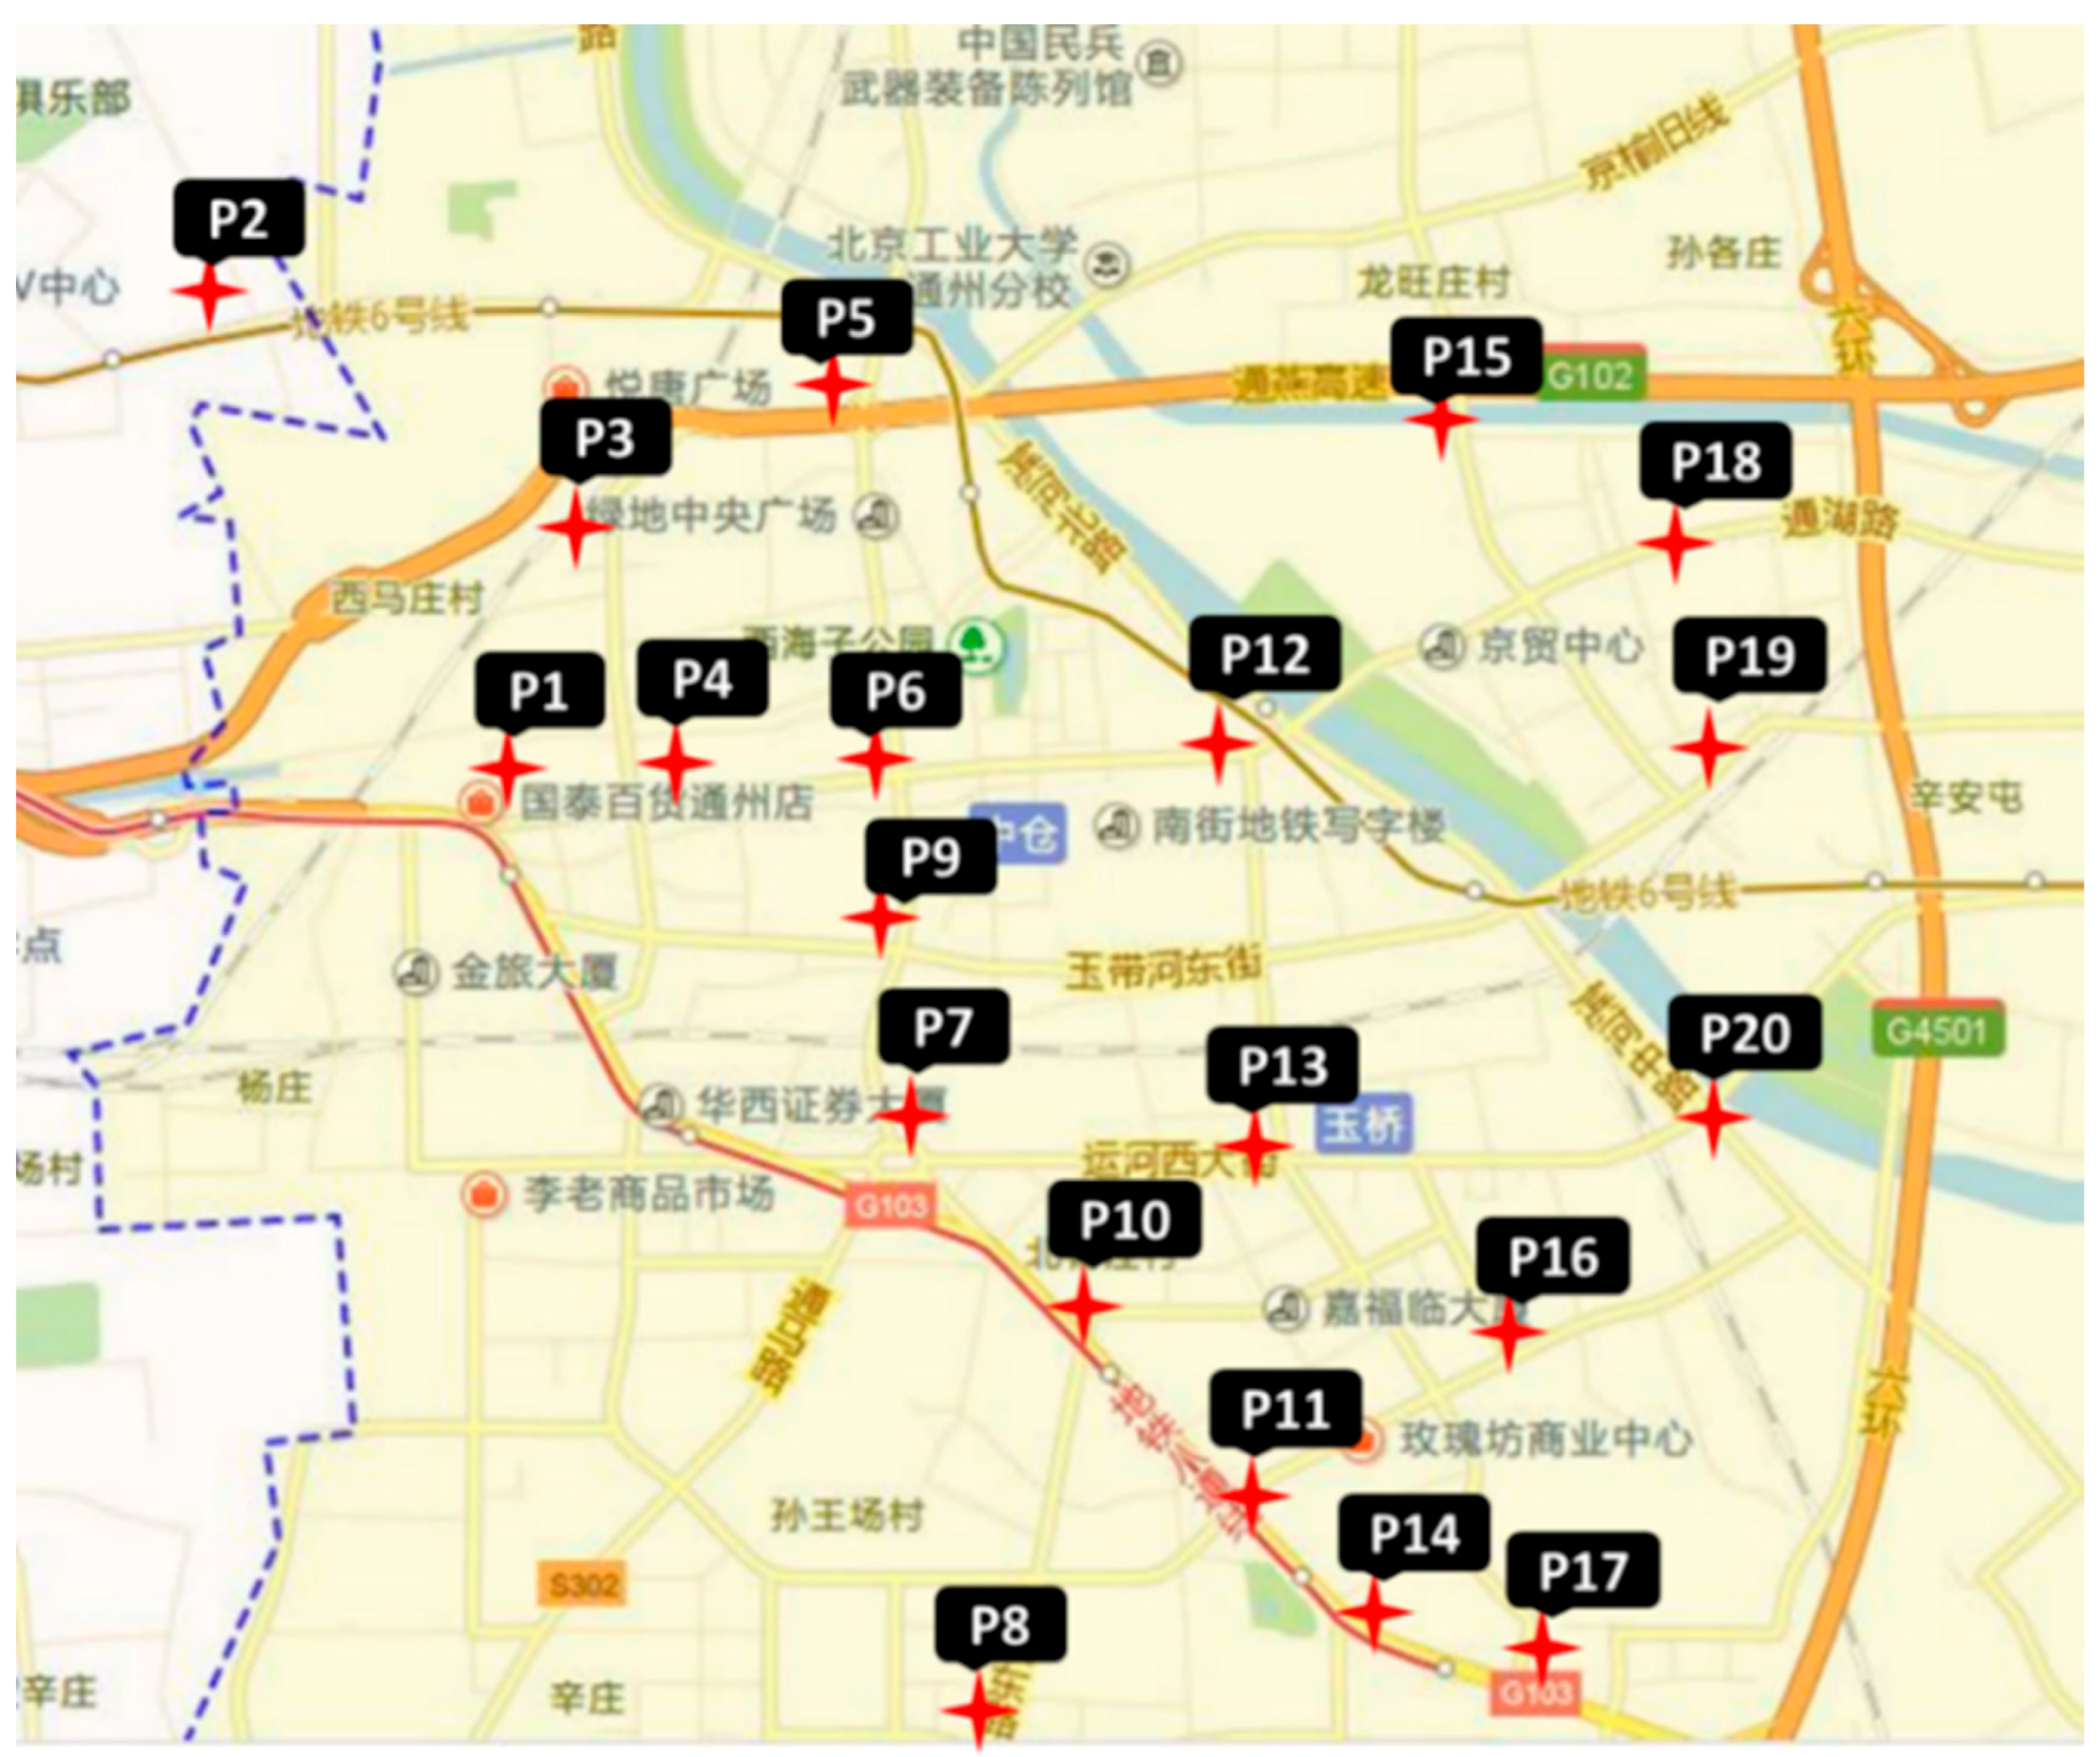
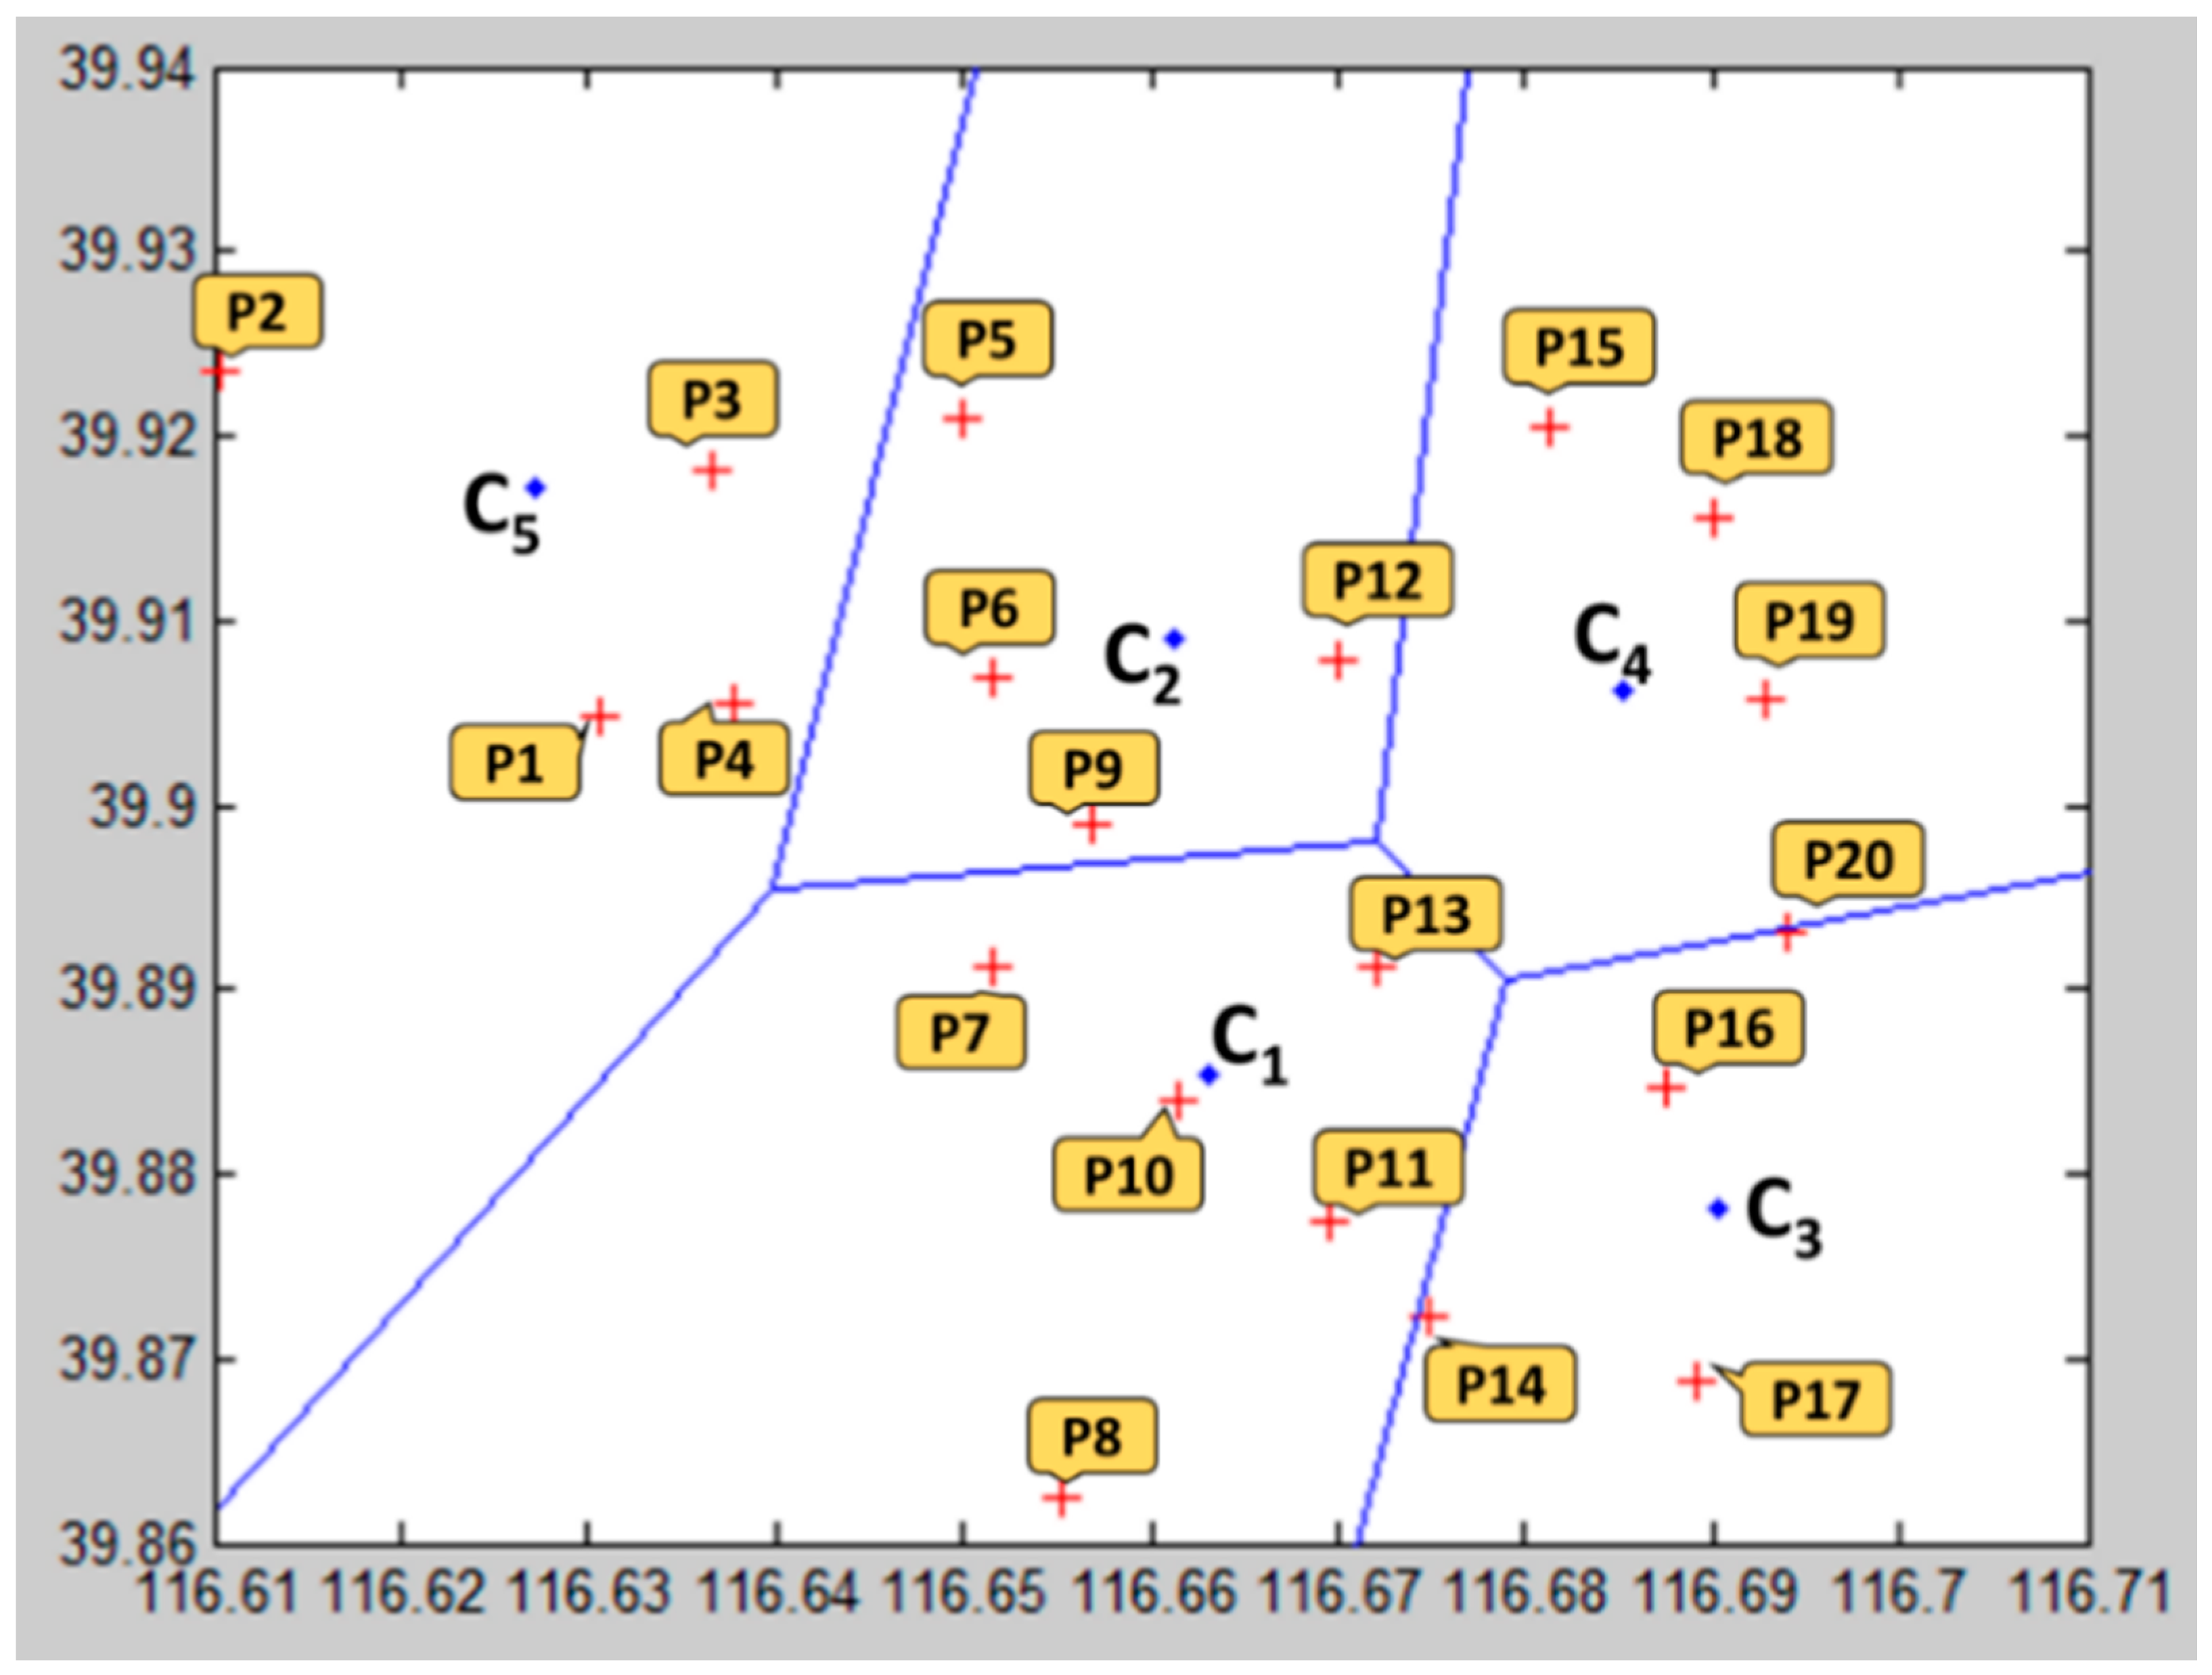
According to the main structure of the Tongzhou road network, we selected 20 charging demand points [29], as shown in Figure 4. The latitude and longitude coordinates and traffic flow of each charging demand point are shown in Table 2. The number of charging potential of each charging station is equal to the ratio of the whole times of charging of the charging demand point in the areas of this station to the whole charging times in the taxi operating area, and multiplied by the total number of charging potentials.

Figure 4.
Distribution of charging demand points in the Tongzhou District.
Table 2.
Charging demand point, longitude, latitude, and traffic flow.
The Cost of the Taxi Company
This paper chooses four kinds of cars as research objects: Hyundai Elantra (ICEV), Changan Jiexun (HEV), BYD Qin (PHEV), and BAIC EV200 (BEV), and their reference data and prices are shown in Table 3. The charging taxi and changing-battery taxi both use BAIC EC200 as research objects. Since 2013, the operation period of taxis in Beijing reached six years, which means that the depreciation period of the taxi in Beijing is six years since then.
Table 3.
Reference data and prices.
For the electric taxis with charging mode, the taxi company purchases the electric taxis and the charging station provides charging services for those electric taxis. For the electric taxis with the ability to switch power mode, the taxi company purchases the raw electric taxis and the switching power station buys batteries and provides switching power services for those electric taxis. The taxis of ICEV, HEV, and PHEV adopt the traditional operation pattern of the contract system with single shift. All types of taxis serve for 12 h per day, 365 days per year.
In January of 2016, the average price of No. 93 high-grade gasoline in Beijing was 5.56 RMB/L, the charging fee was 0.814 RMB/kWh, and the switching power fee was 0.5 RMB/km (according to the switching power standard in Hangzhou). In addition, the maintenance fee of electric taxis was 6.16 RMB/100 km while the maintenance fee of taxis of ICEV, HEV, and PHEV was 14 RMB/100 km [30].
Based on the survey of gasoline-powered taxis and electric taxis, the administrative cost of the taxi company has been estimated (see Table 4). The taxi company needs one senior manager with an annual salary of 150,000 RMB, two middle managers each with an annual salary of 100,000 RMB, and 10 general staff each with an annual salary of 60,000. In addition, the company’s daily expenditures account for 25% of the staffs’ salary [30].
Table 4.
The daily management costs of the taxi company.
Charging or battery swap station cost
This paper is based on the example of establishing a standard charging or battery swap station to calculate the charging or battery swap station cost [31]. As shown in Table 5, the standard charging or battery swap station serves 100 vehicles at peak. Assuming that the annual maintenance cost of charging or battery swap stations to be 5% of the construction cost [32], the depreciation period to be 10 years, for 365 days per year, and operates 12 h a day, the Beijing municipal government subsidizes 30% of the total investment.
Table 5.
Charging or battery swap station cost structure.
Carbon emission cost
From February 2015 to February 2016, the average price of carbon emission trading rights is 45 RMB per ton in Beijing city [33]. Consequently, carbon emission cost of different taxi system is listed in Table 6.
Table 6.
Composition of carbon emission cost.
Then the cost can be estimated based on the above data, as shown in Table 7:
Table 7.
The estimated cost based on the above data.
Other input parameter values are presented in Table 8:
Table 8.
Other input parameter values.
5.2. Model Output
As shown in Figure 5, the electric charging taxi amounts to 5557 in total. In addition, the number of electric exchanging taxis (5316) is smaller due to less time for recharging. There are five electric charging/exchanging stations in Tongzhou District distributed as shown in Figure 6 (as red crosses representing the electric charging demand points and blue dots standing for electric charging/exchanging stations). Table 9 below shows the number of electric charging/exchanging spots.
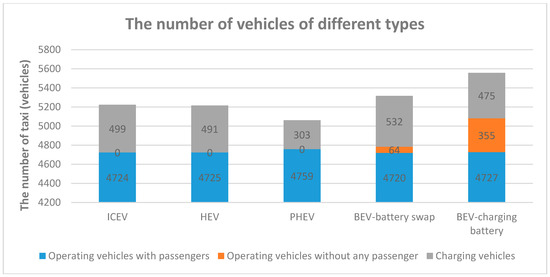
Figure 5.
The number of vehicles of different types.

Figure 6.
Positions of charging or battery swap stations.
Table 9.
Longitude and latitude for charging or battery swap stations and quantity of electric charging spots.
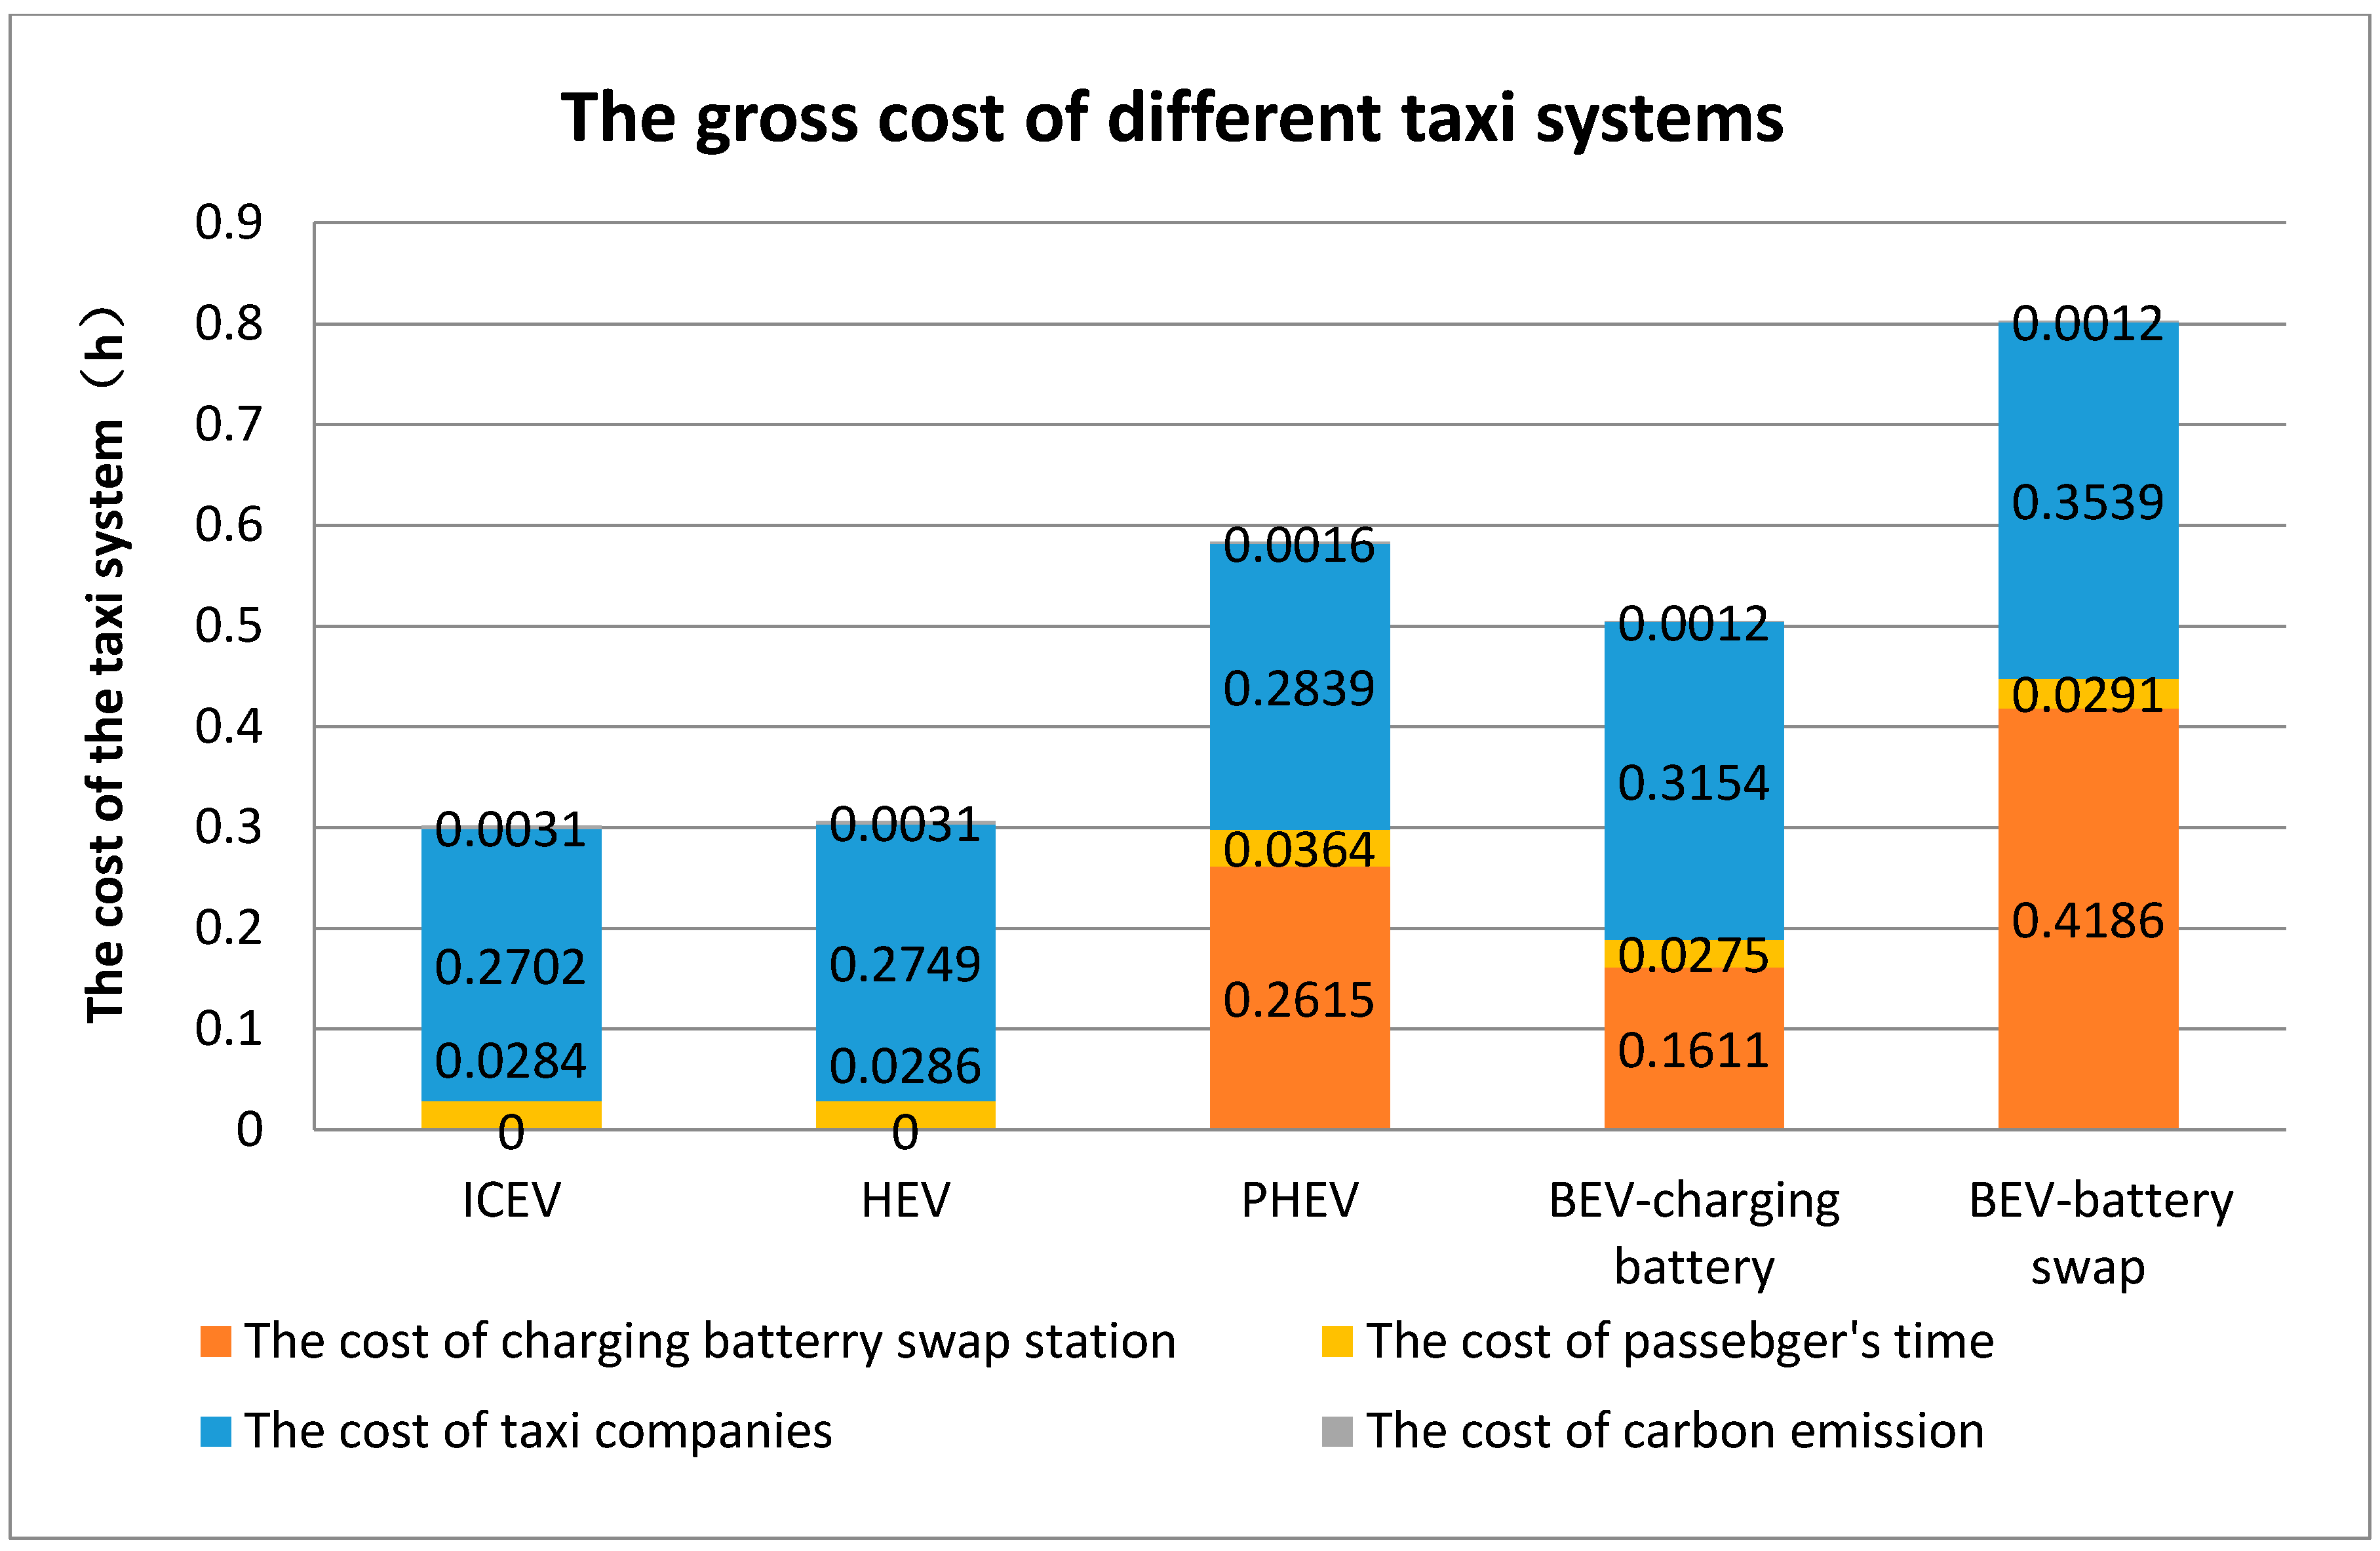
The cost of taxi corporations accounts for the largest proportion of the gross cost of the taxi system for the high manpower and small distinctions of passengers’ time costs among different types of vehicles, as shown in Figure 7. Because of the high fixed construction costs of electric charging spots, which means a high charging equipment cost, the gross cost of the system accounts for the largest part. In the view of the cost of carbon emission, the electric taxi costs the least with an apparent advantage of emission reduction, and the costs of the carbon emissions of ICEV and HEV are slightly distinct.

Figure 7.
The gross cost of different taxi systems.
5.3. Parameter Sensitivity Analysis
- (1)
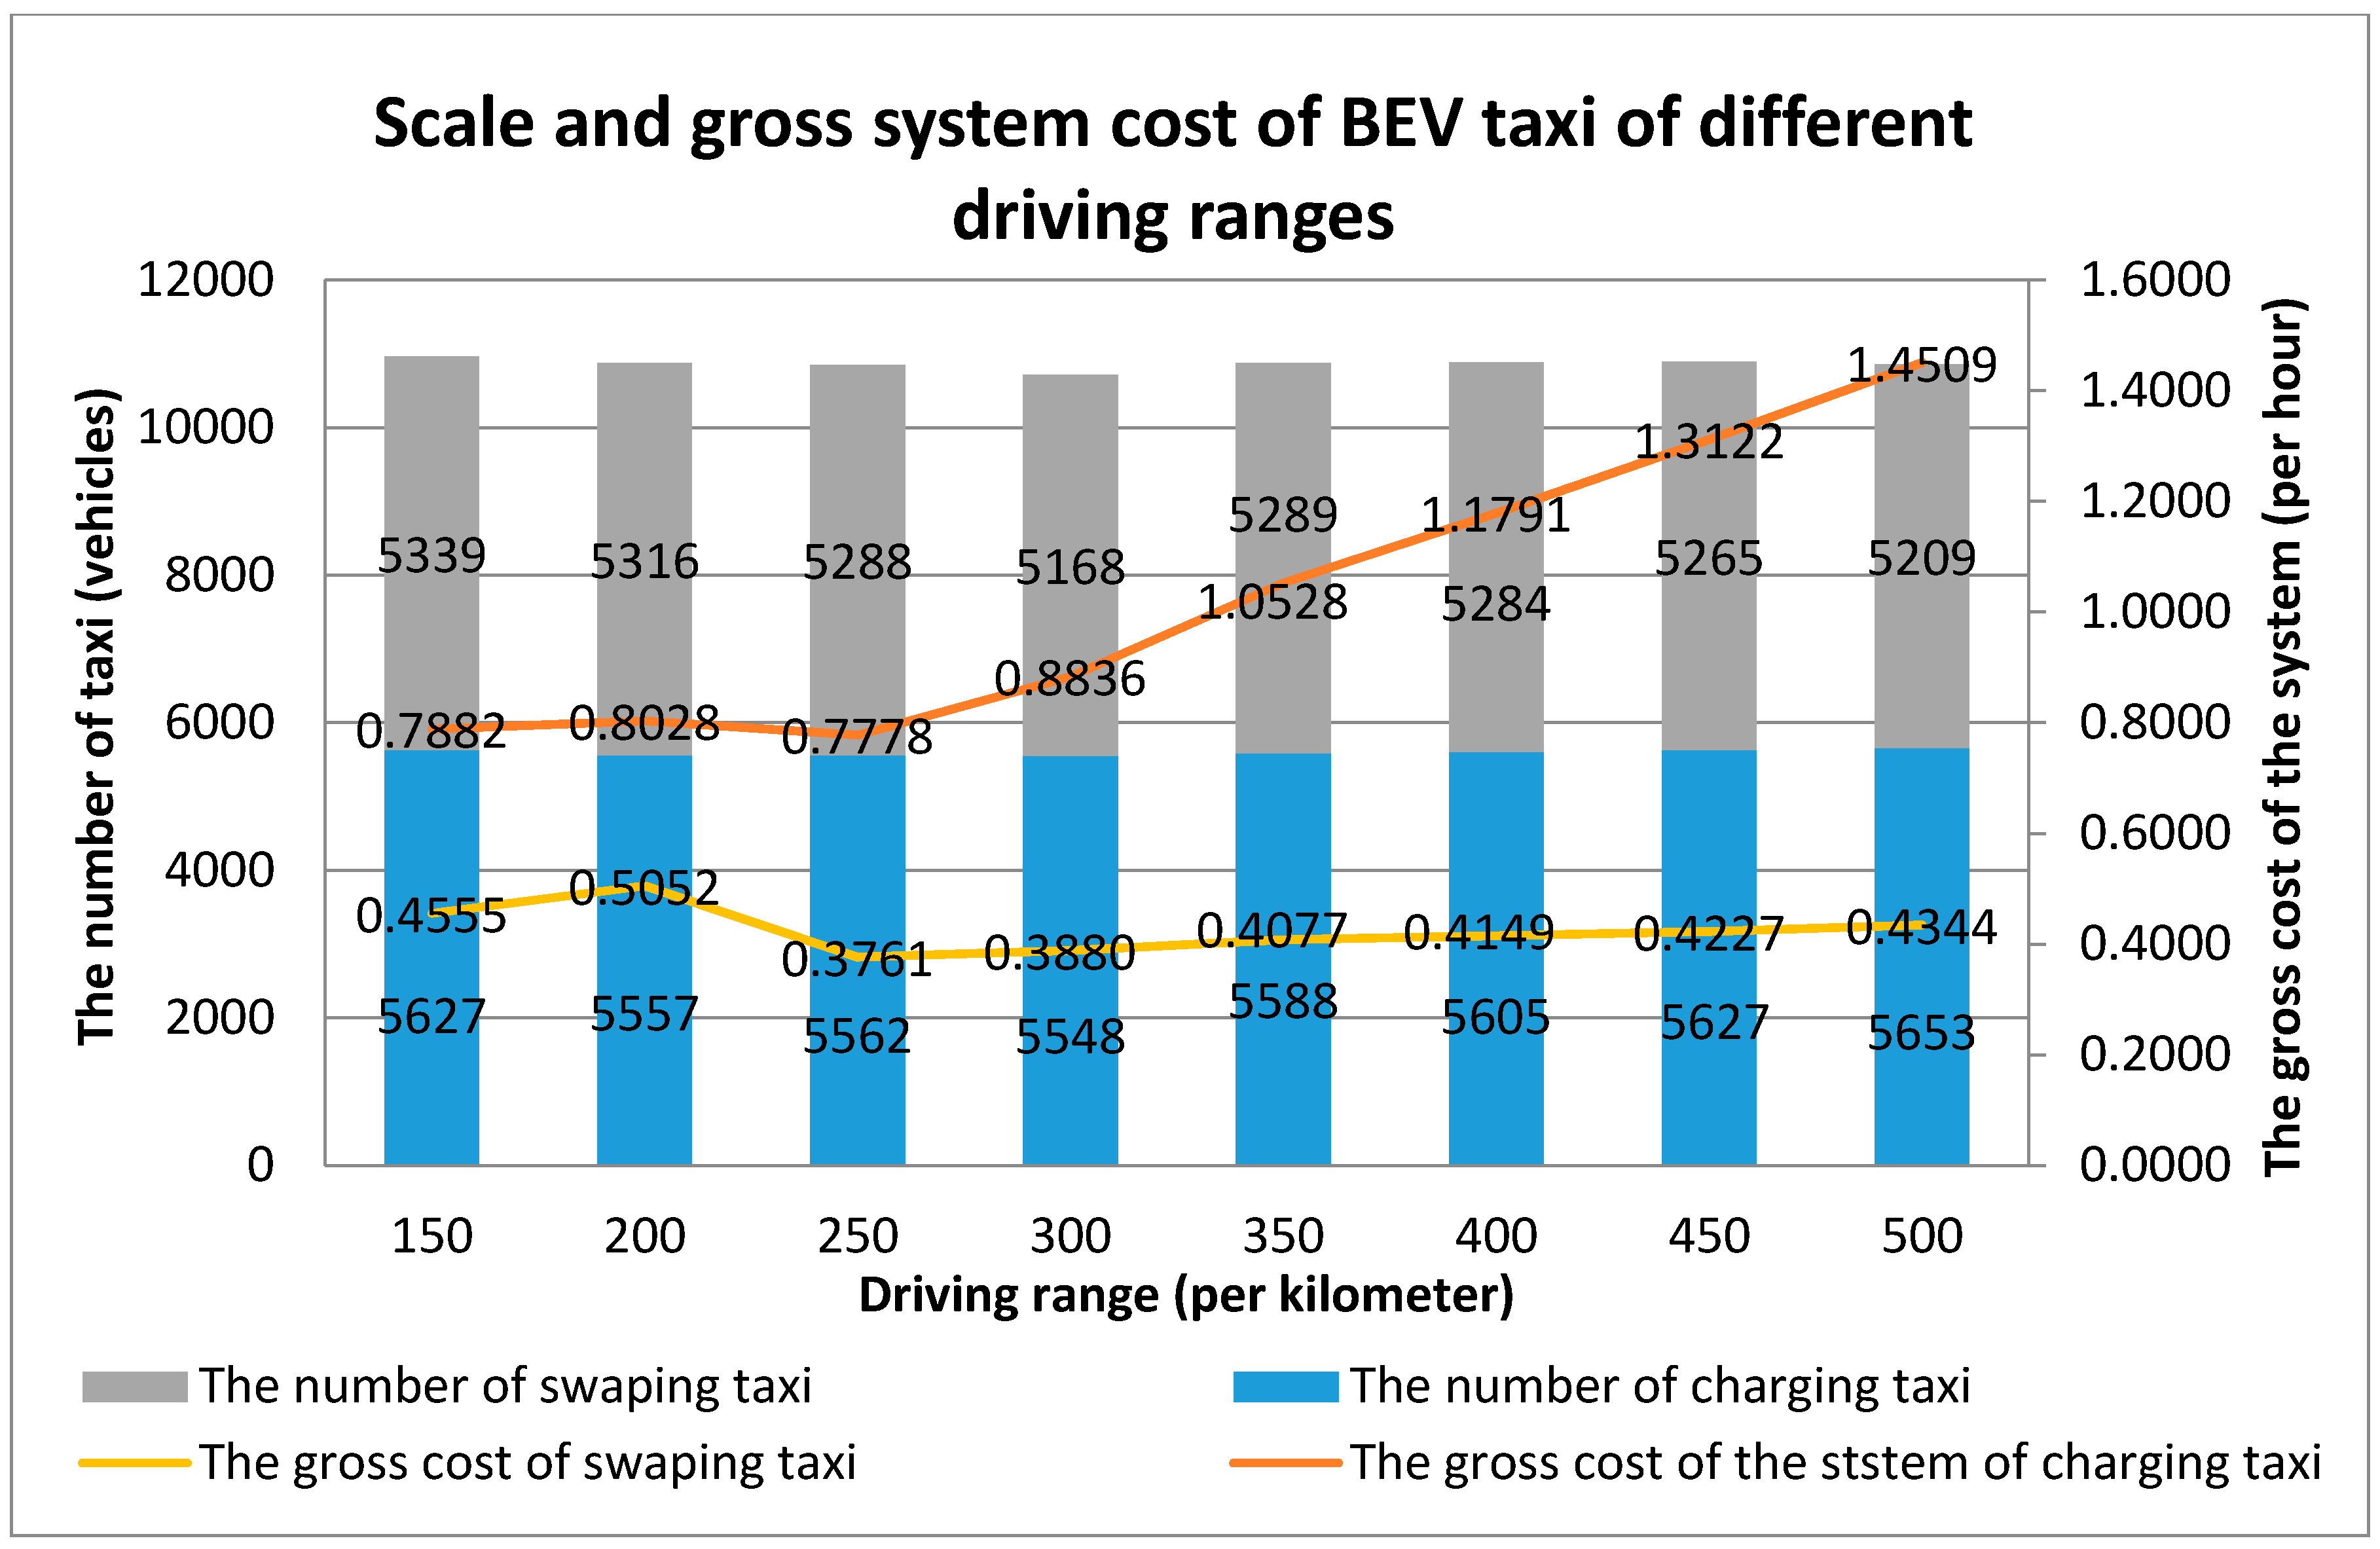
- Driving range of BEV
The service time of BEV is to a large extent affected by the driving range. Figure 8 shows the relationship of the vehicle scale and the gross cost of the electric taxi system, which indicates when the gross cost of the electric taxi system reaches the lowest point, and the battery capacity of BEV taxis is 42.5 kWh and the driving range is 250 km.
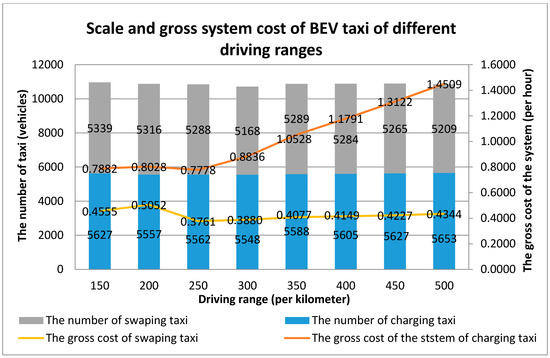
Figure 8.
Scale and gross system costs of BEV taxi of different driving ranges.
- (2)
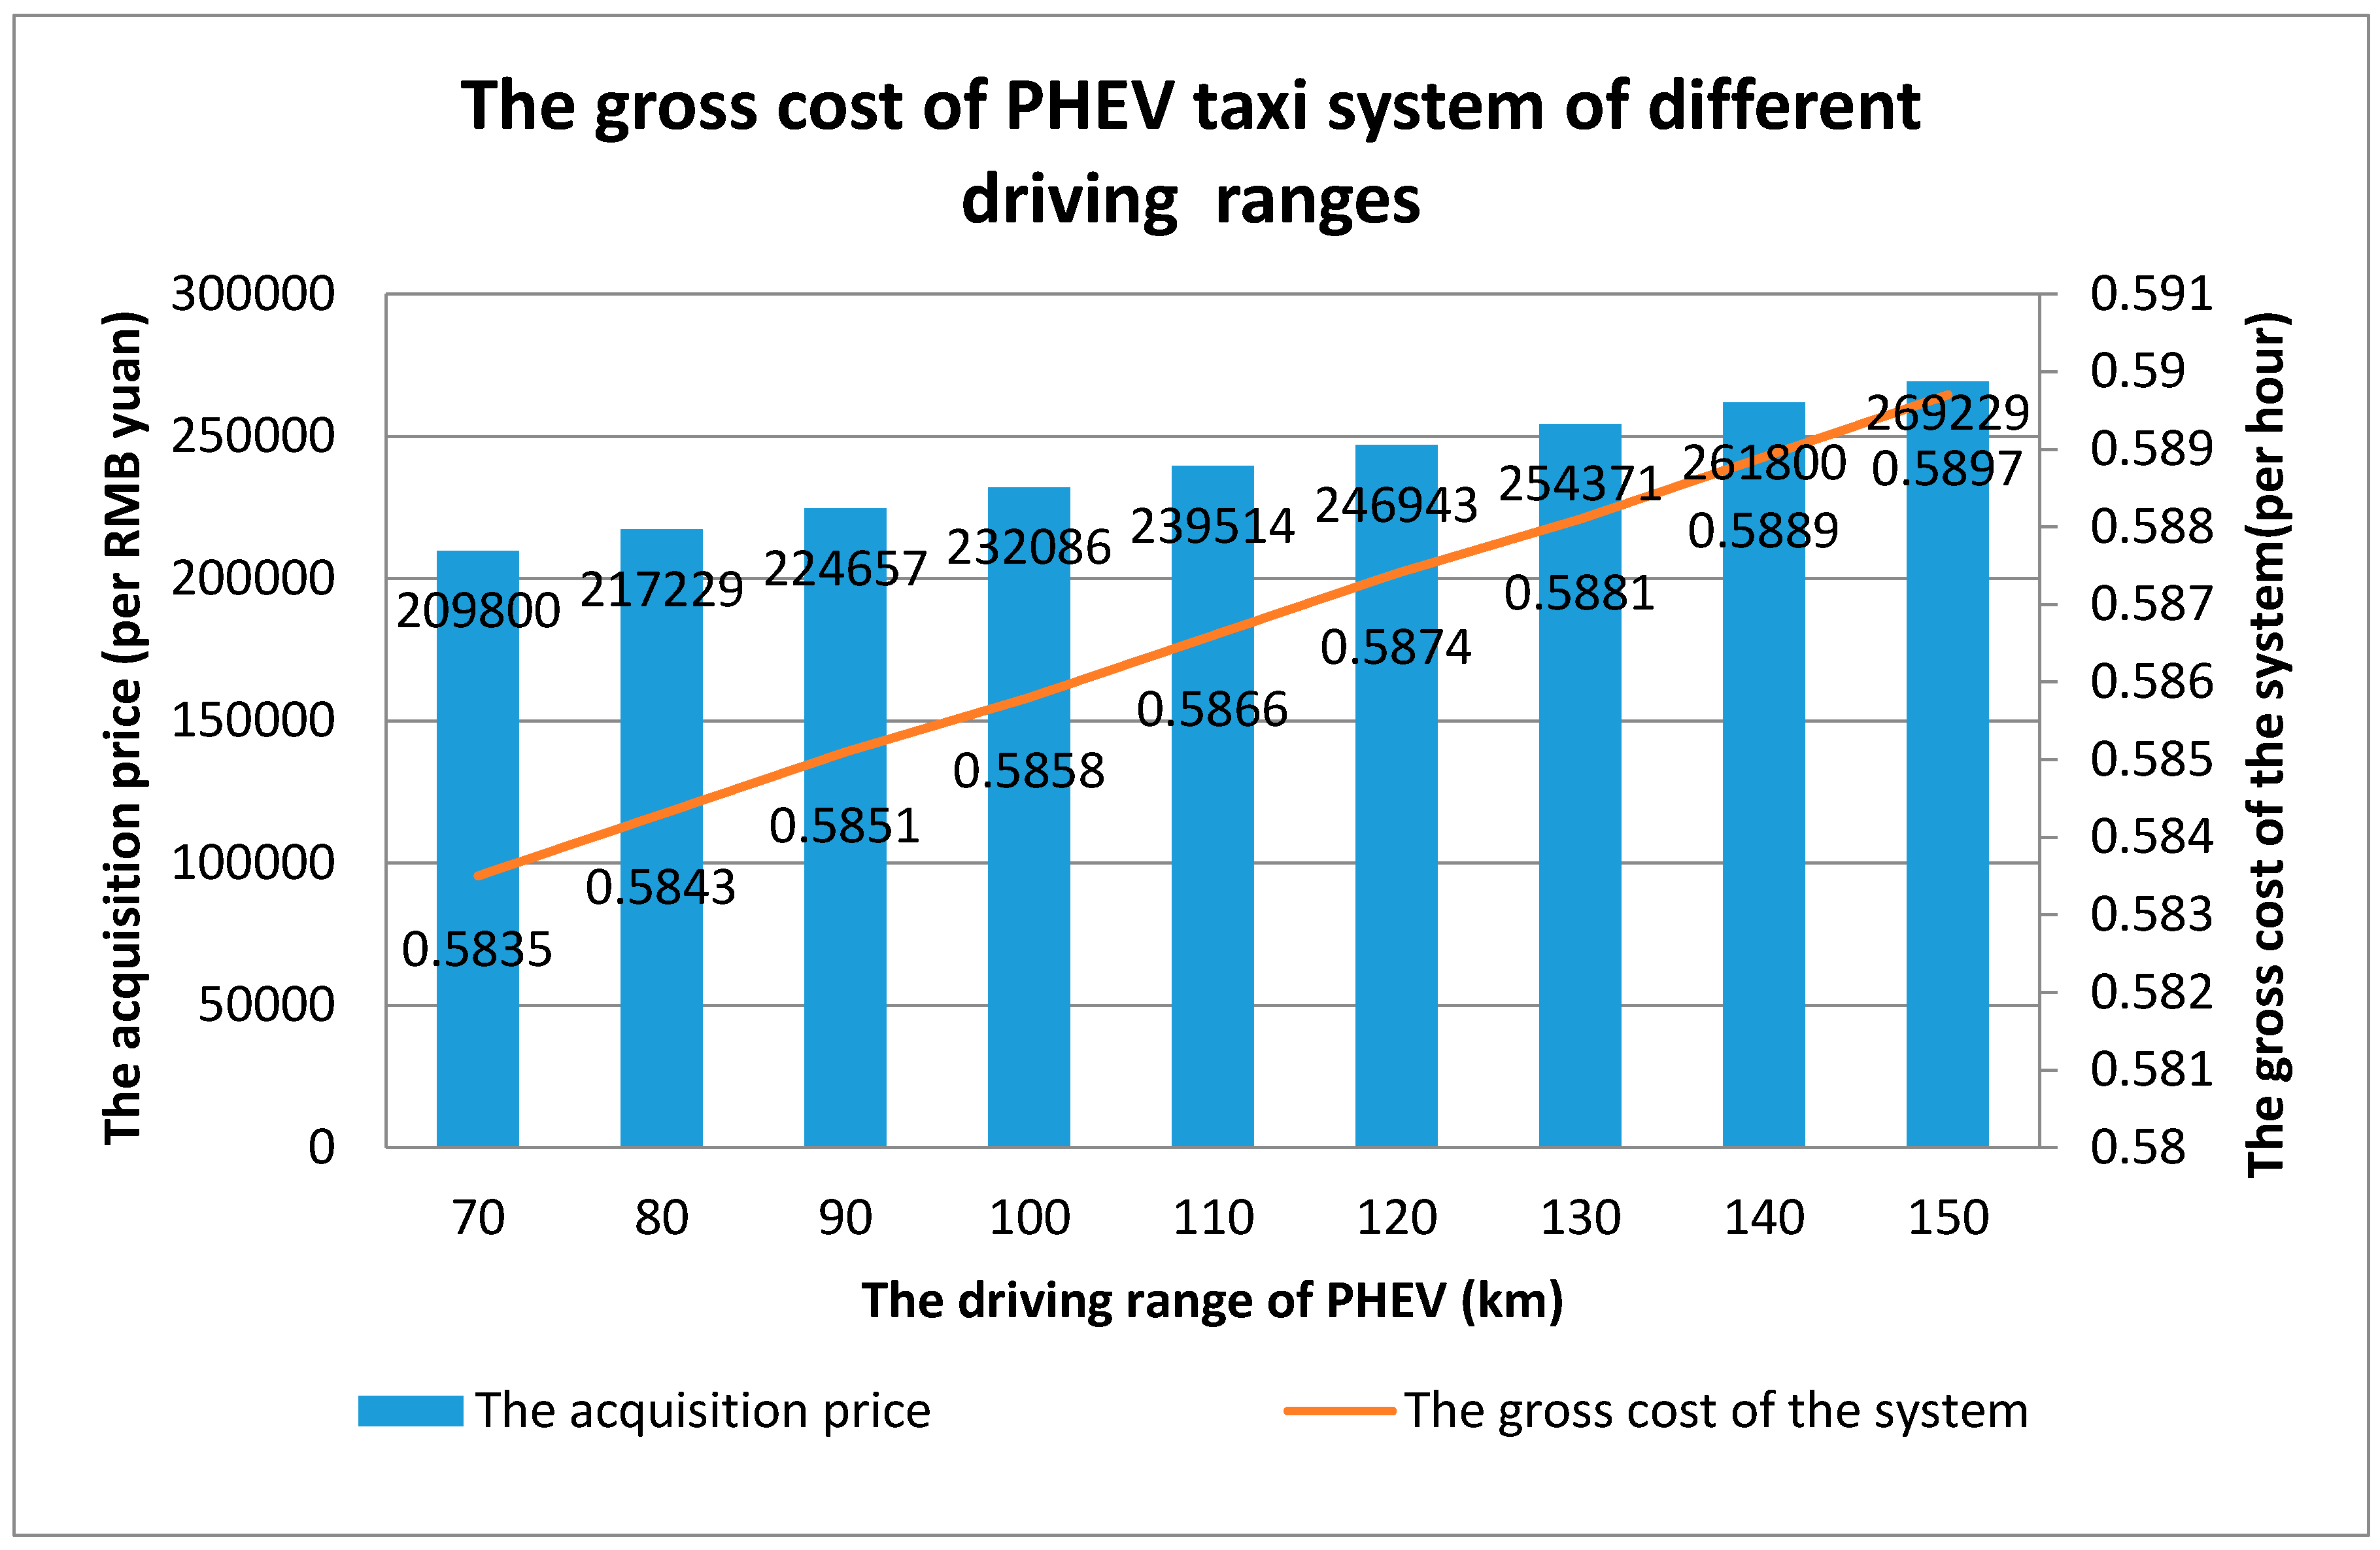
- Driving range of PHEV
As shown in Figure 9, the gross costs of PHEV taxi systems of different driving ranges vary slightly. While with the increase of PHEV driving range, the acquisition price of PHEV is on the rise apparently.
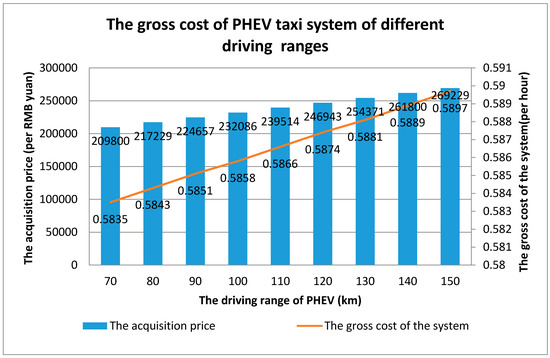
Figure 9.
The gross cost of the PHEV taxi system of different driving ranges.
Considering the historical statistics, the acquisition price of Rongwei E550 is between 2,498,000 to 2,598,000, and BYD Qin between 2,098,000 to 2,198,000. By comparison, the former takes the lead in base plate and battery techniques while it is far from the latter in terms of sales volume. Taking eligibility for subsidies for PHEV, the driving range of which should be equal to or under 50 km, together with consumers’ acceptability for the price of new energy automobile into consideration, we recommend that the acquisition price for PHEV taxi be no more than 2,400,000 and the driving range no more than 100 km.
- (3)
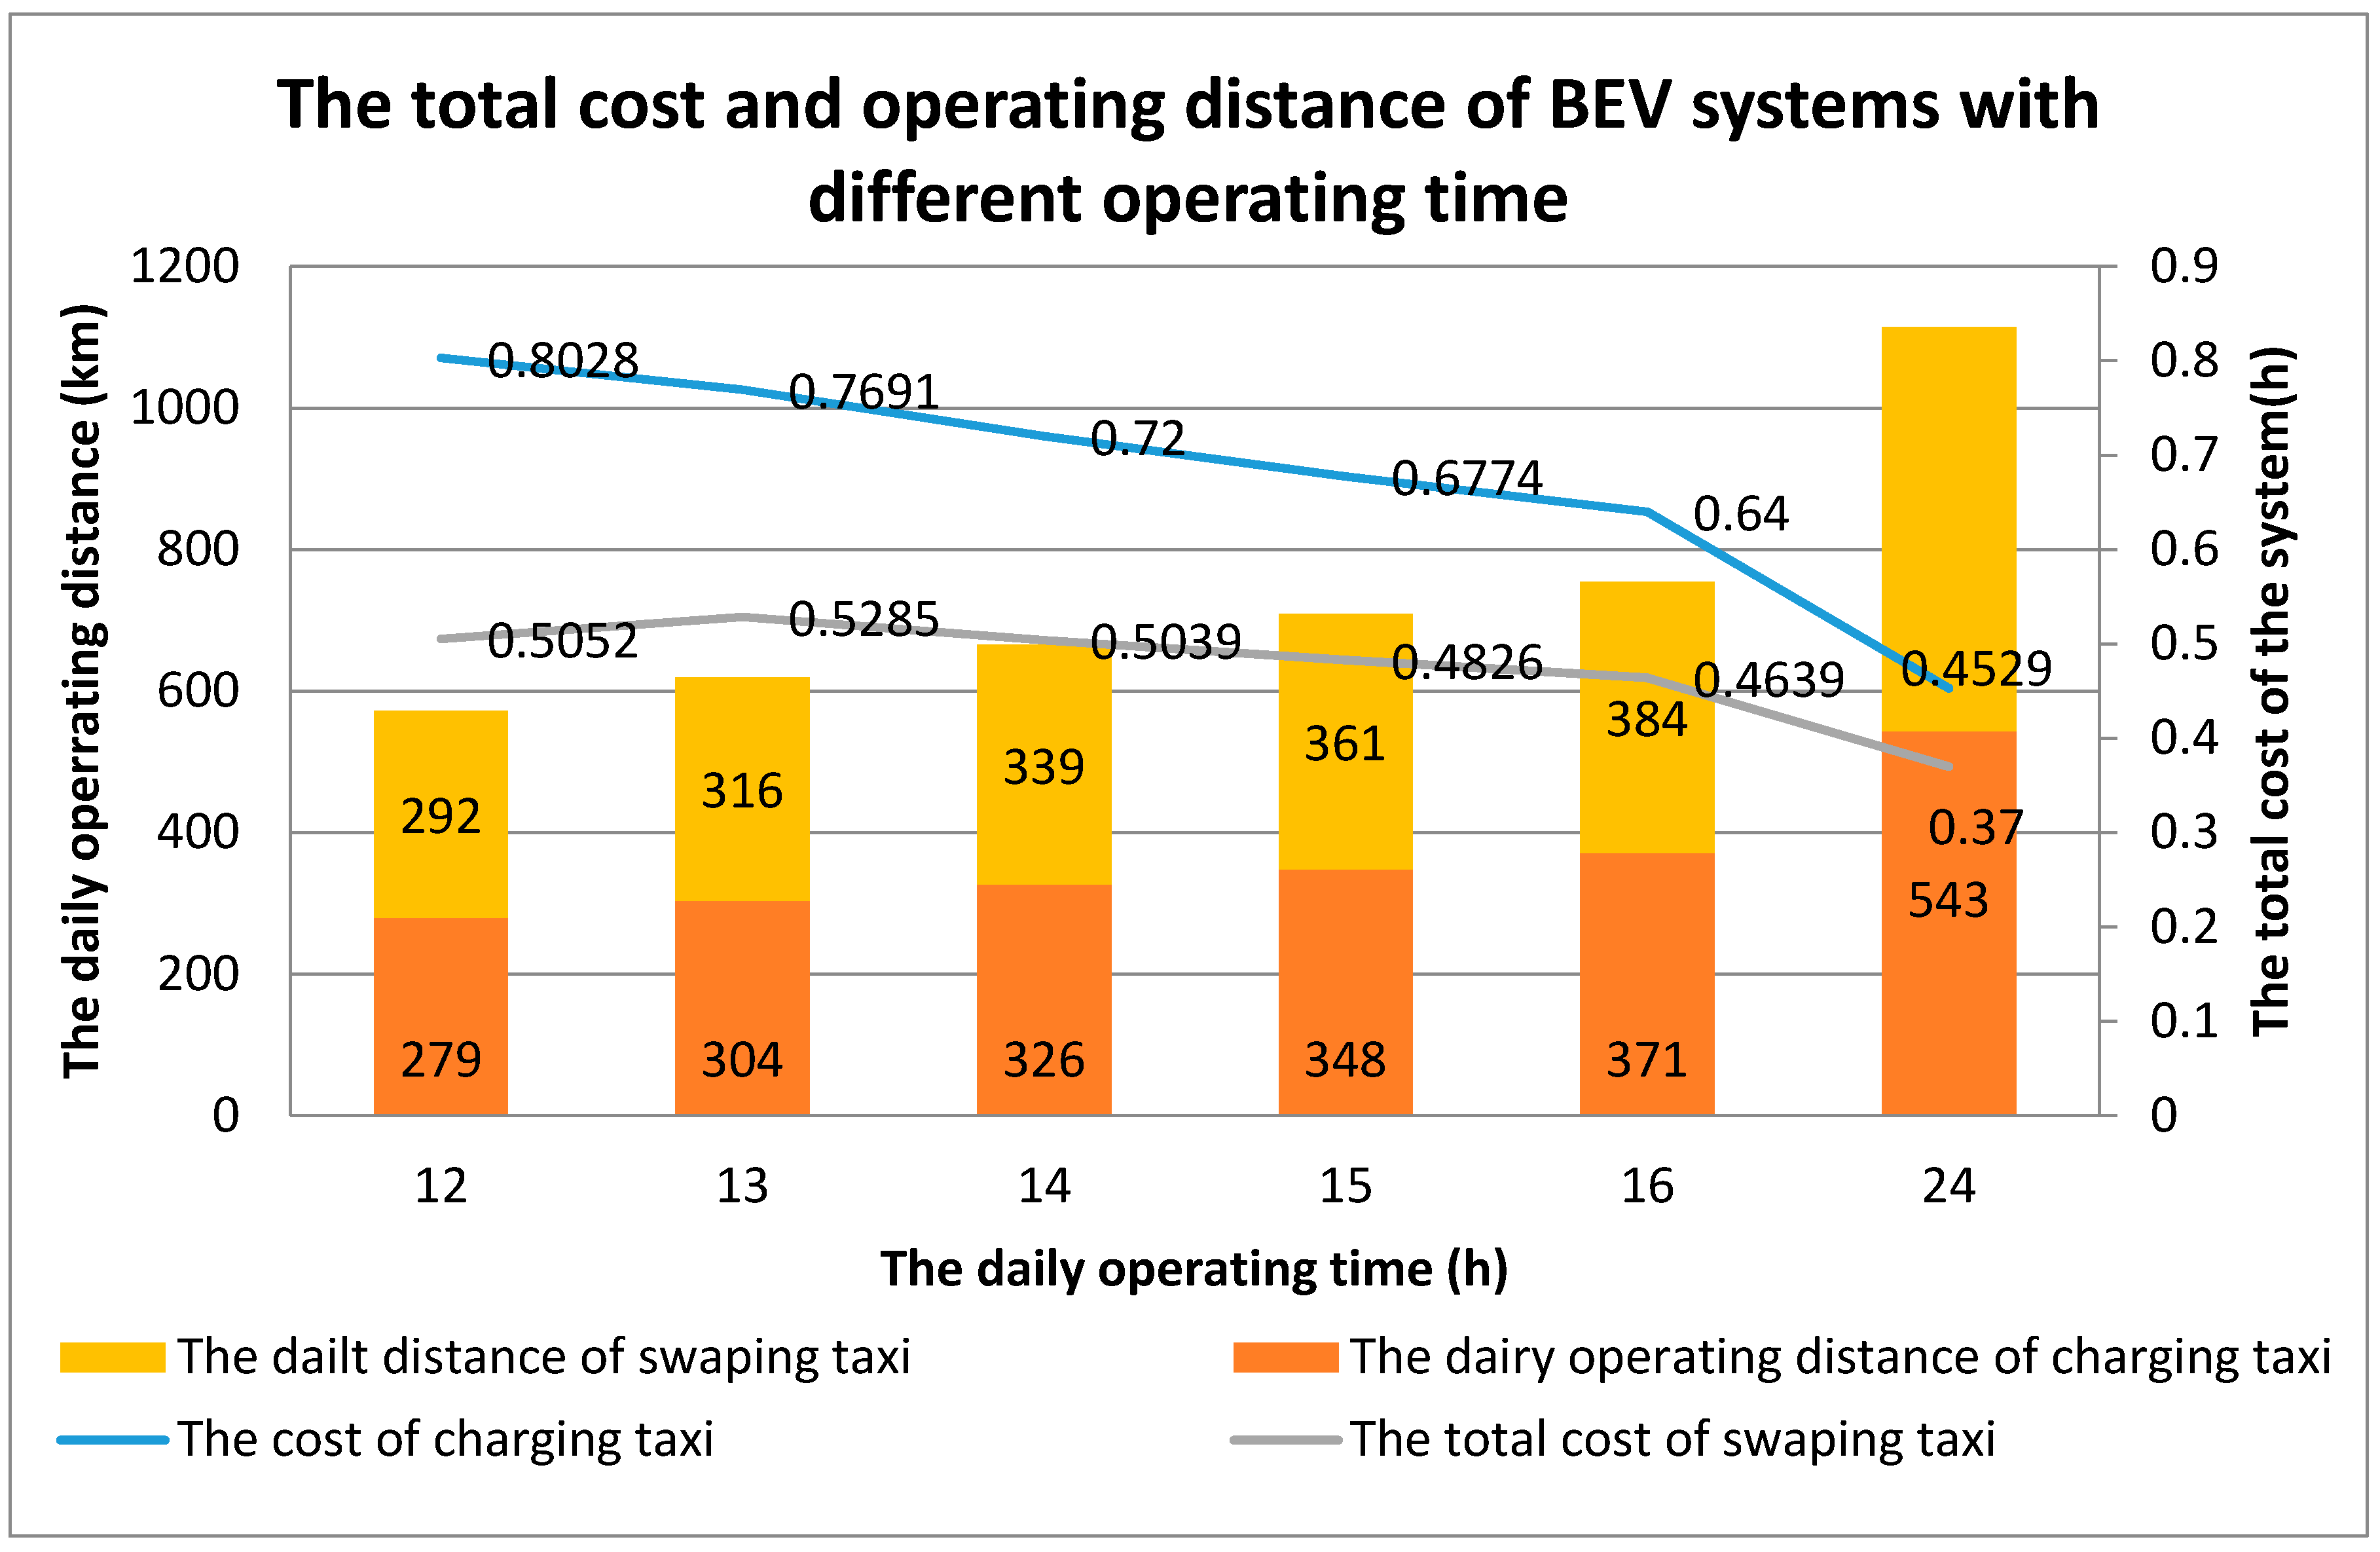
- The Daily Operating Time of BEV
The longer the daily operating time of BEV is, the less will be the total cost of the system, as shown in Figure 10. Taking the impact of the battery charging time and replacement cost, it is recommended that the daily operating time of BEV should be no more than 16 h per day, with its operating distance no more than 380 km.

Figure 10.
The total cost and operating distance of BEV systems with different operating time.
- (4)
- Carbon Tax
Since China does not impose a carbon tax, the price of a carbon tax in this paper is calculated according to the current trading price of carbon emission permits. Because there is zero pollutant in the driving phase of BEV, in order to reflect the efficiency of BEV in reducing carbon emissions, the cost of carbon emissions is calculated according to the standards of different countries. The results are shown in Figure 11 (excluding the carbon emissions in the WTP phase).
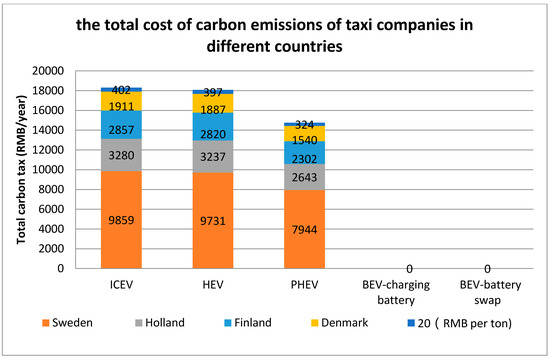
Figure 11.
The total cost of carbon emissions of taxi companies in different countries.
According to the standards of European countries, the paid carbon tax of ICEV, HEV, and PHEV has been close to 2000 RMB, or even 9859 RMB, accounting for 2.7–13.8% of the annual turnover of fuel taxi companies. Such a cost is unacceptable to the fuel taxi companies. As illustrated in this article, the proposed price of the carbon tax in the initial period is 20 RMB/ton and the corresponding carbon tax paid by the fuel taxi companies per year is about 400 RMB, which is close to the cost of the vehicle and vessel usage tax. Therefore, such a price is acceptable for the fuel taxi companies [34].
6. Conclusions
This paper initially analyzes the operating conditions and the business model of BEV, both at home and abroad, and obtains the key factors that affect the operation of BEV. Then the cost composition and optimized targets of BEV system are introduced. Moreover, this paper has established a cost optimization model of the BEV system based on the costs of BEV companies, battery charging/switching stations, passenger time, and carbon emission taxes. In addition, a BEV demand model and a layout optimization model of charging infrastructure have been built respectively on the basis of passenger travel demand and BEV charging demand. Finally, with the aim of minimizing the total cost of the BEV system, an optimized design model of the BEV system has been established based on the three models mentioned above. This model is mainly used for optimizing four aspects of BEV system: the fleet size, the vehicle configuration, the number, and the location of charging infrastructure. To verify this model, a specific case study has been provided and several conclusions are drawn as following:
- The cost of taxi companies accounts for the largest proportion of the total cost of the BEV system, mainly due to high labor costs. Different vehicle types have little effect on the cost of a passenger’s time.
- The key to reducing the cost of charging stations lies in reducing the cost of building fixed charging stations, which is also called the cost of charging equipment.
- The total cost of the battery switching BEV system is lower than the battery changing BEV system and the effective operating time of the battery switching model is also longer than the battery charging model. Moreover, the total cost of the PHEV taxi system is less than the battery charging BEV system, and its costs from carbon emissions are also less than ICEV and HEV, thus the PHEV taxi system, to a certain extent, is worthwhile to be promoted.
- According to passenger travel demands and the transportation situation in Tongzhou District, the best driving distance of BEV is 250 km. As for PHEV taxi, the driving distance should be no more than 100 km and the purchasing price should be no more than 240,000 RMB.
- Taking the battery charging time and replacement cost into consideration, the daily operating time of BEV should be no more than 16 h per day, with its operating distance no more than 380 km.
- To reflect the efficiency of BEV in carbon emission reduction, it’s recommended to impose a carbon tax on fuel taxis and the price of the carbon tax in the initial period should be no more than 20 RMB per ton.
Author Contributions
All three authors took part in designing the optimization method and process of electric taxi systems. Then, X.L. worked on the Cost Optimal Model of Electric Vehicle Taxi Systems, the Demand Model of Electric Vehicle Taxi and the Optimal Design Model of Charging Facilities of Electric Vehicle Taxi. N.W. was responsible for the Optimal Design Model of Electric Vehicle Taxi Systems. D.D. did the case application. Finally, X.L. wrote this paper.
Acknowledgments
This study was supported by grants from the Fundamental Research Funds for the central Universities (Grant nos. kx0170020172681) and the Shanghai Soft Science Research Project (Grant nos. 18692109400).
Conflicts of Interest
The authors declare no conflict of interest.
References
- SAE-China. China Automotive Technology and Development Report 2016; Beijing Institute of Technology Press: Beijing, China, 2016. [Google Scholar]
- Daganzo, C.F. An approximate analytic model of many-to-many demand responsive transportation systems. Transp. Res. 1978, 12, 325–333. [Google Scholar] [CrossRef]
- Nourbakhsh, S.M.; Ou, Y. A structured flexible transit system for low demand areas. Transp. Res. Part B Methodol. 2012, 46, 204–216. [Google Scholar] [CrossRef]
- Douglas, G.W. Price regulation and optimal service standards: The taxicab industry. J. Transp. Econ. Policy 1972, 6, 116–127. [Google Scholar]
- De Vany, A.S. Capacity utilization under alternative regulatory restraints: An analysis of taxi markets. J. Polit. Econ. 1975, 83, 83–94. [Google Scholar] [CrossRef]
- Shreiber, C. The Economic Reasons for Price and Entry Regulation of Taxicabs. J. Transp. Econ. Policy 1975, 9, 268–279. [Google Scholar]
- Sathaye, N.; Kelley, S. An approach for the optimal planning of electric vehicle infrastructure for highway corridors. Transp. Res. Part E Logist. Transp. Rev. 2013, 59, 15–33. [Google Scholar] [CrossRef]
- Schaller, B. Entry controls in taxi regulation: Implications of US and Canadian experience for taxi regulation and deregulation. Transp. Policy 2007, 14, 490–506. [Google Scholar] [CrossRef]
- Carpenter, T.; Curtis, A.R.; Keshav, S. The return on investment for taxi companies transitioning to electric vehicles. Transportation 2013, 41, 785–818. [Google Scholar] [CrossRef]
- Sathaye, N. The optimal design and cost implications of electric vehicle taxi systems. Transp. Res. Part B Methodol. 2014, 67, 264–283. [Google Scholar] [CrossRef]
- Lu, J.; Wang, W. Comparing Method of Urban Taxi Ownership. J. Transp. Eng. 2004, 4, 92–95. [Google Scholar]
- Zhang, Y.; Chen, Z. Study on Taxi Pricing Mechanism under Asymmetric Information Conditions; Consumer Economics; 2005; Volume 21, pp. 51–54. (In Chinese) [Google Scholar]
- Cai, Y.; Wang, H.; Ye, Q.; Ouyang, M. Business model of charging and battery swap service of electric taxi in Shenzhen and Hangzhou. J. Automot. Saf. Energ. Conserv. 2013, 4, 54–60. [Google Scholar]
- Guo, Y. Evaluation and Analysis of Investment Benefit of Electric Taxi Demonstration Project. Transp. Enterp. Manag. 2010, 12, 9–11. [Google Scholar]
- Gong, Z. Research on Pricing Model of Electric Taxi Service; Tongji University: Shanghai, China, 2013. [Google Scholar]
- Wang, N.; Fu, G.; Li, Z. Pure electric taxi economic efficiency and service pricing analysis model. J. Tongji Univ. Nat. Sci. Ed. 2014, 42, 976–982. [Google Scholar]
- Zhang, D.; Jiang, L.; Zhang, W. Optimization of Charging Pile for Electric Taxi. J. Electr. Eng. 2015, 30, 181–188. [Google Scholar]
- Wang, N.; Gong, Z.; Ma, J. Development prospects analysis based on the economic and emission benefits of hybrid and pure electric bus. China Soft Sci. 2011, 12, 57–65. [Google Scholar]
- Feng, S.M.; Gao, H.; Guo, C.X. Evaluation of Urban Road Network Structure. J. Harbin Inst. Technol. 2007, 39, 1610–1613. [Google Scholar]
- Qi, G.; Pan, Y.; Li, S. Prediction of passenger waiting time based on taxi trajectory data. J. Softw. 2013, 24, 14–23. [Google Scholar]
- Zhang, Z. Study on Reasonable Scale of Urban Taxi Capacity; Chang’an University: Xi’an, Shaanxi, China, 2014. [Google Scholar]
- Liu, X. Study on Optimization of Continuous Emergency Logistics Facility Location based on Weighted Voronoi Diagram; Jilin University: Changchun, Jilin, China, 2014. [Google Scholar]
- Qi, C. Study on Electric Vehicle Charging Network Planning System based on Weighted Voronoi Diagram; North China Electric Power University: Beijing, China, 2014. [Google Scholar]
- Beijing Transportation Development Research Center. Beijing Urban Transport Development Report 2011; Beijing Transportation Development Research Center: Beijing, China, 2011; pp. 2–3. [Google Scholar]
- The fifth comprehensive traffic survey joint meeting of Shanghai. In Shanghai Fifth Comprehensive Traffic Survey; Shanghai Urban and Rural Construction and Transportation Development Institute: Shanghai, China, 2015.
- Urban and Rural Planning and Design Institute of Jiangsu Province, Southeast University School of Transportation. Suzhou City Comprehensive Transportation Planning; Southeast University: Nanjing, Jiangsu, China, 2001. [Google Scholar]
- Traffic Management Planning of Kunshan City; Southeast University: Nanjing, Jiangsu, China, 2002.
- School of Transportation, Southeast University. City Urban Transport Planning of Zhangjiagang City; Southeast University: Nanjing, Jiangsu, China, 2002. [Google Scholar]
- Chen, L. Study on Layout Planning of Electric Taxi Charging Station; Beijing Jiaotong University: Beijing, China, 2015. [Google Scholar]
- Zhao, J. Consumer Cost Analysis of Plug-in Hybrids based on Advisor Modeling; Tongji University: Shanghai, China, 2010. [Google Scholar]
- China Automotive Technology Research Center, Nissan (China) Investment Co., Ltd.; Dongfeng Motor Co., Ltd. New Energy Vehicle Blue Book: China New Energy Automotive Industry Development Report (2012); Social Science Literature Publishing House: Beijing, China, 2012; pp. 326–328. [Google Scholar]
- Schroeder, A.; Traber, T. The economics of fast charging infrastructure for electric vehicles. Energ. Policy 2012, 43, 136–144. [Google Scholar] [CrossRef]
- China Carbon Trading Network. Carbon Market Quotes. Available online: http://www.tanjiaoyi.com/ (accessed on 7 February 2016).
- Zhang, X.; Zhong, J. Study on the Levy of Carbon Dioxide Emission Tax in China. Econ. Rev. 2010, 8, 71–75. (In Chinese) [Google Scholar]


© 2018 by the authors. Licensee MDPI, Basel, Switzerland. This article is an open access article distributed under the terms and conditions of the Creative Commons Attribution (CC BY) license (http://creativecommons.org/licenses/by/4.0/).