Article

The Impact of Green Lending on Credit Risk in China

1
School of Environment, Enterprise and Development (SEED), University of Waterloo, 200 University Avenue West, Waterloo, ON N2L 3G1, Canada
2
College of Business, Northern Illinois University, 740 Garden Rd, DeKalb, IL 60115, USA
*
Author to whom correspondence should be addressed.
Sustainability 2018, 10(6), 2008; https://doi.org/10.3390/su10062008
Submission received: 26 April 2018 / Revised: 31 May 2018 / Accepted: 11 June 2018 / Published: 14 June 2018

Abstract

:
This study explores China’s green credit policy from a credit risk perspective. Green finance has been growing rapidly in China since the government issued its Green Credit Policy. The objective of this study is to explore whether green loans are less risky than non-green loans. Based on a five-year dataset of 24 Chinese banks, we used panel regression techniques, including two-stage least square regression analysis and random-effect panel regression to examine whether a higher green credit ratio reduces a bank’s non-performing loan ratio (NPL ratio). The results suggest that allocating more green loans to the total loan portfolio does reduce a bank’s NPL ratio. We conclude that institutional pressure by the Chinese Green Credit Policy has a positive effect on both the environmental and the financial performance of banks. The study contributes to the literature on the correlation between green lending and credit risks, as well as to the literature on the impact of institutional pressure on environmental and financial risks.

1. Introduction

The financial sector can both promote and hinder a cleaner environment [1]. Banks, for instance, can choose to lend money to clean or dirty industries. Due to their key role in providing capital to all economic sectors, banks and other financial institutions have a great deal of leverage in transitioning to a greener economy.
For 25 years, banks and other investors have addressed environmental issues through voluntary codes of conduct, such as the United Nation’s (UN) Environment Programme’s Financial Initiative [2], the Equator Principles for Project Finance [3], and the UN Principles for Responsible Investment (UNPRI) (www.unpri.org). Involvement in these voluntary initiatives helps signatories improve their reputation, public recognition, and risk management when coupled with stricter standards and increased transparency [4].
Newer developments have gone beyond voluntary codes of conduct to establish regulations and mandatory guidelines for green financing. Both the European Union and the European Banking Federation have issued guidelines for green and sustainable finance [5,6], and a number of largely industrializing countries, mostly members of the Sustainable Banking Network hosted by the International Finance Corporation (IFC), have introduced sustainability regulations for banks. China is the largest member of this group, and their 2007 Green Credit Policy has been addressed in many academic studies. The Green Credit Policy requires banks to offer green credit for environmental protection, emission reduction, and energy conservation projects, as well as restrict loans to high-pollution, high-emission, and overcapacity industries. In addition to reducing environmental harm, the policy also strives to reduce the financial risks that have been identified in heavily-polluting industries, with the intended added benefit of improving financial sector stability [7,8,9].
However, research studies present mixed results with regard to increasing the lending to greener clients and decreasing financial credit risk at the same time. While Hill [10] criticized Chinese banks for applying green credit guidelines only to domestic projects while ignoring international ones, Jiguang and Zhiqun [11] discussed missing carbon pricing policies that are in line with the Green Credit Policy. Furthermore, Zhang, et al. [12] and Zhao and Xu [8] discussed the implementation issues of the policy [8,10,11,12]. However, it is important to ask whether the Green Credit Policy has been able to de-risk the financial industry and provide more green credit at the same time.
The study conducts an empirical assessment of the Green Credit Policy’s success. We used the non-performing loan (NPL) ratio as a performance indicator for credit risk. An NPL is a loan in which the debtor fails to make scheduled payments for at least 90 days. The research objective is to understand the financial risks associated with green lending in comparison to conventional lending. Consequently, our research question is whether an increase in green lending decreases the NPL ratio of Chinese banks.
Using a sample of 24 Chinese banks, we applied panel regressions using a two-stage least square regression analysis (2SLS) and random-effect panel regression (RE) to examine whether the Chinese banks’ green finance practices actually reduce financial risk. The results suggest that higher green loan ratios reduce non-performing loan (NPL) ratios. We conclude that institutional approaches, such as the Chinese Green Credit Policy, are able to increase the ratio of green credit in lending portfolios and reduce credit risks.
The results contribute to knowledge about the institutional impact of financial sector sustainability regulation on credit risk [13]. Furthermore, the study advances the scholarship on the financial risks of green loans [14,15], and fills a gap in the research on the effect of the Chinese Green Credit Policy on green lending.

2. Background

This section provides historical context for the Chinese Green Credit Policy and outlines current research addressing the policy. In 2007, the State Environmental Protection Administration (SEPA), the People’s Bank of China (PBOC), and the China Banking Regulatory Commission (CBRC) published a joint policy: the Opinion on Implementing Environmental Regulations and Managing Credit Risks [7,16]. The policy requires banks to allocate more investment toward green industries, constrain investments in polluting and overcapacity industries (high-pollution, high-emission, and overcapacity, also known as “two-high and one-over”), and withdraw financing from prohibited industries that have been primarily targeted for their negative environmental impact.
Pollution control facilities, environmental protection and infrastructure, renewable energy, circular economics, and environmentally-friendly agriculture all qualify for loans with reduced interest rates under the policy [8,9]. Loans to polluting industries have to be limited and even withdrawn when environmental controversies or regulatory non-compliance occur [17]. These regulations are compulsory for all Chinese banks, regardless of ownership structure, and thus cover government-owned banks, joint-stock banks, and credit unions [16].
To support the transformation to a greener economy, Chinese banks introduced environmental policies, strategies, and assessment systems to evaluate credit clients [18]. Subsequently, additional guidelines were put in place to support the development of the Green Credit Policy. In 2009, the China Banking Association issued guidelines on corporate social responsibility, asking banks to take on environmental responsibility in supporting national industrial policies and environmental policies. The CBRC issued a formal document entitled the Green Credit Guideline in 2012. The guideline encouraged “banking institutions to, by focusing on green credit, actively adjust credit structures, effectively fend off environmental and social risks, better serve the real economy, and boost the transformation of an economic growth mode and adjustment of economic structures” ([16], p. 1).
In 2014, the Chinese Banking Association, along with 29 banks, initiated a Green Finance Committee to organize activities, such as developing a green bonds standard, facilitating environmental stress tests for the banking sector, and organizing discussions about greening China’s overseas investment. In December 2015 and January 2016, the People’s Bank of China (PBOC) and the National Development and Reform Commission (NDRC) released their Green Bond Guidelines, making China the first country in the world to publish official rules for the issuance of green bonds [19].
The impact of the release of the Green Credit Policy in 2007 is reflected by the growth of green credit. By the end of 2015, China’s financial institutions provided a total of 8.08 trillion RMB (approximately 1.24 trillion USD) in green credit. The 21 major banks and financial institutions granted 7.01 trillion RMB in green credit, amounting to 9% of their total outstanding loans. In a press release in September 2016, the CBRC claimed that the balance of energy-saving and environmental protection projects and services of the 21 major banks’ non-performing loans was 22.625 billion, or 0.41% in terms of NPL ratio, which is a value that is 1.35% lower than the NPL ratio of all of the loans. The China Banking Regulatory Commission [20] also claimed that the overall quality of energy-saving and environment protection projects and services was excellent, and that these projects and services are saving 435 million tons of CO2 per year.

3. Literature Review

Whether the Green Credit Policy has achieved its stated environmental objectives or not remains an open question [8,10,11,12]. Some studies suggest that the Green Credit Policy, similar to other policies that integrate environmental and financial objectives [21,22,23], has had a positive influence on sustainable development [24,25], while others provide a critical view of its effect on sustainable development [17].
Studies on green lending outside of China suggest that integrating sustainability criteria has increased the quality of the credit risk assessment significantly and contributed to decreasing the NPL ratio [14,26]. Furthermore, it has been found that lenders price the corporate social responsibility (CSR) risks of their borrowers into the interest rates they offer [27], that borrowers with higher environmental performance have both a higher financial performance and lower credit risks [15], and that there is a correlation between credit spread and corporate social responsibility (CSR), since borrowers with low corporate social performance (CSP) pay higher interest rates than borrowers with high CSP [28]. Also, greater environmental concerns appear to line up with higher costs of debt, and proactive environmental practices correlate with lower costs of debt [29,30].
Studies on green lending elsewhere in Asia are less frequent. Mengze and Wei [31] found that China is comparable to the Republic of Korea and Thailand with regard to the integration of environmental risks into credit risk management. Other Asian countries, such as Bangladesh, have recently introduced green credit policies, but the impact of these policies has yet to be studied [26]. With regard to CSR generally, the Asian financial sector has been strong with regard to its environmental impact. Indeed, the Asian financial sector often performs better its North American counterparts in addressing environmental concerns [32].
While all of these studies suggest that green lending improves banks’ risk of credit exposure, they do not address the institutionally quite distinct Chinese banking system. Furthermore, one recent study analyzed the financial performance of Chinese banks, but neither address credit risks nor the NPL ratio [13].
Most research on the Chinese Green Credit Policy is conceptual, and conducted from a public policy-maker’s perspective on the Green Credit Policy rather than from a credit risk research perspective. For instance, Jin and Mengqi [17] argued that there are weaknesses in the Green Credit Policy, such as the lack of a standard, poor communication of environmental information between banks and corporations, over-intervention by regional governments, the need for more knowledge and awareness of environmental risks and opportunities for banks, and a lack of new green credit products.
Ye and Li [33] stated that the development of green credit needs to be backed up by policies such as risk compensation and guaranteed funding. Instead, the Green Credit Policy focuses on restrictions. Consequently, the lack of subsidization as a policy tool for reducing the costs of green lending is seen as barrier to adoption [34]. Similarly, Wang and Zhang [35] suggested that the low interest and high risks associated with green credit should be compensated for. However, there is some evidence that the Green Credit Policy improves the environmental risk performance of commercial banks [13,36,37,38]. Furthermore, Zhao [39] found that the Green Credit Policy has a positive effect on energy-saving, emissions reduction, and economic development, while Zhang and He [40] found that green lending supports environmentally-friendly industries.
The mixed results and the lack of empirical studies analyzing the financial risks of green credit leaves a gap, since current studies about financial risks and opportunities of green lending either focus on the content of the Chinese Green Credit Policy [41] or on the financial consequences of green lending outside of China [26]. However, it has been suggested that the growth in green lending following the implementation of the Green Credit Guidelines might create win–win situations [17,31]. However, other scholars suggest that only if banks have the capacity to assess environmental and social risks and opportunities in their credit risk assessment, would they see a reduction of credit risks [42], and increase the green credit ratio [43]. Therefore, understanding the consequences of mandatory green lending policies on credit risks is important for both policymakers and lenders, since environmental and financial performance is often seen as a trade-off [1].
In line with other studies analyzing credit risk to lenders [44,45], we used the NPL ratio for our credit risk indicator, as the main goal of this study is to analyze the impact of green lending on lenders’ risks rather than individual risk to borrowers. The NPL ratio has been found to be a good predictor of lenders’ risk by a number of studies that also analyzed the economic and institutional impact on the NPL ratio [46,47]. Therefore, in line with other studies with similar goals [44,45,48], we used the NPL ratio as our measure of risk.
Consequently, this study analyzes the impact of the green credit ratio on lenders’ NPL ratio. We hypothesize that a higher ratio of green lending decreases the NPL ratio.

4. Theory

Theoretically, this study is based on institutional theory [49] and credit risk theory [50]. First, the increase of green credit is driven by the Green Credit Policy as an institutional mechanism forcing Chinese banks to increase green lending. The national government and many regional governments support Chinese green firms and projects, incentivizing investment in green business activities while decreasing their risk [7,51,52]. This leads to coercive institutional isomorphism caused by political influence and maintaining legitimacy [49]. All types of Chinese banks, whether governmental or public, have to follow the Green Credit Guidelines if they want to maintain their full legal license. Therefore, they all engage in green lending and follow the standardized operational procedures.
Second, credit risk theory outlines the components of credit risk. Theoretically, credit risk can be explained through a borrower’s capital stock, earnings, liquidity, and other related financial and management indicators recognized as credit risks that influence the borrower’s ability to repay the loan [50,53,54]. Lenders that integrate environmental and sustainability indicators into their credit risk assessment should have a lower NPL ratio, because the environmental performance of borrowers influences their credit risk, and therefore is an additional significant credit risk assessment indicator [14,27,29].

5. Methods

We used the NPL ratio because it is a widely accepted indicator of how much risk a lender holds at a specific point in time [55,56]. A NPL is a loan in which the debtor fails to make scheduled payments for at least 90 days. Hence, a NPL is either in default or close to being in default of repayment. Typically, once a loan is considered non-performing, the likelihood that it will be repaid in full is low.
The NPL ratio is the amount of non-performing loans relative to all loans, expressed as a percentage. Studies suggest both macroeconomic and bank-specific determinants affect the NPL ratio of a bank [45]. Using the NPL ratio to analyze credit risk is in line with many other studies analyzing the credit risk to both Chinese lenders [57,58,59,60] and lenders in other countries [46,48,61]. The rationale for using the NPL ratio instead of the restructured loans ratio is that it has been characterized as an indicator that is able to predict banking crises [62], that its definition is clearer than other measures (failure to pay for 90 days), and that it is used as an indicator by financial regulators. Furthermore, loans could also be restructured for other reasons than being at risk of default. This is particularly true in China, where loans have a history of being restructured for political reasons [63].

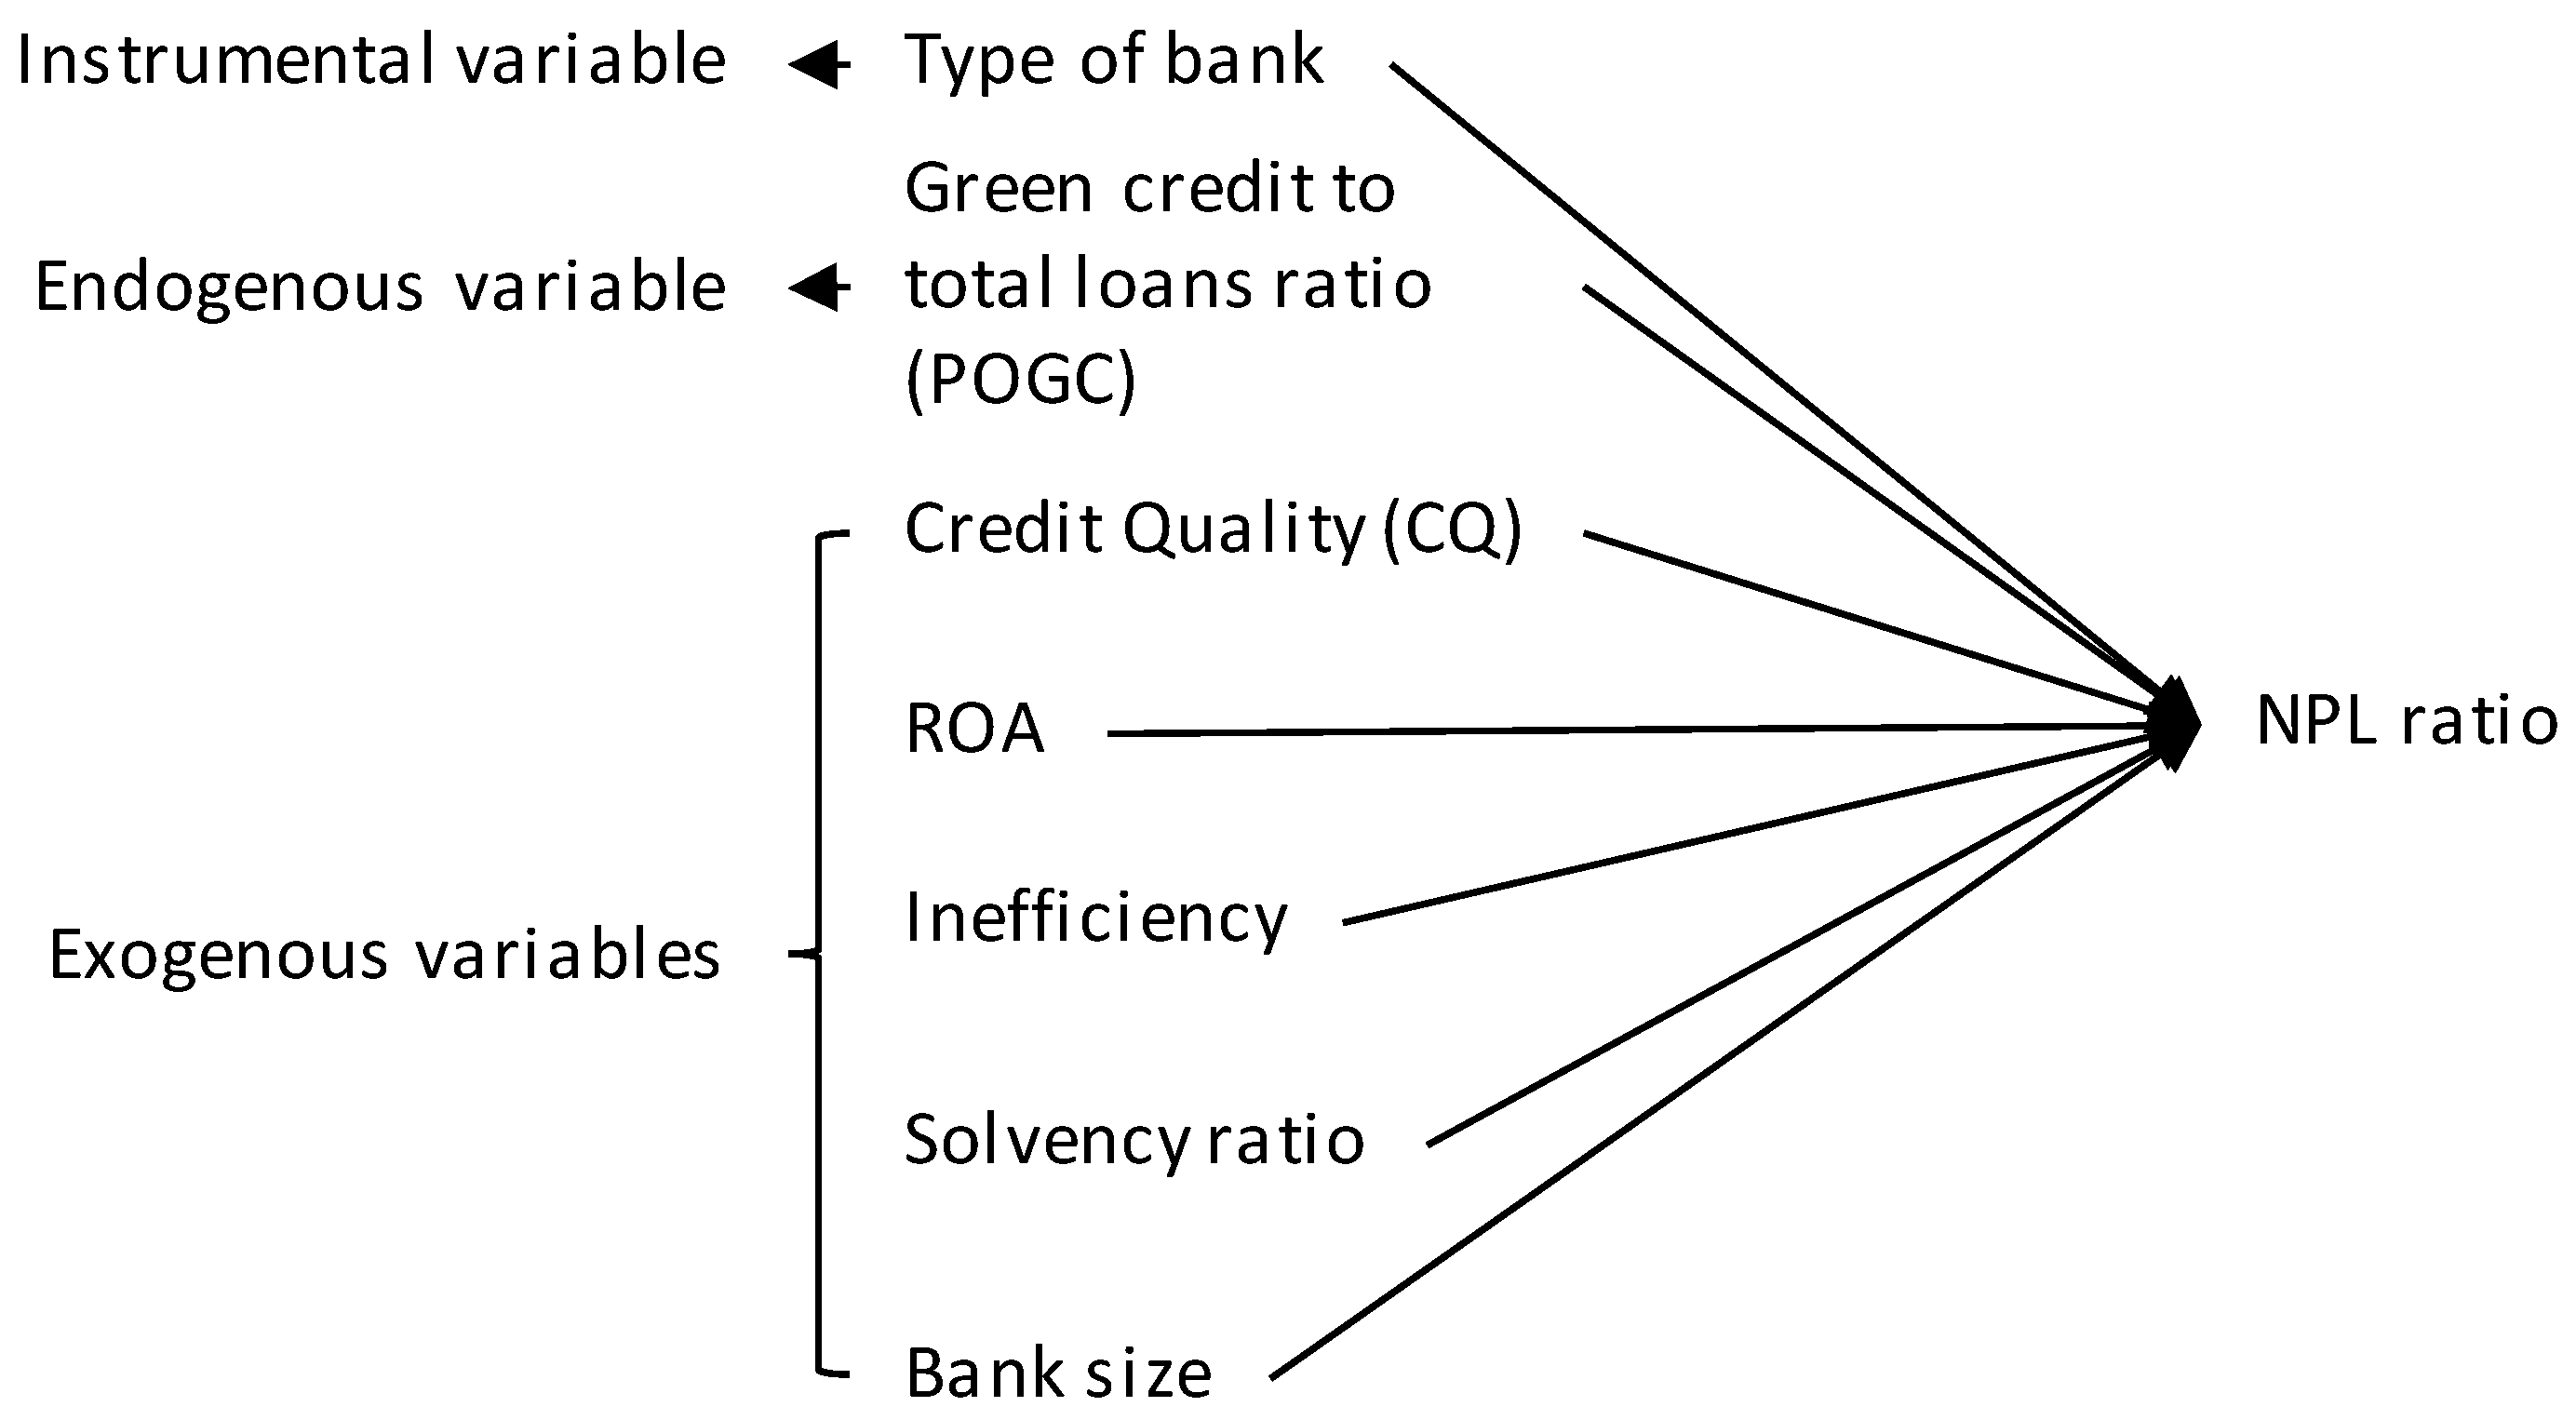
5.1. Regression Model

To test the influence of green credit on the NPL ratio of the banks in the sample, a two-stage least square (2SLS) regression model has been used, because many economic models are endogenous [64]. The Durbin–Wu–Hausman test [65] has been applied to test whether the 2SLS model is more efficient than the random-effect model. In fixed models, the error term and constant cannot be correlated with other variables. Moreover, a fixed-effects model can be biased because of the incidental parameters problem [66]. In contrast, a random-effects model is preferred, because it analyzes two sources of variance: variance between subjects and variance within the subject over time [67]. The random-effects model assumes that differences across entities have an influence on the dependent variable, and that omitted or unobserved variables are not correlated with the observed variables [68].
Endogeneity can arise because of (1) model misspecification or omitted variables; (2) measurement errors; or (3) simultaneity [64,69]. A 2SLS regression model is commonly used to address endogeneity through the use of instrumental variables. The instrumental variables must be correlated with the endogenous variables, but should not correlate with the error term [64].
Our 2SLS model starts with replacing the endogenous variable (proportion of green credit) with a predicted version, which was formed by regressing this variable on all of the exogenous variables and instrumental variables. The predicted endogenous variable is then used to regress the dependent variables (see Equation (1)).
Equation (1): Two-stage least squares model
First   stage : X ^ = γ 0 + γ 1 Z + γ 2 W + u Second   stage : Y = β 0 + β 1 X ^ + β 2 W + u
where
X ^ = predicted the management’s decision on the proportion of green credit in terms of total loans,
Y = NPL ratio,
Z = instrumental variable (type of bank),
W = exogenous variables (credit quality, Return on Assets (ROA), cost efficiency, solvency, size of bank).
The basic 2SLS estimation model is composed of the dependent variable (Y), endogenous variables (X), instrumental variables (Z), and exogenous variables (W). The model is in line with Berger and DeYoung [70], Louzis, Vouldis, and Metaxas [61], and Ghosh [45]. The following section describes the dependent, instrumental, endogenous, and exogenous variables used in the model.

5.2. Dependent Variable

The NPL ratio is the dependent variable in this model. Year-end NPL ratio is used to reflect the credit risk at a certain point in time (Equation (2)).
Equation (2): NPL ratio
NPL   ratio = NPL   ( year end ) Total   loans   oustanding   ( year end )
The proportion of green credit to total loans (POGC) is the predicted management’s decision on the proportion of green credit relative to total loans (Equation (3)). Our hypothesis assumes that POGC influences the NPL ratio negatively.
Equation (3): Proportion of green credit to total loans (POGC)
POGC = Green   credit   balance   ( year end ) Total   outstanding   loans   ( year end )

5.3. Instrumental Variable

In addition to endogenous variables, we controlled for instrumental variables. For instance, the type of bank matters due to government influence. Those banks that have strong connections with the government, such as state-owned banks and development banks, are more responsive to the Green Credit Policy than non-state owned banks. National joint-stock banks and city commercial banks are also influenced by the government to a certain degree. In line with Weber [13], the type of bank is coded on an ordinal scale of 1 to 5 (city commercial banks = 1, postal savings bank = 2, national joint-stock commercial banks = 3, state-owned commercial banks = 4, policy banks = 5). The scale reflects the government influence on the banks.

5.4. Exogenous Variables

The credit quality (or ‘loan loss provision to total loans’) reflects a bank’s credit quality (see Equation (4)). Low credit quality is often explained as a result of moral hazard [71], and obviously has an influence on the NPL ratio.
Equation (4): Credit quality
CQ it = Loan   loss   provision it Total   loans it
Often, high NPL ratios are found in banks with a low ROA [72]. Banks with a lower ROA might take higher credit risks to increase their returns. Therefore, we add ROA as an exogenous variable (Equation (5)).
Equation (5): ROA
ROA it = Net   profits it Total   assets it

5.5. Efficiency

The efficiency effect is controversial. The ‘skimping hypothesis’ and the ‘bad management hypothesis’ [70] both apply to this indicator. The ‘skimping hypothesis’ suggests that banks with fewer resources to monitor loans are more cost-efficient. In contrast, the ‘bad management hypothesis’ argues that substandard managers often grant low-quality loans. These two effects offset each other. Hence, the overall effect of efficiency (see Equation (6)) on the NPL ratio is ambiguous.
Equation (6): Efficiency
INFF it = Operating   expenses it Operating   income it

5.6. Solvency

The solvency ratio (see Equation (7)) is used to reflect the bank’s leverage. According to Berger and DeYoung [70], a low solvency ratio indicates a ‘moral hazard’ issue, and might lead to a higher NPL ratio.
Equation (1): Solvency ratio
SOLR it = Total   equity it Total   assets it

5.7. Bank Size

The ‘too-big-to-fail hypothesis’ underlines the importance of this indicator. In larger markets, banks commonly take risks, as they may seek government protection in the case of failure [73]. Therefore, this indicator is expected to influence the NPL ratio positively. We used the proportion of a bank’s assets compared to all of the assets in the sample as an indicator for the size of a bank (see Equation (8)).
Equation (8): Bank size
SIZE it = Total   assets it i = 1 24 Total   assets it
The endogenous, exogenous, and instrumental variables that are used in the model are presented in Figure 1.

6. Sample

Banks were selected based at least on one of two criteria. First, the banks that are considered “major banks” in China were included. Second, publicly listed banks were also considered for our sample. According to the CBRC, 21 “major banks” exist, including all policy banks, state-owned commercial banks, and national joint-stock commercial banks, as well as the Postal Savings Bank of China. Publicly listed banks were selected because they disclose annual reports that allow for the creation of the dataset needed for our analysis. The disclosure requirements are set by the China Securities Regulatory Commission (CSRC). As of September 2016, a total of 33 banks were listed on either the Shanghai Stock Exchange (SSE), the Shenzhen Stock Exchange (SZSE), or the Hong Kong Stock Exchange (SEHK) for global investors.
Initially, 39 banks met at least one of the two criteria. The original list of bank included three policy banks, five state-owned commercial banks, 12 national joint-stock banks, one postal savings bank, 14 city commercial banks, and four rural commercial banks. Due to the non-availability of data, 15 of these banks were removed from our dataset. The remaining banks in the sample are presented in Table 1.
Financial data was gathered from the stock exchange websites and the official websites of the banks. Green credit data has been collected from CSR, environmental, and sustainability disclosures. The data has been published based on key indicators set by a “Notice of the China Banking Regulatory Commission on Key Performance Indicators of Green Credit Implementation” [74]. The CBRC notice describes the indicators that measure the performance of Chinese banks with regard to the Green Credit Policy. For instance, banks should disclose credits to projects for environmental protection and emission reduction for loans for emerging strategic industries for energy-saving and environmental protection, new energy, and new-energy vehicles.
Data between 2009 and 2015 has been collected. We did not use data before 2009 for two reasons. First, the CBRC issued the first guidelines on environmental responsibility for banks in 2009, rendering previous data inconsistent with post-2009 data. Second, from 2006 to 2008, a substantial portion of non-performing loans were restructured and outsourced to ‘bad banks’ prior to the initial public offerings (IPO) of many large Chinese banks. The outsourcing caused an abrupt and significant change in the NPL ratio between 2006–2008 [75].
To deal with missing data, we imputed the missing green credit data based on the compound annual growth rate (CAGR). CAGR has been used, because the green credit balance accumulates over time, and therefore missing values can be estimated based on the multiple year growth. However, banks with less than three years of green credit balance data were excluded from the sample, as this would be insufficient to produce reasonable estimates. The restriction excluded 13 of 39 banks from our sample. Along with the exclusion of the Agricultural Development Bank of China (ADBC) and Bank of Guiyang due to the lack of financial data, we analyzed a sample of 24 banks. The reduction of the sample reduced the total assets of the sample by only 9%. The sample still represents 72% of the total assets of Chinese banks between 2009–2015 [76]. Thus, the sample can be seen as representative of the Chinese banking sector.
Half of the remaining banks did not require any data imputation, while 33% had a green credit balance available for five or six periods, requiring imputation for only one or two periods, and only 17% needed imputation for three or four periods. To test the influence of the data imputation on the sample, we used an unpaired t-test to analyze the green credit ratio with and without data imputation across all of the years. The difference was not significant (p = 0.74, t = 0.34, N = 271).

7. Results

The results section presents the descriptive results first. Then, we will present the results of the regression models. The descriptive statistics for the variables used in the regression models are presented in Table 2.
The average green credit ratio (POGC) over all of the years is 3.4% with 4.8% in 2015 and 2.3% in 2009. This result suggests an increase in green lending, but also that the green lending ratio is still relatively small. Furthermore, Table 2 shows that the variables increase during the period between 2009 and 2015, indicating a growth in the Chinese financial sector. The only exception is “inefficiency”, which is decreasing over time.
Furthermore, we present correlations between the independent and dependent variables in Table 3. Only solvency has a significant correlation with a proportion of green credit. However, there are correlations between the independent variables that have to be controlled in the multivariate regression model.
An explorative correlation analysis split by the type of banks indicated that the highest correlation between the green credit ratio and the NPL ratio exists for state-owned commercial banks. The lowest correlation has been found for national joint-stock commercial banks.

Regression Models

Before calculating the regression models, an ANOVA was used to test the differences between types of banks with regard to their NPL ratio. The models are significant (p < 0.0001, F = 11.97). Significant differences appeared between state-owned banks and all of the other types of banks. State-owned banks have smaller NPL ratios than other banks. The differences between all other types of banks are not significant.
In order to avoid artifacts because of the distribution of the independent and dependent variables, we used transformation after conducting a ladder test [77]. Based on the results of the ladder test, we used the transformation with the lowest Chi2 value for the new normalized distribution. Table 4 presents the variables and the respective transformation. The following regression models use the normalized variables.
The results of the regression analyses based on the random-effects model (RE, Model 1) and on the two-stage least square model (2SLS, Model 2), including the standardized beta coefficients for the second stage model, are presented in Table 5. They suggest significant effects of the green credit ratio (POGC) on the NPL ratio (coefficientRE = −0.058, coefficient2sls = −0.231, p = 0.001). The results suggest that banks with a larger POGC have a lower NPL ratio. In addition, we tested one-year to five-year lagged models that did not suggest significant results.
In order to analyze whether Model 1 or Model 2 are valid, we conducted a Hausman test [65]. The test resulted in p = 0.7008 (Chi2 = 3.82), indicating the existence of endogeneity for Model 1 (RE). Therefore, the fixed 2SLS model (Model 2) will be used for further analysis. In addition, we analyzed multicollinearity using the variance inflation factor (VIF). The average VIF is 1.37 with the ROA having the highest VIF with 1.67. These values are far below the threshold value of five [78]. Therefore, we can assume that the results are not influenced by collinearity. Furthermore, the root mean square error (Root MSE) is near 0, indicating the goodness of fit of the first-stage model. The mean of the residuals is x ¯ = 0.00, with a standard deviation of sd = 0.03.
In addition, we conducted a robust regression analysis using the banks as clusters to control for outliers and the influence of the banks on the result. The results suggest the same r2 for the regression function with a statistical significant coefficient for the green credit ratio (p = 0.048). Finally, we used the leave-one-out method to analyze whether the model holds if one or more banks are removed from the sample. The leave-one-out method resulted in a pseudo r2 = 0.346, with a Root MSE = 0.020 and a mean absolute error MAE = 0.015. These results suggest that the model is still valid.
The standardized beta coefficients presented in the last column of Table 5 indicate that the influence of the green credit ratio on the NPL ratio is higher than the influence of the other independent variables, respectively. The 2SLS model suggests that a 1% increase in the green credit ratio reduces the NPL ratio by 0.00231. Furthermore, as expected, the credit quality has a significant effect on the NPL ratio (coefficientCredit quality = 0.047). The ROA has a significant negative impact on the NPL ratio (coefficientROA = −158.19), while the impact of inefficiency is significant as well (coefficientinefficiency = 0.002). Furthermore, the size of the banks (coefficientsize = 0.011) has a significant impact on the NPL ratio, while the influence of solvency is not significant (coefficientsolvency = 0.144). Finally, there is no significant influence of the year. The model explains 39% of the variance of the NPL ratio with p < 0.00001.
Though the Hausman test indicated the appropriateness of a random model [79], we also conducted a fixed-effects regression model. The model is also significant (p < 0.001).

8. Conclusions

This paper addresses the current lack of empirical studies examining the Chinese Green Credit Policy with regard to its impact on the banks that it regulates. Current studies, including Hu and Cao [38], Aizawa and Chaofei [7] and Wei [36], focus on the analysis of the policy’s content rather than its consequences for credit risk. Other studies addressed implementation issues [12] or analyzed the consequences of the policy from a macro-level perspective [17,39]. Finally, another group of studies explored the correlation between financial return indicators and banks’ environmental performances [13].
Our study provides empirical evidence for the benefits that the Green Credit Policy creates for Chinese banks with regard to reducing credit risks. Our results suggest that banks with a higher ratio of green lending have a lower NPL ratio. This result is in line with other empirical studies, which find positive correlations between the environmental performance of borrowers and their credit risk in other countries and regions [14,26,27,29]. These studies also found a positive correlation between the integration of green lending criteria into credit risk management and the resulting credit risk. The study broadens current knowledge, primarily because it addresses Chinese banks and the institutional influence of a green financial policy, such as the Chinese Green Credit Policy.
The results contribute to institutional theory by demonstrating that the Green Credit Policy caused institutional pressure [4] to increase green lending. Based on institutional theory, our results could be explained as following: the Chinese Green Credit Policy applied coercive institutional pressure to increase the green loan ratio. This increase has a positive effect not only on the environment, but also on the credit risk of Chinese banks, because green borrowers bear lower risks than non-green borrowers. The higher risks of borrowers from polluting industries can be explained by the Chinese policy that strives to reduce the overcapacity in polluting industries, because they are both polluting and carry lower profits due to the lower demand for their products [9]. Therefore, being environmentally unfriendly creates a material risk for borrowers, and being green reduces that risk.
Related to credit risk theory, environmental risks influence major credit risk components, such as Altman’s [50] liquidity, profitability, and solvency ratio directly because of higher environmental costs and less income from non-green businesses. Furthermore, higher interest rates for polluting borrowers and even restrictions with regard to access to credit reduce their solvency and activity ratio. Therefore, a combination of institutional theory and ratio analysis [80] delivers the theoretical background for explaining our results.
Although some studies found a relatively low institutional pressure on firms to perform well with regard to CSR in China [81], the implementation of the Green Credit Policy may have created institutional pressure on the Chinese financial sector, because it addresses both the environment and financial performance. Therefore, Chinese banks take CSR seriously [82], and increase their green lending. Furthermore, their commercial borrowers also increase their environmental performance because of both institutional [83] and market pressure [28,84].
Also, government subsidies that offered to encourage projects for energy conservation, emission reduction, and ecological environmental protection [85,86], could have contributed to the decrease of the NPL ratio. Since the government may withdraw its subsidies in the future, it is unclear how much of the lower NPL is driven by subsidization.
The study also finds that that the degree of central government ownership of banks has a significant effect on how much green credit a bank allocates. Banks with large amounts of shares controlled by the State and state-owned enterprises (SOEs), such as policy banks and state-owned commercial banks, are more willing to allocate a large proportion of green credit according to the results of the two-stage model. This is in line with the works of Lardy [87] and Zhang, Yang, and Bi [12] who suggest that state-owned commercial banks function as an extension of the country’s policy in helping achieve economic targets.
Furthermore, our results contribute to credit risk theory by adding the environmental performance of borrowers to the list of indicators explaining commercial credit risk [50,53,54]. The environmental performance of borrowers has a significant impact on their credit risk, and therefore can be used as an additional credit risk assessment indicator in order to improve the validity of credit risk assessment in the Chinese context. The research complements other studies with similar results that have been conducted in different countries and regions [14,27,29].
Similar to other studies, exogenous variables also have a significant impact on the NPL ratio of Chinese banks. The significant impact of credit quality [71], ROA [72], and inefficiency, as well as the size of a bank [73] suggests that the NPL ratio of Chinese banks is influenced by variables that also have an effect on the NPL ratio of banks outside of China. Therefore, implementing a green lending policy might be an effective way to decrease lending risks.
Other countries’ financial regulators and governments issue guidelines and regulations for green finance. The recent publications by the European Banking Federation [6] and the High-Level Expert Group of the European Commission on Sustainable Finance [5] emphasize the connection between green finance and financial stability in a similar way to the Green Credit Policy. This study can deliver insight into parallel efforts from a Chinese perspective, suggesting that research might address the impact of green lending on credit risk in Europe and other regions to see if these findings hold elsewhere.
Further research addressing the Chinese Green Credit Policy and its implications are needed. Still, a key limitation is the lack of green credit data, which is worsened by the general lack of data on credit risk over longer time periods. Since Chinese regulators ask for the disclosure of policy related key performance indicators (KPIs), future research should be based on more frequent and more reliable data. Additionally, individual credit scoring models, such as Altman’s z-score model [50], could be used to analyze the risks of green and non-green borrowers. Furthermore, comparative research between the Chinese Green Credit Policy and similar initiatives elsewhere would broaden the knowledge about the effect of green lending regulations. Finally, studies addressing the potential of the policy with regard to the growth of green lending might shine a light on the opportunities of financial sustainability regulations.

Author Contributions

Y.C. gathered the data, conducted the data analysis and wrote the research report. S.G. contributed to the theory and to manuscript writing. O.W. contributed to data analysis and to manuscript writing. H.L. contributed to data analysis and manuscript writing.

Funding

This research received funding from the Social Sciences and Humanities Council Canada (SSHRC).

Conflicts of Interest

The authors declare no conflicts of interest.

References

  1. Weber, O. The financial sector’s impact on sustainable development. J. Sustain. Financ. Investig. 2014, 4, 1–8. [Google Scholar] [CrossRef]
  2. UNEP. Statement by Banks on the Environment and Sustainable Development; United Nations Environmental Program: Rio de Janeiro, Brazil, 1992. [Google Scholar]
  3. The Equator Principles. The Equator Principles; The Equator Principles: Geneva, Switzerland, 2013; p. 24. [Google Scholar]
  4. Bai, Y.; Faure, M.; Liu, J. The role of China’s banking sector in providing green finance. Duke Environ. Law Policy Forum 2013, 24, 89–279. [Google Scholar]
  5. EU High Level Expert Group in Sustainable Finance. Financing a Sustainable European Economy; European Commission: Brussels, Belgium, 2018. [Google Scholar]
  6. European Banking Federation. Towards a Green Finance Framework; European Banking Federation: Brussels, Belgium, 2017. [Google Scholar]
  7. Aizawa, M.; Chaofei, Y. Green credit, green stimulus, green revolution? China’s mobilization of banks for environmental cleanup. J. Environ. Dev. 2010, 19, 119–144. [Google Scholar] [CrossRef]
  8. Zhao, N.; Xu, X.-J. Analysis on green credit in China. Adv. Appl. Econ. Financ. (AAEF) 2012, 3, 501–506. [Google Scholar]
  9. He, D.; Zhang, X. Thoughts about commercial banks under the green credit policy (translated). Chin. Acad. Soc. Sci. 2007, 12, 1006–1428. [Google Scholar]
  10. Hill, D. What Good Are China’s Green Policies If Its Banks Don’t Listen? Guardian. 16 May 2014. Available online: http://www.theguardian.com/environment/andes-to-the-amazon/2014/may/16/what-good-chinas-green-policies-banks-dont-listen (accessed on 13 June 2018).
  11. Jiguang, L.I.U.; Zhiqun, S. Low carbon finance: Present situation and future development in China. Energy Procedia 2011, 5, 214–218. [Google Scholar] [CrossRef]
  12. Zhang, B.; Yang, Y.; Bi, J. Tracking the implementation of green credit policy in China: Top-down perspective and bottom-up reform. J. Environ. Manag. 2011, 92, 1321–1327. [Google Scholar] [CrossRef] [PubMed]
  13. Weber, O. Corporate sustainability and financial performance of Chinese banks. Sustain. Account. Manag. Policy J. 2017, 8, 358–385. [Google Scholar] [CrossRef]
  14. Weber, O.; Scholz, R.W.; Michalik, G. Incorporating sustainability criteria into credit risk management. Bus. Strateg. Environ. 2010, 19, 39–50. [Google Scholar] [CrossRef]
  15. Zeidan, R.; Boechat, C.; Fleury, A. Developing a sustainability credit score system. J. Bus. Ethics 2015, 127, 283–296. [Google Scholar] [CrossRef]
  16. China Banking Regulatory Commission. Notice of the China Banking Regulatory Commission Cbrc on Issuing the Green Credit Guidelines; China Banking Regulatory Commission: Beijing, China, 2012; p. 6.
  17. Jin, D.; Mengqi, N. The paradox of green credit in China. Energy Procedia 2011, 5, 1979–1986. [Google Scholar] [CrossRef]
  18. Chan-Fishel, M. Time to Go Green Environmental Responsibility in the Chinese Banking Sector; Friends of the Earth and Banktrack: Amsterdam, The Netherlands, 2007; p. 107. [Google Scholar]
  19. International Institute for Sustainable Development. How to Issue a Green Bond in China; International Institute for Sustainable Development: Winnipeg, MA, USA, 2015. [Google Scholar]
  20. China Banking Regulatory Commission. Green Credit in Helping the Adjustment of Economic Structure and the Upgrade in Industry Transformation [Transl.]; China Banking Regulatory Commission: Beijing, China, 2016.
  21. Park, A.; Ren, C. Microfinance with Chinese characteristics. World Dev. 2001, 29, 39–62. [Google Scholar] [CrossRef]
  22. Song, W.; Xue, X.; Zhong, L. Microfinance performance in China’s rural areas: A perspective of regional differences. In Proceedings of the 2010 International Conference on Financial Theory and Engineering (ICFTE), Dubai, UAE, 18–20 June 2010; pp. 73–79. [Google Scholar]
  23. Wang, L.; Juslin, H. The impact of Chinese culture on corporate social responsibility: The harmony approach. J. Bus. Ethics 2009, 88, 433–451. [Google Scholar] [CrossRef]
  24. Scholtens, B.; Cerin, P.; Hassel, L. Sustainable development and socially responsible finance and investing. Sustain. Dev. 2008, 16, 137–140. [Google Scholar] [CrossRef]
  25. Stephens, C.; Skinner, C. Banks for a better planet? The challenge of sustainable social and environmental development and the emerging response of the banking sector. Environ. Dev. 2013, 5, 175–179. [Google Scholar] [CrossRef]
  26. Weber, O.; Hoque, A.; Islam, A.M. Incorporating environmental criteria into credit risk management in Bangladeshi banks. J. Sustain. Financ. Investig. 2015, 5, 1–15. [Google Scholar] [CrossRef]
  27. Goss, A.; Roberts, G.S. The impact of corporate social responsibility on the cost of bank loans. J. Bank. Financ. 2011, 35, 1794–1810. [Google Scholar] [CrossRef]
  28. Bae, S.C.; Chang, K.; Yi, H.-C. Corporate social responsibility, credit rating, and private debt contracting: New evidence from syndicated loan market. Rev. Quant. Financ. Account. 2017, 50, 261–299. [Google Scholar] [CrossRef]
  29. Bauer, R.; Hann, D. Corporate environmental management and credit risk. SSRN eLibrary 2010. [Google Scholar] [CrossRef]
  30. Erragragui, E. Do creditors price firms’ environmental, social and governance risks? Res. Int. Bus. Financ. 2017. [Google Scholar] [CrossRef]
  31. Mengze, H.; Wei, L. A comparative study on environment credit risk management of commercial banks in the Asia-Pacific region. Bus. Strateg. Environ. 2015, 24, 159–174. [Google Scholar] [CrossRef]
  32. Weber, O.; Diaz, M.; Schwegler, R. Corporate social responsibility of the financial sector–strengths, weaknesses and the impact on sustainable development. Sustain. Dev. 2014, 22, 321–335. [Google Scholar] [CrossRef]
  33. Ye, Y.; Li, X. Building the regulatory system for the green credit policy in China (trans.). China Bank. 2014, Z1, 70–74. [Google Scholar]
  34. Ma, J. On the construction of China’s green finance system. Financ. Forum 2015, 5, 18–27. [Google Scholar]
  35. Wang, Y.; Zhang, J. Evolution, impact, and development of the green credit policy (transl.). China Natl. Cond. Strengths 2014, 9, 45–47. [Google Scholar]
  36. Wei, G. Concern for the environmental risks and the construction of a green credit bank (transl.). Chin. Bank. 2010, 4, 27–31. [Google Scholar]
  37. Chang, M.; Wang, S.; Li, D. The Basis for the Implementation of Green Lending-Banking and Environmental Risk Management; Tsinghua University: Beijing, China, 2008; Volume 7. [Google Scholar]
  38. Hu, N.; Cao, D. Green credit policy and environmental risk management of commercial banks (transl.). Econ. Probl. 2011, 3, 103–107. [Google Scholar]
  39. Zhao, C. Commercial banks’ green credit practice as a support for the green economic transformation (transl.). Financ. Account. Mon. 2015, 32, 23. [Google Scholar]
  40. Zhang, X.; He, D. Financial and tax incentive policies for envionmental finance development: Global experience and revelation. Public Financ. Res. 2010, 5, 78–80. [Google Scholar]
  41. Cai, L.; Cui, J.; Jo, H. Corporate environmental responsibility and firm risk. J. Bus. Ethics 2015, 1–32. [Google Scholar] [CrossRef]
  42. Weber, O.; Fenchel, M.; Scholz, R.W. Empirical analysis of the integration of environmental risks into the credit risk management process of European banks. Bus. Strateg. Environ. 2008, 17, 149–159. [Google Scholar] [CrossRef]
  43. Chang, C.-H.; Sam, A.G. Corporate environmentalism and environmental innovation. J. Environ. Manag. 2015, 153, 84–92. [Google Scholar] [CrossRef] [PubMed]
  44. Saurina, J.; Jimenez, G. Credit cycles, credit risk, and prudential regulation. Int. J. Cent. Bank. 2006, 2, 65–98. [Google Scholar]
  45. Ghosh, A. Banking-industry specific and regional economic determinants of non-performing loans: Evidence from US States. J. Financ. Stab. 2015, 20, 93–104. [Google Scholar] [CrossRef]
  46. Messai, A.S.; Jouini, F. Micro and macro determinants of non-performing loans. Int. J. Econ. Financ. Issues 2013, 3, 852. [Google Scholar]
  47. Indira, R.; Garima, V. Non-performing loans of PSU banks: Some panel results. Econ. Political Wkly. 2002, 37, 429–435. [Google Scholar]
  48. Rajan, R.; Dhal, S.C. Non-performing loans and terms of credit of public sector banks in India: An empirical assessment. Occas. Pap. 2003, 24, 81–121. [Google Scholar]
  49. DiMaggio, P.J.; Powell, W.W. The iron cage revisited: Institutional isomorphism and collective rationality in organizational fields. Am. Sociol. Rev. 1983, 48, 147–160. [Google Scholar] [CrossRef]
  50. Altman, E.I. Financial ratios, discriminant analysis and the prediction of corporate bankruptcy. J. Financ. 1968, 23, 589–609. [Google Scholar] [CrossRef]
  51. Kong, D.; Liu, S.; Dai, Y. Environmental policy, company environment protection, and stock market performance: Evidence from China. Corp. Soc. Responsib. Environ. Manag. 2012. [Google Scholar] [CrossRef]
  52. Liu, X.; Liu, B.; Shishime, T.; Yu, Q.; Bi, J.; Fujitsuka, T. An empirical study on the driving mechanism of proactive corporate environmental management in China. J. Environ. Manag. 2010, 91, 1707–1717. [Google Scholar] [CrossRef] [PubMed]
  53. Saunders, A. Credit Risk Measurement: New Approaches to Value at Risk and Other Paradigms; John Wiley & Sons, Inc.: New York, NY, USA, 1999. [Google Scholar]
  54. Caouette, J.B.; Altman, E.I.; Narayanan, P. Managing Credit Risk: The Next Great Financial Challenge; Wiley: New York, NY, USA, 1998. [Google Scholar]
  55. Krugman, P. Balance sheets, the transfer problem, and financial crises. In International Finance and Financial Crises: Essays in Honor of Robert P. Flood, Jr.; Isard, P., Razin, A., Rose, A.K., Eds.; Springer: Dordrecht, The Netherlands, 1999; pp. 31–55. [Google Scholar]
  56. Ferri, G. Are new tigers supplanting old mammoths in China’s banking system? Evidence from a sample of city commercial banks. J. Bank. Financ. 2009, 33, 131–140. [Google Scholar] [CrossRef]
  57. Lin, X.; Zhang, Y. Bank ownership reform and bank performance in China. J. Bank. Financ. 2009, 33, 20–29. [Google Scholar] [CrossRef]
  58. Huaqiang, S. On the endogenous nature of the non-performing loans of the state-owned-bank of China: An analytical framework based on the dual soft-budget constraint theory. J. Financ. 2004, 6, 2. [Google Scholar]
  59. Wang, N.; Zhu, B. Efficiency and total factor productivity in listed commercial banks in China under the constraint of non-performing loans: An empirical analysis based on sbmdirectional distance function. J. Financ. Res. 2011, 1, 110–130. [Google Scholar]
  60. Chen, x.; Skully, M.; Brown, K. Banking efficiency in China: Application of dea to pre-and post-deregulation eras: 1993–2000. China Econ. Rev. 2005, 16, 229–245. [Google Scholar]
  61. Louzis, D.P.; Vouldis, A.T.; Metaxas, V.L. Macroeconomic and bank-specific determinants of non-performing loans in greece: A comparative study of mortgage, business and consumer loan portfolios. J. Bank. Financ. 2012, 36, 1012–1027. [Google Scholar] [CrossRef]
  62. Reinhart, C.M.; Rogoff, K.S. This Time Is Different: Eight Centuries of Financial Folly; Princeton University Press: Princeton, NJ, USA, 2009. [Google Scholar]
  63. Peiser, R.; Wang, B. Non-performing loan resolution in China. J. Real Estate Portfolio Manag. 2002, 8, 115. [Google Scholar]
  64. Wooldridge, J.M. Introductory Econometrics: A Modern Approach; Nelson Education: Scarborough, ON, Canada, 2015. [Google Scholar]
  65. Hausman, J.A. Specification tests in econometrics. Econom. J. Econom. Soc. 1978, 1251–1271. [Google Scholar] [CrossRef]
  66. Lancaster, T. The incidental parameter problem since 1948. J. Econ. 2000, 95, 391–413. [Google Scholar] [CrossRef] [Green Version]
  67. Kahane, L.H. Regression Basics; SAGE Publications: Thousand Oaks, CA, USA, 2007. [Google Scholar]
  68. Allison, P.D. Fixed Effects Regression Models; SAGE Publications: Thousand Oaks, CA, USA, 2009; Volume 160. [Google Scholar]
  69. Greene, W.H. Econometric Analysis (International Edition); Pearson: Toronto, ON, Canada, 2000. [Google Scholar]
  70. Berger, A.N.; DeYoung, R. Problem loans and cost efficiency in commercial banks. J. Bank. Financ. 1997, 21, 849–870. [Google Scholar] [CrossRef] [Green Version]
  71. Hellmann, T.F.; Murdock, K.C.; Stiglitz, J.E. Liberalization, moral hazard in banking, and prudential regulation: Are capital requirements enough? Am. Econ. Rev. 2000, 90, 147–165. [Google Scholar] [CrossRef]
  72. Makri, V.; Tsagkanos, A.; Bellas, A. Determinants of non-performing loans: The case of Eurozone. Panoeconomicus 2014, 61, 193–206. [Google Scholar] [CrossRef]
  73. Stern, G.H.; Feldman, R.J. Too Big to Fail: The Hazards of Bank Bailouts; Brookings Institution Press: Washington, DC, USA, 2004. [Google Scholar]
  74. China Banking Regulatory Commission (Ed.) Notice of the China Banking Regulatory Commission on Key Performance Indicators of Green Credit Implementation; China Banking Regulatory Commission: Beijing, China, 2014; Volume 186.
  75. Cui, Y. Analyzing Green Finance Incentives: An Empirical Study of the Chinese Banking Sector. Master’s Thesis, University of Waterloo, Waterloo, ON, Canada, 2017. [Google Scholar]
  76. China Banking Regulatory Commission. Annual Report 2015; China Banking Regulatory Commission: Beijing, China, 2015.
  77. Tukey, J.W. Exploratory Data Analysis; Addison-Wesley Publishing Company: Reading, MA, USA, 1977. [Google Scholar]
  78. Allison, P.D. Multiple Regression: A Primer; Pine Forge Press: Newbury Park, CA, USA, 1999. [Google Scholar]
  79. Nerlove, M. Essays in Panel Data Econometrics; Cambridge University Press: Cambridge, UK, 2005. [Google Scholar]
  80. Altman, E.I.; Saunders, A. Credit risk measurement: Developments over the last 20 years. J. Bank. Financ. 1998, 21, 1721–1742. [Google Scholar] [CrossRef]
  81. Liu, X.; Anbumozhi, V. Determinant factors of corporate environmental information disclosure: An empirical study of Chinese listed companies. J. Clean. Prod. 2009, 17, 593–600. [Google Scholar] [CrossRef]
  82. Marquis, C.; Qian, C. Corporate social responsibility reporting in China: Symbol or substance? Organ. Sci. 2014, 25, 127–148. [Google Scholar] [CrossRef]
  83. Zhao, N.; Patten, D.M. An exploratory analysis of managerial perceptions of social and environmental reporting in China: Evidence from state-owned enterprises in Beijing. Sustain. Account. Manag. Policy J. 2016, 7, 80–98. [Google Scholar] [CrossRef]
  84. Weber, O. Environmental, social and governance reporting in China. Bus. Strateg. Environ. 2014, 23, 303–317. [Google Scholar] [CrossRef]
  85. Zhang, B.; Bi, J.; Yuan, Z.; Ge, J.; Liu, B.; Bu, M. Why do firms engage in environmental management? An empirical study in China. J. Clean. Prod. 2008, 16, 1036–1045. [Google Scholar] [CrossRef]
  86. Zhu, Q.; Sarkis, J. Relationships between operational practices and performance among early adopters of green supply chain management practices in Chinese manufacturing enterprises. J. Oper. Manag. 2004, 22, 265–289. [Google Scholar] [CrossRef]
  87. Lardy, N. Financial Repression in China; Peterson Institute for International Economics: Washington, DC, USA, 2008. [Google Scholar]
Figure 1. Regression model.
Sustainability 10 02008 g001
Table 1. Banks in the sample.
BankType of Bank
China Development Bank (CDB)Policy bank
Industrial and Commercial Bank of China (ICBC)State-owned commercial bank
China Construction Bank (CCB)State-owned commercial bank
Agricultural Bank of China (ABC)Policy bank
Bank of China Limited (BOC)State-owned commercial bank
Bank of Communications (BOCOM)State-owned commercial bank
China Merchants Bank (CMB)Joint-stock commercial bank
Shanghai Pudong Development Bank (SPD)Joint-stock commercial bank
China Minsheng Banking (CMBC)Joint-stock commercial bank
Industrial Bank (CIB)Joint-stock commercial bank
China Citic Bank (CNCB)Joint-stock commercial bank
China Everbright Bank (CEB)Joint-stock commercial bank
Ping An BankJoint-stock commercial bank
Hua Xia Bank (HXB)Joint-stock commercial bank
China Guangfa Bank (CGB)Joint-stock commercial bank
China Bohai Bank (CBHB)Joint-stock commercial bank
Bank of Beijing (BOB)City commercial bank
Bank of NanjingCity commercial bank
Bank of Shanghai (BOS)City commercial bank
Bank of JiangsuCity commercial bank
Bank of NingboCity commercial bank
Bank of ChongqingCity commercial bank
Harbin BankCity commercial bank
Bank of ZhengzhouCity commercial bank
Table 2. Descriptive statistics. POGC: proportion of green credit to total loans; NPL: non-performing loan.
YearIndicatorPOGCNPL RatioReturn on AssetsInefficiencySolvencySizeCredit Quality
2009Average2.3%1.2%0.9%48.2%5.0%4.2%2.1%
SD2.2%0.6%0.3%11.0%1.2%5.8%0.6%
2010Average2.4%0.9%1.0%45.3%5.4%4.2%2.1%
SD2.6%0.4%0.2%10.5%1.0%5.6%0.5%
2011Average2.7%0.7%1.2%43.8%6.0%4.2%2.3%
SD2.9%0.3%0.2%11.8%0.9%5.5%0.6%
2012Average3.5%0.8%1.2%42.8%5.9%4.2%2.4%
SD3.4%0.3%0.2%12.1%0.9%5.2%0.5%
2013Average3.8%0.8%1.2%42.0%6.1%4.2%2.4%
SD3.5%0.2%0.2%11.2%0.7%5.1%0.5%
2014Average4.5%1.1%1.1%40.1%6.4%4.2%2.6%
SD4.8%0.2%0.2%9.8%0.9%5.0%0.5%
2015Average4.8%1.4%1.0%38.2%6.7%4.2%2.8%
SD5.2%0.3%0.2%9.4%1.0%4.8%0.6%
TotalAverage3.4%1.0%1.1%42.9%5.9%4.2%2.4%
SD3.7%0.4%0.2%11.1%1.1%5.2%0.6%
Table 3. Correlation between the independent and dependent variables (*: p < 0.05; **: p < 0.01)
NPL RatioROASizeCredit QualityEfficiencySolvency
Return on Assets−0.15
Size0.35 **0.29 **
Credit quality0.54 **−0.010.33 **
Inefficiency−0.01−0.43 **−0.15 *−0.05
Solvency0.070.53 **0.29 **0.15−0.31 **
Green credit proportion−0.08−0.120.12−0.10−0.12−0.36 **
Table 4. Variable transformation.
VariableTransformation
Proportion of green creditSquare root
NPL ratioSquare root
ROASquare
SizeLog
Credit qualityLog
Inefficiency1/square
Solvencyidentity
Table 5. Results of the random-effects model (RE) and two-stage least square model (2SLS). NPLR: non-performing loan ratio; MSE: mean square error.
Model 1 (RE)Model 2 (2SLS)
NPLRFirst Stage (POGC)Second Stage (NPLR)Second Stage (NPRL), Standardized Coefficients
POGC−0.058 (p < 0.0001) −0.231 (p = 0.001)−0.759
Type of bank 0.036 (p < 0.0001)
Credit quality0.038 (p < 0.0001)0.046 (p = 0.084)0.047 (p < 0.0001)0.464
ROA−236.43 (p < 0.0001)−85.51 (p = 0.598)−158.19 (p = 0.001)−0.539
Inefficiency0.003 (p = 0.001)0.012 (p = 0.001)0.002 (p = 0.012)0.479
Solvency0.275 (p = 0.084)−1.67 (p = 0.806)0.144 (p = 0.441)0.124
Year−0.001 (p = 0.4670.004 (p = 0.221)0.001 (p = 0.386)−0.007
Size0.005 (p = 0.002)0.003 (p = 0.756)0.011 (p < 0.0001)0.588
Constant1.44 (p = 0.375)−8.59 (p = 0.223)−1.45 (p = 0.483)14.033
Model significancep < 0.00001p < 0.00001p < 0.00001
R-sq0.4055 0.390
Obs168168168
Root MSE 0.031

