Abstract
The recycling of organic wastes in agriculture contributes to a circular economy by returning to the soil nutrients and reducing the need of mineral-based fertilisers. An agronomical and environmental evaluation of a series of biochars prepared from a range of urban and agricultural wastes was performed by soil incubation experiments and pot trials. The impact of biochar addition (alone, or in combination with either mineral or organic fertiliser) on soil N, P and micronutrients was studied, as well as the potential limitations for their agricultural use (associated to phytotoxicity and presence of potentially toxic metals). The type and origin of feedstock only had a minor impact on the response of biochar in soil and its interaction with the most important nutrient cycles. The presence of ashes in biochars prepared from urban and pre-treated organic wastes caused an increase in the availability of N and P in soil, compared to raw lignocellulosic biochar. All tested biochars exhibited favourable properties as soil amendments and no phytotoxic effects or negative impacts on soil nutrient dynamics were observed during the soil incubation experiments. Their agricultural use is only limited by the presence of potentially toxic metals in biochars prepared from feedstocks of urban origins.
1. Introduction
The development of new strategies for sustainable waste management is essential to divert organic wastes from landfills [1]. The challenge is to transform these organic wastes to organic amendments that can be incorporated into agricultural practices. Thus, the pyrolysis of organic wastes, to produce bioenergy and biochar, has recently gained considerable interest as a recycling option, becoming an alternative strategy to composting and other biological waste treatments.
Biochar is attracting great attention as a C sequestration potential agent because C is transferred from the fast biological atmospheric C cycle into the much slower geological cycle due to its recalcitrant nature [2]. Concomitant with the enhanced C sequestration, there is a wide range of potential benefits related to the addition of biochar to soil, which are associated to the impact on soil physico-chemical and biological equilibria [3].
Some of the agronomical benefits of biochar include: an improvement in soil physical properties, and particularly in soil water-holding capacity, which would be beneficial in areas with limited rainfall [4,5]; a change in soil nutrient dynamics, especially when used in combination with mineral fertilisation or other organic amendments, affecting their bioavailability such as the case of N and P [6,7]; and a limitation of the bioavailability of potentially toxic metals [8]. All these benefits might lead to an enhanced crop productivity, which is highly dependent on types of feedstocks and agroclimatic conditions [9].
The environmental and agronomical benefits of biochar are dependent on the type of biochar. Consequently, considerable variation in plant and soil responses is expected with different biochars [10]. In general, the macro- and micronutrient content of the biochar itself does not play an important role in plant mineral nutrition, and plant growth. Raw lignocellulosic biochars usually contain rather low nutrient concentrations, but there are other biochars with high mineral content, especially those obtained from manures and other ash-rich feedstocks, that can represent a source of nutrients [11]. In addition, low pyrolysis temperatures can also improve nutrient solubility of biochar, improving plant growth [12].
At present, large scale implementation of biochar as soil amendment in agriculture is mainly limited by the cost of biochar production and application, which is higher than the cost of other organic materials typically used as soil amendment (i.e., compost, manures, etc. [13]). The cost of the feedstock is a crucial input for economy analysis, especially when biochar is prepared from clean wood biomass. To reduce production cost, other alternative feedstocks are being evaluated, such as farm and urban wastes [14]. In developed countries, the use of organic wastes as cheap feedstock has several advantages, since these wastes are available for free or even generate revenue and/or save disposal cost [10].
The evaluation of the agricultural use of biochar as soil amendment has been almost exclusively performed for biochars produced from woody feedstocks or from manures [9,12,15,16]. A better understanding of the soil nutrient dynamics, biochar decomposition and potential positive and negative effects associated to soil application of biochar prepared from organic wastes is therefore needed.
The aim of this work was to perform an environmental and agronomical evaluation of a selection of biochars prepared from different urban and agroindustrial organic wastes. The evaluation of biochars as soil amendments was performed when biochars were used alone or in combination with two different N sources: mineral fertilisation and an organic amendment (manure). The assessment was based on the study of: (i) soil N and P dynamics and their mineralisation rate; (ii) bioavailability of micronutrients; and (iii) the fate of metals in soil. A pot trial was performed to evaluate the response of lettuce to biochar addition and evaluate the potential negative impact on plant growth and metal mobilisation.
2. Materials and Methods
2.1. Soil Description
An agricultural soil, classified as Haplic Calcisol [17], was sampled from an organic olive orchard in Murcia Region (SE Spain) (coordinates 38°23′ N 1°22′ W). The soil was characterised by a sandy loam texture (57% sand, 27% silt and 16% clay) and alkaline pH, with 30% CaCO3. The characterisation of the soil is presented in Table 1. Before its use, the soil was sampled from the topsoil (0–20 cm), air-dried and sieved (<2 mm).

Table 1.
Main physicochemical properties of soil and the N sources; sheep manure as organic amendment and diammonium phosphate (DAP) as mineral fertiliser.
2.2. Biochars Description
A wide range of biochars prepared by slow pyrolysis in a Pyromaat Auger pyrolysis reactor (1 h residence time) by Stichting Energieonderzoek Centrum Nederland (ECN) (Petten, The Netherlands) at 400 °C were used: holm oak (O400), greenhouse waste from a mixture of horticultural residues (GH400), green waste from gardens in urban areas (GW400), dried CellMatt, a lignocellulosic residue from the processing of municipal solid wastes (CM400), pig manure (PM400) and press cake from anaerobic digestion of source-separated municipal solid wastes (PC400). In addition, two commercial biochars, from holm oak feedstock by a large-scale slow pyrolyser (residence time of about 15 h) by Proininso Inc. (Málaga, Spain) were used: OC450 and OC650, produced at 450 °C and 650 °C, respectively. The main characteristics of the biochars are reported in this Special Issue [18].
2.3. Soil Incubation Experiments
The soil incubation experiments were performed under aerobic conditions, at 40% of its water holding capacity (WHC) and at 25 °C during 30 days. The soil was pre-incubated at the same conditions for 7 days prior to use. Glass flasks (100 mL) were used for the incubation, containing 40 g (oven dry basis) of each treatment in triplicate and covered with a polyethylene sheet that allowed gas exchange but minimised evaporation. Moisture was gravimetrically adjusted by weight loss every two days with the addition of deionised water to each flask.
In addition to biochar, two N sources (manure (M) and mineral fertilisation (F)) were selected for the soil incubation experiments. Sheep manure was selected as a widely used organic amendment in agriculture containing a relatively high proportion of N (1.98%), in organic form. M was added to the soil as a finely grounded (<1 mm) dry material. Diammonium phosphate (DAP) was selected as one of the most important mineral fertilisers used worldwide as N and P source. DAP was applied to the soil in solution at the required concentration to equal the amount of N added in the manure treatments (198 mg N kg−1 soil). Their properties are reported in Table 1.
The incubation experiments consisted in seven treatments for each biochar:
- S: Control soil, unfertilised.
- S + B (1%): Soil amended with biochar at 1%, expressed as dry weight (d.w.).
- S + B (2%): Soil amended with biochar at 1% (d.w.).
- S + M (1%): Soil amended with manure at 1% (d.w.).
- S + B + M (1%): Soil amended with biochar at 1% (d.w.) and manure at 1% (d.w.).
- S + F (1%): Soil fertilised with DAP at 0.2 gN kg−1 soil, the same amount of N provided by 1% M.
- S + B + F (1%): Soil amended with biochar at 1% (d.w.) and DAP at 0.2 gN kg−1 soil.
Each treatment included three parallel incubations for destructive soil sampling after 3, 7 and 30 days for chemical analysis (NO3−-N, NH4+-N, POLSEN, and DTPA extract). These sampling dates would allow monitoring changes taking place immediately after amendment (3 and 7 days) and then after 30 days of incubation.
2.4. Pot Trials
Plant growth experiments were carried out in a growth chamber (19–24 °C temperatures night/day) at CEBAS-CSIC (Murcia, Spain). The pot trials were used to compare the plant growth in soil amended with six different biochars at 2% dry weight basis, OC450, O400, GH400, GW400, CM400 and PC400, and a treatment without biochar that was used as control. All treatments received the mineral fertilisation recommended for lettuce crops (Lactuca sativa L., cultivar: Baby): 100 N kg ha−1 and 111 P kg ha−1 [19].
Black plastic pots (900 mL), with the bottom sealed with cotton, were used for the experiment. Six pots were filled with 1000 g of soil (dry weight basis) for each treatment and were laid out on six trays. Each tray comprised seven pots, one pot from each treatment, in a randomised design. To avoid the influence of the microclimate variability, the location of the trays inside the growth chamber was changed every two days. Soil moisture was checked three times a week by measuring weight loss for each individual pot and adjusting with deionised water when necessary.
Three seeds were sown in each pot and placed in the growth chamber. After 12 days, the germination was evaluated, and plants were thinned to one lettuce per pot.
The leaf chlorophyll concentrations were measured with a Chlorophyll Meter (SPAD-502Plus, Konica Minolta Inc., Tokyo, Japan) on the same pair of leaves at Day 56. Two SPAD readings were taken at the same time of the day to minimise the potential effects of light intensity on chloroplast. Chlorophyll fluorescence was measured through Fv/Fm (ratio of variable to maximum fluorescence) that reflects the quantum efficiency of open photosystem II centres [20]. Chlorophyll fluorescence was measured on the same pair of leaves at Day 56 using a fluorometer (OS30p+, Opti-Sciences, Inc., Hudson, NH, USA). Plants were adapted for 30 min in total darkness prior to measurements, and dark-adapted Fv/Fm was estimated using the saturation pulse method [20].
After 72 days, plants were cut close to the surface above ground and biomass was harvested, cleaned with deionised water and dried at 60 °C for 72 h. Once dried, the shoot dry weight was determined and milled to perform nutritional analyses. Soil was homogenised before sampling to determine NH4+-N, NO3−-N and PO43−-P concentration, and afterwards it was air-dried to obtain the lettuce’s roots remnants which were cleaned to determine the root dry weight.
2.5. Chemical Analyses
NO3−-N and PO43−-P concentration in soil was determined by ionic chromatography (HPLC) (DIONEX ICS-2100, Thermo Scientific, Sunnyvale, CA, USA) in the 1:10 (w:v) aqueous extract and NH4+-N by a colorimetric method based on the Berthelot’s reaction in the 1:10 (w:v) 2M KCl extract [21].
Plant-available P in soil was determined by Olsen’s method, measured by molybdenum blue colorimetry in a 0.5 M NaHCO3 extract [22].
Extractable micronutrients (Fe, Cu, Mn, Zn, Mo, and B) and potentially toxic metals (Ni, Cd, Cr and Pb) concentrations in soil incubation and in biochars were measured after their extraction with DTPA/CaCl2/TEA pH 7.3 by Inductively Coupled Plasma spectroscopy (ICP-OES) (ICAP 6500 DUO THERMO, Cheshire, UK). This methodology was adapted to alkaline soils [23].
Total concentrations of Cd, Cr, Ni and Pb in lettuces were measured after HNO3/H2O2 digestion by ICP-OES.
Chemical analyses are expressed on an oven-dry basis (105 °C, 24 h) and represent the mean of at least triplicate analyses.
Phytotoxicity in biochars was performed by the Lepidium sativum test and expressed as germination index (GI), according to Zucconi et al. [24].
2.6. Calculations and Statistical Analyses
The N mineralisation/immobilisation rate at the end of incubation experiment was calculated according to the equations developed by Tammeorg et al. [25]:
Net N mineralisation (∆Nt,F,B) in each amendment and biochar treatment was calculated as a difference from the mineral N content (NO3−-N + NH4+-N) during the incubation according to:
where ∆Nt,F,B is the amount of net N mineralisation (mg N kg−1 soil), and N30,F,B and N0,F,B are the mineral N contents at Day 30 and Day 0, respectively, for a N fertiliser source (F) and each biochar and its application rate (B) (mg N kg−1 soil). F was considered 0 when no N fertiliser (manure or DAP) was added:
∆Nt,F,B = N30,F,B − N0,F,B,
∆Nt,0,B = N30,0,B − N0,0,B,
Subsequently, the effect of biochar application on the net N mineralisation/immobilisation at a given time (t = 0 and t = 30) was calculated for each N fertiliser source treatment (F) by subtracting the corresponding amount of net N mineralisation in the soil with no added biochar (B = 0):
where ∆Nefft,F,B is the net effect of biochar addition on the N mineralisation/immobilisation in soil (mg N kg−1 soil), F was considered 0 when no N fertiliser (manure or DAP) was added:
∆Nefft,F,B = ∆Nt,F,B − ∆Nt,F,0 = (N30,F,B − N0,F,B) − (N30,F,0 − N0,F,0),
∆Nefft,0,B = ∆Nt,0,B − ∆Nt,0,0 = (N30,0,B − N0,0,B) − (N30,0,0 − N0,0,0),
The same equations were used to calculate the P mineralisation/immobilisation rate at the end of the incubation experiment.
Nitrogen uptake efficiency (NUE) in pot trials was calculated as the amount of N uptake by plants per N supplied per kilogram of fertilised soil (N uptake/N supplied) [26].
Statistical analyses of data were performed using the IBM SPSS Statistics 22 (IBM Corporation, Armonk, NY, USA). The significance of differences was analysed by one-way analysis of variance (ANOVA) and was defined as p < 0.05 by Tukey HSD test.
3. Results and Discussion
3.1. Dynamics of N in Soil: Ammonification and Nitrification Processes
The N mineralisation dynamics were studied in soils amended with different biochars, OC650, OC450, O400, GH400, GW400, CM400, PM400 and PC400, and in combination with additional N sources (manure and mineral fertilisation). N mineralisation was studied through ammonification and nitrification processes, which were monitored by changes in the concentrations of NH4+-N and NO3−-N during incubation (Figure 1).
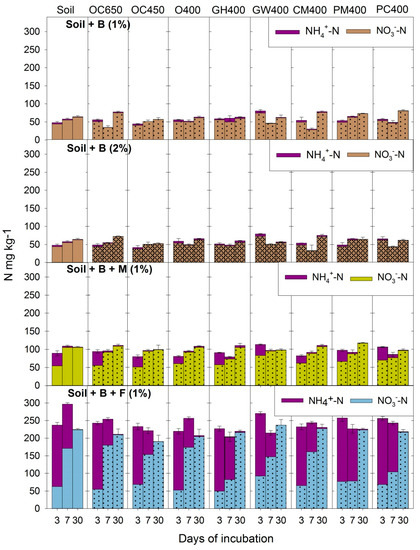
Figure 1.
Changes in the amounts of mineral N (mg kg−1 soil as NH4+-N plus NO3−-N) during the incubation of: soil; soil amendment biochars at two doses (S + B (1%) and S + B (2%)) or in combination with manure (S + B + M (1%)) or mineral fertiliser (S + B + F (1%)). Error bars represent standard deviation (n = 3).
The addition of biochar alone, without an additional N source, did not significantly affect soil N dynamics. This behaviour was observed for all biochars added at both rates, 1% and 2%, due to the low supply of mineral N by the biochar and its low mineralisation rate in soil (chemical recalcitrance).
On the other hand, biochars showed different interactions with N mineralisation dynamics in soil amended with manure and mineral fertilisation (Figure 1). The addition of both N sources to the soil caused a significant increase in extractable NH4+-N at Day 3, as a consequence of the mineralisation of the added organic matter in the case of manure, or the direct supply from DAP.
Previous studies have reported a decrease of N availability in biochar amended soils due to the ammonium retention capacity of biochars [27,28]. However, the simultaneous addition of biochar with the N sources did not have a clear effect on the amount of NH4+-N at Day 3, compared to the soil amended with manure (S + M (1%)) or fertiliser alone (S + F (1%)). Only in the case of raw or rich lignocellulosic biochars (OC450, O400 and CM400) there was a significant reduction in the amount of extractable NH4+-N, compared to the treatments prepared only with manure (S + M (1%)) or mineral fertilisation (S + F (1%)). Biochars prepared from pre-treated organic feedstocks, which contained lower amount of C and higher ash content, were not effective in retaining N in soil and the levels of soil NH4+-N were not significantly different from the control.
From Day 7 to the end of the incubation, all treatments recorded a sharp reduction of NH4+-N and an increase of NO3−-N, as a consequence of the nitrification process. After 30 days of incubation, all biochar amended soils showed similar NO3−-N levels than the treatment with only manure (S + M 1%) but a decrease was observed in treatments with mineral fertilisation (S + B + F 1%). Especially, the addition of OC650, OC450 or O400 (raw lignocellulosic biochars) originated a similar behaviour regarding the nitrification process in the soil amended with fertiliser (S + F (1%)), characterised by a sharp increase of NO3−-N between the third and seventh day of incubation. The levels of NO3−-N increased mainly after the seventh day of incubation. This effect was not so clear in soils amended with manure, where the availability of ammonium depends on the organic matter mineralisation.
Figure 2 shows the effect of biochar application on the net N mineralisation (∆N > 0) or immobilisation (∆N < 0) rate at the end of the incubation experiment. The positive values were considered as N mineralisation, and therefore it represents an increment of mineral N as NH4+-N and NO3−-N. However, the negative values were considered as a decrease of mineral N, either N immobilisation due to organic N transformation or N losses as volatilisation of NH3 and N2O.
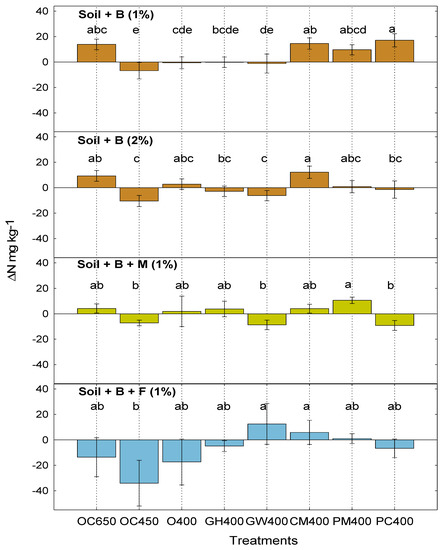
Figure 2.
Effect of biochars on the soil N mineralisation (∆N > 0) or immobilisation (∆N < 0). Error bars represent standard deviation (n = 3). Different letters in each plot indicate significant differences at the p < 0.05 level.
The net effect of biochars application on soil mineral N at 1% and 2% was relatively low, because of the lower content of NH4+-N and NO3−-N in biochar, compared with soil. Nevertheless, the biochars from pre-treated organic wastes, which have high ash content (rich in minerals) and low C org, mixed at 1% showed a significant higher mineralisation rate than raw lignocellulosic biochars. This effect could be due to the low fixed C and higher N content of biochars from pre-treated feedstocks, being more easily degradable. However, the addition of OC650 also promoted net N mineralisation despite its low mineral content. This effect was unexpected for hardwood biochars [15,29]. On the other hand, the other raw lignocellulosic biochars (O400 and GH400) and GW400 did not show any significant effect on soil mineral N, which is in agreement with previous works using this type of biochar [15,29].
Increasing biochar application rates to soil (S + B (2%)) caused an increase in the N immobilisation, which is in agreement with previous incubations studies [25] and especially in alkaline soils incubations [4,5]. This immobilisation could be attributed to the alkalinity and high adsorption capacity of biochars [7] and also to the presence of volatile carbon, which could lead to a N immobilisation by soil microorganisms. This effect was more evident in the treatments with high volatile content and molar H/C org ratio (less thermochemically converted) biochars. Thus, the effect of biochar on soil N mineralisation/immobilisation may differ significantly between biochars according to the feedstock and pyrolysis conditions [25], but the increase in biochar application rate may have masked this effect.
Biochars did not show a clear effect on net N mineralisation in soil amended with manure. Thus, it seems that the mineral N produced by ammonification and nitrification processes was controlled by the organic matter mineralisation of manure, rather than the impact of the biochars.
The effect of biochar application on soils amended with mineral fertilisation was affected by the properties of biochars. Raw lignocellulosic biochars showed greater N immobilisation values than biochars obtained from pre-treated feedstocks. These results are in agreement with previous works [7,15,29], where different mechanism for biochar-induced mitigation of NH3 volatilisation were elucidated: NH3 adsorption in micropores, NH4+ and NO3− adsorption in cation exchange sites, oxidation of NH4+ to NO3−, protonation of NH3 induced conversion to NH4+ and the possible NH4+ immobilisation induced by the microbial activity.
3.2. Dynamics of Available P in Soil
An overview of the impact of the different biochars on available P dynamics (water soluble P and POLSEN) during soil incubation experiments is shown in Figure 3.
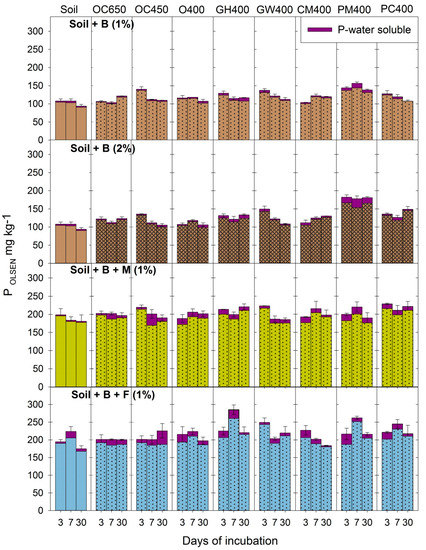
Figure 3.
Changes in the amounts of water soluble and available P (POLSEN) (mg kg−1) during the incubation of: soil; soil amended with biochars at two doses (S + B (1%) and S + B (2%)) or in combination with manure (S + B + M (1%)) or mineral fertiliser (S + B + F (1%)). Error bars represent standard deviation (n = 3).
In general, the soil incubation experiments recorded low amounts of water soluble P, which was expected due to the alkaline nature of soil.
The addition of biochar did not affect the behaviour of P dynamics in the unfertilised soil (without a N source). A similar trend was found between the biochars at 1% and 2%, due to the low supply of mineral P with the biochar. The only exception was PM400, which showed the highest values of soluble P in soil, caused by its greater concentration of P in the biochar.
The water soluble P levels slightly increased after three days of incubation in the soils amended with either manure or mineral fertiliser. Manure is a well-known source of soluble and easily available forms of P, organic P and inorganic phosphate compounds, and they represent a traditional source of P for agriculture [30,31]. Thus, when phosphate from the fertiliser or manure comes in contact with the alkaline soils, various reactions take place making the phosphate less soluble and less available, mostly precipitated as calcium salts. In general, biochar application increased the water soluble P levels after three days in the soils amended simultaneously with biochar and the manure (S + B + M (1%)) or the fertiliser (S + B + F (1%)). The addition of biochar generally caused an increase in the amount of available P (POLSEN). The increase in available P was noticeable even after 30 days of incubation but only small variations were observed during the incubation period. Even in the case of PM400, which caused a significant increase of available P in treatment S + B (2%), there was no significant impact of this biochar when combined with manure or mineral fertilisation (S + B + M (1%), and S + B + F (1%) treatments).
Figure 4 shows the effect of biochar application on the net P mineralisation (∆POLSEN > 0) or immobilisation (∆POLSEN < 0) rate at the end of incubation experiment. The positive values indicate P mineralisation, since it represents an increment of available P. However, the negative values indicate a decrease of available P, which imply P immobilisation due to the formation of dibasic calcium phosphate dehydrate (CaHPO4·2H2O), octocalcium phosphate Ca8H2(PO4)6·5H2O, or its crystallisation as hydroxyapatite Ca5(PO4)3(OH) in the soil or by other mechanism associated with the biochar.
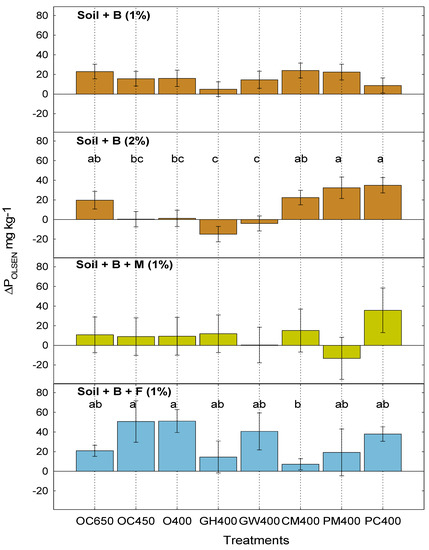
Figure 4.
Effect of biochars on the soil P mineralisation (∆N > 0) or immobilisation (∆N < 0). Error bars represent standard deviation (n = 3). Different letters in each plot indicate significant differences at the p < 0.05 level.
Biochars usually contain three pools of P, one which is freely soluble, one which is strongly bound to Fe and Al, and the last one which remains organically bound as a residue of the original feedstock and its proportions are dependent on feedstock and pyrolysis conditions [6]. The net effect of biochars at 1% on soil P availability was not significant. At 2% application rate, significant differences were found for biochars obtained from pre-treated organic waste (CM400 and PC400), PM400 and OC650, which showed higher available P values than raw lignocellulosic biochars. Despite the low total P content in OC650, this treatment showed a large P availability at the end of the soil incubation.
The bioavailability of P primarily depends on P composition (different chemical forms) in the feedstocks which may affect its subsequent availability after entering the soil [6,32]. On the other hand, O400 and OC400 biochar treatments did not show any significant effect on P availability and GH400 and GW400 treatments led to a slight P immobilisation. The difference between OC650, OC450 and O400 biochars could be caused by the fact that organic P present in plant tissues do not volatilise until approximately 700 °C [33]. Thus, the pyrolysis of raw lignocellulosic feedstock can enhance P availability from plant tissue by volatilising large amounts of C and cleaving organic P bonds, resulting in a residue of soluble P salts associated with the biochar [6].
Biochars did not show a clear effect on net P mineralisation in soil amended with manure. Thus, it seems that, similar to the case of N, the complex mechanisms of organic matter mineralisation of the manure masked the impact of biochars.
On the other hand, the interaction of biochar with mineral fertilisation showed a different behaviour with respect to S + B (2%). Thus, rich lignocellulosic biochars (OC450, O400 and GW400) showed the highest mineralisation values, whereas biochars obtained from pre-treated feedstocks (PM400, PC400 and OC650) recorded slightly lower P mineralisation. To date, however, there is a noted lack of studies evaluating the short-term effect of biochar on P cycling and availability. It seems that a variety of mechanisms through which biochar may directly or indirectly influence the biotic and abiotic components of the P cycle [6], especially when the phosphorus is added in excess. Thus, the sorption of chelates may have a positive or negative influence on P solubility; due to the favourable surface properties of biochars for sorbing organic molecules. In addition, biochar could act as a promoter of microbial activity and P mineralisation, providing greater access to organic and insoluble inorganic pools of P [6].
3.3. Dynamics of Available Micronutrients in Soil
Micronutrients also play an important role in the mineral nutrition for plant growth. Although their contents in some raw lignocellulosic biochars are rather low [18] (this Special Issue), biochars prepared from urban wastes (GW400, CM400, and PC400) and from manure (PM400) present high mineral contents, and may have agronomic relevance. The availability of these micronutrients in the biochar itself and after soil application was evaluated by the changes in the DTPA-extractable fraction.
Table 2 shows DTPA-extractable micronutrient (Fe, Cu, Mn, Zn and B) concentrations in biochars. In general, the amount of DTPA extractable elements represented less than 10% of the total concentration, reflecting the low mobility of these elements in the biochar itself. Only in the case of Mn and Zn the percentages of available element rarely exceeded 20% or 40%, respectively (Table S1).
Table 2.
DTPA-extractable micronutrients (Fe, Cu, Mn, Zn and B) concentrations in biochars.
In general, the addition of biochar did not increase the amount of DTPA extractable micronutrients in soil, with the only exception of the concentration of Mn (Figure S3). Increasing biochar application rate to the soil did not affect DTPA-available content of micronutrients despite the great differences between mineral concentrations in the different biochars, especially in the case of biochars prepared from pre-treated organic wastes, such as CM400, PC400, GW400 and PM400, characterised by a high content in Fe, Cu, Mn and Zn [18] (this special issue).
The DTPA-available Fe and Mn concentrations decreased in the soil alone and the soil amended with organic or mineral fertilisation (Figures S1 and S3, respectively). In general, the impact of biochar on these nutrients was not relevant, except in the case of PM400 and PC400, that showed a slight immobilisation of Fe and Mn in the soil alone and the amended soil, compared to the rest of biochars. In the case of Mn, there was a large variability in the impact of biochar addition, especially in the case of GH400 and GW400, which recorded the highest DTPA-extractable Mn concentration in the soil after incubation.
Biochar addition did not show any effect on Cu availability, even at the highest application rate. In alkaline soils, it is known that Cu forms strong associations with Fe and Al (hydr)oxides and thus may limit its availability (Figure S2), even in the case of biochars having high total concentrations of Cu, such as CM400, PM400 and PC400. The addition of manure caused an increase in Cu availability, which can be almost entirely ascribed to the manure addition. Previous work in alkaline soils showed a similar short-term impact on Cu [4,5].
The pattern of DTPA-extractable Zn in soil was similar to that observed for Cu, due to a low available Zn caused by strong zinc sorption by CaCO3 that is typical of alkaline soils. There were no significant effects on Zn availability, due to the addition of biochar at 1% and 2% application rate (Figure S4), with the exception of PM400 that showed a short-term immobilisation of Zn at Day 3, despite its high DTPA-Zn extractable Zn concentration in the biochar. The addition of manure raised the Zn availability regardless of the biochar applied.
B was slightly immobilised during the incubation due to the calcium carbonate present in soil, which acts as a sink for B in calcareous soils [34] (Figure S5). The addition of biochars OC450, O400, GW400, CM400 and PM400 to the soil, at 1% and 2% application rate, avoided the short-term B immobilisation. However, OC650 showed a similar behaviour to the control soil, while GH400 and PC400 showed a slight B availability at the end of incubation. These results indicated that B availability in soil was not directly related to the DTPA-extractable concentrations in biochars.
3.4. Dynamics of DTPA-Extractable Potentially Toxic Metals in Soil
The presence of potentially toxic metals in organic wastes represents an important limitation for their use in agriculture. Pyrolysis of organic wastes led to a concentration of the metals, originally present in the feedstocks, into the ash fraction of the biochars. Some of the biochars used in this study had a high concentration of metals [18] (this Special Issue). The concentration of potentially toxic metals in CM400, PM400, PC400, and GW400 are in some cases above the threshold for biochar of basic quality grade according to the European Biochar Certificate (EBC) [35]. Despite the regulatory classification and the legal limitations for their use in agriculture, all the biochars obtained were studied as soil amendment to assess the fate of metals in soil. The DTPA-extractable metals (Cd, Cr, Ni and Pb) concentrations in biochars are presented in Table 3. The extractable fraction of the metals was in general very low and only represented a small fraction of the total metal concentration in the biochar, below 5% in the case of Ni and 16% in Pb (Table S2).
Table 3.
DTPA-extractable potentially toxic metals (Cd, Cr, Ni, and Pb) concentrations in biochars.
The concentrations of Cr and Cd were below the detection limits in all amended soils. The addition of biochar caused a slight solubilisation of Ni and Pb in all the treatments (Figures S6 and S7), i.e., with only biochars (S + B (1%) or (2%)) or in combination with organic amendment (S + B + M (1%) and fertiliser (S + B + F (1%), compared to the treatments with organic amendment (S + M (1%)) and fertiliser alone (S + F (1%)). However, these differences were not significant in the case of the control soil. Therefore, the addition of organic amendment or mineral fertiliser had a very limited effect on the DTPA-extractable content of both elements and the recorded increase can be almost entirely ascribed to the addition of biochar. In general, the DTPA-extractable concentrations of Ni in soils were very low. Biochars that typically caused the larger Ni increases were O400, GW400 and CM400, containing high levels of metals in the feedstock. In addition, CM400 (the biochar with the highest DTPA-extracted Pb) caused a 2-fold increase in available Pb with respect to the soil. However, the treatments with PC400 and PM400 biochars recorded lower Ni and Pb concentrations than the control.
3.5. Effect of Biochar on Plant Growth
3.5.1. Phytotoxicity
The phytotoxicity of the materials was evaluated by the germination index (GI) of Lepidium sativum in the biochars alone and by the germination success (G) of the lettuces seedlings in soils amended with biochars (Table 4). All biochars showed lower GI than the control, except in the case of OC450, which had no impact in the GI. CM400 showed the lowest GI value (61%), which involves low phytotoxicity symptoms according to Zucconi et al. [24]. A possible cause of the low GI rate in CM400 is the presence of potentially toxic metals and especially DTPA-extractable Pb, which inhibitory effect had been reported previously [36]. In addition, O400, GH400, GW400 and PC400 biochars could have toxic soluble and volatile organic compounds, which accumulated through re-condensation of gases during the charring process, decreasing the GI [13].
Table 4.
Influence of biochar type on plant variables measured during the growth and at the harvest of lettuce crop.
The germination success was measured through seedling emergence, at Day 12 after sowing. Biochar type had significant effects on lettuce emergence in soil. Generally, the percentage of germinated seeds increased in all cases with respect to the control soil (100%), except GW400, which was significantly lower (83%). In contrast to the phytotoxicity test performed directly on biochars, CM400 mixed with soil recorded the highest germination (133%), due to the buffer capacity of the soil and the dilution of pollutants.
3.5.2. Plant Growth and Nutritional Status
The influence of biochar added to the soil on plant growth was assessed through total biomass, root-to-shoot ratio, leaf SPAD and chlorophyll fluorescence, as indirect measurements in the plant nutritional status (Table 4).
Biochar addition significantly affected the total dry plant biomass (shoot and root systems): OC450, PC400 and GW400 addition caused an increase of 10%, 7.7% and 4.6%, respectively, compared to the control, while for the rest of biochar treatments showed reductions of 2.0%, 2.7% and 4.6% for O400, CM400 and GH400, respectively. However, in the case of the root system (root biomass), GH400 and CM400 registered a significant increase in root biomass of 9.8% and 4.8%, respectively, whereas raw lignocellulosic biochars generally did not show any significant differences with the control. A previous study with wood biochars and sunflower crop did not find any statistically significant effect on the root production [37]. Thus, the impact on the root system may be affected, apart from the way it is applied to the soil, by the origin and properties of the biochar.
The root-shoot ratio was also evaluated. In general, changes in the root-to-shoot ratio depend on several factors. Thus, root-to-shoot ratio increases with nutrient deficiency, moisture stress, elevated concentrations of organic or inorganic (potentially toxic metals) compounds with toxic effect, or under elevated CO2, but decreases in strong light [38,39,40]. GH400 treatment showed the highest root-to-shoot ratio, which differed significantly with respect to the rest of the treatments. According to the results, the increase in root-to-shoot ratio in GH400 treatment was not caused by a toxic effect of metals. A nutrient deficiency was also discarded in this treatment based on the measurements of chlorophyll fluorescence and leaf SPAD that did not show any differences between treatments. A possible effect of elevated CO2 concentration and changes in light was also discarded since the experiment was fully randomised. Thus, an increase in the root-to-shoot ratio would indicate that plant was probably growing under less favourable conditions due to lower water availability.
Statistically significant interactions were found between plant growth characteristics and biochar characteristics indicating that growth responses were dependent upon biochar properties. Thus, WHC of biochars were strongly correlated to several growth characteristics according to Pearson’s correlations: biomass (r = −0.48; p < 0.01); shoot system (r = −0.56; p < 0.01); root-to-shoot ratio (r = −0.66; p < 0.01). These findings suggest that water in GH400 pots were less accessible by plants. Wu et al. [41] observed that, to diminish consumption and increase absorption of water, plants in dry conditions often decrease their growth rate and biomass production, and contribute more biomass to roots, so that they could maintain a higher root-to-shoot ratio. In addition, a net increase in root growth and an increase in the root-to-shoot ratio by plants growing in conditions of low water availability may therefore be interpreted as an important adaptive feature [42].
Previous works also reported that changes in the WHC and bulk density of the soil, caused by biochar addition, could affect root hair and pore-water dynamics that are difficult to measure [43]. The impact on the root system may be affected by the origin and properties of the biochar, but is unclear. Lehmann et al. [44] showed an increase in the root-to-shoot ratio while other pot studies recorded mostly reductions in root-to-shoot ratios [39].
The optimum nutritional status of lettuces during the growth experiment was indirectly corroborated by measurements of chlorophyll fluorescence and leaf SPAD at Day 52. The fluorescence parameter Fv/Fm, which decreases when plants experience stress [20], did not show significant differences between treatments. In addition, leaf SPAD values did not show any significant differences during the growth. These results confirmed the observation made where all treatments had a healthy green leaf colour independent of the type of biochar applied.
3.5.3. Effect of Biochar Types on N Use Efficiency
The N concentration in the shoot biomass, the N uptake by the shoot system and the NUE are shown in Table 4. Total N content in the shoot system was affected by biochar type. GH400 increased the N concentration, while OC400 decreased the N concentration. The different behaviour of the biochars was caused by a mass concentration effect related to the amount of shoot biomass in each treatment. Thus, through N uptake by the plant, this effect was corrected and no significant differences were found between treatments.
The NUE represent the N uptake with respect to the applied N. All biochars had a similar behaviour and there were no significant differences in NUE with respect to the control. However, there were significant differences between biochars. GH400 showed the lowest (63.1%), whereas PC400 showed the highest (75.0%) NUE values. In the case of GH400, the low NUE could be due to the lower water availability in the soil, reducing N absorption by the plant. On the other hand, the higher NUE in PC400 treatment could be due to a high mineral content in the soil added with this biochar, which could contribute to the fertilisation of the plant.
3.5.4. Potentially Toxic Metals in the Plant Shoot System
The uptake of the most important potentially toxic metals (Cd, Cr, Ni and Pb) by lettuces was measured in the different biochar treatments (Table 5). In general, the amounts of metals in lettuce were found to be very low. However, the amount of metals absorbed by the lettuces was higher than expected from the DTPA-extractable data at the end of the incubations. Thus, the crop was able to extract higher amounts from the biochars and from the soil than predicted from the DTPA analysis.
Table 5.
Metal concentration in plant shoot at the harvest of lettuce crop (wet weight).
The Cr levels did not show significant differences in DTPA-extracted in plant, even though the Cr concentration showed a two-fold increase in CM400 lettuces, which was in accordance to the high levels of this metal in the biochar. On the contrary, the concentrations of Pb did not show differences among treatments despite the high DTPA-extractable Pb in CM400 biochar, but the results are in agreement with the evolution of the DTPA-extractable concentrations observed during the incubation (Figure S7). The Ni extracted by lettuces was low, but slightly higher in O400 treatment, which was probably due to the levels of Ni in the original biochar (possible contamination during the pyrolysis process by the use of Ni-Cr steel in construction of pyrolysis reactors [45]).
Maximum levels for Cd and Pb in fresh vegetable established by the EU legislation are 0.05 and 0.30 mg kg−1 of plant (wet weight), respectively [46,47]. Thus, Cd levels, which were below the detection limit (0.02 mg kg−1), and Pb levels, which were detected in the rage from 0.07 to 0.16 mg kg−1 of plant (wet weight) were below the limits for leaf vegetables.
4. Conclusions
The agricultural recycling of a range of urban and agricultural wastes as feedstock for the production of biochar was assessed in this study. All tested biochars exhibited favourable properties as soil amendments and no phytotoxic effects or negative impacts on soil nutrient dynamics were observed during the soil incubation experiments. The relative higher proportion of ashes in biochars prepared from pre-treated organic wastes, compared to raw lignocellulosic wastes, was the main factor controlling their impact on soil nutrient cycles. The presence of ashes in biochars caused an increase in the availability of N and P in soil, but the ashes can also represent a source of potentially toxic compounds. The uptake of metals was low despite the content of these elements in biochars. The agricultural use of the biochars included in this study is only limited by the presence of potentially toxic metals in some of the biochars prepared from feedstocks of urban origins.
Supplementary Materials
The following are available online at http://www.mdpi.com/2071-1050/10/6/2077/s1, Figure S1: Concentration of DTPA-extractable Fe in soil during the incubation, Figure S2: Concentration of DTPA-extractable Cu in soil during the incubation, Figure S3: Concentration of DTPA-extractable Mn in soil during the incubation, Figure S4: Concentration of DTPA-extractable Zn in soil during the incubation, Figure S5: Concentration of DTPA-extractable B in soil during the incubation, Figure S6: Concentrations of DTPA-extractable Ni in soil during the incubation, Figure S7: Concentration of DTPA-extractable Pb in soil during the incubation, Table S1: Percentage of DTPA-extractable micronutrients (Fe, Cu, Mn, Zn and B) with respect to total concentration in biochars, Table S2: Percentage of DTPA-extractable heavy metals (Cd, Cr, Ni and Pb) with respect to the total concentration in biochars.
Author Contributions
Conceptualisation, M.L.C. and M.S.M.; Methodology, I.L.C. and M.S.G.; Validation, I.L.C. and M.L.C.; Investigation, I.L.C. and M.S.G.; Data Curation, I.L.C.; Writing—Original Draft Preparation, I.L.C.; Writing—Review and Editing, M.L.C. and M.S.M.; Supervision, M.L.C. and M.S.M.; Project Administration, M.S.M.; Funding Acquisition, M.L.C. and M.S.M.
Funding
This research was funded by 7th Framework Programme of RTD (grant number 289853) and by Fundación Séneca (Agencia Regional de Ciencia y Tecnología de la Region de Murcia) (grant number 19281/PI/14).
Acknowledgments
This study was performed under the framework of the EU project FP7 KBBE.2011.1.2–02 FERTIPLUS co-funded by the European Commission, Directorate General for Research & Innovation, within the 7th Framework Programme of RTD, Theme 2-Biotechnologies, Agriculture & Food and the regional project 19281/PI/14 by Fundación Séneca (Spain). Proininso (Spain) and ECN (Energy research Centre of the Netherlands) are gratefully acknowledged for providing biochar samples under the framework of EU project FERTPLUS. M.L. Cayuela was supported by a Ramón y Cajal contract by the Spanish Ministry of Economy and Competitiveness.
Conflicts of Interest
The authors declare no conflict of interest.
References
- European Commission. Proposal for a Directive of the European Parliament and of the Council amending Directive 2008/98/EC on Waste Brussels; European Commission: Brussels, Belgium, 2015; p. 25. [Google Scholar]
- Spokas, K.A. Review of the stability of biochar in soils: Predictability of O:C molar ratios. Carbon Manag. 2010, 1, 289–303. [Google Scholar] [CrossRef]
- Glaser, B.; Lehmann, J.; Zech, W. Ameliorating physical and chemical properties of highly weathered soils in the tropics with charcoal—A review. Biol. Fertil. Soils 2002, 35, 219–230. [Google Scholar] [CrossRef]
- Ippolito, J.A.; Stromberger, M.E.; Lentz, R.D.; Dungan, R.S. Hardwood biochar influences calcareous soil physicochemical and microbiological status. J. Environ. Qual. 2014, 43, 681–689. [Google Scholar] [CrossRef] [PubMed]
- Ippolito, J.A.; Stromberger, M.E.; Lentz, R.D.; Dungan, R.S. Hardwood biochar and manure co-application to a calcareous soil. Chemosphere 2016, 142, 84–91. [Google Scholar] [CrossRef] [PubMed]
- DeLuca, T.H.; Gundale, M.J.; MacKenzie, M.D.; Jones, D.L. Biochar effects on soil nutrient transformations. In Biochar for Environmental Management: Science, Technology and Implementation, 2nd ed.; Lehmann, J., Joseph, S., Eds.; EartScan: New York, NY, USA, 2015; pp. 543–562. ISBN 978-0-415-70415-1. [Google Scholar]
- Taghizadeh-Toosi, A.; Clough, T.J.; Sherlock, R.R.; Condron, L.M. Biochar adsorbed ammonia is bioavailable. Plant Soil 2012, 350, 57–69. [Google Scholar] [CrossRef]
- Park, J.H.; Choppala, G.K.; Bolan, N.S.; Chung, J.W.; Chuasavathi, T. Biochar reduces the bioavailability and phytotoxicity of heavy metals. Plant Soil 2011, 348, 439–451. [Google Scholar] [CrossRef]
- Jeffery, S.; Verheijen, F.G.A.; van der Velde, M.; Bastos, A.C. A quantitative review of the effects of biochar application to soils on crop productivity using meta-analysis. Agric. Ecosyst. Environ. 2011, 144, 175–187. [Google Scholar] [CrossRef]
- Biederman, L.A.; Harpole, W.S. Biochar and its effects on plant productivity and nutrient cycling: A meta-analysis. GCB Bioenergy 2013, 5, 202–214. [Google Scholar] [CrossRef]
- Enders, A.; Hanley, K.; Whitman, T.; Joseph, S.; Lehmann, J. Characterization of biochars to evaluate recalcitrance and agronomic performance. Bioresour. Technol. 2012, 114, 644–653. [Google Scholar] [CrossRef] [PubMed]
- Gunes, A.; Inal, A.; Sahin, O.; Taskin, M.B.; Atakol, O.; Yilmaz, N. Variations in mineral element concentrations of poultry manure biochar obtained at different pyrolysis temperatures, and their effects on crop growth and mineral nutrition. Soil Use Manag. 2015, 31, 429–437. [Google Scholar] [CrossRef]
- Fornes, F.; Belda, R.M.; Lidón, A. Analysis of two biochars and one hydrochar from different feedstock: Focus set on environmental, nutritional and horticultural considerations. J. Clean. Prod. 2015, 86, 40–48. [Google Scholar] [CrossRef]
- Meyer-Kohlstock, D.; Schmitz, T.; Kraft, E. Organic waste for compost and biochar in the EU: Mobilizing the potential. Resources 2015, 4, 457–475. [Google Scholar] [CrossRef]
- Mandal, S.; Thangarajan, R.; Bolan, N.S.; Sarkar, B.; Khan, N.; Ok, Y.S.; Naidu, R. Biochar-induced concomitant decrease in ammonia volatilization and increase in nitrogen use efficiency by wheat. Chemosphere 2016, 142, 120–127. [Google Scholar] [CrossRef] [PubMed]
- Olmo, M.; Villar, R.; Salazar, P.; Alburquerque, J.A. Changes in soil nutrient availability explain biochar’s impact on wheat root development. Plant Soil 2016, 399, 333–343. [Google Scholar] [CrossRef]
- Wrb, I.W.G. World Reference Base for Soil Resources, Update 2015, No. 106 ed.; World Soil Resources Reports; FAO: Rome, Italy, 2014; p. 203. ISBN 978-9-25-108369-7. [Google Scholar]
- López-Cano, I.; Cayuela, M.L.; Sánchez-Monedero, M.A. Suitability of different agricultural and urban organic wastes as feedstocks for the production of biochar—Part 1. Physicochemical characterisation. Sustainability 2018. under revision. [Google Scholar]
- López, L.; Betrán, J.; Ramos, Á.; López, H.; López, P.; Bermejo, J.L.; Urbano, P.; Piñeiro, J.; Castro, J.; Blázquez, R.; et al. Parte II: Abonado de los principales cultivos en España. In Guía Práctica de la Fertilización Racional de Los Cultivos en España; Ministerio de Medio Ambiente y Medio Rural y Marino: Gobierno de España, Spain, 2010; pp. 123–259. ISBN 978-8-44-910997-3. [Google Scholar]
- Maxwell, K.; Johnson, G.N. Chlorophyll fluorescence—A practical guide. J. Exp. Bot. 2000, 51, 659–668. [Google Scholar] [CrossRef] [PubMed]
- Sommer, S.G.; Kjellerup, V.; Kristjansen, O. Determination of total ammonium nitrogen in pig and cattle slurry: Sample preparation and analysis. Acta Agric. Scand. B Plant Soil Sci. 1992, 42, 146–151. [Google Scholar] [CrossRef]
- Kuo, S. Phosphorus. In Methods of Soil Analysis Part 3—Chemical Methods; Sparks, D.L., Page, A.L., Helmke, P.A., Loeppert, R.H., Eds.; Soil Science Society of America, American Society of Agronomy: Madison, WI, USA, 1996; pp. 869–919. ISBN 978-0-89-118825-4. [Google Scholar]
- Lindsay, W.L.; Norvell, W.A. Development of a DTPA soil test for zinc, iron, manganese, and copper. Soil Sci. Soc. Am. J. 1978, 42, 421–428. [Google Scholar] [CrossRef]
- Zucconi, F.; Pera, A.; Forte, M.; De Bertoldi, M. Evaluating toxicity of immature compost. Biocycle 1981, 22, 54–57. [Google Scholar]
- Tammeorg, P.; Brandstaka, T.; Simojoki, A.; Helenius, J. Nitrogen mineralisation dynamics of meat bone meal and cattle manure as affected by the application of softwood chip biochar in soil. Earth Environ. Sci. Trans. R. Soc. Edinburgh 2012, 103, 19–30. [Google Scholar] [CrossRef]
- Moll, R.H.; Kamprath, E.J.; Jackson, W.A. Analysis and interpretation of factors which contribute to efficiency of nitrogen utilization. Agron. J. 1982, 74, 562–564. [Google Scholar] [CrossRef]
- Singh, B.P.; Hatton, B.J.; Singh, B.; Cowie, A.L.; Kathuria, A. Influence of biochars on nitrous oxide emission and nitrogen leaching from two contrasting soils. J. Environ. Qual. 2010, 39, 1224–1235. [Google Scholar] [CrossRef] [PubMed]
- Steiner, C.; Glaser, B.; Geraldes Teixeira, W.; Lehmann, J.; Blum, W.E.; Zech, W. Nitrogen retention and plant uptake on a highly weathered central Amazonian Ferralsol amended with compost and charcoal. J. Plant Nutr. Soil Sci. 2008, 171, 893–899. [Google Scholar] [CrossRef]
- Bruun, E.W.; Ambus, P.; Egsgaard, H.; Hauggaard-Nielsen, H. Effects of slow and fast pyrolysis biochar on soil C and N turnover dynamics. Soil Biol. Biochem. 2012, 46, 73–79. [Google Scholar] [CrossRef]
- MacDonald, G.K.; Bennett, E.M.; Potter, P.A.; Ramankutty, N. Agronomic phosphorus imbalances across the world’s croplands. Proc. Natl. Acad. Sci. USA 2011, 108, 3086–3091. [Google Scholar] [CrossRef] [PubMed]
- Sharpley, A.; Moyer, B. Phosphorus forms in manure and compost and their release during simulated rainfall. J. Environ. Qual. 2000, 29, 1462–1469. [Google Scholar] [CrossRef]
- Wang, T.; Camps-Arbestain, M.; Hedley, M.; Bishop, P. Predicting phosphorus bioavailability from high-ash biochars. Plant Soil 2012, 357, 173–187. [Google Scholar] [CrossRef]
- Knicker, H. How does fire affect the nature and stability of soil organic nitrogen and carbon? A review. Biogeochemistry 2007, 85, 91–118. [Google Scholar] [CrossRef]
- Goldberg, S.; Forster, H.S. Boron sorption on calcareous soils and reference calcites. Soil Sci. 1991, 152, 304–310. [Google Scholar] [CrossRef]
- European Biochar Foundation (EBC). European Biochar Certificate—Guidelines for a Sustainable Production of Biochar, Version 6.1 ed.; European Biochar Foundation (EBC): Arbaz, Switzerland, 2018. [Google Scholar]
- Munzuroglu, O.; Geckil, H. Effects of metals on seed germination, root elongation, and coleoptile and hypocotyl growth in Triticum aestivum and Cucumis sativus. Arch. Environ. Contam. Toxicol. 2002, 43, 203–213. [Google Scholar] [CrossRef] [PubMed]
- Alburquerque, J.A.; Calero, J.M.; Barrón, V.; Torrent, J.; del Campillo, M.C.; Gallardo, A.; Villar, R. Effects of biochars produced from different feedstocks on soil properties and sunflower growth. J. Plant Nutr. Soil Sci. 2014, 177, 16–25. [Google Scholar] [CrossRef]
- Atwell, B.J.; Kriedemann, P.E.; Turnbull, C.G.N. Plants in Action: Adaptation in Nature, Performance in Cultivation, 1st ed.; Macmillan Education Australia Pty Ltd.: Melbourne, Australia, 1999; p. 664. ISBN D 7329 4439 2. [Google Scholar]
- Lehmann, J.; Rillig, M.C.; Thies, J.; Masiello, C.A.; Hockaday, W.C.; Crowley, D. Biochar effects on soil biota—A review. Soil Biol. Biochem. 2011, 43, 1812–1836. [Google Scholar] [CrossRef]
- Wilson, J.B. A review of evidence on the control of shoot: Root ratio, in relation to models. Ann. Bot. Lond. 1988, 61, 433–449. [Google Scholar] [CrossRef]
- Wu, F.; Bao, W.; Li, F.; Wu, N. Effects of drought stress and N supply on the growth, biomass partitioning and water-use efficiency of Sophora davidii seedlings. Environ. Exp. Bot. 2008, 63, 248–255. [Google Scholar] [CrossRef]
- Sharp, R.E.; Davies, W.J. Solute regulation and growth by roots and shoots of water-stressed maize plants. Planta 1979, 147, 43–49. [Google Scholar] [CrossRef] [PubMed]
- Prendergast-Miller, M.T.; Duvall, M.; Sohi, S.P. Biochar-root interactions are mediated by biochar nutrient content and impacts on soil nutrient availability. Eur. J. Soil Sci. 2014, 65, 173–185. [Google Scholar] [CrossRef]
- Lehmann, J.; Kuzyakov, Y.; Pan, G.; Ok, Y.S. Biochars and the plant-soil interface. Plant Soil 2015, 395, 1–5. [Google Scholar] [CrossRef]
- Camps-Arbestain, M.; Amonette, J.E.; Singh, B.; Wang, T.; Schmidt, H.P. A biochar classification system and associated test methods. In Biochar for Environmental Management: Science, Technology and Implementation, 2nd ed.; Lehmann, J., Joseph, S., Eds.; Rouledge: New York, NY, USA, 2015; pp. 165–194. ISBN 978-0-41-570415-1. [Google Scholar]
- European Commission. Commision Regulation (EU) No 420/2011 of 29 April 2011 amending regulation (EC) No 1881/2006 setting maximum levels for certain contaminants in foodstuffs. Off. J. Eur. Union 2011, L111/113. Available online: https://www.fsai.ie/uploadedFiles/Reg420_2011.pdf (accessed on 19 May 2018).
- European Commission. Commision Regulation (EU) No 488/2014 of 12 May 2014 amending Regulation (EC) No 1881/2006 as regards maximum levels of cadmium in foodstuffs. Off. J. Eur. Union 2014, L138/175. Available online: https://www.fsai.ie/uploadedFiles/Reg488_2014.pdf (accessed on 19 May 2018).


© 2018 by the authors. Licensee MDPI, Basel, Switzerland. This article is an open access article distributed under the terms and conditions of the Creative Commons Attribution (CC BY) license (http://creativecommons.org/licenses/by/4.0/).